1. Plants and light signaling
Energy is transported through the air by electromagnetic waves. Microwaves, radio or television waves, X-rays, ultraviolet rays or visible light are examples of electromagnetic waves, which are characterized by having different frequencies and wavelengths. The electromagnetic spectrum represents different frequencies and wavelengths that are known under different names (microwave, radio waves, visible light, etc.).
Electromagnetic radiation has a dual nature; radiation propagates as waves, but they exchange energy as particles (photons). It was Albert Einstein who proposed in 1905 for the first time that light has both particle and wave nature.
A beam of light includes a set of particles, called photons. Photons corresponding to longer wavelengths (lower frequencies) carry less energy than photons from short wavelength areas.
Human eye captures visible light between 400 and 700 nanometer (nm) wavelength area, which corresponds approximately to the region of the spectrum that plants use for photosynthesis. Light between 400 and 700 nm is therefore referred to as PAR; photosynthetically active radiation. Sunlight has a continuous spectrum within and beyond the visible wavelengths.
Human eye transforms different wavelengths into colors in human brain. Short wavelengths close to 400 nm are perceived as blue color and longer wavelengths in the 600nm area are seen as red light. Human eye has the most sensitive region in the yellow-green wavelength area.
http://www.bibliotecahorticultura.com
2. Plant pigments, photoreceptors, and photosynthesis
Plants absorb the light spectrum in an almost similar range as the human eye, but unlike humans, they absorb best red and blue light.
One of the main molecules enabling plants to absorb light and use its energy to transform water and carbon dioxide into oxygen and complex organic molecules is called chlorophyll and the process is known as photosynthesis. Chlorophyll is a plant pigment found in the intracellular chloroplasts, they are green in color and are in fact responsible of the green coloration of leaves and stems. There are two main types of chlorophyll found in the higher plants; chlorophyll a and b, which differ from each other slightly by their light absorption curves. The small difference allows them to capture different wavelengths, catching more of the sunlight spectrum. Chlorophylls absorb mainly red and blue light and reflect green wavelengths, which is why we see plants green.
However, chlorophyll is not the only plant pigment; the so-called accessory pigments (carotenoids, xanthophylls, etc.) and phenolic substances (flavonoids, anthocyanins, flavones and flavonoids) capture wavelengths other than only red and blue. The accessory pigments are yellow, red and violet in color. These colors attract insects and birds, as well as help protect tissues from environmental stress, such as high light irradiation.
There are also other particles absorbing light; photoreceptors. The main photoreceptor groups are phytochromes, phototropins and cryptochromes. In addition, there is a specific photoreceptor for ultraviolet light; the UVR8. All photoreceptors capture light in different wavelength areas and are responsible of different responses in plants as described below:
Phototropins affect the location of the chloroplasts and the stomatal opening. They absorb blue light.
Cryptochromes capture external stimuli related to light and control the internal clock of plants. In addition, they are related to morphological responses, such as inhibition of stem elongation, expansion of cotyledons, production of anthocyanins and photoperiodic flowering. Cryptochromes absorb UVA (ultraviolet), blue, and green wavelengths.
Phytochromes are responsible for flowering induction and seed development. Phytochromes regulate stem elongation, leaf
http://www.bibliotecahorticultura.com
expansion, and "shade avoidance syndrome". The responses regulated by phytochromes are mediated by the ratio of surrounding red and far-red light, which affects the photostationary state of the phytochrome molecule.
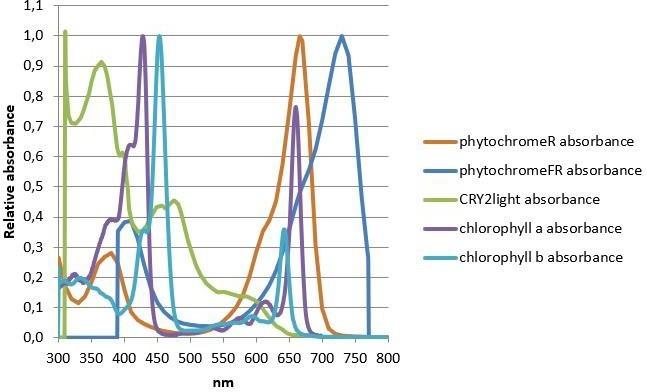
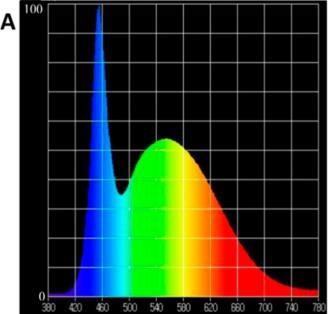
In addition to the photosynthesis process which provides energy for biomass production, flowering, seed development, and other functions such as germination, time of flowering and plant morphology are light dependent activities. These actions are highly related to the surrounding light quality from which the plant perceives signals of its environment. These responses are mediated by wavelengths within and beyond the PAR area, including also UV and far-red irradiation. The absorption curves for phytochromes, cryptochrome and chlorophylls are presented in Figure 1.
http://www.bibliotecahorticultura.com
3. Light quality
The quality of light is as important as the quantity of light.
The fact that plants cannot move and escape from bad growing conditions has resulted in a sophisticated sensor system to read ques from their environment through photoreceptors. Sensing the light environment through photoreceptors enable plants to flower in the correct time of the year when the conditions are suitable for the next generation’s survival. There are numerous environmental factors affecting plant development; light, temperature, humidity, water, nutrients, gravity, etc.; light being one of the most important ones as it provides energy to photosynthesis as well as information about the plant’s surroundings.
Photosynthesis is a series of processes driven by photons absorbed by the plant pigments. Photosynthesis is not very efficient since only 4-6% of the energy available in the radiation is converted into biomass. Photosynthesis can be intensified with elevated CO2 concentration, however an increase in photosynthesis rate does not translate into a linear increase in plant growth or yield increase. Plants control their own development so that they cannot grow indefinitely.
As said, photosynthesis is not the only determining factor when looking for good plant development, but other factors play a role as well. There is vital information for the plants both within and beyond the PAR area, including the UV-B, UV-A, (wavelengths between 280-380 nm) and far-red irradiation (wavelengths above 700 nm). The combination and ratios between different wavelengths is also important for plants; the blue to green ratio and especially the red to far-red ratio determine how fast or slow the plant grows and when it will start to flower. Wavelengths and the relationship between them provide information about the growth environment; for example, the changes in the R:FR ratio allow plant to detect the neighboring plants and activate the elongation of the stem, which allows it to grow pass the competition to better position to capture more light. Therefore,when discussing about plant lighting, it would be more informative to discuss the full spectrum of light rather than just the PAR range which does not cover the UV or far-red wavelengths.
http://www.bibliotecahorticultura.com
4. The colors of light
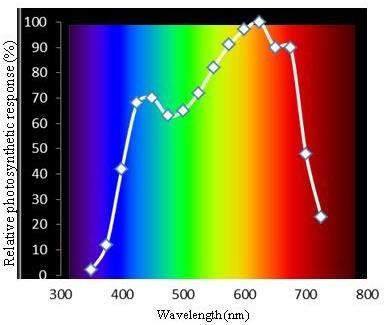
Plants respond to different wavelengths in the PAR range. McCree (1972) studied the spectrum used by plants, describing absorption peaks at different wavelengths and establishing the curve of the action spectrum of photosynthesis.
Within the spectrum of photosynthetically active radiation, McCree found that for all higher plant species (more than 20) that he studied, there were two broadly coincident highs in photosynthetic efficiency centered around 440 and 660 nm (Figure 2).
The definition of the colors of light is not universal. There are different definitions according to the standards that are used (ISO) or to the photobiologists who have studied the influence of light on plants. In the 8
http://www.bibliotecahorticultura.com
Technical article Cultivation/ Technology
following table you can see how the ISO standard (2007), Sellaro et. al. (2010) and Smith (1982) determine the different wavelength areas of light (Table 1).
Table 1. Equivalences of wavelengths
The effect of different wavelengths on plant growth and development:
Ultraviolet. UV-B light is captured by the UVR8 photoreceptor. A large dose is harmful to plants, since it degrades DNA. However, in small doses, both UV-B and UV-A increase the stress tolerance of plants. In general, plants grown under ultraviolet light have thick leaves and stems and short internodes.
Blue. Blue light is perceived by the blue light photoreceptors, phototropins and cryptochromes. Phototropins mediate stomatal regulation and plant movement towards light. Cryptochromes regulate many photomorphological responses, such as inhibition of stem elongation. Plants grown under high blue irradiation have short internodes, high dry matter content and low leaf temperature (efficient transpiration).
http://www.bibliotecahorticultura.com
Green. Green light is at least partially perceived by phototropins and cryptochromes (blue light receptors). Most green light is reflected or penetrated through the canopy. However, green light contains valuable information about the plant’s surroundings, guiding the growth accordingly. Plants grown under green light have long petioles internodes and high leaf temperature.
Red. Red light is perceived by phytochromes. Phytochromes absorb both red and far-red light and are the main regulators of the shade avoidance syndrome. Red light converts phytochromes to their inactive state, Pr, which has an absorption peak at 660 nm. The Pr form of phytochrome is synthesized in dark conditions or in far-red light conditions. When the Pr absorbs red light, it transforms to the far-red absorbing Pfr form, which has the absorption peak at 730 nm. The conversion from Pr to Pfr can be reversed with far-red light or darkness.
Far-red. Far-red light is absorbed by the phytochromes. Phytochromes absorb both red and far-red light and are the main regulators of the shade avoidance syndrome. High far-red irradiation causes premature flowering in many species, and elongation of stem and petioles.
http://www.bibliotecahorticultura.com
5. Phytochromes and photoperiod
Light plays a key role in plant development. Three distinct processes can be defined;
Phototropism; a blue light mediated response in which plants bend towards the blue light source.
Photoperiodism; partially regulated by the R:FR ratio and daylength. Different species react to photoperiod in a different way; short day plants require a long night in order to flower, for long-day plants the response is opposite.
Photomorphogenesis; refers to the different plant growth and developmental stages which are directly controlled by light, such as seed germination, seedling development and the transition from vegetative to generative phase.
The effect of day length on flowering is called photoperiodism. Plants respond to the differences in daylength (or night period). In nature photoperiod changes naturally according to the time of the year, which gives the plant the correct signal to flower for example in the fall (autumn type varieties) or in spring (spring type varieties).
Plants can be categorized into three groups according to their photoperiod characteristics; short-day plants, long-day plants, and day-neutral plants. Short-day plants require a long dark period (12h or longer) to induce flowering. Long-day plants on the other hand flower when the daylength is longer than the night period, often photoperiod of 16-18 hours is used for flowering induction for the long-day plants. Day-neutral plants flower regardless of photoperiod and often the flowering induction is related to plant size rather than a fixed photoperiod.
Among the short-day species are chrysanthemums, some strawberry types, beans, camellias, primroses and poinsettias. Among the long-day species are lettuces, spinaches, and other leafy greens. Among the neutral-day species are cucumbers or peas. In fact, plants do not measure the hours of light, but rather the hours of darkness. During the dark period, substances inhibiting the flowering induction accumulated in plant tissues during the light period are degraded, allowing the flowering induction.
http://www.bibliotecahorticultura.com
The process is complex, because other environmental factors, such as temperature or plant age, also play a role in the flowering induction of many species.
Short-day plants flower when days are short and dark period is long. However, if the dark period is broken with a short light period, the plant will perceive the dark period as two short nights rather than one continuous night and flowering is inhibited. On the other hand, long-day plants, which flower when days are long and nights are short can be induced to flower also in short day conditions if a night break treatment is given. The effect of photoperiod and light signals do not apply only for flowering induction, but also in the seed germination process.
The photoperiodical effects are regulated by phytochromes, a red- and farred-light-absorbing photoreceptor found in the higher plants. Phytochrome molecule has two forms; the red light absorbing Pr and the far-red absorbing Pfr form. The ratio between the Pr and Pfr forms is dependent on the surrounding light conditions, more precisely, the R:FR ratio. The Pr molecule has an absorption peak at 660 nm (red light). When the Pr absorbs red light, it is transformed into the far-red absorbing form (Pfr). The Pfr molecule absorbs light in the far-red area and has the absorption peak at 730 nm. The Pfr form is considered to be the active form of phytochrome, promoting flowering and germination.
In sunlight a balance between the Pr and Pfr forms is established. In dark conditions, the Pfr is decreasing in favor of Pr. A light interruption during the dark period causes the transformation of the Pfr molecules to the Pr form, which affects the flowering induction process.
In dense canopies, upper leaves absorb effectively red and blue light and the filtered and reflected light below canopy is rich in far-red and green wavelengths. In this type of growth environment, the R:FR ratio is low, which induces a set of reponses in plants, known as the “shade avoidance syndrome”. The shade avoidance syndrome symptoms include elongation of stem and leaves, premature flowering and less branching. More examples of shade avoidance syndrome symptoms are listed below:
Elongation of hypocotyl
Elongation of internodes
Less branching, greater apical dominance
Premature flowering
Longer petioles and leaves 12
http://www.bibliotecahorticultura.com
Narrowed leaf shape and smaller leaf area
6. Vernalization
In many species, photoperiod or R:FR ratio are not the only determining factors in flowering induction, but temperature plays a critical role as well. Temperature, especially the number of cold hours the plant senses, regulates the time of flowering of many species.
Some plants must go through a cold period prior to flowering. This phenomenon is called vernalization and it takes place in numerous herbaceous plants. For example, cereals which are sown in autumn sense the cold winter months and are ready to produce flower and seeds in the following spring and summer. The strength of the response is dependent on the length of the cold induction period as well as the temperature during the cold period.
Light, specifically, the light spectrum, influences also the vernalization process. It has been demonstrated that certain species or varieites require a shorter vernalization period in artificial growing conditions, if a light spectrum with low R:FR ratio has been given simultaneously. Long photoperiod together or right after the vernalization period have also been shown to fasten the time to flower.
http://www.bibliotecahorticultura.com
7. Artificial lighting for plant growth
A plant grow light is a source of artificial light which has been designed to grow plants in spaces where there is little or no natural light available or when the natural daylength is artificially extended.
Light for cultivation has traditionally tried to resemble sunlight in terms of the composition of the light spectrum, but it was not until the appearance of LEDs (Light Emitting Diode) that it was possible to produce customized spectra.
The most commonly used greenhouse lights, the high-pressure sodium (HPS) lamps, irradiate mainly in the yellow and red area of the visible spectrum, while fluorescent lights, which have traditionally been used in growth chambers have more blue light in their spectrum.
Artificial lighting applied to greenhouses has historically been linked to areas that receive few hours of sunshine during winter, or to the modification of the photoperiod to induce flowering of ornamental crops at times of the year in which they have greater commercial value.
The use of artificial light in horticultural applications results in better growth and larger yields due to photoperiod extension and increase in the daily light integral. Artificial light can also bring benefits to the growers via the manipulation of flowering induction by giving short/long day treatments or night interruption. In closed environments artificial light is of course the only supply of light for photosynthesis and plays therefore a more critical role than artificial light in greenhouse applications. The artificial light in horticulture allows a better growth by extending the photoperiod when there are only few hours of natural daylight available and thus increases the daily light integral. Artificial light is also used to control or inhibit flowering in longday/short-day treatments and can supply natural light in closed growth chambers.
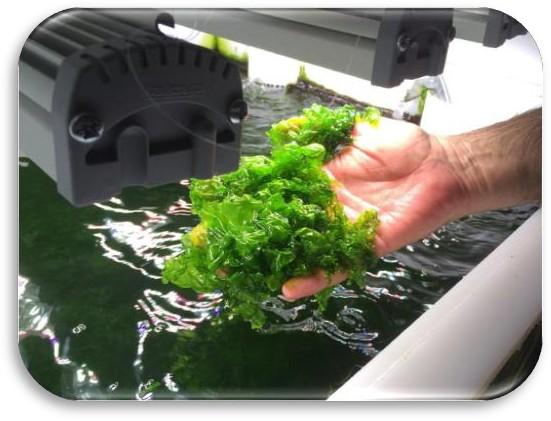
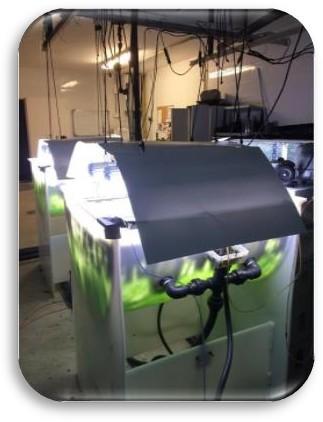
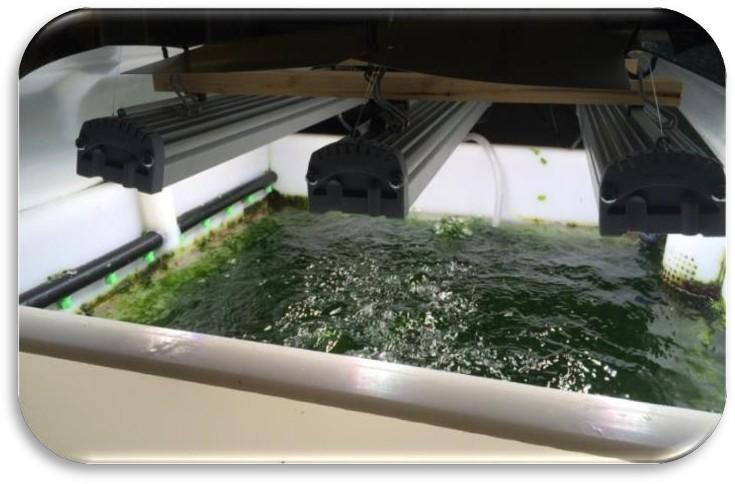
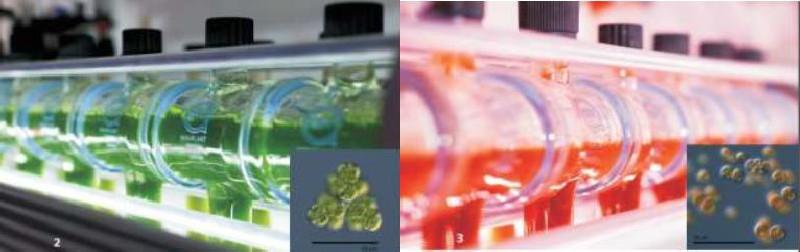
In recent years, great development has been made in lighting technology, including the reduction of operating costs thanks to the introduction of LEDs. LEDs have been introduced already into facilities which produce flowers, vegetables, fruits, grafted seedlings, microgreens, algae, and medicinal plants, etc. Due to its environmental and productive efficiency advantages,
http://www.bibliotecahorticultura.com
LED lighting has been described as the most revolutionary invention in horticultural lighting in recent decades.
In early 1966, Hardh suggested that the artificial lighting used for plants should adapt to the spectrum of photosynthetic function sensitivity, and in 1970 McCree offered a proposal for a generalized spectrum for photosynthesis action that we have seen in Figure 2. The parameters to be considered in artificial lighting are the light spectrum, light intensity, and photoperiod.
http://www.bibliotecahorticultura.com
8. How to measure light?
There are different ways to measure the intensity of light, but practically all of them have been developed to measure the light quality and quantity visible to human eye.
To measure the visible light that human perceives, Lumen or LUX units are used. However, these units do not give enough information about the spectrum which plants actually absorb, since it only measures the intensity of light in the middle part of the spectrum, concentrating on the green and yellow areas and excluding blue, UV and far-red areas. The same problem occurs with the radiometric measurements in Watts that are used to measure the warmth, which does not work either for people or for plants. Measuring light as photons in moles will give a reading which takes all wavelengths into consideration. Measuring wavelengths beyond the LUX area, or PAR area is necessary as we have already seen that each wavelength area has a specific function in plant development, thus the light measurements should always be taken as moles of photons rather than in LUX or Lumen units. The light intensity measurements should be accompanied by the specific light spectrum, measured with a spectrometer.
PAR radiation can also be measured as W/m2. However, the most important thing is to know how much light is actually reaching the canopy or the growth area in a certain wavelength range. If one measures the light intensity between the PAR range (400-700 nm), the light intensity hitting the plants can be recorded as PPFD; photosynthetic photon flux density. The PPFD value tells the number of photons in micromoles hitting a specific area (m2) in one second. PFFD unit is therefore µmol/m2/s.
http://www.bibliotecahorticultura.com
9. Development of a growth spectrum
Traditional lighting technologies, such as high-pressure sodium lights (HPS) or fluorescent lights, have traditionally been available with minimal choice of spectral variation. With the current LED technology, it is possible to create a custom-made spectrum, which could bring both energy savings and other benefits which were not previously possible with the old technology. By creating custom spectra, one can change the growing environment of the plant and enhance specific traits, such as photosynthesis efficiency, biomass production, or flowering. Thus, light can be used to obtain the desired characters in the plants and greatly improve the quality and productivity of the crops.
Most of the horticultural LED manufacturers offer a simple combination of red and blue LED chips in different ratios aiming to match the chlorophyll absorbance curves. But like we have seen, many pigments and photoreceptors in plants beside chlorophyll influence other, important, characteristics of plants, such as flowering, stem elongation, compactness, germination, etc. These responses cannot be manipulated by using only the two wavelength areas (red and blue). Therefore, having a continuous spectrum covering all wavelengths from the UV to the far-red offers more possibilities to the growers to manipulate their crop according to the grower’s needs and wishes.
In reality, a good growth result for one grower may not be the same for another grower. For example, a lettuce producer could rate the crop by the biomass, shelf life or flavor. On the other hand, a flowering plant in a lettuce production unit would be considered as a bad result. For a lettuce breeder, the situation is different; plant biomass and taste may not be rated as high as quick flowering induction in the breeding process. A rose grower would probably appreciate a plant with thick stem, long vase life, good coloration, and quick growth. Therefore, the artificial light applied should not be rated anymore from the electrical efficiency or price per Watt point of view, but also by the added value it can bring to the grower. In conclusion, the most important thing is not the maximization of photosynthesis, but the time and money put into producing high quality plants in short period of time.
Although there are many LED lamps on the market, the vast majority have not been designed exclusively for horticultural applications. The lamps that are marketed with different combinations of red, white or blue LED chips and possibly other narrow monochromatic peaks are based on components 17
http://www.bibliotecahorticultura.com
originally designed for the electronics industry. They are not optimized for plants, but they often have a slightly lower price compared to LEDs specifically designed for plant applications.
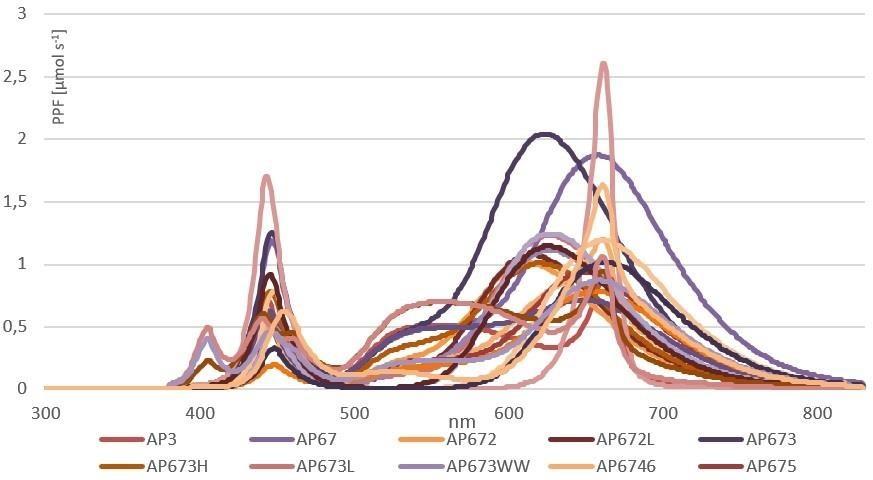
The approach for using only red and blue LEDs is based on matching the LED spectrum to the absorption curve of chlorophyll and that the good match would result in maximum photosynthesis and growth. However, as plants also have pigments which absorb wavelengths other than red and blue and the wavelengths beyond the PAR area can significantly affect the morphology and metabolism of plants, a light source that contains only blue and red is proven to be deficient. The development of a perfect growth spectrum takes a long time, and the results are based on experimental research. In Figure 3, a few spectra designed for different plant species and specific growth stages are presented.
http://www.bibliotecahorticultura.com
10. The effect of light spectrum on plant growth and metabolism
When the crop is illuminated with a customized spectrum targeted for the species and specific growth phase, the productivity rate can be increased. An experiment carried out in the University of Almeria compared the effect of light spectrum and light intensity on the growth and biomass accumulation of three different species; lettuce, tomato and pepper. Light spectra used in the experiment are presented in Figure 4 and data in Table 2. The data presented in Table 2 shows, that the biomass of lettuce, tomato, and pepper can be enhanced by using a spectrum developed for biomass production (T1) compared to a standard white LED spectrum (T0). If we compare the energy efficiency for each unit of energy, expressed in kW of electricity contributed, it can be concluded that a significantly higher production rate can be achieved with the spectrum type of treatment T1 compared to the standard white LED light treatment (T0). Plants grown under the vegetative growth spectrum, AP673L (T1) were significantly larger compared to plants grown under the generic white LEDs (T0), images of the lettuce and tomato plants at the end of the experiment is presented in Figure 5.
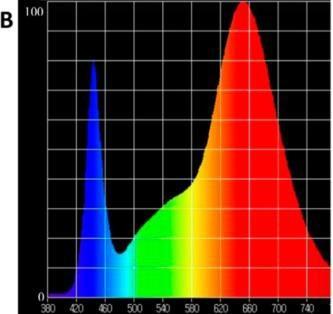
vegetative grwth specrtum used in the experiemtns (Valoya AP673L) (T1)
http://www.bibliotecahorticultura.com
Table 2 Comparison on the productivity in biomass (g/plant) of horticultural seedlings plants subjected trp different light intensities (low 52-85 μmol/m2.s or high 95-117 μmol /m2.s) under two different light spectra; T0 = a generic white LED, T1 = vegetative growth spectrum AP673L from Valoya Oy, Finland. Source: Urrestarazu et al. (2016). Effect of the spectral quality and intensity of light-emitting diodes on several horticultural crops. HortScience 51 (3): 268-271.
Table 3 Effect of light intensity and spectral composition on the energy efficiency (EE) of 4 seedlings (g dry weight per kW of electricity supplied). Source: Urrestarazu et al. (2016). Effect of the spectral quality and intensity of light-emitting diodes on several horticultural crops. HortScience 51 (3): 268271.
http://www.bibliotecahorticultura.com
21
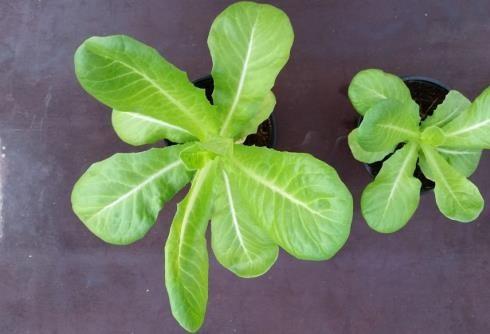
A B
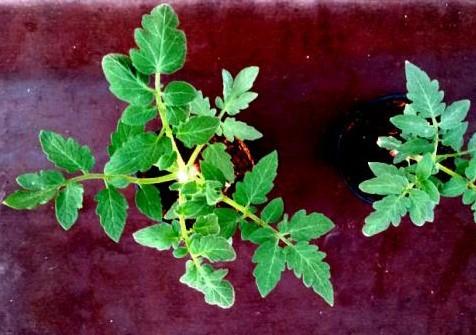
Figure 5 A. Lettuce plants, the left shows the grown plant with LED lighting adapting its spectrum to the best photosynthesis (T1) in comparison with the one in the right adapting to a standard LED light (T0).
B. Tomato seedling, showing the same result.
Different spectral compositions trigger different responses in plants. In Figure 6, it is demonstrated how the effect of light spectrum affects the development of Arabidopsis thaliana seedlings, and especially the effect of light spectrum on the flowering induction and floral part development.
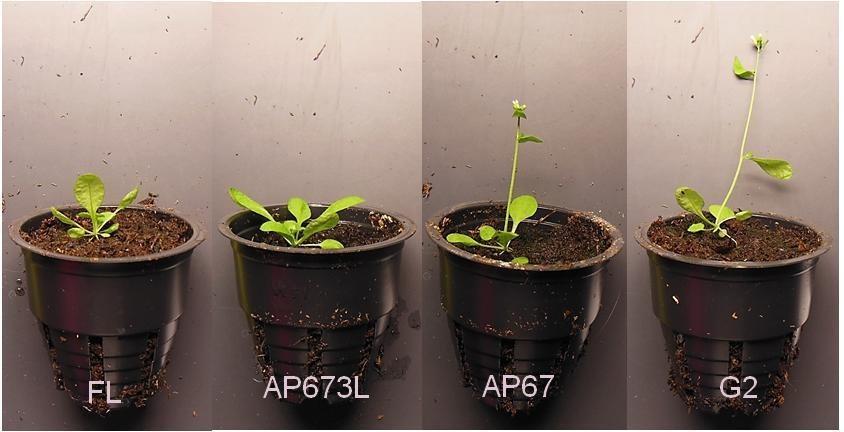
Figure 2 Arabidopsis plants grown under fluorescent light (FL), vegetative growth spectrum (AP673L), flowering spectrum (AP67) and a flower induction spectrum (G2). Spectra differ from each other by their R:FR and B:G ratios. All light treatments had a light intensity of 40 umol/m/s and photoperiod of 18 hours.
http://www.bibliotecahorticultura.com
Light intensity (μmol/m2.s) and spectrum can be adjusted according to the farmer’s wishes and aims. As we have already discussed, different crops have different characters that are considered good, also within plant species a good growth results differs according to the grower and end-user of the plant. The most commonly manipulated plant traits done with LEDs are flowering and biomass accumulation.
However, not only biomass and flowering can be regulated by modifying the light spectrum. Light quality also plays a critical role in plant metabolism, which affects the chemical composition of the leaves and therefore the inner quality of the plant. These compounds can be considered also beneficial for human health, such compounds are for example antioxidants found in many plant species. Some plant synthesized compounds can be used in the food, medicinal, or cosmetics industries.
On the other hand, not all compounds accumulated in plants are healthy for humans, for example in leafy greens the accumulation of nitrates is regulated by law and is something that the growers are trying to reduce in their end-products. The WHO has set certain limits for daily consumption of nitrates, limits have been set mainly for those crops which are known to accumulate nitrates easier, examples of such crops are lettuce, broccoli, spinach, and Swiss chard. As the plants listed above are a normal part human diet, the concern of increased nitrate consumption is justified. Many environmental factors affect the nitrate content in leaves, one of them being light. Light intensity as well as spectrum has been shown to affect the nitrate content in leafy green crops.
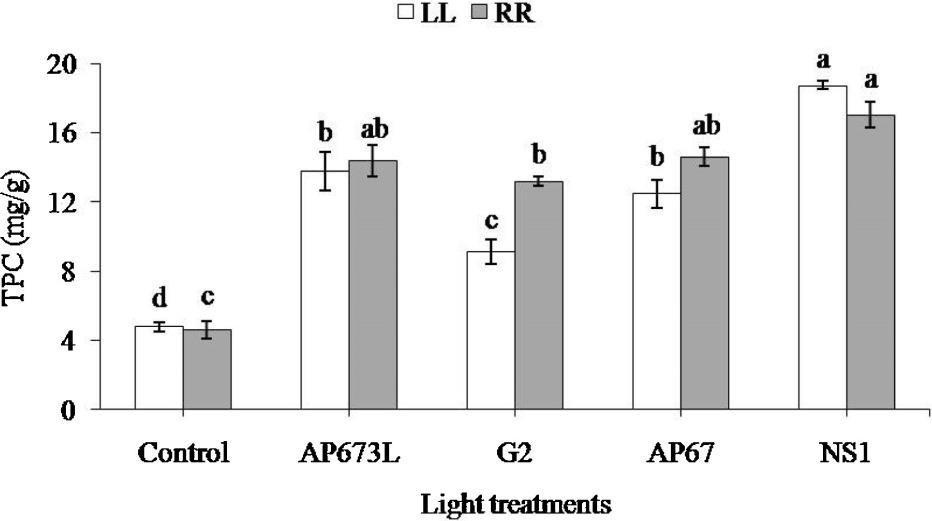
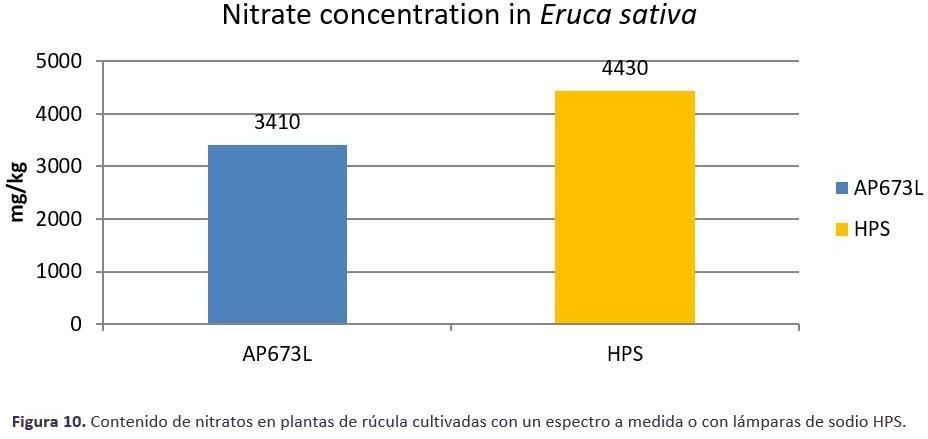
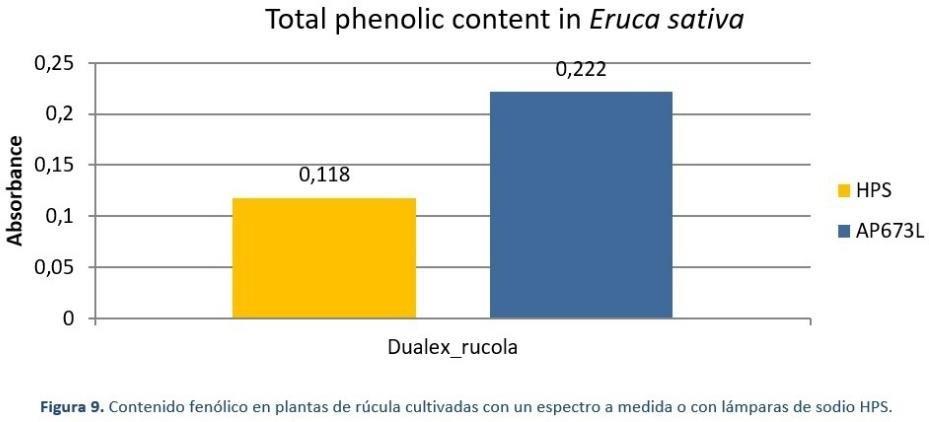
Rocket plants (Figure 7) grown under 125 μmol/m2.s (photoperiod 18 hours) under two different light sources, Valoya AP673L LED light source and a traditional High Pressure Sodium (HPS) light source, were measured by their fresh weight, leaf phenolic content, and leaf nitrate content at the end of the 28-day production cycle. Under the AP673L spectrum, the plants had 26% more fresh weight than plants grown under HPS light (Figure 8). The leaf total phenolic content, which is an indicator of taste and antioxidant compounds accumulated in the leaves was 88% higher under AP673L treatment compared to HPS treatment (Figure 10). As for the accumulation of nitrates in the leaves, rocket plants grown under HPS had a 30% higher nitrate content compared to the plants grown under the AP673L spectrum (Figure 9). As proven with the rocket experiment, the advantages in cultivation with tailored spectrum cannot only be rated by the increase in
http://www.bibliotecahorticultura.com
Technical article Cultivation/ Technology
biomass, but also the inner quality and nutritional values should be taken into consideration.
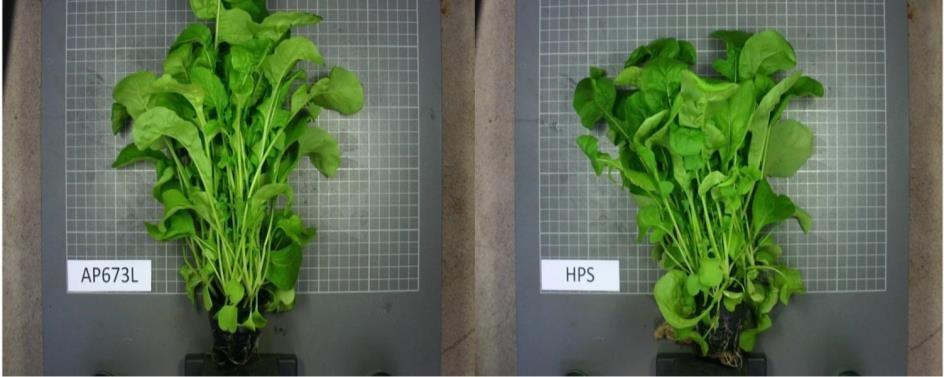
Figure 3 Rocket plants cultivated with customized spectra for biomass accumulation, AP673L, (left) and with HPS sodium lamps (right). Plants received 125 umol/m/s of light, photoperiod was set to 18h.
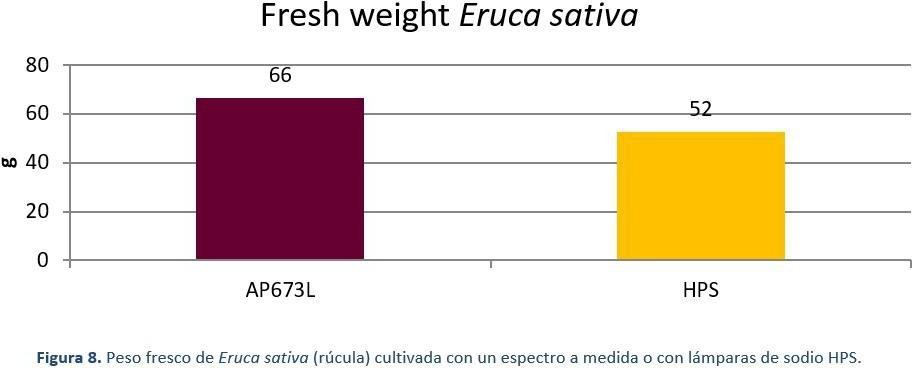
Figure 8 with HPS sodium lamps (right). Plants received 125 umol/m/s of light, photoperiod was set to 18h.
23
http://www.bibliotecahorticultura.com
Figure 9 Nitrate content (mg/kg in fresh biomass) in rocket leaves grown under a vegetative growth spectrum AP673L (blue bar) and HPS light source (yellow bar). Plants received 125 umol/m/s of light, photoperiod was set to 18h.
11. Applications of artificial lighting in agriculture
Figure 10 The total phenolic content measure in rocket leaves grown under HPS light source (yellow bar) and under a vegetative growth spectrum AP673L (blue bar). Plants received 125 umol/m/s of light, photoperiod was set to 18h.
As we have seen so far, LEDs with continuous spectra with all wavelengths and different ratios between wavelengths can be made. This provides tools to develop products that are not only energy efficient but also give the best possible growth performance. Light quality in controlled cultivation environment affects plant development, fresh weight accumulation, and crop quality of many horticultural crops and, therefore, can significantly affect the end-product’s market value. Below are listed several examples of applications in which artificial light can be used in controlled environments.
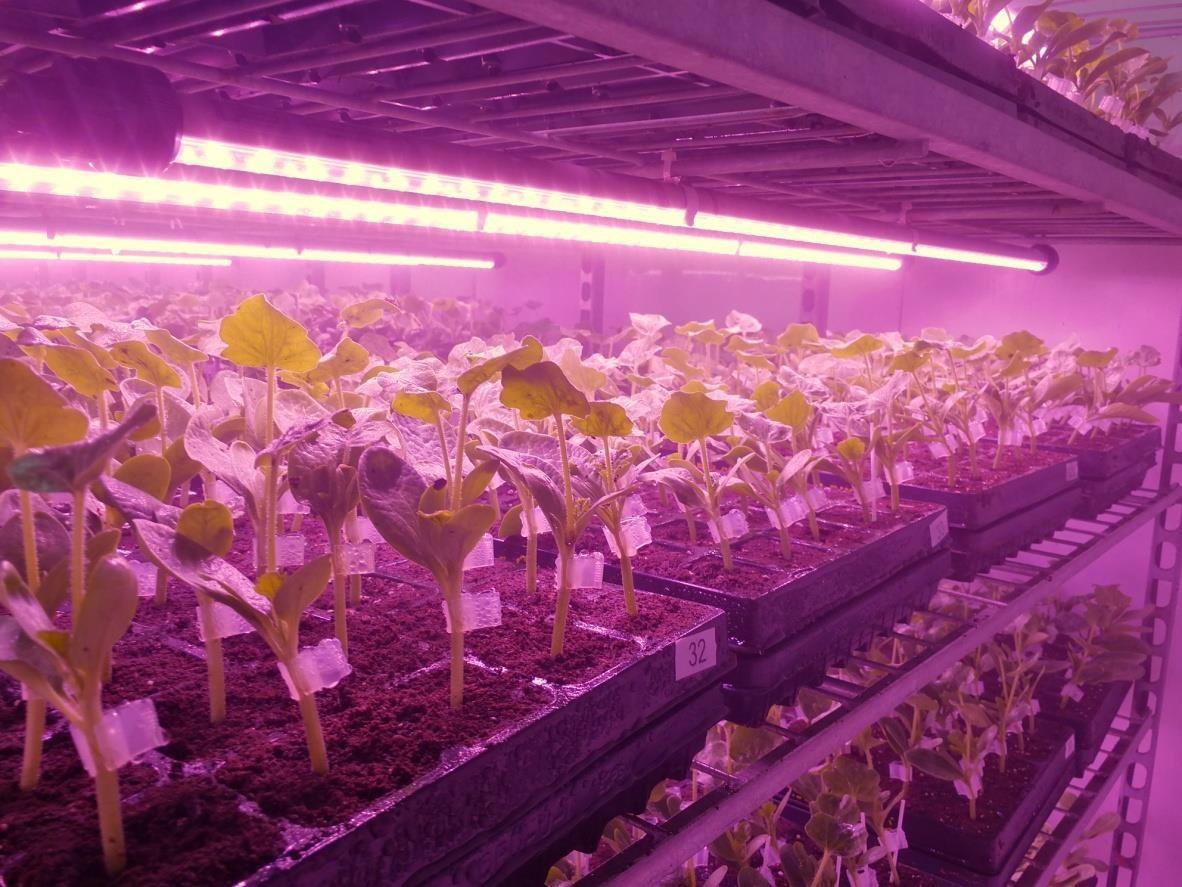
11.A Grafting of vegetable seedlings
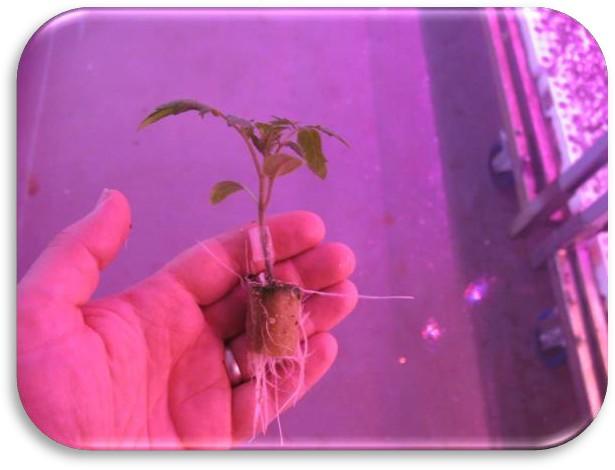
Grafting of vegetable seedlings is often done in closed growth chambers in which humidity, lighting and temperature can be carefully monitored and controlled (Figure 11). Grafting process of many horticultural species, such as tomatoes or cucumbers, can be divided into five parts:
1. Pre-growth of seedlings and selection of plants to be grafted
2. Grafting (cleft graft, splice graft)
3. Securing of graft union using clips or glue
4. Healing / Acclimating period
5. Planting of the grafted plant either in field or in greenhouse
http://www.bibliotecahorticultura.com
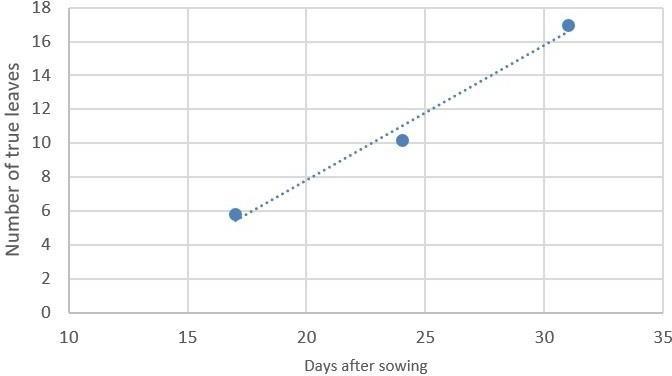
In the pre-grafted period, high light intensities (200 μmol/m2.s) are recommended to shorten the cultivation time in no-natural light environment. For example, in experiments conducted by the Plant R&D department of Valoya with AP673L spectrum, tomato seedlings reached 6 true leaves in 20 days at 100 μmol/m2.s when at 200 μmol/m2.s the time was shortened to 17 days (Figure 12).
A) Number of leaves in tomato plants grown under 100 μmol/m2.s
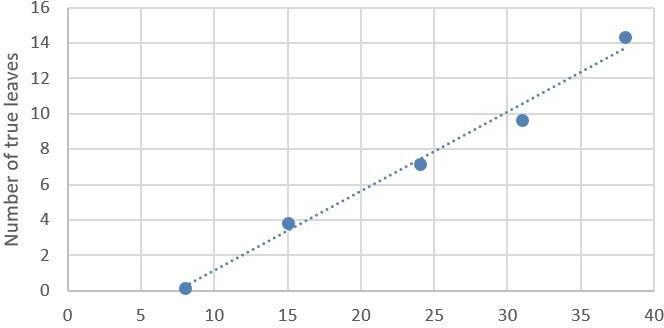
B) Number of leaves in tomato plants grown under 200 µmol/m2.s
http://www.bibliotecahorticultura.com
Figure 2. Number of true leaves in tomato seedlings grown with Valoya AP673L A) 100μmol/m2.s and B) 200 μmol/m2.s. Photoperiod 18 hours, temperature 22ºC night / 25ºC day.
After the graft has been made, total darkness is recommended for the first 24-48 hours, after which artificial lighting is turned on. Light intensity of 100 μmol/m2.s or below is sufficient during the healing process. The intensity is relatively low, but it is only to maintain sufficient plant metabolism but not to obtain high accumulation of biomass. The healing period after grafting is the most critical point in the process and thus climatic conditions must be optimized carefully. A high relative humidity (95% or more) is recommended, relative humidity can then be lowered towards the end of the healing period. The grafted seedlings enjoy warm temperatures, often close to 28-29° which is slightly higher than the temperature prior grafting (25°C). The high temperatures improve the cell division and the development of the callus between the stem and the rootstock. These conditions must be applied for 4-6 days for tomatoes and 7 days for cucurbits. The treatment is carried out in a greenhouse or in a growth chamber with optimum conditions regarding humidity, temperature, and lighting.
In summary, there are two critical phases in which a correct illumination will guarantee the best grafting result:
Cultivation of the scions and rootstocks; cultivation is usually carried out in a greenhouse with light intensity addition between 60-200 μmol/m2.s, depending on the location of the greenhouse with LED lights of the AP673L spectrum targeted for high vegetative growth.
Healing period, which is usually carried out in a growth chamber with relatively low light intensities varying between 40 and 100 μmol/m2.s and a high relative humidity; with a LED spectrum (AP673L) proven to work well during healing period, a general light intensity recommendation is 50 μmol/m2.s for tomato and 80 μmol/m2.s for watermelon.
11.B Seed production
In seed production process, the breeder aims to have quick generation cycles with short period of time from sowing to collecting new seeds. The number of flowers, pollination success rate and the number of seeds and the quality of the seeds are all important factors for a breeder.
http://www.bibliotecahorticultura.com
The flowering induction is dependent on the plant species and different environmental factors, including the light signals that the plant receives, the length of the photoperiod, the day and night temperatures and the age of the plant.
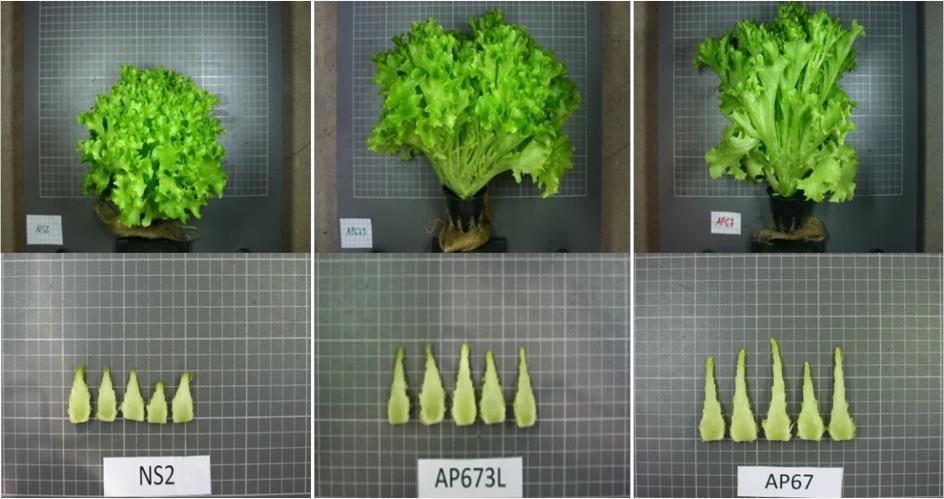
The main light signals plant receives from the surrounding light spectrum are the amount of far-red light, and the ratio between red and far-red. By modifying the spectrum, it is possible to either promote or delay the flower induction (Figure 13). By delaying the flowering induction, the plant stays in the vegetative phase longer which will result in bigger and higher biomass plants. My modifying the plant shape, size, developmental stage and inner quality, we can affect the profits the grower will get from the plants. A low red to far-red ratio results in lowered ratio of Pfr:P (active phytochromes to total phytochromes) in the leaves, which means that the active form of phytochromes (Pfr) decreases and causes responses such as elongation of stem, leaves and petioles, and promoted flowering induction, allowing to shorten the generative cycles and accelerate breeding programs.
The HPS lights commonly used in greenhouses have only a little bit of blue and far-red light, making the spectrum unsuitable for many species. However, it is possible to adjust a LED spectrum so that it complements the parts that are missing from the HPS lamps, resulting in a more balanced spectrum and better growth results.
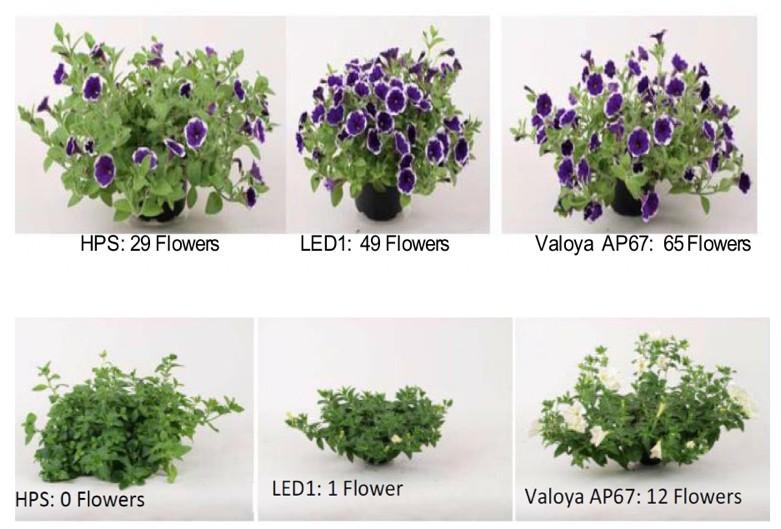
by changing the
presented how effect of three different
In the top pictures the whole plant has been pictured, in the lower pictures leaves have been removed and the floral stem has been cut to half to demonstrate the effect of the light spectrum on elongation and flowering development. All plants have received the same amount of light (125 μmol/m2.s) with a photoperiod of 18 hours.
27 http://www.bibliotecahorticultura.com
11.C Vertical Farms (Vertical farming)
The basic concept of a multilayer plant production site is to produce a high number of plants in a small area, thus optimizing the investment of the equipment and space available by growing plants on shelves in layers. As each layer shades the lower layer, it is necessary to place lamps on each shelf, which makes this growing system possible only if artificial light is introduced to the system.
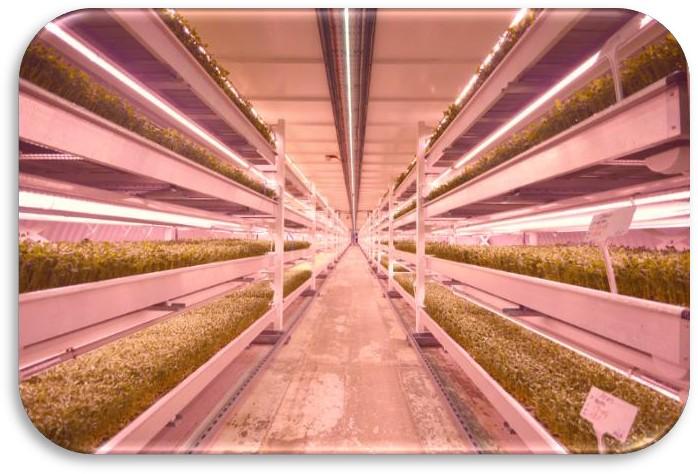
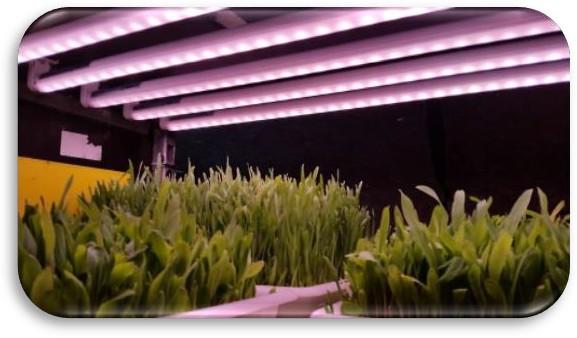
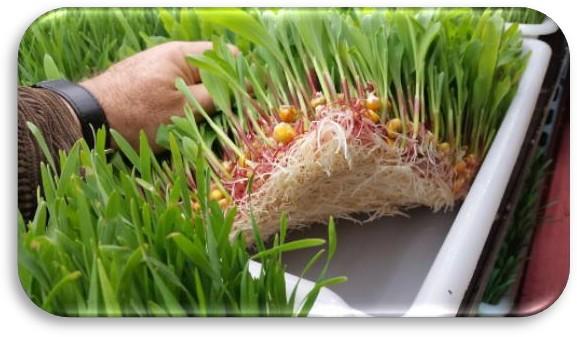
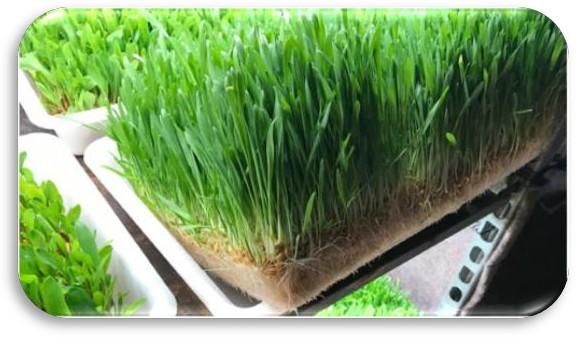
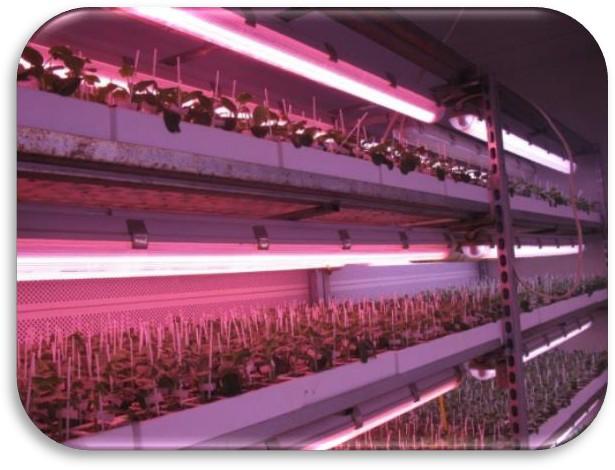
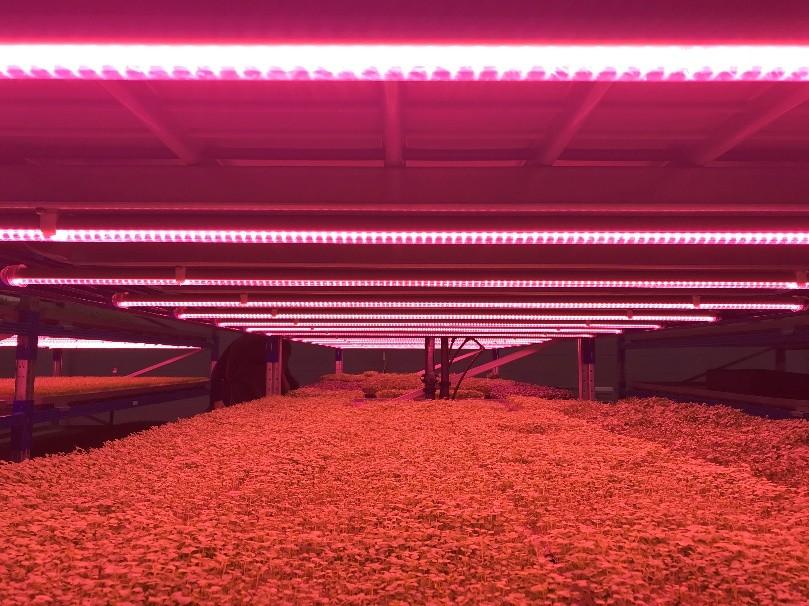
The vertical farms have been introduced recently to places where natural light is scarce or there is no available cultivation area, like big cities. Currently vertical farms are considered a viable alternative for greenhouse cultivation supplying urban areas. The most cultivated crops found in vertical farms are lettuce, aromatic plants, and culinary condiments, the so-called microgreens, sprouts, and the so-called baby vegetables. An example of a vertical farm in London is presented in Figures 14 and 15.
In vertical farms, artificial light is the only source of light and therefore the light intensity and spectrum play a bigger role than for example in a greenhouse. High light intensity requirement for certain crops creates a substantial amount of heat which must be cooled; the less heat is generated from the light source, the lower the cooling costs and better the
http://www.bibliotecahorticultura.com
environmental control are. Even though being small sized, the fluorescents are not the optimal solution for vertical farming, as they produce a lot of heat which then should be expensively cooled. Unlike the fluorescent technology, the LED technology allows lower heat dissipation by the lights, since the efficacy value of the LEDs is better compared to fluorescent light, meaning that higher portion of the energy input is converted into light rather than heat. However, since LEDs also dissipate some heat, it is advised to choose a LED lighting type with an optimized light spectrum so that lower light intensities can be used. When less light in total needs to be installed, it brings savings in hardware, installation, electricity, and cooling costs.

In addition to the correct light intensity and light spectrum, in vertical farms it is very important that the light distribution, or uniformity, in the shelves is as good as possible in order to guarantee a uniform production rate between and within shelves.
The first LEDs for horticultural market contained only red and blue LED chips, these types of spectra are still on the market and can be sold at relatively low price. Red and blue light do enhance photosynthesis, but they do not promote biomass accumulation since they are lacking all other
http://www.bibliotecahorticultura.com
wavelengths from the spectrum. In a vertical farm, it is very important that the yields are at a maximum level, therefore one should carefully select the best spectrum according to the cultivated plant species.
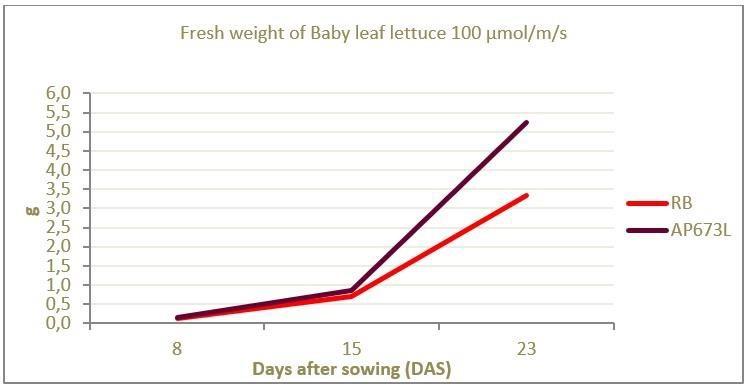
In an experiment carried out with baby leaf lettuce using 100 μmol/m2.s between a tailored spectrum (AP673L) and typical red and blue LED light source, an increase of 58% in biomass was observed in the plants grown under the tailored spectrum (Figure 16). In addition, it was noted that the plants grown under the continuous spectrum had a balanced growth performance; hypocotyls were not elongated, the number of leaves was greater compared to the RB light source and the leaf area of individual leaves was larger (Figure 17).
http://www.bibliotecahorticultura.com
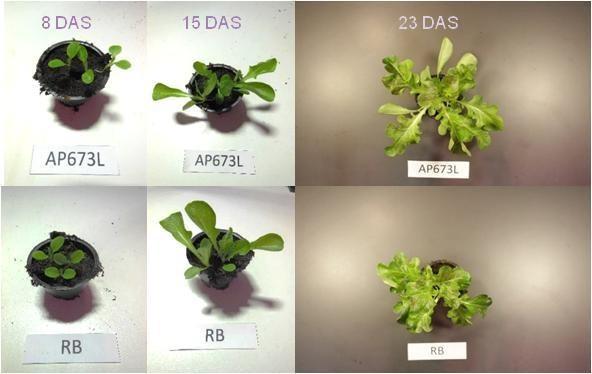
Figure 17. Images of baby lettuce grown at 100 μmol/m2.s between specific AP673L spectrum LEDs and red and blue LEDs.
http://www.bibliotecahorticultura.com
In addition to the optimum light spectrum, the light intensity affects the yield quality in vertical farms. Intensity requirements vary between the developmental stage of the plant. With light intensity the grower can also affect the length of the growth cycle, leaf coloration, total biomass, and dry matter content.
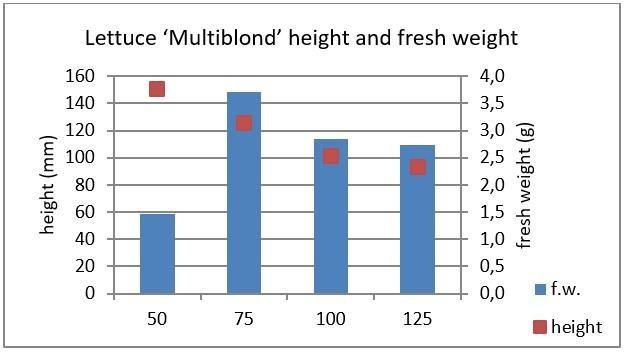
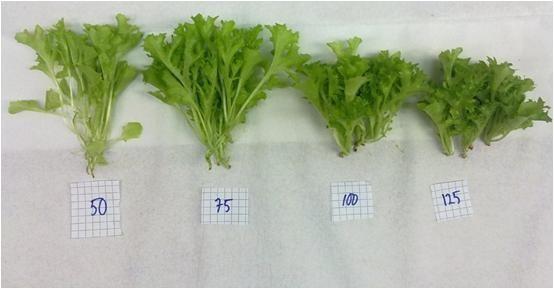
In figure 18, data from a trial conducted with lettuce variety ‘Multiblond’ grown under different intensities is presented. In this experiment the light spectrum for all treatments was the same, only the light intensity varied between 50 and 125 μmol/m2.s. The data shows that the higher the light intensity was, the more compact the plants were, and the lower the fresh weight was. However, fresh weight did not increase if light intensity was below 75 μmol/m2.s. A picture of the plants grown under the different light intensity treatments is presented in Figure 19.
http://www.bibliotecahorticultura.com