2023 AG INDUSTRY


2 | 2023 AG INDUSTRY INSIGHTS AND PERSPECTIVES 3 | Introduction 4 | U.S. Economy Impacts on Agriculture 9 | Farm Economy Considerations 12 | Dairy 15 | Forest Products 19 | Grain 23 | Poultry 2023 AG INDUSTRY
Horizon Farm Credit is dedicated to serving agricultural operations of all types across its 100-county footprint in Delaware, Maryland, Pennsylvania, Virginia and West Virginia. In addition to lending, Farm Credit strives to provide knowledge and expertise in agriculture to holistically serve its members. The following report was compiled by a team of Horizon Farm Credit staff, providing information for farmers to understand the dynamics in their industry and key factors influencing it.
2022 was a strong year for many in agriculture, however it was not without challenges. Inflation, interest rates, labor, fuel costs, supply chain
delays, and trade are just a few of the many factors impacting agriculture. Additionally, certain sectors of agriculture combatted other issues such as Highly Pathogenic Avian Influenza (HPAI) within the poultry industry and invasive pests in forest products and crops. While net farm incomes are expected to drop in 2023 as compared to the highs of 2022, agriculture in the mid-Atlantic region is expected to have another solid year.

Farm Credit has been serving agriculture and rural communities for more than 100 years and remains committed to supporting future generations of farmers across our territory. We’re more than just your lender; we’re your partner.
Disclaimer: The information in this document is a summary of select economic conditions and agricultural industries prepared by Horizon Farm Credit staff. This material is for informational purposes only and cannot be relied on to replace your own judgment or that of the professionals you work with in assessing the accuracy or relevance of the information to your own operations. The information provided in this report is not intended to be investment, tax or legal advice and should not be relied upon by recipients for such purposes. As with any economic analysis, the information is based upon assumptions, personal views and experiences of those who provided the source material as well as those who prepared this summary. These assumptions, conclusions and opinions may prove to be incomplete or incorrect. Economic conditions may also change at any time based on unforeseeable events. Horizon Farm Credit assumes no liability for the accuracy or completeness of the summary or of any of the source material upon which it is based. No commitment to lend, or provide any financial service, express or implied, is made by posting this information. In no event will Horizon Farm Credit be liable for any decision made or actions taken by any person or persons relying on the information contained in this report.
2023 AG INDUSTRY INSIGHTS AND PERSPECTIVES | 3
Introduction
U.S. Economy
IMPACTS ON AGRICULTURE
It’s difficult to ignore the impact that the general United States economy has on agriculture, which is a core economic driver across the country and has widespread impacts even beyond the production of food, fuel, and fiber. The following is a review of key economic factors and their influence on the U.S. agricultural industry.
Inflation
Inflation, as measured by the Personal Consumption Expenditures (PCE) method, is expected to be 3.3% in 2023 compared to 5.5% in 2022 and 5.7% in 2021, according to the Congressional Budget Office (CBO).1 The PCE inflation rate is expected to be 2.4% in 2024 and achieving the Federal Reserve’s goal of 2.0 by 2026.
The Consumer Price Index (CPI) is a measure of the average change over time in the prices
paid by urban consumers for a market basket of consumer goods and services. The most recent values available for selected product groups are shown in Exhibit 1.2 Food leads the index increase at 9.35% over February 2022. The CPI is expected to continue falling throughout 2023 then rise back to a level just shy of 4.0% in late 2023 and 2024 according to the Federal Planning Bureau, as seen in Exhibit 2. These projections are based on futures quotes as of February 2023.
Exhibit 1: Consumer Price Index as of February 2023
12-month percentage change, Consumer Price Index, selected categories, February 2023, not seasonally adjusted
1 The Economic Outlook for 2023 to 2033 in 16 Charts. Congressional Budget Office. Publication 58880. 2023. https://www.cbo.gov/system/files/2023-02/58880-Economic-Outlook.pdf
2 U.S. Bureau of Labor Statistics – CPI Charts. https://www.bls.gov/cpi/
4 | 2023 AG INDUSTRY INSIGHTS AND PERSPECTIVES
Category All items Food Energy All items less food and energy 0% 2% 4% 6% 8% 10% Click legend items to change data display. Hover over chart to view data. �Source: U.S. Bureau of Labor Statistics.
Exhibit 2: Federal Planning Bureau CPI Chart for 2023-20243
evolution of inflation
The USDA Economic Research Service (ERS) projects food prices “to grow more slowly in 2023 than in 2022 but still at above-historical average rates. In 2023, all food prices are predicted to increase 7.5%, with a prediction interval of 5.5 to 9.6%. Food-at-home prices are predicted to increase 7.8%, with a prediction interval of 5.3 to 10.5%. Food-away-fromhome prices are predicted to increase 8.3%, with a prediction interval of 7.2 to 9.3%.”4
Consumers who lose jobs or have job pay rates unable to keep pace with these inflationary rates will be financially stressed in the short term.
The inflation impact on farm businesses could include:
• Potential over-inflated values on land and other capital items, livestock, inventories and supplies, and pre-paid inputs. These impact the net worth on the balance sheet.
• Net worth growth as a result of inflation rather than earnings.
• The expected cost consumers will pay for food will increase while the net income at the farm level is expected to decrease.
Gross Domestic Product (GDP)
The CBO projects the growth of real GDP in 2023 slowing significantly to 0.1%, primarily due to sharp increases in interest rates during 2022. For 2024 through 2027 the CBO expects a moderate 2.4% GDP growth rate.5 Exhibit 3 provides a historical chart of GDP from Trading Economics.
3 Consumer Price Index – Inflation forecasts. Federal Planning Bureau. https://www.plan.be/databases/17-en-consumer_price_ index_inflation_forecasts#:~:text=On%20the%20basis%20of%20these,2022%20and%202.44%25%20in%202021
4 Summary Findings – Food Price Outlook, 2023. Economic Research Service, USDA. https://www.ers.usda.gov/data-products/food-price-outlook/summary-findings/
5 The Economic Outlook for 2023 to 2033 in 16 Charts. Congressional Budget Office. Publication 58880. 2023. https://www.cbo.gov/system/files/2023-02/58880-Economic-Outlook.pdf
2023 AG INDUSTRY INSIGHTS AND PERSPECTIVES | 5
2023 2024 National consumer price index Health index Monthly
yoy growth rates in %, the values in the grey area are forecasts National consumer price index Health index J 23 F 23 M 23 A 23 M 23 J 23 J 23 A 23 S 23 O 23 N 23 D 23 J 24 F 24 M 24 A 24 M 24 J 24 J 24 A 24 S 24 O 24 N 24 D 24 0 2 4 6 8 10
Exhibit 3: United States Full Year GDP Growth – 1998-20226

How does agriculture contribute to GDP? According to USDA Economic Research Service (ERS), in 2021 agriculture, food, and related industries had a 5.4% share of the GDP. The output of America’s farms contributed about 0.7% of U.S. GDP. Exhibit 4 from USDA ERS shows the value added to U.S. GDP by agriculture and related industries. This contribution will continue.
6 United States Full Year GDP Growth. Trading Economics 2023. https://tradingeconomics.com/united-states/full-year-gdp-growth
7 What is agriculture’s share of the overall U.S. economy? USDA ERS - Chart Detail

6 | 2023 AG INDUSTRY INSIGHTS AND PERSPECTIVES
Exhibit 4: What is Agriculture’s share of overall U.S. Economy7
Interest Rates
The CBO projects short term interest rates will increase through the first half of 2023 then gradually decline beginning in late 2023.

Interest rate increases have already significantly impacted farm level cash flow, actual and projected. Projections for new capital investments requiring borrowed funds show more difficulty achieving residual cash levels needed for debt service. In addition, maxed out variable rate operating loans or lines of credit are seeing interest expense doubling compared to previous years.
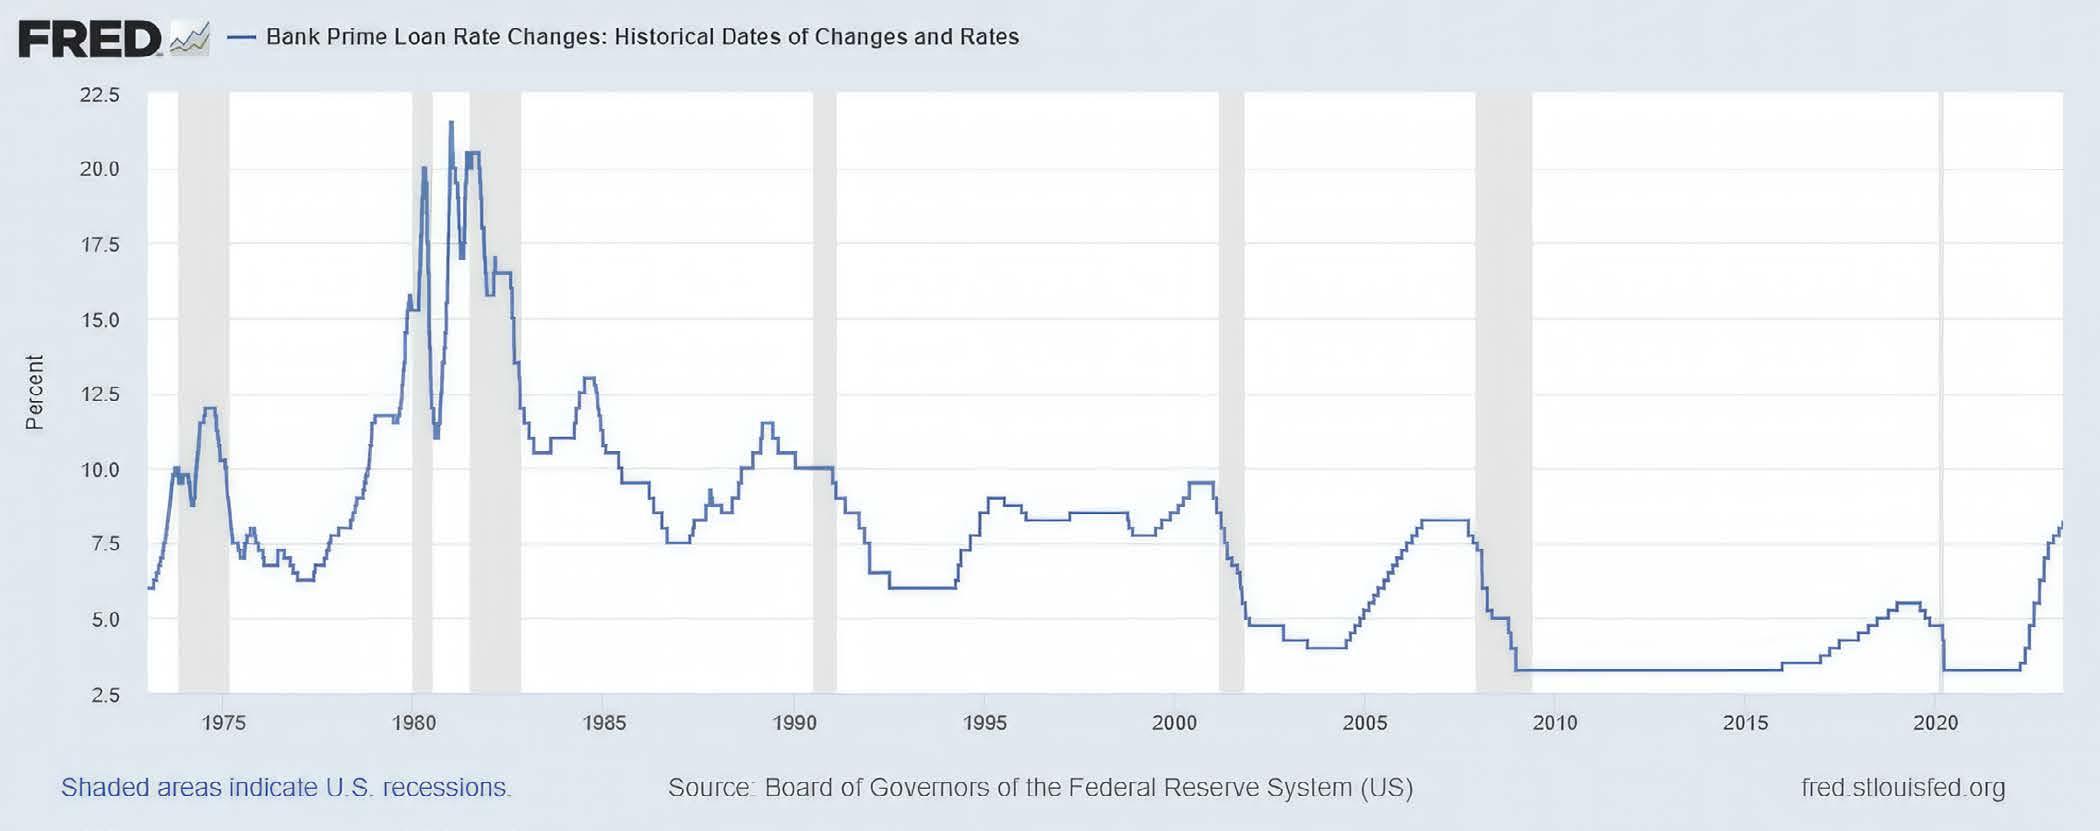
As of May 3, 2023, the Bank Prime Rate, according to Federal Reserve Bank Economic Data (FRED) is 8.25%. One year earlier, May 5, 2022, the rate was 4.0%. There were seven interest rate increases in 2022 and three rate increases thus far in 2023. To put the current rate in perspective, since 1999, the current rate is the third highest rate in the past 22 years. Exhibit 5 shows the Bank Prime rate from 1999 to 2023. However, looking back over a 50-year period, the current bank prime rate is more of an average rate from 1974 into 2023. Exhibit 6 shows that the Bank Prime rate peaked in the early 1980’s around 22%.
Exhibit 5: Bank Prime Loan Rate Changes – 1999-20238

2023 AG INDUSTRY INSIGHTS AND PERSPECTIVES | 7
8 Bank Prime Loan Rate Changes: Historical Dates of Changes and Rates. Bank Prime Loan Rate Changes: Historical Dates of Changes and Rates (PRIME) | FRED | St. Louis Fed (stlouisfed.org)
Exhibit 6: Bank Prime Loan Rate Changes – 1974-20239
Labor and Wages
The CBO projects continued low unemployment rates for the foreseeable future at the 4 to 5% level, along with a static Labor Force Participation Rate.
However, CBO predicts a significant drop in the rate of growth of hourly wages after the high-rate growth through 2021 and 2022 of over 4%. Their
projections indicate growth rates of hourly wages returning the more historical levels under 4%.
The changes in the wage growth rate could be beneficial to agriculture producers having difficulty finding workers due to competing businesses offering higher wages than farms have been able to pay in the past.
Construction Costs
Construction costs within the U.S. are expected to increase in 2023, though individual segments of the construction industry may vary. The cost of concrete and cement is expected to rise. As of Q1 2023, year-over-year costs are up 8.9 and 9.4% respectively compared to 2022. Steel,
including rebar and flat steel, are up 1.0 and 1.6% respectively, year-over-year as of Q1 2023. On the other hand, lumber is expected to be down in 2023. Q1 2023 results show lumber down 62% comparing year-over-year results.10
10 Construction Industry Report Predicts 2023 Materials Pricing. ForContructionPros.com, https://www.forconstructionpros. com/business/article/22711010/linesight-construction-industry-report-predicts-2023-materials-pricing
8 | 2023 AG INDUSTRY INSIGHTS AND PERSPECTIVES
9 Bank Prime Loan Rate Changes: Historical Dates of Changes and Rates. Bank Prime Loan Rate Changes: Historical Dates of Changes and Rates (PRIME) | FRED | St. Louis Fed (stlouisfed.org)
Farm EconomyCONSIDERATIONS
Net farm incomes are expected to drop in 2023 as compared to the highs of 2022 but should still be above average. The USDA Economic Research Service (ERS) forecasts Average Net Cash Farm Income (NCFI) to be down 17.7% in 2023. The decline spans all types and sizes of farms. No farm sector is expected to increase NCFI in 2023. The livestock sector is forecasted to see the greatest declines, with dairy leading the group with a forecast drop of 39%.11
Current drought conditions in the mid and western U.S. are expected to improve, but at a slow pace, and may impact forecasted cropping acres.
The industry is being impacted by poor supply chain elasticity, particularly with farm equipment. The days of ordering new equipment and having it available are gone. This ripples into the used equipment market and will tighten
the ability of producers to invest in equipment and replace equipment in a timely manner.
Global conflicts continue to wreak havoc on grain and energy markets. Though the Black Sea Grain Initiative has been established, it has had little impact on moving grains at a substantial level. Energy costs, while down from highs last year, are still rippling through multiple input cost sectors for agricultural commodities.
While exports were strong in 2022, they are expected to soften in 2023. USDA ERS forecasts predict that ag exports may dip below imports this year, which does not follow the general historical trend as shown in Exhibit 7. China is forecasted to remain as the largest market for U.S. agricultural exports at $34.0 billion.12 There is concern that rising tensions with China could disrupt or further weaken realized exports.
11 Highlights from the February 2023 Farm Income Forecast.

https://www.ers.usda.gov/topics/farm-economy/farm-sector-income-finances/highlights-from-the-farm-income-forecast/
12 Outlook for U.S. Agricultural Trade. https://www.ers.usda.gov/topics/international-markets-u-s-trade/u-s-agricultural-trade/ outlook-for-u-s-agricultural-trade/#:~:text=U.S.%20Agricultural%20Exports%20in%20Fiscal,Billion%3B%20Imports%20 at%20%24199.0%20Billion
2023 AG INDUSTRY INSIGHTS AND PERSPECTIVES | 9
Exhibit 7: U.S. Agricultural Trade
Most U.S. ports showed significant decreases in container handling over the last several months versus last year, over the same period. As an example, the Port of Los Angeles saw a 43% drop in February 2023 compared to February 2022.13
Fuel costs will continue to be higher than recent years, at least in the short-term and possibly longer-term, even with crude oil back in the
pre-COVID price range. Information from the U.S. Energy Information Administration shows that the No. 1 U.S. diesel fuel price is projected at $4.23/gallon in 2023, down 15% from the 2022 average of $4.99/gallon. The historical average price from 2017 to 2021 is $2.95/gallon.14 These continued high fuel prices impact agricultural production, manufacturing and shipping of all inputs and products.
13 The Port of Los Angeles. https://www.portoflosangeles.org/references/news_031723_feb_cargo#:~:text=February%20 2023%20loaded%20imports%20reached,year%2Dover%2Dyear%20decline
14 Gasoline and Diesel Fuel Update. U.S. Energy Information Administration. https://www.eia.gov/petroleum/gasdiesel/
10 | 2023 AG INDUSTRY INSIGHTS AND PERSPECTIVES
1990 1992 1994 1996 1998 2000 2002 2004 2006 2008 2010 2012 2014 2016 2018 2020 2022 0 20 40 60 80 100 120 140 160 180 200 Forecast U S agricultural trade
Exports Imports Value, billion dollars
Source: USDA, Economic Research Service and USDA, Foreign Agricultural Service analysis and forecasts using data from U S Department of Commerce, Bureau of the Census
The increase in fuel prices seen in recent years has been the result of refining capability issues as compared to supply issues; this is based on several observations:
• Diesel inventories remain low in the U.S.
• Prior to the Ukraine conflict, Europe imported more than 10% of its diesel with more than 50% of that coming directly from Russia. French refineries have been shut down due to strikes.
• Several U.S. refineries did not come back on-line for diesel/gasoline production after COVID shutdowns, including one refinery on the East Coast. The higher cost of acquiring crude oil (especially on the East Coast), a projected future demand, and an unwillingness by refiners to make billions of dollars in investments for which returns are questionable all contributed to refinery closures.
• New refining capabilities are limited and few are planned for in the U.S.
• New ship builds are favoring finished petroleum products versus crude oil vessels. Crude oil vessel orders are also significantly off their historic numbers.
Within the northeastern U.S., shale gas has significantly impacted the agricultural industry. Over the years, natural gas royalties have provided valuable alternative incomes for farms and landowners. The 2021 well head prices per MCF (Million Cubic Feet) saw a 107% increase over 2020 prices. 2022 prices were 89% higher than 2021.The price increase was due to the combination of weaker-than-usual production growth and strong demand (domestic and international). Current forecasts project that prices will remain elevated in the short term due to global supply and demand pressures. The Pennsylvania Independent Fiscal Office expects long-term
prices will soften as more wells and production are brought on-line due to the high prices.15 Individual landowners could benefit as additional wells are drilled or brought into production on pads already located on the landowner’s property.
Land values have generally increased over the past several years and the increase is not necessarily due to productivity. Competition for land has increased. The solar, wind, and gas industries are rapidly acquiring land, as are investors. Residential buyers are driving demand for farmland, too, as the desire to live in rural areas is increasing. Land rents have also seen significant increases due to competition. Liquidity in the market has allowed higher prices to be paid for land and land rents. Government payments during COVID-19 helped contribute to the liquidity in the marketplace. Additional borrowing capacity was available to individuals from the liquidity, or the debt that was paid down from the liquidity. Whether land prices continue the upward trend is unknown. Increased interest rates would tend to slow the upward trend; however, in the recent short term, it has not. Only time will tell were land values go, but land values have a substantial impact on farms and their balance sheets.
Finally, in 2023 a new federal Farm Bill is due. Every five years Congress passes legislation that sets national agriculture, nutrition, conservation, and forestry policy. It is important that the agricultural industry is engaged in this process, providing input on issues important to agricultural producers and the supporting industry.
The remainder of this document includes indepth discussions on dairy, forest products, grain, and poultry, some of the main agricultural industries within Horizon Farm Credit’s territory across Delaware, Maryland, Pennsylvania, Virginia and West Virginia.
2023 AG INDUSTRY INSIGHTS AND PERSPECTIVES | 11
15 Natural Gas Production Report. Independent Fiscal Office. http://www.ifo.state.pa.us/download.cfm?file=Resources/Documents/NGPR_2022_Q4.pdf
A Review of 2022
2022 was a great year for the dairy sector. Milk prices were the strongest they have been in the past ten years, surpassing the historical milk prices experienced in 2014. Horizon Farm Credit’s territory spans five states, each with unique opportunities for income in the dairy industry.
A Horizon Farm Credit Indexed Milk Price was established to evaluate the weighted average milk price based on the PA All Milk Price, Federal Milk Marketing Order 1 Statistical Uniform Price with relevant location adjustments, and the
annual production percentage by state. Individual producers may have realized a gross milk price outside of this range, given their unique milk composition and market. Exhibit 8 depicts the 2022 Horizon Farm Credit Index Milk Price and range as well as the five-year average. 2022 was $5-$8/cwt higher than the five-year average, affording producers a welcomed profit margin. Most producers took advantage of profits to invest in capital expenditures delayed from several years of minimal margins, and prepaid for key inputs to help mitigate costs for the current year.
Exhibit 8: 2022 Horizon Farm Credit Index Milk Price vs. 5-Year Average

Sources: United States Department of Agriculture, National Agricultural Statistics Service, http://www.nass.usda.gov
United States Department of Agriculture, Economic Research Service, http://www.ers.usda.gov
Northeast Milk Marketing Area Administrator, Uniform Price and Producer Price Differential, http://www.fmmone.com
Rising prices were not isolated to only the income side. Most key input costs (feed, labor, fertilizer, fuel, etc.) had varying levels of increase during 2022. National Dairy Margin Coverage feed cost trends as shown in Exhibit 9 illustrate that feed costs were also $3-$8/cwt higher than the fiveyear average. This eroded the profit potential from the historical milk prices last year. It’s important to note that milk price trended down in Q3 and
Q4 of 2022, while feed costs remained relatively high and started to increase in Q4. Increased costs have contracted the growth of the U.S. dairy herd in the last quarter of the year as well. Labor also continued to be a pressing cost for dairies in 2022. From milkers to managers, tight job markets and rapidly increasing inflation saw wage increases across the dairy workforce.
12 | 2023 AG INDUSTRY INSIGHTS AND PERSPECTIVES
Dairy
Exhibit 9: 2022 Dairy Margin Coverage Feed Cost vs. 5-Year Average

Sources: United States Department of Agriculture, National Agricultural Statistics Service, http://www.nass.usda.gov
United States Department of Agriculture, Agricultural Marketing Service, http://www.ams.usda.gov
Key Factors Influencing the Industry
The dairy industry within the Horizon Farm Credit footprint is uniquely positioned to prosper for the foreseeable future. Markets are close in proximity to large population centers. Most of the region has been slow to normalize to the national trend of consolidation and expansion. Part of this is related to capital investment costs, infrastructure, and geography. Recent evaluation of the Horizon Farm Credit Dairy Success and Profitability Review report indicates there is a growing percentage of dairy farms that are seeking diversified income, and those farms are rising to the top of the list when it comes to profitability (when ranked by net margin). Part of the diversification is a perceived limitation on growing production due to base or over-production penalties. Several projects for expanded processing capacity in the Northeast are encouraging for a region that hasn’t seen significant change in capacity for many years. Regional investment into expanded processing capacity and adjusting to ever-changing consumer demands will strengthen the demand for milk and milk components.
There are some challenges with lack of expansion. Milk transportation costs have increased, and though passed onto the producer in some capacity,
remains a challenge. Farms with small volumes of milk are experiencing difficulty maintaining a market. Advancements in milk cooling and storage have the potential to slightly reduce the number of pickups needed but comes at a high capital investment. Expansion of processing capacity could also alleviate some of this transportation burden but will take time to develop and materialize.
Additionally, land values and environmental regulations remain a unique challenge. It is very difficult to acquire new land, transfer land to the next generation, or justify the value of rent on current land for agricultural practices. This drives the second challenge of feed cost, which historically is a story of the have and the have not. Those with enough land base to support their herd size (including heifers) tend to have a greater opportunity to control feed costs and weather feed market fluctuations. Finally, sections of our region have continued pressure of development of land due to urbanization and industrialization. A long-term challenge, though not unique to our territory, is how to engage the next generation in wanting to dairy, especially when it may not be a child or relative looking to continue the operation.
2023 AG INDUSTRY INSIGHTS AND PERSPECTIVES | 13
Perspective and Projections for the Year Ahead
Milk price values, though declining, currently sit above the five-year average, suggesting 2023 milk income will potentially fall between 2021 and 2022 values. Additionally, the ability to reinvest in the operation last year after several years of tight margins has re-energized most producers. To maximize opportunities in 2023, producers need to focus on two key factors: controlling costs and engaging with risk management options.
Current outlook indicates margins will be slightly below the five-year average for most
of the year, with a gradual return to average margins around $9/cwt by Q4 2023, as shown in Exhibit 10. Current conditions show slight improvement in milk price with a drop in feed commodity costs, which may improve this prediction. External influences expounding price volatility on milk and feed will dictate how margins perform for the near future. Producers should implement risk management options, such as Dairy Margin Coverage and Dairy Revenue Protection, to help mitigate these challenges.

Exhibit 10: 2023 Projected HFC Indexed Milk and DMC Feed Cost Margin vs. 5-Year Average
Sources: United States Department of Agriculture, National Agricultural Statistics Service, http://www.nass.usda.gov
United States Department of Agriculture, Agricultural Marketing Service, http://www.ams.usda.gov
CME Group, Agricultural Futures and Options, https://www.cmegroup.com/markets/agriculture.html
In conclusion, dairy farms in Horizon Farm Credit’s territory have unique opportunities to remain relevant to the dairy industry. Farms that monitor costs, evaluate long term opportunities, and have contingency plans are poised to thrive
and grow their operations. Business transitions continue to be a growing topic of interest and will dictate the growth or contraction of the industry for the next several years.

14 | 2023 AG INDUSTRY INSIGHTS AND PERSPECTIVES
Forest Products
Forest Products
A Review of 2022
2022 was another strong earnings year for most operations in the forest products industry. Lumber prices remained elevated in the first half of 2022 both at the national level and in the Appalachian region. Profitability for most sawmill operations was strong in the first half of the year, though tapering off in third and fourth quarters of 2022 due to sharp declines in pricing
A Review of 2022
2022 was another strong earnings year for most operations in the forest products industry. Lumber prices remained elevated in the first half of 2022 both at the national level and in the Appalachian region. Profitability for most sawmill operations was strong in the first half of the year, though tapering off in third and fourth quarters of 2022 due to sharp declines in pricing and demand. Both the domestic producer price index (PPI) for hardwood and softwood lumber and the export price index (EPI) for logs and lumber showed sharp declines in late 2022. While 2022 is believed to have been an overall strong year for most borrowers in the forest products industry, earnings are expected to have moderated from the extraordinary profits seen in 2021.
and demand. Both the domestic producer price index (PPI) for hardwood and softwood lumber and the export price index (EPI) for logs and lumber showed sharp declines in late 2022. While 2022 is believed to have been an overall strong year for most borrowers in the forest products industry, earnings are expected to have moderated from the extraordinary profits seen in 2021.
Producer Price Index and Export Price Index
Exhibit 11: Producer Price Index and Export Price Index
Sources: Export Price Index: https://fred.stlouisfed.org/series/IQ13100
Sources: Export Price Index: https://fred.stlouisfed.org/series/IQ13100
PPI: Softwood Lumber: https://fred.stlouisfed.org/series/WPU0811
PPI: Softwood Lumber: https://fred.stlouisfed.org/series/WPU0811
PPI: Hardwood Lumber: https://fred.stlouisfed.org/series/WPU0812
PPI: Hardwood Lumber: https://fred.stlouisfed.org/series/WPU0812
The sharp, late‐2022 declines in both the PPI and EPI occurred amidst the U.S. Federal Reserve’s tightening of monetary policy. The Fed funds effective rate increased by over 4% in 2022 alone16, and the average U.S. 30‐year fixed mortgage rate increased from ~3.1% in Dec 30th, 2021 to ~6.4% on
The sharp, late-2022 declines in both the PPI and EPI occurred amidst the U.S. Federal Reserve’s tightening of monetary policy. The Fed funds effective rate increased by over 4% in 2022 alone16, and the average U.S. 30-year fixed mortgage rate increased from ~3.1% in Dec 30th, 2021 to ~6.4%
16 Fed Funds: https://fred.stlouisfed.org/series/FEDFUNDS
16 Fed Funds: https://fred.stlouisfed.org/series/FEDFUNDS
on December 29th, 2022.17 U.S. single family housing starts showed strong declines after April 2022 and were likely hindered by the increased cost of borrowing.18 Existing home sales in the U.S. also declined throughout much of 2022.19
17 30-year fixed rate mortgage average in the US: https://fred.stlouisfed.org/series/MORTGAGE30US
18 Single family housing starts: https://fred.stlouisfed.org/series/HOUST1F
19 Existing home sales: https://fred.stlouisfed.org/series/EXHOSLUSM495S
2023 AG INDUSTRY INSIGHTS AND PERSPECTIVES | 15
Exhibit 11: Producer Price Index and Export Price Index
40.0 60.0 80.0 100.0 120.0 140.0 160.0 150.000 200.000 250.000 300.000 350.000 400.000 450.000 500.000 550.000 600.000 650.000
PPI: Hardwood Lumber (left)
PPI: Softwood Lumber (left) Export Price Index: Logs and Lumber (right)
were likely hindered by the increased cost of borrowing.18 Existing home sales in the U.S. also declined throughout much of 2022. 19
Housing Starts vs. Mortgage Rates
Exhibit 12: Housing Starts and Mortgage Rates
Despite domestic economic headwinds, total 2022 U.S. forest products exports were strong at ~$10.05B (above the 3‐year average of $8.95B). Canada and China continued to be the two largest export markets for the U.S. at $2.55B and $1.7B, respectively. 20
Despite domestic economic headwinds, total 2022 U.S. forest products exports were strong at ~$10.05B (above the 3-year average of $8.95B). Canada and China continued to be the two largest export markets for the U.S. at $2.55B and $1.7B, respectively. 20
Key Factors Influencing the Industry
Key Factors Influencing the Industry
There are many factors affecting the forest products industry across the Horizon Farm Credit footprint and nationally. Following is a description of some of the
Northern Long‐eared Bat
There are many factors affecting the forest products industry across the Horizon Farm Credit footprint and nationally. The following is a description of some of the main areas influencing the industry.
Northern Long-eared Bat
The Northern Long-eared Bat (NLEB) was listed by the U.S. Fish and Wildlife Service (USFWS) as threatened in 2015. This federal listing was in response to the sharp decline of NLEB due to white-nose syndrome (WNS). Since WNS was discovered in a cave in New York in 2006, it has caused a 97% decline in affected populations. This massive decline has prompted the USFWS to list the bat as endangered, which will require further protection under the law. The final ruling took effect March 31, 2023. At the time of this writing, it is not fully understood what effects this ruling may have on the forest products industry and landowners. Conservation efforts may include the curtailment or modification of timber harvesting in certain locations or on certain governmentowned lands during the nesting season of NLEB.

The Northern Long‐eared Bat (NLEB) was listed by the U.S. and Wildlife Service (USFWS) as threatened in 2015. This listing was in response to the sharp decline of NLEB due white‐nose syndrome (WNS). Since WNS was discovered cave in New York in 2006, it has caused a 97% decline in populations. This massive decline has prompted the USFWS list the bat as endangered, which will require further protection under the law. The final ruling took effect March, 31 2023. At the time of this writing, it is not fully understood what effects this ruling may have on the forest products industry and landowners. Conservation efforts may include the
Carbon
17 30‐year fixed rate mortgage average in the US: https://fred.stlouisfed.org/series/MORTGAGE30US
18 Single family housing starts: https://fred.stlouisfed.org/series/HOUST1F
19 Existing home sales: https://fred.stlouisfed.org/series/EXHOSLUSM495S
20 US Forest Products Exports in 2022: https://www.fas.usda.gov/data/commodities/horticulture
Carbon sequestration and related carbon markets have been at the forefront of discussions on the topic of forestland and forest management for the past few years. As trees grow, they sequester (capture and store) carbon in the wood they produce. This carbon is stored for long periods in the living trees and also in the wood products produced from those trees that we use in our lives. As trees die and decay, this stored carbon is released back into the atmosphere. As trees
16 | 2023 AG INDUSTRY INSIGHTS AND PERSPECTIVES
Exhibit 12: Housing Starts and Mortgage Rates
‐and‐forestry 0.00 1.00 2.00 3.00 4.00 5.00 6.00 7.00 8.00 9.00 0 200 400 600 800 1000 1200 1400 1600 1800 2000 2000 2001 2002 2003 2004 2005 2006 2007 2008 2009 2010 2011 2012 2013 2014 2015 2016 2017 2018 2019 2020 2021 2022 2023 % 000s
New Privately‐Owned Housing Units Started (left) Average 30‐Year Fixed Mortgage Rate (right)
20 US Forest Products Exports in 2022: https://www.fas.usda.gov/data/commodities/horticulture-and-forestry
are harvested, the products that are produced from those trees store carbon as long as that product is prevented from decay. Tops, limbs and stumps that are left in the woods from harvested trees, decay and release carbon, while at the same time, return important nutrients to the soil and provide a crucial role in the ecosystem.

Carbon markets seek to establish a monetary value on the carbon sequestered in growing trees through carbon credits. Companies that emit carbon in the manufacturing of their products then purchase these carbon credits to theoretically offset their carbon footprint on the earth. At first, these carbon markets were only available to larger landowners (30,000 + acres), but new carbon markets pool smaller landowners together. Many of these markets require a minimum of a 20-year commitment of none to very limited timber harvesting activity. This has the potential to have long-lasting impacts on the availability of fiber and wood products on which forest products companies depend.
Horizon Farm Credit supports the wise management and use of our forest resources to produce products needed by society. The elimination of silvicultural harvesting prescriptions for the sole purpose of carbon sequestration, could be detrimental to the long-term health of our forests and forest products industries. The wise management of our forests with the goal of growing high-quality timber, which will result in valuable forest products, should be a goal of any carbon sequestration theme. Eventually, when these higher quality trees are harvested, they will generate strong income for the landowner, provide jobs in the forest products industry and long-lasting forest products that store carbon, that we can use and enjoy.
Forest Pests
In 2022, over 1 million acres of forest in Pennsylvania were reported with defoliation, of which 80% is attributed to the spongy (gypsy) moth. The heaviest damage was in the central and north-central oak forests. DCNR Bureau of Forestry plans to spray 290,000 acres and the PA Game Commission will spray an additional 110,000 acres in PA. Control efforts are also planned for Maryland, Delaware, Virginia, and West Virginia.

The hemlock wooly adelgid (HWA) has been found throughout Horizon Farm Credit’s territory. The adelgid can cause mortality of hemlocks within five years of infestation. The eastern hemlock is a foundational species that is vital to our ecosystems and crucial to preventing stream-water temperature increases. Hemlock not only provides essential evergreen cover for wildlife but is fundamental to the health of our brook-trout streams.
Within the mid-Atlantic and northeastern U.S., beech trees are being attacked by both Beech Leaf Disease and Beech Bark Disease. Beech is a climax species in our forest and is important for wildlife.
The emerald ash borer can be found throughout Horizon Farm Credit’s territory. Over the last ten years, it has caused the mortality
2023 AG INDUSTRY INSIGHTS AND PERSPECTIVES | 17
of tens of millions of ash trees. Healthy ash in Pennsylvania has become a rarity.
Since its discovery in the U.S. in 2014, the spotted lanternfly has rapidly spread, covering most of Horizon Farm Credit’s territory, with the exception of northern Pennsylvania. It has not caused major forest damage to-date, but it can be a serious threat to fruit crops and its feeding
causes stress to maples, walnut, birch and willow. This stress, in combination with other factors, can lead to reduced tree vigor and eventual mortality.
The above notes are just a few of the invasive pests that are affecting our hardwood forests in our region. For more information on invasive pests, contact USDA APHIS, the state Bureau of Forestry or Extension.
Perspectives and Projections for the Year Ahead
After strong hardwood prices during 2021 and three quarters in 2022, prices rapidly dropped in the last quarter of 2022 and through January of 2023. Prices stabilized in February to near their ten-year average for Appalachian hardwoods and slowly gained momentum in March and into April. Mills with stumpage purchased at prices in 2022 will need to work that higher priced inventory through their system before they will be able to return to profitability.
We expect hardwood prices to be stable to moderately increasing over the coming year, but with a caveat. Domestic hardwood lumber sales are closely related to new housing starts. Further tightening by the Federal Reserve could stall any increases in housing starts and existing home sales, thereby reducing domestic demand
for hardwood products. The demand for softwood lumber is similarly expected to be highly dependent upon inflation-induced actions by the Fed and its consequences on the U.S. housing market. Softwood sawtimber stumpage prices in states such as Virginia, Tennessee and Florida have continued to be priced near historic norms thus far despite the recent decline in housing starts.
Some species prices, such as black cherry, are more closely related to economic conditions in China and Europe due to the high percentage of that species that is shipped overseas. Labor costs and shortages continue to weigh on most industries. Prices of individual hardwood species will be very reactive to over-production and supply/demand factors. In short, hardwood prices will be reactive to supply and economic stimuli that is hard to project at this time.
18 | 2023 AG INDUSTRY INSIGHTS AND PERSPECTIVES
Exhibit 13:
Source:
$400 $600 $800 $1,000 $1,200 $1,400 $1,600 $1,800 $2,000 $2,200 Jun ‐17 Sep ‐17 Dec ‐17 Mar ‐18 Jun ‐18 Sep ‐18 Dec ‐18 Mar ‐19 Jun ‐19 Sep ‐19 Dec ‐19 Mar ‐20 Jun ‐20 Sep ‐20 Dec ‐20 Mar ‐21 Jun ‐21 Sep ‐21 Dec ‐21 Mar ‐22 Jun ‐22 Sep ‐22 Dec ‐22 Mar ‐23 Appalachian
Price
Low Grade $/MBF Green $/MBF Kiln Dried $/MBF
Appalachian Lumber Price Index
Appalachian Hardwood Prices: Hardwood Review
Lumber
Index
Exhibit 13: Appalachian Lumber Price Index
Source: Appalachian Hardwood Prices: Hardwood Review
Grain
A Review of 2022
As we look back on 2022 many factors led to a successful year in crop farming for most farmers in the Horizon Farm Credit footprint. Strong corn, soybean and wheat prices helped offset some of the rising cost of inputs. Coming into 2022, the question was whether the prices were going to hold to offset the increased expenses. For the most part, prices held strong through year-end. Some areas of the region were hit with a drought; however, the majority of the territory saw favorable weather, which led most producers to have average to slightly above average yields.
The biggest asset on most farmers’ balance sheets is the land that they own. In the
last few years, land has significantly grown in value, which can be attributed to:

• Increased liquidity from government payments
• Historical profitability for farmers in the last few years
• Increased competition from multiple sources for available land
Whether or not this will continue is unknown, but we have seen that rising interest rates and the price of corn tend to have an impact on land values.
Key Factors Influencing the Industry
Much discussion has arisen recently regarding the weather in Brazil. There has been a lot of chatter about major frost that occurred, however that frost did not hit the major corn producing region and will not affect yields. The U.S. has historically been the world’s largest corn exporter, however Brazil is expected to surpass the U.S. in total corn exported in the coming years.
Additionally, the ongoing war in Europe has changed the wheat market globally as both Russia and Ukraine are major world producers of wheat. The U.S. still lags significantly behind the rest of the world in terms of wheat output and
continued dry conditions in the western wheat belt are not likely to boost production in 2023.
Ending stocks on the U.S. grain balance sheet may see an increase in the coming years as supply catches up with demand. Domestic consumption combined with some post African Swine flu exports to China has kept the corn stock-to-use ratio in check. Increased world supply could place pressure on corn as rising production meets steady demand. We continue to see the export market trend back to “normal” with production to rise and domestic consumption to maintain, which will build the carryout back up to a more typical level.
2023 AG INDUSTRY INSIGHTS AND PERSPECTIVES | 19
Exhibit 15 shows the U.S. has declined in dominance of world corn exports since the 1980s. What the chart does not show is that domestic use for feed and ethanol has increased over time and largely absorbed any reduction in exports. Given a fixed land base for corn production, and the fact

that our domestic producers are already using the best management practices and technology, increasing production to meet future world demand is unlikely. That said, ending stocks have not exploded, and simply put we do not have enough corn to meet 70% of world export demand.
Exhibit 15: U.S. Percentage Share of World Corn Exports
Source: AgFax, Corn Exports Over the Last 6 Decades, https://www.agfax.com/2021/03/22/corn-exports-over-the-last-6-decades-promise-vs-performance-commentary/
20 | 2023 AG INDUSTRY INSIGHTS AND PERSPECTIVES
Exhibit 14: U.S. Domestic Corn Use
1960s 1970s 1980s 1990s 2000s 2010s Average % over decade 52.4% 73.0% 73.8% 70.0% 59.7% 34.3%
Input costs are a factor on the “watch list” for most grain farmers in 2023. Fertilizer costs started higher than normal at the end of 2022 and into the very beginning of 2023, before starting to come down at the close of the first quarter of 2023. Fuel costs are following a similar trend as fertilizer, with costs also starting to come down towards the end of the first quarter of 2023. These two major factors affect the operating cost of a crop operation.
Technology is vital to a cash grain farms, from yield data to soil temperatures to GPS on equipment,
the delay in getting this technology to the farmer is having a major impact on operations. Equipment purchases have been impacted as parts shortages have delayed the arrival of new equipment. In turn, this impacts the used equipment market which peaked in 2022 and prices remain strong. New equipment has risen in cost, but there is lag time due to the arrival of computer chips which delays the equipment being put into production right away. The industry continues to monitor the value of technology and the cost of equipment as it affects farmers’ operational expenses.
Perspectives and Projections for the Year Ahead
The agriculture industry is coming off multiple years of strong farm income driven by high commodity prices, average input costs and strong government payments. As we move into 2023, we expect grain prices to continue to trend down, mostly on the corn side, resulting in slimmer margins for crop operations than in recent years. There are certainly variables in the profitability mix that are uncontrollable, weather being the biggest one that may cause regional yield differences. However, we generally expect to see lower net income for crop operations this year.
Interest cost has not been a concern in recent years as rates were at all-time lows and allowed for cheap operating capital. With the Federal Reserve raising interest rates over 400 basis points since 2022, this has a direct impact on a farm’s operating line of credit rate. At the time this information is being compiled, the Prime Rate is sitting at 8.25% compared to
4.0% a year ago. This increase in interest expense is felt on operations that have historically relied on cheap operating capital for farm operations. Some operations have been able to pay down or pay off operating lines over the last few years, but those that have not taken advantage of those prices are beginning to feel the impact of the increased cost.
Crop prices are extremely hard to project due to many different factors including local basis, forward contracting, hedging and many other risk management tools. Looking ahead to 2023, we continue to see downward pressure in the corn market. As Exhibit 16 shows, USDA’s projection of corn acreage planted is expected to increase by 3% to 91 million acres and the important ending stocks estimate increases 49% after the 2023 crop year hits the bin. The increase in production against rather stable domestic and export demand is likely to reduce the corn price below recent years.

2023 AG INDUSTRY INSIGHTS AND PERSPECTIVES | 21
Exhibit 16: Corn Supply, Demand, and Price, 2020/21-2023/24
Source: USDA Grains and Oilseeds Outlook, February 23, 2023, https://www.usda.gov/sites/default/files/documents/2023AOF-grains-oilseeds-outlook.pdf
Considering other commodity markets, soybeans have also been challenged. With the world oilseed market stress, U.S. soybean and soy product futures saw decreases at the beginning of 2023. Overall soybean ending stocks post 2023 harvest are projected be lower which should
provide support to price. As this publication goes to print the corn planting season has started and we are only weeks away from barley and wheat harvest, so the markets will begin watching the weather and trading accordingly.
21 Acreage, yield, production, and beginning stocks are estimates from the National Agricultural Statistics Service. Imports, use, ending stocks, and season-average farm price are projections from the World Agricultural Supply and Demand Estimates, February 8, 2023.
22 Average farm price are projections from the World Agricultural Supply and Demand Estimates, February 8, 2023.
23 Corn used to produce ethanol and by-products including, distillers’ grains, corn gluten feed, corn gluten meal, and corn oil.
22 | 2023 AG INDUSTRY INSIGHTS AND PERSPECTIVES
2020/21 2021/22 2022/2321 2023/2422 Acres planted (mil. ac.) 90.7 93.3 88.6 91.0 Area harvested 82.3 85.3 79.2 83.1 Yield (bu./ac.) 171.4 176.7 173.3 181.5 Production (mil. bu.) 14,111 15,074 13,730 15,085 Beginning stocks 1,919 1,235 1,377 1,267 Imports 24 24 50 25 Supply 16,055 16,333 15,157 16,377 Feed & Residual 5,607 5,718 5,275 5,600 Ethanol23 5,028 5,326 5,250 5,250 Total food, seed & industrial 6,467 6,766 6,690 6,690 Total domestic use 12,074 12,484 11,965 12,290 Exports 2,747 2,471 1,925 2,200 Total use 14,821 14,956 13,890 14,490 Ending stocks 1,235 1,377 1,267 1,887 Stocks/use (percent) 8.3 9.2 9.1 13.0 Season-avg farm price ($/bu.) 4.53 6.00 6.70 5.60
Poultry
A Review of 2022
The impacts of COVID-19 continue to affect the poultry industry, even years after the height of the pandemic. When shutdowns occurred in 2020, food service needs changed drastically and significantly altered demands on the poultry industry. In 2022 when life started returning to normal, food service shifted back to pre-COVID lifestyle with more people going back out to eat, schools serving meals again, and the industry having to adjust to previous market demands.
Given placements of birds had returned to normal, and live weights have increased prior to 2022, the supply of chicken was abundant going into fourth quarter 2022.24
Egg markets were also affected by the massive change in consumer behaviors from pre-COVID to post-COVID and coupling that with the outbreak of Highly Pathogenic Avian Influenza (HPAI). Nationally, HPAI eliminated a large number of
layer flocks in 2022, resulting in a challenging year for egg markets. On a positive note, record high prices were set for broilers and turkeys. Within the Horizon Farm Credit territory, the HPAI outbreaks impacted more than just the farms with an outbreak. Farms located in HPAI control areas experienced longer layouts during times when outbreaks were in their area. However, in the areas where HPAI was not as prevalent, layout times for birds returned to a more normal schedule in 2022, similar to those experienced pre-COVID.
Other updates within Horizon Farm Credit’s territory in 2022 included several integrators bringing new processing facilities online and others remodeling facilities. Integrators within the regions were also looking to expand and increase square footage, however high material cost and rising interest rates have delayed much of this from happening.
Key Factors Influencing the Industry
HPAI is a concern for the poultry industry across the United States. Outbreaks continue to impact farms across Horizon Farm Credit’s footprint, with confirmed positive flocks being euthanized and layouts being extended on farms within the control area. As a result of the outbreaks, there has been a decrease in egg inventory, resulting in skyrocketing prices at market. Additionally, due to the destruction of turkey flocks, the turkey export market has been limited. While integrators are looking to increase square footage, this is being hampered by the current interest rate market, coupled with the increased cost of construction. Supply chain constraints result in delays in receiving parts and equipment needed by growers to repair or upgrade existing
houses. High grain and feed prices continue to affect net profit margins. High interest rates delay construction and other purchases.
As with all agricultural industries, labor shortages and environmental issues are prevalent in the poultry industry. It is difficult to find laborers to work on farms and in processing plants. Environmental regulations make poultry operations and expansions a more challenging process.
Animal welfare continues to play a role in poultry production, with more layer operations converting to cage free, organic operations requiring more management such as birds to roam outside during optimal temperatures, and the continued improvement in growing conditions for all types
2023 AG INDUSTRY INSIGHTS AND PERSPECTIVES | 23
24 Brian Earnest, CoBank, Poultry Situation and Outlook 2023.
Broiler Production Forecast Adjusted Up in 2023
of poultry production. Consumer demands for healthy chicken and eggs will require the poultry industry to focus on animal welfare issues in order maintain long-term sustainability.
January 2023 broiler production totaled 3.963 billion pounds, an increase of 7.4 percent over January 2022. This is a result of both higher slaughter (6.1 percent over January 2022) and an average weight of 6.55 pounds, the highest ever for January. A revision to December data brought the 2022 total up by 5 million pounds to 46.206 billion pounds. The first-quarter broiler production projection was adjusted up to 11.4 billion pounds on the strength of January production. This would be 2 percent higher than the first quarter of 2022. The annual production forecast for 2023 is 46.750 billion pounds, an increase of 1.2 percent over the 2022 total.
On positive note, while the past few years have experienced lower bird placements, a record of 6.6+ lb. birds of average live weight was experienced in 2022, a new record high, thus offsetting the lower numbers of birds being placed.
Exhibit 17: Monthly Broiler Production and Average Live Weights
Monthly average live weights, 2018–2023 Pounds
Source: Livestock, Dairy, and Poultry Outlook, March 2023, https://www.ers.usda.gov/webdocs/outlooks/106119/ldp-m-345.pdf?v=1399.3
Trade markets will also continue to affect the poultry industry, with Brazil expected to lead with the most exports. This can be attributed to the restrictions currently placed on locations experiencing HPAI, and at this time, Brazil
Broiler meat in cold storage fell seasonally from the end of December to the end of January, but it was still 12.3 percent higher than last January's levels. The category of "other parts and forms" still makes up the largest portion of the broiler meat in cold storage. Leg quarters in cold storage had the largest absolute decrease, falling 17.8 million pounds from last January. Breasts and breast meat increased the most from last January, adding 78.1 million pounds. Based on the overall strength in stocks, the 2023 ending stocks projection was adjusted up to 860 million pounds.
remains free of the disease. The restrictions placed on the U.S. are generally localized to a state or county, as opposed to the entire country. Given this ongoing threat, significant expansion within the industry will continue to be hampered.
Perspectives and Projections for the Year Ahead
The poultry industry across the Horizon Farm Credit territory is expected to remain strong in 2023, with some challenges. HPAI is expected to significantly impact the industry again this year, along with high production costs.
As consumers begin to experience budgetary constraints as a result of inflation and rising interest
rates, consumption of cheaper protein sources is expected to increase. The graph on the next page shows USDA’s supply and demand estimates on red meat and poultry production with expected strong increases in both broilers and turkeys.
Livestock, Dairy, and Poultry Outlook: March 2023, LDP-M-345, March 14, 2023. USDA, Economic Research Service
24 | 2023 AG INDUSTRY INSIGHTS AND PERSPECTIVES
17
Grace Grossen and Adriana Valcu-Lisman
Source: USDA, National Agricultural Statistics Service.
3.0 3.2 3.4 3.6 3.8 4.0 4.2 4.4 2021 2022 2023 2018-2022 Average Monthly broiler production, 2018–2023 Billion pounds 6.1 6.2 6.3 6.4 6.5 6.6 6.7 2021 2022 2023 2018-2022 Average
decline since 2015. After 2 consecutive years of decline, commercial pork production is forecast to increase in 2023 on higher slaughter and fractionally higher carcass weights. Broiler meat production forecast to continue its longstanding upward trend into 2023, increasing marginally over last year’s record production. Turkey production is expected to increase throughout 2023, under the assumption that the sector recovers from Highly Pathogenic Avian Influenza outbreaks.
Exhibit 18: Year-Over-Year Changes in Red Meat and Poultry Production
Year-over-year changes in red meat and poultry production
Source: Livestock, Dairy, and Poultry Outlook, March 2023, https://www.ers.usda.gov/webdocs/outlooks/106119/ldp-m-345.pdf?v=1399.3
There is opportunity for expansion within the broiler industry in the region. Several integrators have been looking to add new facilities to increase square footage to keep up with demand. However, high interest rates challenge the industry. Construction costs, while lower than 2022, are still a concern for expansions. On the Delmarva peninsula, there are openings for new growers to enter the industry with existing poultry farms being sold by farmers looking to exit the industry.
In the layer industry, there could also be additional expansion, but it will be impacted by high construction and interest rates as well. While egg prices have eased up slightly in the short term, HPAI could continue to impact the price of eggs paid by consumers, although for the 2023 calendar year USDA ERS is projecting eggs will average 212.0 cents per dozen; as depicted in the table on the next page this is decline from prices realized in 2022.

2023 AG INDUSTRY INSIGHTS AND PERSPECTIVES | 25
Approved by USDA’s World Agricultural Outlook Board
0.24 0.62 -0.30 -2.00 -1.50 -1.00 -0.50 0.00 0.50 1.00 1.50 2.00 -2,000 -1,500 -1,000 -500 0 500 1,000 1,500 2,000 2021 2022 2023 Turkey Broilers Pork Beef Percent change in total red meat and poultry
Source: USDA, World Agricultural Supply and Demand Estimates
Million pounds Percent
Weekly average midpoint prices for New York eggs (wholesale, large grade A)
Exhibit 19: Weekly Average Midpoint Prices for New York Eggs
Cents per dozen
Source: USDA, Economic Research Service using data from USDA, Agricultural Marketing Service.
Source: Livestock, Dairy, and Poultry Outlook, March 2023, https://www.ers.usda.gov/webdocs/outlooks/106119/ldp-m-345.pdf?v=1399.3
Egg Exports Continue To Decline
Source: USDA, Economic Research Service using data from the U.S. Department of Commerce, Bureau of the Census.
Turkey Prices Adjusted Up in 2023
Within the turkey industry, prices remain high and are expected to stay high with supplies trending below consumption. This year brings challenges of higher input costs and potential consumer resistance to higher price levels.
Wholesale prices for frozen whole hen turkeys have been relatively steady in the first 2 months of the year, averaging 172 cents per pound in January and 168.92 cents per pound in February. Prices averaged 171.5 cents per pound in the week ending March 3rd. Quarterly forecast prices for 2023 are unchanged from last month.
Driven by reduced domestic egg supplies and firm wholesale egg prices, the monthly exports continue to trend year-over year lower. January exports of eggs and egg products totaled 15.6 million dozen shell-egg equivalent, a 28.6-percent year-over-year decrease. Shipments of both shell eggs (- 8.1 percent) and egg products (-54.2 percent) fell below year-earlier levels. The destinations of most shipments (87 percent) were Canada (38.8 percent), Mexico (26.3 percent), the Caribbean (Jamaica, Bahamas, Trinidad and Tobago) (11.5 percent), and Japan (10.6 percent). Canada and Bahamas were the only major markets with shipments year-overyear higher. No changes are made to the current egg import forecast for 2023.
Exhibit 20: Weekly Wholesale Frozen Hen Turkey Prices and Quarterly Price Forecasts
Weekly wholesale frozen hen turkey prices and quarterly price forecasts Cents per
January 2023 egg imports were estimated at 2.2 million dozen shell-egg equivalent,70.8 percent higher than last year. Shell-egg imports totaled 1.1 million dozen, with the remainder of the imports being egg products. The first five major partners supplying more than 90 percent of U.S. egg imports were Canada (26.4 percent), Turkey (33.5 percent), China (15.4 percent), Thailand (9.9 percent), and Brazil (5.9 percent). At 26.0 million dozen, the total egg import forecast for 2023 is unchanged from the last report.
Turkey Production Projection Increased in Q1 2023
January turkey production totaled 445.2 million pounds, just slightly higher than last January. January 2023 had 2 percent more turkeys slaughtered, with an average weight of 32.71 pounds, 1.4 percent lower than last January. Projected first-quarter production is adjusted up by 25 million pounds to 1.360 billion pounds. This is still 1 percent lower than the first quarter of 2022. The remaining quarters' production forecasts are unchanged, making the annual total 5.585 billion pounds. Turkey meat in cold storage totaled 284.5 million pounds at the end of January. This is 11.8 percent below the 5-year average but is an increase of 16.7 percent from the same time last year. Based on this strength and a higher first-quarter production forecast, the forecast for 2023 ending stocks is adjusted up to 200 million pounds.
Source: USDA, Agricultural Marketing Service and USDA, World Agricultural Supply and Demand Estimates
Source: Livestock, Dairy, and Poultry Outlook, March 2023, https://www.ers.usda.gov/webdocs/outlooks/106119/ldp-m-345.pdf?v=1399.3
Prices are projected to remain stable for 2023 in the broiler sector based on the quarterly forecast for 2023. (Source Livestock, Dairy and Poultry Outlook, March 2023, USDA Economic Research Service)
Livestock, Dairy, and Poultry Outlook: March 2023, LDP-M-345, March 14, 2023. USDA, Economic Research Service
26 | 2023 AG INDUSTRY INSIGHTS AND PERSPECTIVES
23
50 150 250 350 450 550 1 5 9 13 17 21 25 29 33 37 41 45 49 53 Week of the year 2020 2021 Average 2017–2019 2022 2023
25 Livestock, Dairy, and Poultry Outlook: March 2023, LDP-M-345, March 14, 2023.
0 10 20 30 40 50 60 2021 2022 2023 2018-22 Average Monthly turkey meat exports, 2018–2023 Million pounds 0 2 4 6 8 10 12 14 2021 2022 2023 2018-22 Average Monthly turkey meat imports, 2018–2023 Million pounds 171 162 155 160 0 20 40 60 80 100 120 140 160 180 200 Jan Feb Mar Apr May Jun Jul Aug Sep Oct Nov Dec 2023 Quarterly Forecast 2021 2022 2023 2020-2022 Average
pound
Exhibit 21: Weekly National Composite Broiler Prices and Quarterly Price Forecasts
Weekly national composite broiler prices and quarterly price forecasts Cents per pound
2023 Quarterly Forecast
2023
2020-2022 Average
Source: USDA, Agricultural Marketing Service and USDA, World Agricultural Supply and Demand Estimates
Source: Livestock, Dairy, and Poultry Outlook, March 2023, https://www.ers.usda.gov/webdocs/outlooks/106119/ldp-m-345.pdf?v=1399.3
2023 Table-egg Production Revised Down
As in all agricultural industries, there are many variables affecting the poultry industry, yet the region’s poultry industry is well-positioned for another strong year across its many sectors.

The Chickens and Eggs Annual Summary report released by USDA, NASS in February brought several upward revisions to the total egg production and the chicken inventory for December 2020–November 2022. According to these changes, 2022 total table egg production was estimated at 7,781.0 million dozen eggs 3.1-percent year-over-year lower, and hatching egg production was estimated at 1,293.8 million dozen eggs—2.0-percent year-over-year higher Following the loss of more than 43 million layers to HPAI during 2022, the monthly average size of the table-egg laying flock was 310.9 million about 4.5-percent year-over-year lower.
Year-over-year percent change in monthly table egg production, average table egg layer inventory, and average lay rate 2022–January 2023
egg production
Source: USDA, Economic ResourceService using data from USDA, National Agricultural Statistics Service.
January table-egg production was estimated at 646.9 million dozen eggs, a 7.3-percent yearover-year decrease. The year-over-year change was due to a 6.1-percent decrease in the average size of the laying flock and a 1 26-percent decrease in the layer flock productivity as
Livestock, Dairy, and Poultry Outlook: March 2023, LDP-M-345, March 14, 2023. USDA, Economic Research Service
2023 AG INDUSTRY INSIGHTS AND PERSPECTIVES | 27 21
123 127 128 129 0 20 40 60 80 100 120 140 160 180 Jan Feb Mar Apr May Jun Jul Aug Sep Oct Nov Dec
2021 2022
-8 -6 -4 -2 0 2 4 Jan. Feb. Mar. Apr. May. Jun. Jul. Aug. Sep. Oct. Nov. Dec. Jan. 2022 2023
Table
Table
Lay
Percent
egg layer inventory
rate


