


MEETING AGENDA
Friday 19th
5:00 a.m. - 5:30 a.m. - Breakfast
5:30 a.m. - 5:50 a.m. - Worship
5:50 a.m. - 6:50 a.m. - Session I
6:50 a.m. - 7:05 a.m. - Break
7:05 a.m. - 8:50 a.m. - Session II
8:50 a.m. - 9:00 a.m. - Break
9:00 a.m. - 10:30 p.m. - Session III
10:30 a.m. - 10:45 a.m. - Break
10:45 a.m. - 12:00 p.m. - Session IV
Saturday 20th
5:00 a.m. - 5:30 a.m. - Breakfast
5:30 a.m. - 5:50 a.m. - Worship
5:50 a.m. - 6:50 a.m. - Session V
6:50 a.m. - 7:05 a.m. - Break
7:05 a.m. - 9:05 a.m. - Session VI
9:05 a.m. - 9:20 a.m. - Break
9:20 a.m. - 10:45 a.m. Session VII
10:45 a.m. - 11:00 a.m. Break
11:00 a.m. - 12:00 p.m. - Session VIII
12:00 p.m. - Dismiss
Sunday 21st - FREE DAY
Monday 22nd
5:00 a.m. - 5:30 a.m. - Breakfast
5:30 a.m. - 5:50 a.m. - Worship
5:50 a.m. - 6:50 a.m. - Session IX
6:50 a.m. - 7:05 a.m. - Break
7:05 a.m. - 8:45 a.m. - Session X
8:45 a.m. - 9:00 a.m. - Break
9:00 a.m. - 10:45 a.m. Session XI
10:45 a.m. - 11:00 a.m. Break
11:00 a.m. - 12:00 p.m. - Session XII
12:00 p.m. - Dismiss

DAY ONE
Restoring Lives, Restoring Families, Restoring Communities
Admissions Pay Scale and Incentive Pay
Hope Center’s Admissions Coordinators will be compensated based on their performance in three categories:
1. Paid Admissions
2. Health Check Score
3. Departure Rate
Both their annual salary and their incentive pay eligibility will be determined by their production in these measurables Their annual salary will be evaluated each November based on their performance from November of the previous year through October of the current year. The annual salary will take effect in January of the following year.
Incentive pay will awarded to Admissions Coordinators on a trimester (every four months) basis. The trimesters will be January through April, May through August, and September through December. Incentive pay will direct deposited no later than the last day of the first month of a new trimester (May 31, September 30, January 31).
The two charts below will show the salary scale and incentive pay eligibility
Salary Scale Level Criteria Annual Salary Peak - 28+ Average of Total AND Paid Admissions per Month - 58 percent Departure Rate or less - 3.75-4.0 Health Check $70,000 Phenomenal - 25-27 Average of Total AND Paid Admissions per Month - 58 percent Departure Rate or less - 3.5-3.74 Health Check $64,000 Professional - 20-24 Average of Total AND Paid Admissions per Month - 59-61 percent Departure Rate - 3.25-3.49 Health Check $58,000 Proficient - 15-19 Average of Total AND Paid Admissions per Month - 62-64 percent Departure Rate - 3.0-3.24 Health Check $52,000 Potential - 10-14 Average of Total AND Paid Admissions per Month - 64-67 percent Departure Rate - 2.75-2.99 Health Check $46,000 Poor - Less than 10 Average of Total AND Paid Admissions per Month - 68 percent Departure Rate or Greater - Less than 2.75 Health Check $40,000
Restoring Lives, Restoring Families, Restoring Communities Incentive
Pay Eligibility Level Criteria Incentive Pay per Trimester Peak - 28+ Average of Total AND Paid Admissions per Month - 58 percent Departure Rate or less - 3.75-4.0 Health Check $5,000 Phenomenal - 25-27 Average of Total AND Paid Admissions per Month - 58 percent Departure Rate or less - 3.5-3.74 Health Check $4,000 Professional - 20-24 Average of Total AND Paid Admissions per Month - 59-61 percent Departure Rate - 3.25-3.49 Health Check $3,000 Proficient - 15-19 Average of Total AND Paid Admissions per Month - 62-64 percent Departure Rate - 3.0-3.24 Health Check $2,000 Potential - 10-14 Average of Total AND Paid Admissions per Month - 64-67 percent Departure Rate - 2.75-2.99 Health Check $1,000 Poor - Less than 10 Average of Total AND Paid Admissions per Month - 68 percent Departure Rate or Greater - Less than 2.75 Health Check Ineligible


0 - Unacceptable
1 - Needs Improvement
2 - Meets Model (Pending To-Do List)
3 - Meets Model
4 - Exceeds Model
Add Admissions Health Check
Add Admissions Health Check
Admissions Coordinator Name **
Admissions Coordinator Name
Name of Person Conducting the Health Check
Name of Person Conducting the Health Check **
Date of Health Check
Date of Health Check **
04/09/2024
Networking: Provide names and numbers of the referral sources as well as the results they have produced. (number of admissions, funds, etc.) produced. (number of admissions, funds, etc.) **
Networking: Provide names and numbers of the referral sources as well as the results they have
Networking To Do List Networking To Do List **
Networking Score Networking Score **
Select...
Admissions: What is your departure rate? **
Admissions: What is your departure rate?
Admissions: How many paid admissions do you average each month?
Admissions: How many paid admissions do you average each month? **
4/9/24, 3:34 PM Board411 https://hcm knack com/hcm#admissions-health-check/ 1/3 Health Check Score Guide Health Check Score Guide
Admissions: What is your Hope for Recovery balance?
Admissions: What is your Hope for Recovery balance? **
Admissions To Do List Admissions To Do List **
Admissions Score Admissions Score **
Select
Systems: Are your legal reports completed monthly? **
Systems: Are your legal reports completed monthly?
Systems: Have you completed all of your Initial Contact Forms?
Systems: Have you completed all of your Initial Contact Forms? **
Systems: Have you turned your PEX receipts in weekly?
Systems: Have you turned your PEX receipts in weekly? **
Systems: Are you staying within the budgeted expense account? Explain.
Systems: Are you staying within the budgeted expense account? Explain. **
Systems To Do List Systems To Do List **
Systems Score Systems Score **
Select
Extra Credit: Do you have any interns? If so, who?
Extra Credit: Do you have any interns? If so, who? **
4/9/24, 3:34 PM Board411 https://hcm knack com/hcm#admissions-health-check/ 2/3
Extra Credit: Have you referred any new hires? If so, who?
Extra Credit: Have you referred any new hires? If so, who? **
Extra Credit: What is your YTD funds raised?
Extra Credit: What is your YTD funds raised? **
Extra Credit Score Extra Credit Score **
Select...
4/9/24, 3:34 PM Board411 https://hcm knack com/hcm#admissions-health-check/ 3/3
Crisis meetings will begin in May 2 at 9 am CT and will be the first and third Thursday of each month
Admissions Coordinator Average Paid Admissions Average Paid + Unpaid Admissions Average Total Admissions Trimester P.A. Goal Level Pennie Pyle 6 8 7 18 Poor Chereta Hale 14 12 13 12 Potential James Rummage 11 30 17 25 Proficient Cory Nabors 5 8 6 12 Poor Julie Higgins 19 25 21 25 Professional Paula Reed 3 6 4 5 Poor Royse Vaughn 12 24 16 25 Proficient Derrick Harwood 5 12 7 14 Poor Angie Coleman 0 2 1 12 Poor Robb Yost 6 7 6 15 Poor Chrystal Damesworth 3 4 3 8 Poor Ginger Vandevort 2 3 3 8 Poor Patty Johnson 7 15 9 18 Poor Neil Dickerson 19 22 20 16 Professional Sarah Lister 7 14 9 11 Poor Tommie Jo Walker 4 14 7 10 Poor Jackie Rodriguez 5 7 6 14 Poor Lutisha McFarland 9 8 8 15 Poor
Restoring Lives, Restoring Families, Restoring Communities
Minimizing Damage in the Trials
H.E.A.R.T.
H - Healthy Communication
Prioritize open, honest, and respectful dialogue. The goal is to maintain or restore relationships by making sure that the lines of communication are a bridge that can lead to healing and collaboration.
E – Empathy
Being empathetic shows that you value the feelings of others. Empathy is crucial for connecting with referral partners, VT partners, and the community as a whole on a deep, meaningful level.
A – Accountability
Show a commitment to acknowledging and taking responsibility for actions and decisions. This transparency will help build and maintain trust with invested partners
R - Resilience
View challenges as opportunities for growth and strengthening the organization. Learn to adapt and recover from difficulties,
T - Teamwork
Work collaboratively to utilize the strengths of each team member to overcome obstacles, achieve goals, and enhance the ministry's impact.
Restoring Lives, Restoring Families, Restoring Communities
Vetting Suggestions/Questions/Coaching
**Prequalifying New Application vs. Existing Application (Saving Time)
New Application Pre-Qualification Questions
• Detox?
• Sexual Offenders List?
• SSDI? (Disability)
• Meds/MAT?
• VA Disability? (What Percentage?)
***Proceed To Full Application/ICF Vetting If Qualified
Existing Applications/ICF Vetting
Detox
• DOC (opiates, benzos, alcohol, stimulates)
• Last Use
• Area/County for Referral Location
Christian/Faith-Based Non-Profit Program
• Biblical Application/Interaction
• Church Attendance/Bible Studies/Curriculum Requirements
• Not Required To Be A Professing Christian, But We Are A Christian Ministry That Holds Biblical Values/Teachings/Expectations Without Denominational Debate
Vocational Training Requirement/Expectations
• Second Phase VT Assignment 40 hrs. weekly
• Not An Employment Agreement/Volunteer
• Physically/Mentally Capable of Participating in A Factory-Like Setting/Social Interaction
Medications
Restoring Lives, Restoring Families, Restoring Communities
• Approved/Unapproved
• Not An MAT Program
• Medical Professional Approval of Substitutions
Medical Conditions ( Best Practices)
• Communicable Diseases
• Diabetes/Chronic Seizures
• Debilitating Conditions
Legal Status
• Probation/Parole/Pretrial/Furlough
• Pending Dates, Warrants, Multiple Counties
• CPS/DSS
• Sexual Offenders List
Funding/Admission Fees
• Non-Refundable
• Graduation Gift/Benevolence
• Who Can Help You?/HFR Option
**Most Asked Questions** (Phones, Healthy Family Interaction/Approved Visitors, Smoking Policy, "What Can I Bring?", Shared Rooms/Bunk Beds, Graduation/Exit Strategy, etc.)
**Finish With Communication Commitment (Texts?) For Detox, Placement Location, Date/Time, Payment Agreement (Online/At Center?)
YOU DO NOT HAVE TO TELL A POTENTIONAL RESIDENT WHY THEY ARE NOT BEING APPROVED. HOWEVER, YOU MUST REFER THEM TO ANOTHER RESOURCE.
DAY TWO
Region District Location Max Capacity Occupancy Current Occupancy % 1st Phase Notes of What's Coming Up: Date: Wichita Falls, TX 30 27 90% 7 Holliday, TX 30 26 87% 7 Vernon, TX 30 24 80% 1 DISTRICT TOTALS 90 77 86% 15 Temple, TX 30 27 90% 6 DISTRICT TOTALS 30 27 90% 6 Purcell, OK 42 33 79% 3 Oklahoma City, OK 35 34 97% 5 Bethany, OK 37 35 95% 3 Tulsa, OK (M) 34 27 79% 9 DISTRICT TOTALS 148 129 87% 20 Sulphur, OK (W) 30 18 60% 10 Ada, OK (M) 32 30 94% 5 New Center Launch 2024 DISTRICT TOTALS 62 48 77% 10 REGIONAL TOTALS 330 281 85% 51 Helena, MT 34 22 65% 4 Butte, MT 22 21 95% 3 DISTRICT TOTALS 56 43 77% 7 Kailua, HI 36 19 53% 2 DISTRICT TOTALS 36 19 53% 2 Miami, FL 30 27 90% 4 DISTRICT TOTALS 30 27 90% 4 REGIONAL TOTALS 122 89 73% 13 Waverly, TN 36 31 86% 1 Camden, TN 34 30 88% 6 Paris, TN (W) 36 30 83% 4 McEwen, TN (M) 30 26 87% 2 Paris, TN (M) 34 24 71% 4 DISTRICT TOTALS 170 141 83% 17 Sikeston, MO 32 30 94% 2 Kennett, MO New Center Launch 2023 or later DISTRICT TOTALS 32 30 94% 2 Union City, TN (M) 30 18 60% 2 New Center Launch Fall 2023 Memphis, TN 30 24 80% 1 DISTRICT TOTALS 60 42 70% 3 Columbia, TN 30 19 63% 5 Hohenwald, TN 32 32 100% 4 Hohenwald, TN (W) 30 28 93% 3 DISTRICT TOTALS 92 79 86% 12 Springfield, TN 30 28 93% 1 Clarksville, TN 34 34 100% 6 Dickson, TN (W) 30 29 97% 5 Dickson, TN 35 34 97% 4 DISTRICT TOTALS 129 125 97% 16 Rickman, TN 31 29 94% 3 White House, TN 29 27 93% 4 Portland, TN 30 27 90% 5 DISTRICT TOTALS 90 83 92% 12 REGIONAL TOTALS 573 500 87% 62 Belpre, OH 30 13 43% 3 Parkersburg, WV 34 26 76% 4 DISTRICT TOTALS 64 39 61% 7 Wheeling, WV 36 27 75% 6 DISTRICT TOTALS 36 27 75% 6 Greenville, PA 38 25 66% 5 Kittanning, PA (M) 28 8 29% 1 Greenville, PA (W) New Center Launch 2023 or later DISTRICT TOTALS 66 33 50% 6 REGIONAL TOTALS 166 99 60% 19 Axton, VA 34 32 94% 6 Danville, VA (M) 30 31 103% 7 Roanoke, VA 2023 DISTRICT TOTALS 64 63 98% 13 Galax, VA 34 40 118% 6 Wytheville, VA 34 35 103% 4 Mt. Airy, NC (M) 32 29 91% 7 2023 DISTRICT TOTALS 100 104 104% 17 Suffolk, VA (W) 16 11 69% 5 Waiting on Occupancy letter Princeton, NC (M) New Center Launch (28 beds at Open) 2023 or later DISTRICT TOTALS 16 11 69% 22 Dunn, NC 30 25 83% 3 Goldsboro, NC 30 28 93% 2 Goldsboro, NC (W) 34 31 91% 5 DISTRICT TOTALS 94 84 89% 10 DISTRICT TOTALS Pelzer, SC 34 32 94% 5 DISTRICT TOTALS 34 32 94% 5 Florence, SC (W) 30 11 37% 8 New Center Launch 2024 Conway, SC 34 22 65% 8 DISTRICT TOTALS 64 22 34% 8 REGIONAL TOTALS 372 316 85% 75 HCM OVERALL TOTALS 1563 1285 82% 228 Decision : No more than 34 (max capacity) anywhere. Need to Hire (New District) Need to Hire (Existing District) New Locations Launching Tommie Jo Walker Southwest Virginia Need to Hire East Virginia/North Carolina Neil North Carolina Need to Hire North Carolina Sarah South Carolina Derrick Harwood Central Tennessee Robb Robb Ohio Chrystal Wheeling, WV Ginger Pennsylvania Neil Patty South Central Virginia Casea Love South Carolina Patty Lutisha Montana Jeremy Brown Hawaii Jackie Florida JULIE Julie Midwest Tennessee Paula Missouri Angela Coleman Chereta Hale Southern Tennessee Royse Vaughn 2024 Max Capacity vs Occupancy Date 04/16/2024 James Pennie North Central Texas Katonya Davis Temple TX James Southern Oklahoma Cory Nabors


2020 2025 Projections


14,837.94 Dec '21 Dec '22 Dec '23 Dec '24 Dec '25 Dec '26 Total Residents 618 974 1,236 1,392 1,548 1,808 Total Employees 84 112 139 159 182 205 Total Admissions 1,569 2430 3,082 3,240 3,466 3,696 Total Baptisms 571 1015 1,580 1,786 2,068 2,350 Total Graduations 268 366 590 709 745 797 Total Reach 9,270 14,610 18,540 20,880 23,220 27,120 Total Locations (excluding aftercare) 32 41 50 58 67 76 Locations wo UK 29 38 47 55 63 72 Hope Center Ministries Projections 84 112 139 159 182 205 32 41 50 58 67 76 618 974 1,236 1,392 1,548 1,808 Dec '21 Dec '22 Dec '23 Dec '24 Dec '25 Dec '26 0 500 1000 1500 2000 0 50 100 150 200 250
Total Employees Total Locations (excluding aftercare) Total Residents


Admissions Coordinator Data Jan-Dec 21 Jan-Dec 22 Jan-Dec 23 Difference % Total Admissions (with Call Center) 1550 2430 3082 27% Total Admissions (Admissions Coordinators) 1550 2306 2722 18% Average Monthly Admissions 129 192 227 18% Average Admissions Coordinators 11 15 19 27% Admissions per Admissions Coordinator 138 154 143 -7% Monthly Admissions per Admissions Coordinator 12 13 12 -7% Average Centers 24 33 43 30% Admissions per Center 65 71 64 -9% Monthly Admissions per Center 5.4 5.9 5.3 -9%
Admissions per admission coordinator DECREASED by 7% in 2023. Admissions per center DECREASED by 9% in 2023. 60 62 64 66 68 70 72 130 135 140 145 150 155 Jan-Dec 21 Jan-Dec 22 Jan-Dec 23 Admissions per Admissions Coordinator Admissions per Center
Admissions Coordinator Year Over Year Comparison
Year over Year Comparison 2022 v 2023
Admissions Coordinator 23 Avg Admissions 22 Admissions 23 Avg Paid Admissions 22 Paid Admissions 23 Dept Rate 22 Dept Rate 23 Fundraising 22 Fundraising 23 Occupancy 22 Occupancy Julie Utley Higgins* 29 26 30 24 45% 45% 158,458 $ 165,748 $ 84% 95% James Rummage 30 19 29 11 49% 51% 95,167 $ 15,222 $ 95% Neil Dickerson 20 16 23 14 47% 47% 156,205 $ 75,960 $ 68% 67% Patricia Johnson 17 15 20 13 41% 42% 115,018 $ 101,573 $ 55% 86% Pennie Pyle 11 17 51% 34,949 $ 76% Royse Vaughn 20 22 16 19 62% 46% 71,085 $ 177,772 $ 84% 83% Robb Yost* 10 11 12 9 43% 49% 86,579 $ 58,850 $ 73% 52% Lutisha McFarland* 10 5 10 4 50% 70% 97,259 $ 35,848 $ 66% 61% Derrick Harwood 10 10 26% 9,726 $ 96% Sarah Lister 9 9 55% 60,214 $ 64% Jacqueline Rodriguez 6 5 9 4 54% 38% 45,741 $ 26,946 $ 61% 51% Chereta Hale Vaughn 10 11 51% 12,743 $ 77% Paula Reed 6 5 11 4 55% 25% 43,086 $ 28,307 $ 91% 84% Benjamin Zimmer 4 6 40% 24,907 $ 69% Chrystal Damesworth 4 11 39% 19,407 $ 57% Tommie Jo Walker 9 6 7% 2,117 $ 95% Ginger Vandevort 5 13 20% 3,700 $ 69% *used monthly stats FR number Above average Below average
Move 29 VTE from bottom to the top = $264k in the first 3 months
12 months = $1,057,889
Could we start a Hope Center and lead 36 more people to Christ?
Did you know that approximately 36 individuals choose baptism in the first twelve months of a new Hope Center?
Location VTE Ph2 Ph2 % VT Rate Occupancy Rate Top 10 VA-Galax-M 25 27 91% 18.27 $ 100% Bottom 10 TN-Dickson-M 23 25 90% 20.51 $ 93% OK-Purcell-W 23 26 87% 18.34 $ 95% OK-Bethany-M 22 24 94% 18.33 $ 96% VA-Axton-M 22 25 91% 16.74 $ 96% OK-Oklahoma City-M 22 27 84% 18.39 $ 97% VA-Wytheville-W 21 25 84% 17.27 $ 97% TN-Hohenwald-M 21 24 88% 20.23 $ 102% TN-Clarksville-M 20 22 90% 17.96 $ 100% TN-Springfield-M 20 23 85% 21.17 $ 101% TN-Waverly-M 19 24 78% 18.81 $ 90% TN-McEwen-M 19 21 92% 19.85 $ 94% TN-Dickson-W 19 21 88% 18.05 $ 94% TN-Rickman-M 18 22 81% 15.35 $ 96% NC-Goldsboro-M 18 22 79% 15.74 $ 98% TN-Portland-W 17 20 87% 15.34 $ 95% TN-Paris-W 17 23 77% 18.72 $ 94% SC-Pelzer-M 17 24 70% 15.25 $ 94% TN-Camden-M 16 19 86% 19.05 $ 79% TX-Temple-M 15 19 77% 19.82 $ 85% VA-Danville-M 15 21 70% 17.90 $ 96% TN-White House-M 15 21 71% 16.93 $ 88% WV-Wheeling-M 15 17 88% 18.86 $ 79% NC-Dunn-M 15 19 75% 16.15 $ 90% TN-Paris-M 14 17 80% 19.46 $ 74% NC-Mt Airy-M 14 21 65% 18.94 $ 86% TN-Hohenwald-W 13 20 68% 20.70 $ 88% MT-Helena-W 13 17 76% 18.02 $ 77% TX-Wichita Falls-M 13 18 73% 17.01 $ 83% MO-Sikeston-M 12 23 55% 20.07 $ 100% TX-Vernon-M 12 16 74% 14.52 $ 74% NC-Goldsboro-W 12 23 51% 14.06 $ 97% OK-Ada-M 12 21 55% 16.81 $ 96% HI-Kailua-M 11 13 86% 19.33 $ 64% PA-Greenville-M 11 19 58% 20.24 $ 67% WV-Parkersburg-M 11 23 47% 13.95 $ 90% TX-Holliday-W 10 14 70% 16.82 $ 70% SC-Conway-M 9 18 53% 15.49 $ 69% TN-Union City-M 9 12 77% 19.82 $ 53% TN-Memphis-M 9 11 85% 19.10 $ 66% FL-Miami-M 9 17 49% 12.63 $ 85% OK-Sulphur-M 6 26 24% 16.80 $ 104% MT-Butte-M 6 13 47% 26.79 $ 77% TN-Columbia-M 6 12 49% 19.60 $ 53% OH-Belpre-M 3 12 29% 18.57 $ 49% OK-Sulphur-W 2 5 54% 15.75 $ 36% OK-Tulsa-M 2 16 13% 12.88 $ 73% VA-Suffolk-W 1 9 13% 17.00 $ 74% PA-Kittanning-M 1 7 9% 18.64 $ 34% SC-Florence-W 0 3 0% - $ 15% Grand Total 675 946 71% 18.02 $ 83%
WHAT COULD WE DO WITH $1 MILLION? VTE = VOCATIONAL TRAINING EQUIVALENT
VTE 2024 - Jan-Mar
The number of open beds has stayed up , even though the number of startup beds have gone down since May 2023.
Bed Analysis (Jul22-Mar24)
Is there no longer a correlation between Open Beds and "Startup Beds"?
Since May 2023, Open Beds exceed Startup Beds.
Jul 22 Aug 22 Sep 22 Oct 22 Nov 22 Dec 22 2022 Avg Jan 23 Feb 23 Mar 23 Apr 23 May 23 Jun 2023 Jul 2023 Aug 2023 Sep 2023 Oct 2023 Nov 2023 Dec 2023 2023 Avg Jan 2024 Feb 2024 Mar 2024 2024 Avg Capacity 989 1007 990 994 1066 1206 963 1164 1188 1221 1267 1291 1300 1334 1394 1406 1406 1428 1453 1321 1460 1487 1519 1489 Occupancy 828 873 887 906 935 1003 819 974 1009 1015 1028 1023 1076 1087 1108 1145 1171 1182 1229 1087 1234 1273 1269 1259 Open Beds 161 134 103 88 131 202 144 190 179 206 239 267 224 247 286 261 257 245 233 236 226 245 268 246 Occupancy Rate 84% 87% 90% 91% 88% 83% 85% 84% 85% 83% 81% 79% 83% 81% 79% 81% 83% 83% 85% 82% 84% 86% 84% 85% <6 Month Beds 140 171 137 114 158 231 156 175 181 231 273 225 119 145 205 168 107 78 99 167 91 117 131 113 Nonstartup Open Beds 20 -37 -34 -26 -27 -28 -12 15 -2 -25 -34 42 105 102 81 93 150 167 134 69 135 128 137 133
161 134 103 88 131 202 190 179 206 239 267 224 247 286 261 257 245 233 226 245 268 140 171 137 114 158 231 175 181 231 273 225 119 145 205 168 107 78 99 91 117 131 84% 87% 90% 91% 88% 83% 84% 85% 83% 81% 79% 83% 81% 79% 81% 83% 83% 85% 84% 86% 84% 72% 74% 76% 78% 80% 82% 84% 86% 88% 90% 92% 94% 0 200 400 600 800 1000 1200 1400 1600 Jul 22 Aug 22 Sep 22 Oct 22 Nov 22 Dec 22 Jan 23 Feb 23 Mar 23 Apr 23 May 23 Jun 2023 Jul 2023 Aug 2023 Sep 2023 Oct 2023 Nov 2023 Dec 2023 Jan 2024 Feb 2024 Mar 2024
Capacity Open Beds <6 Month Beds Occupancy Rate
Startup Beds (6 months old or less)
2022 Startup Beds Avg: 118
2023 Startup Beds Avg: 150
2024 YTD Startup Beds Avg: 119
Last 6 mos Avg: 109
March 2024: 148
State Jul 22 Aug 22 Sep 22 Oct 22 Nov 22 Dec 22 2022 Average Jan 23 Feb 23 Mar 23 Apr 23 May 23 Jun 23 Jul 23 Aug 23 Sep 23 Oct 23 Nov 23 Dec 23 2023 Average Jan 24 Feb 24 Mar 24 2023 Average Overall Average TN 62 60 60 60 60 30 33 30 30 60 60 118 72 85 85 60 60 30 30 60 30 30 30 30 45 VA 0 0 0 0 32 32 16 32 34 34 34 34 0 0 60 48 47 48 48 35 32 32 32 32 26 WV 27 24 0 0 0 30 14 30 30 30 30 30 0 0 0 0 0 0 0 13 0 0 0 0 12 OK 28 40 28 28 30 0 15 0 0 0 12 20 21 30 30 30 0 0 0 12 0 31 30 20 14 SC 0 0 0 0 0 0 11 0 0 0 34 34 26 30 30 30 0 0 0 15 0 0 30 10 13 TX 0 0 0 0 0 30 3 30 30 30 30 30 0 0 0 0 0 0 0 13 0 0 0 0 7 FL 24 24 24 0 0 0 12 0 0 0 0 0 0 0 0 0 0 0 0 0 0 0 0 0 5 NC 0 0 0 0 0 0 8 0 0 0 0 0 0 0 0 0 0 0 0 0 0 0 0 0 3 PA 0 0 0 0 0 0 5 0 0 0 0 0 0 0 0 0 0 0 32 3 29 24 26 26 6 MO 0 0 0 0 0 0 2 0 0 0 0 0 0 0 0 0 0 0 0 0 0 0 0 0 1 Total 140 148 112 88 122 122 118 122 124 154 200 266 119 145 205 168 107 78 110 150 91 117 148 119 132 62 60 60 60 60 30 30 30 60 60 118 72 85 85 60 60 30 30 30 30 30 32 32 32 34 34 34 34 60 48 47 48 48 32 32 32 27 24 30 30 30 30 30 30 28 40 28 28 30 12 20 21 30 30 30 31 30 34 34 26 30 30 30 30 30 30 30 30 30 30 24 24 24 32 29 24 26 0 50 100 150 200 250 300 Jul 22 Aug 22 Sep 22 Oct 22 Nov 22 Dec 22 Jan 23 Feb 23 Mar 23 Apr 23 May 23 Jun 23 Jul 23 Aug 23 Sep 23 Oct 23 Nov 23 Dec 23 Jan 24 Feb 24 Mar 24
TN VA WV OK SC TX FL NC PA MO
30 "Noncenter" States 167 5% 30 Noncenter "Sending" States 13 Center States 2916 95% 2 Sending, 2 Self-supporting, 9 Receiving 43 Total States 3083 100% State 2023 Resident's State 2023 Center's State Net Difference Sending/Receiving Tennessee 947 1017 -70 Receiving Oklahoma 412 415 -3 Receiving North Carolina 329 239 90 Sending Virginia 301 373 -72 Receiving Texas 270 297 -27 Receiving South Carolina 123 154 -31 Receiving Montana 108 131 -23 Receiving West Virginia 105 74 31 Sending Florida 85 83 2 Self-supporting Missouri 66 64 2 Self-supporting Hawaii 63 67 -4 Receiving Pennsylvania 56 62 -6 Receiving Ohio 51 107 -56 Receiving
Analysis (Sending, Self-supporting, Receiving) 2023 Admissions Received
States are
Admissions to other states than they
Receiving from other states? Which
Self-Supporting "?
they are Sending?
2023 State
Which
Sending more
are
States are "
Which States are Receiving more Admissions than
Which States are Sending more Admissions to other states than they are Receiving from other states?
Which States are " Self-Supporting "? Which
30 "Noncenter" States 167 5% 30 Noncenter "Sending" States 13 Center States 2916 95% 2 Sending, 2 Self-supporting, 9 Receiving 43 Total States 3083 100% State 2023 Resident's State 2023 Center's State Net Difference Sending/Receiving
(Sending, Self-supporting, Receiving) 2023 Admissions Received
2023 State Analysis
States are Receiving more Admissions than they are Sending? Mississippi 28 N/A N/A N/A Alabama 21 N/A N/A N/A Georgia 19 N/A N/A N/A Illinois 11 N/A N/A N/A Kentucky 11 N/A N/A N/A Arkansas 11 N/A N/A N/A California 8 N/A N/A N/A Colorado 7 N/A N/A N/A New York 6 N/A N/A N/A Indiana 5 N/A N/A N/A Nevada 5 N/A N/A N/A Arizona 4 N/A N/A N/A Kansas 3 N/A N/A N/A Michigan 3 N/A N/A N/A Massachusetts 3 N/A N/A N/A New Jersey 3 N/A N/A N/A New Mexico 2 N/A N/A N/A Maine 2 N/A N/A N/A Utah 2 N/A N/A N/A Nebraska 2 N/A N/A N/A Alaska 2 N/A N/A N/A Idaho 1 N/A N/A N/A Maryland 1 N/A N/A N/A Rhode Island 1 N/A N/A N/A North Dakota 1 N/A N/A N/A Washington 1 N/A N/A N/A Iowa 1 N/A N/A N/A Wisconsin 1 N/A N/A N/A Louisiana 1 N/A N/A N/A New Hampshire 1 N/A N/A N/A
Occupancy by Gender and State
Where should we open the next men's and women's Hope Centers?
Centers 6+ mos old
State Occupancy Capacity Occupancy Rate Male 997 1187 84% VA 130 130 100% MT 21 22 95% MO 30 32 94% NC 56 60 93% OK 125 138 91% FL 26 30 87% TX 77 90 86% SC 58 68 85% TN 353 415 85% WV 26 34 76% OH 40 66 61% HI 21 36 58% PA 34 66 52% Female 310 376 82% NC 33 34 97% VA 49 50 98% TN 115 126 91% TX 26 30 87% MT 27 34 79% OK 53 72 74% SC 7 30 23% WV Grand Total 1307 1563 84% State Occupancy Capacity Occupancy Rate Female 303 346 88% NC 33 34 97% VA 49 50 98% TN 115 126 91% TX 26 30 87% MT 27 34 79% OK 53 72 74% WV Male 939 1097 86% VA 130 130 100% MT 21 22 95% MO 30 32 94% NC 56 60 93% OK 94 106 89% TN 335 385 87% FL 26 30 87% TX 77 90 86% SC 58 68 85% WV 26 34 76% PA 25 38 66% OH 40 66 61% HI 21 36 58% Grand Total 1242 1443 86%
Paid Admissions v Admissions
How much was not paid in the last 15 months?
What could we do with $1 million dollars?
Could we start a Hope Center and support 17 more family members who are desperate to see their loved ones find HOPE?
Did you know that new centers average 17 family members in weekly family support attendance?
Description 2024 Jan-Mar 2023 Total Total Admissions 810 3082 3892 Paid Admissions Estimate (CF+HFR) 453 1940 2393 Unpaid admissions 357 1142 1499 Unpaid amount 249,900 $ 799,400 $ 1,049,300 $
DAY THREE

Health Insurance EE: 70% ES/EC: 60% EF: 50% Retirement 3% Christmas Bonus $500 PTO 2 Weeks Health Insurance EE: 80% ES/EC: 70% EF: 60% Retirement 4% Christmas Bonus $750 PTO 2.5 Weeks Health Insurance EE: 90% ES/EC: 80% EF: 70% Retirement 5% Christmas Bonus $1000 PTO 3 Weeks Health Insurance EE: 100% ES/EC: 90% EF: 80% Retirement 6% Christmas Bonus $1250 PTO 3 5 Weeks Health Insurance EE: 100% ES/EC: 100% EF: 90% Retirement 7% Christmas Bonus $1500 PTO 4 Weeks <1 YEAR 1-4 Years 5-9 Years 10-14 Years 15+ Years Employee Benefits

ADMISSIONS WEEKLY STATUS REPORT
HERE TO SUBMIT
SCAN
Region District Location Max Capacity Occupancy Current Occupancy % 1st Phase Notes of What's Coming Up: Date: Wichita Falls, TX 30 27 90% 8 Holliday, TX 30 26 87% 7 Vernon, TX 30 24 80% 1 DISTRICT TOTALS 90 77 86% 16 Temple, TX 30 25 83% 5 DISTRICT TOTALS 30 25 83% 5 Purcell, OK 42 34 81% 4 Oklahoma City, OK 35 33 94% 4 Bethany, OK 37 35 95% 2 Tulsa, OK (M) 34 26 76% 9 DISTRICT TOTALS 148 128 86% 19 Sulphur, OK (W) 30 19 63% 15 Ada, OK (M) 32 32 100% 7 New Center Launch 2024 DISTRICT TOTALS 62 51 82% 15 REGIONAL TOTALS 330 281 85% 55 Helena, MT 34 27 79% 6 Butte, MT 22 21 95% 3 DISTRICT TOTALS 56 48 86% 9 Kailua, HI 36 20 56% 4 DISTRICT TOTALS 36 20 56% 4 Miami, FL 30 26 87% 6 DISTRICT TOTALS 30 26 87% 6 REGIONAL TOTALS 122 94 77% 19 Waverly, TN 36 30 83% 1 Camden, TN 34 29 85% 5 Paris, TN (W) 36 30 83% 5 McEwen, TN (M) 30 28 93% 3 Paris, TN (M) 34 26 76% 4 DISTRICT TOTALS 170 143 84% 18 Sikeston, MO 32 30 94% 3 Kennett, MO New Center Launch 2023 or later DISTRICT TOTALS 32 30 94% 3 Union City, TN (M) 30 18 60% 2 New Center Launch Fall 2023 Memphis, TN 30 24 80% 3 DISTRICT TOTALS 60 42 70% 5 Columbia, TN 30 18 60% 4 Hohenwald, TN 32 31 97% 4 Hohenwald, TN (W) 30 28 93% 8 DISTRICT TOTALS 92 77 84% 16 Springfield, TN 30 28 93% 2 Clarksville, TN 34 30 88% 4 Dickson, TN (W) 30 29 97% 5 Dickson, TN 35 34 97% 4 DISTRICT TOTALS 129 121 94% 15 Rickman, TN 31 30 97% 3 White House, TN 29 27 93% 4 Portland, TN 30 28 93% 4 DISTRICT TOTALS 90 85 94% 11 REGIONAL TOTALS 573 498 87% 68 Belpre, OH 30 12 40% 2 Parkersburg, WV 34 26 76% 3 DISTRICT TOTALS 64 38 59% 5 Wheeling, WV 36 27 75% 6 DISTRICT TOTALS 36 27 75% 6 Greenville, PA 38 24 63% 4 Kittanning, PA (M) 28 10 36% 1 Greenville, PA (W) New Center Launch 2023 or later DISTRICT TOTALS 66 34 52% 5 REGIONAL TOTALS 166 99 60% 16 Axton, VA 34 34 100% 7 Danville, VA (M) 30 32 107% 7 Roanoke, VA 2023 DISTRICT TOTALS 64 66 103% 14 Galax, VA 34 40 118% 5 Wytheville, VA 34 34 100% 5 Mt. Airy, NC (M) 32 24 75% 2 2023 DISTRICT TOTALS 100 98 98% 12 Suffolk, VA (W) 16 15 94% 7 Waiting on Occupancy letter Princeton, NC (M) New Center Launch (28 beds at Open) 2023 or later DISTRICT TOTALS 16 15 94% 19 Dunn, NC 30 27 90% 6 Goldsboro, NC 30 30 100% 3 Goldsboro, NC (W) 34 32 94% 5 DISTRICT TOTALS 94 89 95% 14 DISTRICT TOTALS Pelzer, SC 34 33 97% 7 DISTRICT TOTALS 34 33 97% 7 Florence, SC (W) 30 6 20% 3 New Center Launch 2024 Conway, SC 34 25 74% 8 DISTRICT TOTALS 64 25 39% 8 REGIONAL TOTALS 372 326 88% 74 HCM OVERALL TOTALS 1563 1298 83% 240 Decision : No more than 34 (max capacity) anywhere. Need to Hire East Virginia/North Carolina Neil North Carolina Neil Chrystal Wheeling, WV Sarah South Carolina Casea Love South Carolina Need to Hire North Carolina Ginger Pennsylvania Chereta Hale Southern Tennessee Angela Coleman Tommie Jo Walker Southwest Virginia Patty South Central Virginia Need to Hire Hawaii Jackie Florida Cory Nabors Pending Hire Temple TX Lutisha Montana Pennie North Central Texas Derrick Harwood Central Tennessee Royse Vaughn Robb Ohio JULIE Robb 2024 Max Capacity vs Occupancy Date 04/02/2024 James Patty Julie Midwest Tennessee Paula Missouri James Southern Oklahoma
Center Stats - Week Ending 03/30/2024 Center AdmissionsDepartures7DayDepartures45DayDeparturesPh2DeparturesPh3DeparturesGraduatesCapacityOccupancyPh2ResidentsTraining NotTraining Extended Butte, MT 0 22 21 17 8 7 Helena, MT 0 34 27 18 0 0 Kailua, HI 1 1 1 0 36 20 11 0 0 Miami, FL 2 0 30 26 11 0 0 Northeast Belpre, OH 1 1 1 0 30 12 8 7 3 Greenville, PA 1 0 38 24 18 6 16 Kittanning, PA (M) 0 28 10 9 3 6 Parkersburg, WV 1 0 34 26 21 12 9 Wheeling, WV 2 2 1 1 0 36 27 21 19 8 Southeast Axton, VA 1 1 1 0 34 34 24 0 0 Conway, SC 4 3 2 3 0 34 25 13 8 8 Danville, VA (M) 4 0 30 32 16 0 0 Dunn, NC 2 3 3 1 0 30 27 19 15 6 Florence, SC (W) 2 0 30 6 3 0 0 Galax, VA 1 0 34 40 30 31 0 Goldsboro, NC 1 1 0 30 30 24 0 0 Goldsboro, NC (W) 3 0 34 32 21 9 11 Mt. Airy, NC (M) 1 0 32 24 22 18 4 Pelzer, SC 2 1 1 0 34 33 23 16 9 Suffolk, VA (W) 3 2 1 1 1 0 16 15 8 0 0 Wytheville, VA 1 0 34 34 25 20 6 Southeast Central Camden, TN 1 1 1 0 34 29 22 21 1 Clarksville, TN 1 3 1 3 0 34 30 15 0 0 Columbia, TN 1 0 30 18 12 8 3 Dickson, TN 1 1 0 35 34 23 23 3 Dickson, TN (W) 1 0 30 29 21 17 5 Hohenwald, TN 0 32 31 22 23 1 Hohenwald, TN (W) 0 30 28 15 12 3 McEwen, TN (M) 1 0 30 28 19 20 2 Memphis, TN 1 1 0 30 24 18 17 1 Paris, TN (M) 1 0 34 26 20 17 4 Paris, TN (W) 1 1 1 0 36 30 23 20 4 Portland, TN 1 2 1 2 1 0 30 28 17 17 2 Rickman, TN 1 2 1 1 0 31 30 23 23 1 Sikeston, MO 1 0 32 30 18 9 10 Springfield, TN 3 1 3 0 30 28 23 18 7 Union City, TN (M) 2 2 1 2 1 0 30 18 16 14 3 Waverly, TN 1 1 0 36 30 27 18 8 White House, TN 1 1 1 0 29 27 19 14 6 Southwest Central Ada, OK (M) 2 0 32 32 21 15 6 Bethany, OK 1 0 37 35 26 23 3 Holliday, TX 2 0 30 26 16 11 5 Oklahoma City, OK 1 0 35 33 26 25 2 Purcell, OK 0 42 34 26 18 8 Sulphur, OK (W) 8 1 1 0 30 19 3 3 1 Temple, TX 1 1 0 30 25 20 16 4 Tulsa, OK (M) 3 3 3 2 0 34 26 15 0 0 Vernon, TX 3 2 2 1 0 30 24 17 13 4 Wichita Falls, TX 1 1 1 1 0 30 27 16 15 3 Grand Total 61 42 10 28 21 0 1563 1304 901 602 193
Admissions Coordinator Jan Feb Mar Apr May Jun Jul Aug Sep Oct Nov Dec Grand Total 2023 Avg James Rummage 23 14 17 21 26 29 29 39 29 42 40 49 358 30 Julie Utley 26 27 26 22 27 31 31 30 28 35 32 32 347 29 Neil Dickerson 13 17 20 19 25 23 18 20 17 17 23 23 235 20 Patty Johnson 11 14 15 13 18 18 21 18 23 14 25 17 207 17 Royse Vaughn 3 0 0 1 7 17 25 30 33 34 19 27 196 16 Pennie Pyle 1 2 15 15 18 25 10 7 9 102 11 Michael Lovingood 15 15 11 8 5 9 63 11 Katonya Cole 11 11 11 Robb Yost 12 13 8 11 12 6 9 18 8 10 4 6 117 10 Lutisha McFarland 5 11 16 9 8 15 5 8 10 11 9 10 117 10 Chereta Hale 6 14 10 11 41 10 Derrick Harwood 4 15 19 10 Tommie Jo Walker 11 8 5 8 10 8 11 11 12 13 6 9 112 9 Sarah Lister 2 2 1 4 7 17 9 20 8 15 8 10 103 9 Jackie Rodriguez 4 7 6 7 5 7 6 11 2 3 13 71 6 Paula Reed 8 1 9 3 2 5 6 4 9 6 9 5 67 6 Ben Zimmer 1 3 1 2 3 4 8 11 6 5 4 48 4 Chrystal Damesworth 1 5 4 4 4 7 8 5 2 4 44 4 Ginger Vandevort 5 0 5 3 Grand Total 206 190 235 213 236 278 263 326 293 287 265 290 3082 257 2023 ADMISSIONS
Admissions Coordinator Apr May Jun Jul Aug Sep Oct Nov Dec Jan Feb Mar Grand Total Monthly Avg James Rummage 21 26 29 29 39 29 42 40 49 30 32 29 395 33 Julie Higgins 22 27 31 31 30 28 35 32 32 24 25 25 342 29 Royse Vaughn 1 7 17 25 30 33 34 19 27 25 28 20 266 22 Neil Dickerson 19 25 23 18 20 17 17 23 23 21 23 21 250 21 Patty Johnson 13 18 18 21 18 23 14 25 17 12 16 17 212 18 Sarah Lister 4 7 17 9 20 8 15 8 10 14 11 16 139 12 Chereta Hale 6 14 10 11 19 10 7 77 11 Katonya Cole 11 11 11 Tommie Jo Walker 8 10 8 11 11 12 13 6 9 12 11 20 131 11 Michael Lovingood 15 15 11 8 5 9 11 15 9 98 11 Derrick Harwood 4 15 10 12 13 54 11 Pennie Pyle 1 2 15 15 18 25 10 7 9 6 4 13 125 10 Lutisha McFarland 9 8 15 5 8 10 11 9 10 5 10 9 109 9 Robb Yost 11 12 6 9 18 8 10 4 6 9 6 7 106 9 Angie Duncan 15 7 9 4 35 9 Cory Nabors 0 12 12 24 8 Jackie Rodriguez 6 7 5 7 6 11 2 3 13 8 7 7 82 7 Paula Reed 3 2 5 6 4 9 6 9 5 10 6 1 66 6 Chrystal Damesworth 5 4 4 4 7 8 5 2 4 4 2 7 56 5 Ben Zimmer 1 2 3 4 8 11 6 5 4 3 0 0 47 4 Ginger Vandevort 5 1 6 3 15 4 Casea Love 0 0 6 6 2 Angela Coleman 0 0 5 5 2 Grand Total 213 236 278 263 326 293 287 265 290 250 278 279 3258 272 APRIL 2023 TO MARCH 2024 ADMISSIONS
*Selections based on 12-month minimum
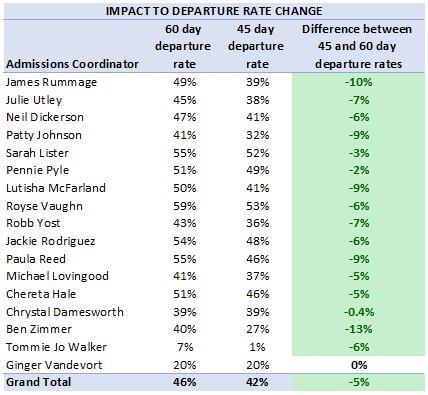
2023 Departure Rates*
Admissions Coordinator Jan Feb Mar Apr May Jun Jul Aug Sep Oct Nov Dec 2023 Avg Tommie Jo Walker 0% 11% 7% David Forrester 0% 25% 13% Ginger Vandevort 20% 0% 20% Derrick Harwood 25% 27% 26% Chrystal Damesworth 60% 75% 50% 0% 57% 25% 40% 0% 25% 39% Ben Zimmer 0% 0% 200% 0% 33% 50% 38% 18% 50% 100% 25% 40% Patty Johnson 31% 50% 47% 23% 33% 47% 50% 39% 48% 64% 16% 41% 41% Robb Yost 8% 69% 25% 55% 50% 28% 22% 11% 100% 60% 0% 33% 43% Julie Utley Higgins 42% 48% 50% 45% 44% 27% 32% 70% 57% 46% 22% 56% 45% Neil Dickerson 77% 29% 30% 63% 32% 52% 61% 80% 35% 47% 43% 30% 47% James Rummage 367% 0% 54% 21% 38% 51% 55% 48% 50% 61% 49% Lutisha McFarland 60% 27% 25% 100% 100% 47% 100% 75% 20% 55% 33% 30% 50% Jovita Pyle 0% 0% 33% 67% 39% 44% 100% 86% 67% 51% Chereta Hale Vaughn 57% 60% 36% 51% Jackie Rodriguez 200% 75% 0% 117% 29% 60% 57% 100% 27% 50% 67% 38% 54% Paula Reed 25% 400% 44% 167% 50% 20% 50% 100% 44% 50% 44% 40% 55% Sarah Lister 50% 100% 25% 43% 35% 100% 40% 88% 40% 88% 70% 55% Royse Vaughn 14% 47% 48% 50% 52% 62% 5% 52% 62%
*used monthly stats number
Admissions Coordinator Total Admissions Funds Raised Monthly Avg Julie Utley Higgins* 158,458 $ 13,205 $ Neil Dickerson 156,205 $ 13,017 $ Patricia Johnson 115,018 $ 9,585 $ Lutisha McFarland* 97,259 $ 8,105 $ James Rummage 95,167 $ 7,931 $ Robb Yost* 86,579 $ 7,215 $ Royse Vaughn 71,085 $ 7,109 $ Sarah Lister 60,214 $ 5,474 $ Jacqueline Rodriguez 45,741 $ 3,812 $ Paula Reed 43,086 $ 3,591 $ Pennie Pyle 34,949 $ 4,369 $ Benjamin Zimmer 24,907 $ 2,491 $ Chrystal Damesworth 19,407 $ 2,156 $ Chereta Hale 12,743 $ 2,549 $ Derrick Harwood 9,726 $ 4,863 $ Ginger Vandevort 3,700 $ 1,233 $ Tommie Jo Walker 2,117 $ 1,059 $ David Forrester - $ - $
2023 Funds Raised

SCOREBOARD SCAN HERE TO SUBMIT
ADMISSIONS