Analysis of Worship Center Acoustic Quality for Audiences Ethan Adeniran, Sophomore | Faculty Mentor: Dr. Fernando Espinoza, Department of Chemistry and Physics-School of Education
Hofstra University
What Are The Four Acoustic Qualities?
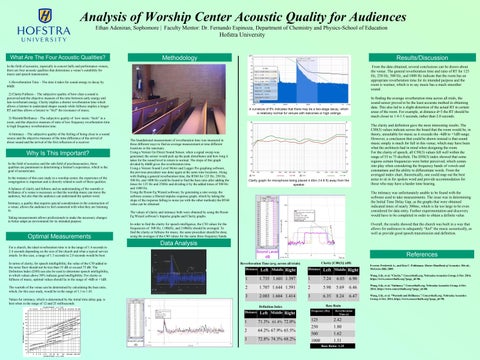
Methodology
Results/Discussion
In the field of acoustics, especially in concert halls and performance venues, there are four acoustic qualities that determines a venue’s suitability for music and speech transmission.
From the data obtained, several conclusions can be drawn about the venue. The general reverberation time and ratio of RT for 125 Hz, 250 Hz, 500 Hz, and 1000 Hz indicate that the room has an appropriate reverberation time for its intended purpose and the room is warmer, which is to say music has a much smoother sound.
1) Reverberation Time – The time it takes for sound energy to decay by 60dB. 2) Clarity/Fullness - The subjective quality of how clear a sound is perceived and the objective measure of the ratio between early energy and late reverberant energy. Clarity implies a shorter reverberation time which allows a listener to understand shaper sounds while fullness implies a longer RT and thus allows a listener to “feel” the resonance of music.
In finding the average reverberation time across all trials, the sound sensor proved to be the least accurate method in obtaining data. This also led to a slight distortion of the actual RT in certain areas of the room. For example, at distance d=3 the RT should be much closer to 1.4-1.5 seconds, rather than 2.0 seconds.
3) Warmth/Brilliance – The subjective quality of how music “feels” in a room, and the objective measure of ratio of low frequency reverberation time to high frequency reverberation time. 4) Intimacy – The subjective quality of the feeling of being close to a sound source and the objective measure of the time difference of the arrival of direct sound and the arrival of the first reflection of a receiver.
Why Is This Important? In the field of acoustics and the sub-field of psychoacoustics, these qualities are paramount to determining a listener's experience, which is the goal of acousticians. In the instance of this case study in a worship center, the experience of the congregation is important and is directly related to each of these qualities. A balance of clarity and fullness and an understanding of the warmth or brilliance of a venue is necessary so that the worship music can move the audience, but also that the audience can understand the spoken word. Intimacy, a quality that requires special consideration in the construction of a venue, allows the audience to feel connected with what they are listening to. Taking measurements allows professionals to make the necessary changes to better adapt an environment for its intended purpose.
Optimal Measurements For a church, the ideal reverberation time is in the range of 1.4 seconds to 2.4 seconds depending on the size of the church and what a typical service entails. In this case, a range of 1.3 seconds to 2.0 seconds would be best. In terms of clarity, for speech intelligibility, the value of the C50 added to the noise floor should not be less than 55 dB or exceed 75 dB. The Definition Index (D50) can also be used to determine speech intelligibility, in which values above 50% indicate good intelligibility. For clarity or fullness of music, optimal values should lie in the range of -4dB or +1dB. The warmth of the venue can be determined by calculating the bass ratio, which, for this case study, would be in the range of 1.1 to 1.45. Values for intimacy, which is determined by the initial time delay gap, is best when in the range of 12 and 25 milliseconds.
The clarity and definition gave the most interesting results. The C80(3) values indicate across the board that the room would be, in theory, unsuitable for music as it exceeds the -4dB to +1dB range. However, a conclusion that could be drawn instead is that sound music simply is much for full in this venue, which may have been what the architects had in mind when designing the room. For the clarity of speech, all C50(3) values fell well within the range of 55 to 75 decibels. The D50(3) index showed that some regions certain frequencies were better perceived, which comes into play when considering the frequency bands of vowels and constantans and the ability to differentiate words. From the averaged index chart, theoretically, one could map out the best areas to sit in for spoken word and provide accommodation for those who may have a harder time hearing.
The foundational measurement of reverberation time was measured in three different ways to find an average measurement at nine different locations in the sanctuary. Using a Vernier Go Direct Sound Sensor, when a signal sweep was generated, the sensor would pick up the peak disturbance and how long it takes for the sound level to return to normal. The slope of this graph divided by 60dB gives the reverberation time. Using a Vernier Sound Level Meter and Logger Pro graphing software, the previous procedure was done again at the same nine locations. Along with finding a general reverberation time, the RT60 for 125 Hz, 250 Hz, 500 Hz, and 1000 Hz could be found to find the bass ratio after adding the times for 125 Hz and 250Hz and dividing it by the added times of 500 Hz and 1000 Hz. Using the Room Eq Wizard software, by generating a sine sweep, the software creates a filtered impulse response graph, which by taking the slope of the response falling to noise (as with the other methods) the RT60 value can be obtained.
The intimacy was unfortunately unable to be found with the software used to take measurements. The issue was in determining the Initial Time Delay Gap, as the graphs that were obtained indicated times of nearly 300ms, which is far too large to be even considered for data entry. Further experimentation and discovery would have to be completed in order to obtain a definite value.
The values of clarity and intimacy both were obtained by using the Room Eq Wizard software’s Impulse graphs and Clarity graphs.
Overall, the results showed that the church was built in a way that allows for audiences to adequately “feel” the music acoustically, as well as provide good speech transmission and definition.
In order to find the clarity for speech intelligence, the C50 values for the frequencies of 500 Hz, 1.00kHz, and 2.00kHz should be averaged. To find the clarity or fullness for music, the same procedure should be done, using the averages of the C80 values for the same three frequency bands.
Data Analysis References Clarity [C80(3)] (dB)
Reverberation Time (avg. across all trials) Distance
1
Left Middle Right 1.735 1.601 1.397
Distance
1
Left Middle Right 7.24
6.05
Everest, Frederick A., and Ken C. Pohlmann. Master Handbook of Acoustics. 5th ed., McGraw-Hill, 2009.
6.90
Wang, Lily, et al. “Clarity.” Concerthalls.org, Nebraska Acoustics Group, 6 Oct. 2014, https://www.concerthalls.org/?page_id=86.
2
1.707 1.644 1.591
2
5.98
5.69
6.46
Wang, Lily, et al. “Intimacy.” Concerthalls.org, Nebraska Acoustics Group, 6 Oct. 2014, https://www.concerthalls.org/?page_id=88.
3
2.003 1.604 1.414
3
6.35
8.24
6.47
Wang, Lily, et al. “Warmth and Brilliance.” Concerthalls.org, Nebraska Acoustics Group, 6 Oct. 2014, https://www.concerthalls.org/?page_id=90.
Bass Ratio
Definition Index Distance
1
Left Middle Right 71.3% 61.4% 72.0%
2
64.2% 67.9% 65.5%
3
72.8% 74.3% 68.2%
Frequency (Hz)
Reverberation Time (s)
125
2.42
250
1.80
500
1.62
1000
1.51 Bass Ratio: 1.35