Aquatic Habitat Nitrate Levels on Long Island: The Effect of High Nitrate Levels on Anuran Species Abundance on Long Island Ashley Roth Advisors: Kristen Greaney, Steve Raciti, Department of Urban Ecology, Hofstra University
INTRODUCTION
đ?‘›đ?‘˘đ?‘šđ?‘?đ?‘’đ?‘&#x; đ?‘œđ?‘“ đ?‘“đ?‘&#x;đ?‘œđ?‘”đ?‘ đ?‘Łđ?‘–đ?‘ đ?‘˘đ?‘Žđ?‘™đ?‘™đ?‘Ś đ?‘ đ?‘˘đ?‘&#x;đ?‘Łđ?‘’đ?‘Śđ?‘’đ?‘‘ đ?‘Ąđ?‘–đ?‘šđ?‘’ đ?‘ đ?‘?đ?‘›đ?‘Ą đ?‘ đ?‘˘đ?‘&#x;đ?‘Łđ?‘’đ?‘Śđ?‘–đ?‘›đ?‘” (â„Žđ?‘œđ?‘˘đ?‘&#x;đ?‘ )
= đ?‘›đ?‘˘đ?‘šđ?‘?đ?‘’đ?‘&#x; đ?‘œđ?‘“ đ?‘“đ?‘&#x;đ?‘œđ?‘”đ?‘ đ?‘?đ?‘’đ?‘&#x; đ?‘šđ?‘’đ?‘Ąđ?‘’đ?‘&#x;
đ?‘‘đ?‘–đ?‘ đ?‘Ąđ?‘Žđ?‘›đ?‘?đ?‘’ đ?‘ đ?‘˘đ?‘&#x;đ?‘Łđ?‘’đ?‘Śđ?‘’đ?‘‘ (đ?‘šđ?‘’đ?‘Ąđ?‘’đ?‘&#x;đ?‘ )
RESULTS
o
o
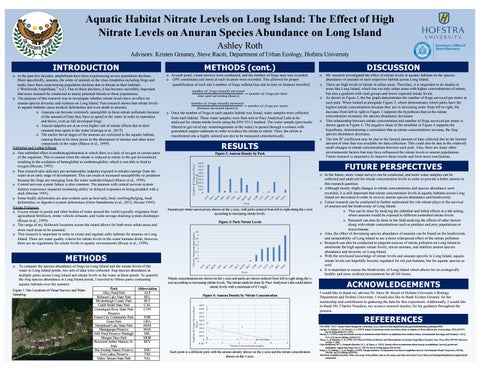
My research investigated the effect of nitrate levels in aquatic habitats on the species abundance of anurans in each respective habitat across Long Island. There are high levels of nitrate in urban areas. Therefore, it is important to do studies in areas like Long Island, which has not only urban areas with higher concentrations of nitrate, but also a gradient with rural groups and lower expected nitrate levels. As shown in Figure 2, the bar graph demonstrates the number of frogs surveyed per meter at each park. When looked at alongside Figure 3, which demonstrates which parks have the highest nitrate concentrations because they are in increasing order from left to right, the decrease from left to right in Figure 2 supports the hypothesis that as the nitrate concentration increases, the species abundance decreases. This relationship between nitrate concentration and number of frogs surveyed per meter is shown again in Figure 4. The negative slope of the trendline in Figure 4 supports the hypothesis, demonstrating a correlation that as nitrate concentrations increase, the frog species abundance decreases. The low R 2 coefficient may be due to the limited amount of data collected due to the limited amount of time that was available for data collection. This could also be due to the relatively small changes in nitrate concentrations between each park. Also, there are many other environmental factors that may have influenced the nitrate levels or anuran populations. Future research is imperative to improve these results and form more conclusions.
FUTURE PERSPECTIVES
L
S A
E B
M
N
L
L A C
A
O
V
C
V
O R
E
F
Y
R
R
L
O
B
M
U
I W
SH
T
M
IL M
L A
G R
P
A
0.0 9 0.0 8 0.0 7 0.0 6 0.0 5 0.0 4 0.0 3 0.0 2 0.0 1 0 H E
Num ber of Frogs per M eter Surveyed
Figure 2: Anuran Density by Park
Park
Anurans per meter surveyed are shown on the y-axis, with parks ordered from left to right along the x-axis according to increasing nitrate levels. Figure 3: Park Nitrate Levels
S
L E
L
A M
B
A C
N
L A
O R
O C
V
F
E
V
R
Y
O
R
M
L B
I
U
W T
IL M
SH
M
G R
H E
A
4.5 4 3.5 3 2.5 2 1.5 1 0.5 0 P
Nitrate Conencttraion (m g/L)
o
= đ?‘›đ?‘˘đ?‘šđ?‘?đ?‘’đ?‘&#x; đ?‘œđ?‘“ đ?‘“đ?‘&#x;đ?‘œđ?‘”đ?‘ đ?‘?đ?‘’đ?‘&#x; â„Žđ?‘œđ?‘˘đ?‘&#x;
o Once the number of frogs at each aquatic habitat was found, water samples were collected from each habitat. These water samples were then sent to Pace Analytical Labs to be analyzed for nitrate-nitrite levels using the EPA 353.2 method. The water sample (previously filtered to get rid of any waste/organisms in the water) is passed through a column with granulated copper-cadmium in order to reduce the nitrate to nitrite. Then, the nitrite is transformed into a highly colored azo dye to be measured colorimetrically.
L
o
o
đ?‘›đ?‘˘đ?‘šđ?‘?đ?‘’đ?‘&#x; đ?‘œđ?‘“ đ?‘“đ?‘&#x;đ?‘œđ?‘”đ?‘ đ?‘Łđ?‘–đ?‘ đ?‘˘đ?‘Žđ?‘™đ?‘™đ?‘Ś đ?‘ đ?‘˘đ?‘&#x;đ?‘Łđ?‘’đ?‘Śđ?‘’đ?‘‘
A
METHODS To compare the species abundance of frogs on Long Island and the nitrate levels of the water in Long Island ponds, two sets of data were collected: frog species abundance at multiple parks across Long Island and nitrate levels in the water at these ponds. To quantify the frog species abundance in Long Island ponds, I traveled to fifteen parks containing aquatic habitats over the summer: Park Abbreviation Figure 1: Site Locations of Visual Surveys and Water Alley Pond Park ALP Sampling Belmont Lake State Park BEL Blydenburgh County Park BLY Caleb Smith State Park CAL Connetquot River State Park CON Preserve Forest City Community Park FOR Grant Park GRA Hempstead Lake State Park HEM Massapequa Preserve MAS Mill Pond Preserve Wantagh MIL Morgan Days Park MOR Reverend Arthur Mackey Sr. REV Park Shu Swamp Nature Preserve SHU Twin Lakes Preserve TWI Valley Stream State Park VAL o
DISCUSSION
METHODS (cont.) o At each pond, visual surveys were conducted, and the number of frogs seen was recorded. o GPS coordinates and times at each location were recorded. This allowed for proper quantification of each site’s number of frogs without bias due to time or distance travelled.
Park
Nitrate concentrations are shown on the y-axis and parks are shown ordered from left to right along the xaxis according to increasing nitrate levels. The nitrate analysis done by Pace Analytical Labs could detect nitrate levels with a minimum of 0.5 mg/L.
0.0 9 0.0 8 0.0 7
ACKNOWLEDGEMENTS
REFEERENCES
0.0 6 0.0 5 0.0 4 0.0 3 0.0 2 0.0 1 0 -0 .01 0
o In the future, more visual surveys can be conducted, and more water samples can be collected and analyzed for nitrate concentration levels in order to provide a better answer to this research question. o Although mostly slight changes in nitrate concentrations and species abundance were recorded, it is still important that nitrate concentration levels in aquatic habitats across Long Island are decreased in order to recover anuran species abundance and biodiversity. o Future research can be conducted to further understand the role nitrate plays in the survival of anurans and the biodiversity of Long Island. o This can be done by studying the sublethal and lethal effects in a lab setting where anurans would be exposed to different controlled nitrate levels. o Research can also be done in the field studying the effects of other factors along with nitrate concentrations such as predator and prey populations or microclimate. o Also, the effect of decreasing species abundance of anurans can be found on the biodiversity and sustainability of Long Island to see a more widespread effect of the nitrate pollution. o Research can also be conducted to pinpoint sources of nitrate pollution on Long Island to ameliorate the high aquatic nitrate levels, rescue anurans, and stabilize anuran species abundance and diversity on Long Island. o With the newfound knowledge of nitrate levels and anurans specific to Long Island, aquatic nitrate levels can hopefully become regulated for not just humans, but for aquatic species as well. o It is important to rescue the biodiversity of Long Island which allows for an ecologically healthy and more resilient environment for all life forms.
I would like to thank my advisor Dr. Steve M. Raciti of Hofstra University’s Biology Department and Hofstra University. I would also like to thank Kristen Greaney for her mentorship and contribution to gathering the data for this experiment. Additionally, I would like to thank Mr. Charles Vessalico, my science research teacher, for his guidance throughout the process.
Figure 4: Anuran Density by Nitrate Concentration Num ber of Frogs Surveyed per M eter
o In the past few decades, amphibians have been experiencing severe population declines. More specifically, anurans, the order of animals in the class Amphibia including frogs and toads, have been experiencing population declines due to threats to their habitats (“Worldwide Amphibian,� n.d.). Due to these declines, it has become incredibly important that more research be conducted to assess potential threats to these populations. o The purpose of this research was to investigate whether nitrate levels have an effect on anuran species diversity and richness on Long Island. Past research shows that nitrate levels in aquatic habitats cause medical deformities and even death in anurans. o Anurans can become extremely susceptible to these nitrate pollutants because of the amount of time they have to spend in the water in order to reproduce and thrive, even as full developed frogs. o Anuran tadpoles are at an even higher risk of nitrate effects due to their constant time spent in the water (Garriga et al., 2017). o The earlier larval stages of the anurans are restricted to the aquatic habitat, causing them to be more prone to the absorption of nitrates and other toxic compounds in the water (Marco et al., 1999). Sublethal and Lethal Effects: o One sublethal effect is methemoglobinemia in which there is a lack of oxygen in certain parts of the organism. This is caused when the nitrate is reduced to nitrite in the gut environment resulting in the oxidation of hemoglobin to methemoglobin, which is not able to bind to oxygen (Hecnar, 1995). o Past research also indicates pre-metamorphic tadpoles exposed to nitrates emerge from the water at an early stage of development. This can result in increased susceptibility to predation because the frogs are emerging from the water underdeveloped (Marco et al., 1999). o Central nervous system failure is also common. The anurans with central nervous system failures experience impaired swimming ability or delayed responses to being prodded with a stick (Hecnar 1995). o Some bodily deformities are also evident such as bent tails, body swelling/bulging, head deformities, or digestive-system deformities (Ortiz-Santaliestra et al., 2012; Hecnar 1995). Nitrate Pollution: o Excess nitrate in ponds and other bodies of water around the world typically originates from agricultural fertilizers, motor vehicle exhausts, and waste sewage draining system discharges (Rouse et al., 1999). o The range of my fieldwork locations across the island allows for both more urban areas and more rural areas to be assessed. o This research is important in order to create and regulate safer habitats for anurans on Long Island. There are water quality criteria for nitrate levels in the water humans drink; however, there are no regulations for nitrate levels in aquatic environments (Rouse et al., 1999).
1
R² = 0.1305 2 3 4 Nitrate Concentration (m g/L)
5
Each point is a different park with the anuran density shown on the y-axis and the nitrate concentration shown on the x-axis.
EPA-NERL: 353.2: Nitrate-Nitrite Nitrogen by Colorimetry. (n.d.). Retrieved from https://www.nemi.gov/methods/method_summary/4702/ Garriga, N., Montori, A., & Llorente, G. A. (2017). Impact of ammonium nitrate and sodium nitrate on tadpoles of Alytes obstetricans. Ecotoxicology, 26(5), 667-674. doi:10.1007/s10646-017-1799-y Hecnar, S. J. (1995). Acute and chronic toxicity of ammonium nitrate fertilizer to amphibians from southern ontario. Environmental Toxicology and Chemistry, 14(12), 2131-2137.doi:10.1002/etc.5620141217 Marco, A., & Blaustein, A. R. (1999). The Effects of Nitrite on Behavior and Metamorphosis in Cascades Frogs (Rana Cascadae). Setac Press,18(5), 946-949. Retrieved October 7, 2020. Ortiz-Santaliestra, M. E., FernĂĄndez-BenĂŠitez, M. J., & Marco, A. (2012). Density effects on ammonium nitrate toxicity on amphibians. Survival, growth and cannibalism. AquaticToxicology,110-111, 170-176. doi:10.1016/j.aquatox.2012.01.010 Rouse, J. D., Bishop, C. A., & Struger, J. (1999). Nitrogen pollution: An assessment of its threat to amphibian survival. Environmental Health Perspectives,107(10), 799-803. doi:10.1289/ehp.99107799 Worldwide Amphibian Declines: What is the scope of the problem, what are the causes, and what can be done? (n.d.). Retrieved fromhttps://amphibiaweb.org/declines/d eclines.html