This Document is a live Council document and is subject to periodic review. The validity and currency of the document is critical in applying its content as it contains significant asset management and performance data that is “real-time” based.
If you are reading this document please check the version date and the endorsement date below to make sure that the document is current.
Version Date
Changes/Amendments
V0.0.1 05/04/2022 First Draft for Internal Review
V0.1.0 21/04/2022 Draft amended for Council Meeting
V0.1.1 24/04/2022 Roads lengths and financial values updated
V0.1.1 01/06/2022 Adopted by Council
NB:
Author
Strategic Assets Coordinator
Strategic Assets Coordinator
Strategic Assets Coordinator
Strategic Assets Coordinator
1. Primary number changes to Versions (eg V1.0 to V2.0) will be made when the document undergoes its regular review and when significant changes are made to standards and guidelines for inspections, intervention levels or work
2. Secondary number changes (V1.0 to V1.1) will apply to minor amendments that do not materially impact the document and are intended only to clarify or update issues.
3. Tertiary number changes (V1.1.1 to V1.1.2) are related to document updates and reviews undertaken by Council or external parties.
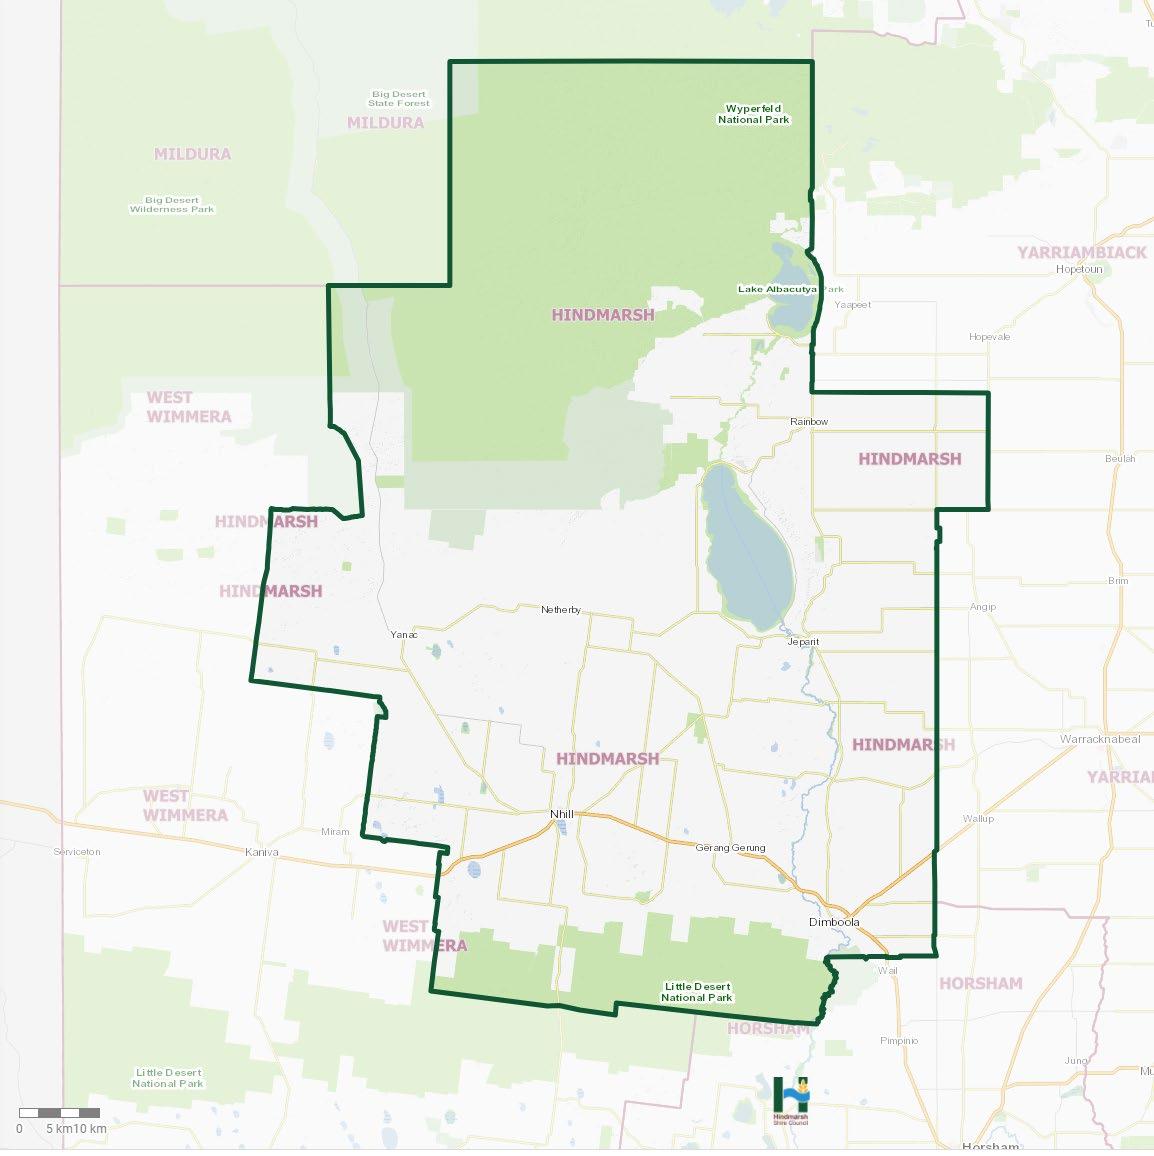
Map of Hindmarsh Shire Municipality
The Asset Plan
Introduction
The Plan is a means of outlining the key elements involved in managing Council assets. It combines management, financial, engineering and technical practices to ensure that the level of service required by user groups is provided at the lowest long term cost to the community within the limits of any fiscal constraints that may be imposed by Council.
The specific purpose of the Plan is to:
• Demonstrate responsible stewardship by the Council;
• Define and articulate how the infrastructure is and will be managed to achieve the organisation’s objectives;
• Provide a basis for customer consultation to determine the appropriate levels of service;
• Manage risk of asset failure;
• Achieve savings by optimising whole of life costs; and
• Support long term financial planning.
The objectives of this particular Plan are to:
• Consolidate all of the available information pertaining to Asset Management into a single location;
• Define how assets will be managed into the future. This will be done through;
o Identify services
o Develop Service Standards
o Identify and describe Councils assets
o Undertake Demand projections
o Identify gaps between required assets and actual assets
o Identify management options
o Determine the best option
o Determine ways of measuring performance
A key component of the Asset Plan is the Long Term Capex Plan (LTCP) which compiles the range of capital projects proposed for renewal, upgrade and new capital works over the next 10-year period.
In addition to identifying the operational and strategic practices that ensure that Council manages assets across their life cycle in a financially sustainable manner, the Asset Plan quantifies the asset portfolio and the financial implications of those practices.
Community Engagement
This Asset Plan has been prepared to address the requirements of section 92 of the Local Government Act (2020), including the various phases of the asset life cycle listed in point (3)(a) of that section of the Act, and the requirement for deliberative engagement in the development of the Plan.
Council adopted Asset Management Plan Part A (General Information) and Part E (Pathways) on 15 November 2017. This followed community consultation via advertising and making documents available at Customer
Service Centres and on Council’s website for a period of 4 weeks, which concluded on Friday 06 October 2017. No public submissions were received during this period.
It is an ongoing process and community feedback will be sought as appropriate during the implementation of this Asset Plan. The deliberative engagement process included the establishment of a Community Panel, which developed the Community Vision, and provided recommendations to Council on the Council Plan, Long Term Financial Plan and Asset Plan.
Relationship with Other Planning Documents
Asset Plans are a key component in Council’s planning process and it is important that this Plan is linked to the relevant strategies and actions in the following plans and documents.
• Hindmarsh Shire Council Road Management Plan 2021-2023
• Hindmarsh Shire Council Asset Management Strategy 2015
• Hindmarsh Shire Council Road Hierarchy Review 2015
• Hindmarsh Shire Council Long Term Financial Plan 2021-2031
• Hindmarsh Shire Council Plan 2021-2025 and Community Vision 2040
• Asset Plan Guidance 2022, Local Government Victoria
• Local Government Asset Management Better Practice Guide
Local Government Victoria 2015
• Asset Management Plan Part A - General Information - Adopted by Council 15 November 2017
• Asset Management Plan Part B – Roads, Draft for SMT Review June 2018
• Asset Management Plan Part C – Bridges, Weirs and major Culverts, Draft for Council Briefing January 2016
• Asset Management Plan Part D – Buildings and Other Structures, Draft for Council Briefing January 2016
• Asset Management Plan Part E – Pathways Roads, Adopted by Council 15 November 2017
• Asset Management Plan Part F – Drainage, Draft for Council Briefing January 2016
The Assets
Roads
Hindmarsh Shire Council provides an extensive network of roads throughout the municipality. This Asset Management Plan – Roads has been compiled to ensure the maintenance and renewal of the road network is undertaken in a systematic way that reflects community needs. This section includes a number of analytical tables and charts, the important numbers are highlighted in green background.
The Roads network has been defined into the following hierarchies in the rural and urban environment. Rural Roads
• Class 3R - Transport Routes
• Class 4R - Collector Roads
• Class 5R - Residential Access
• Class 6R - Property Access
• Class 6S – Strategic Property Access
• Class 7 – Secondary Property Access
• Class 8 – Paper Roads
Urban Roads
• Class 3U – Transport Routes
• Class 4U – Collector Roads
• Class 5U – Residential Access
• Class 6U – Secondary Access
The main components within the roads asset class are typically:
• sealed surfaces, pavements and kerbs in the urban areas
• sealed surfaces, pavements and shoulders for the rural sealed network
• unsealed pavements for the rural unsealed network.
Vicroads assets, private roads, crown land roads, private vehicle crossings/driveways are excluded from this plan. Road asset class is the most significant of all infrastructure assets. Data used to produce this plan are considered good and Council can consider itself in a sustainable financial position in respect to the management of this asset class.
A summary of the road assets managed by Council with financial values is:
Table 1 Road Assets Inventory Stock as in April 2022
A summary of road assets by hierarchy is:
Table 2 Road Assets by Hierarchy as in April 2022
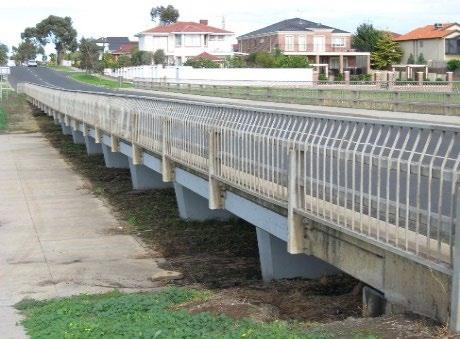
Bridges, Weirs and Culverts
Within the road network there are major structures that cross waterways including bridges, weirs and minor culverts
There are 5 bridges, two major culverts and two weirs. Albacutya Road Bridge was re-built in 2022.
Council owns and manages 372 culverts as in April 2022. The average size of the culverts ranges from 450mm to 1200mm diameter. The total length of the culverts is 5,113m.
Buildings
This asset class includes 145 buildings with the following classifications:
• Administrative Buildings.
• Public Halls.
• Recreation Reserve Buildings.
• Aquatic Centres.
• Public Toilets.
• Caravan Parks.
• Senior Citizens Centres.
• Pre-School Centres.
• Maternal Child Health Centres.
• Libraries.
Pathways
This asset class includes footpaths, tracks and trails. Council manages 41 km of footpaths and pathways as in April 2022, of which:
Table 3 Pathway Length by Surface Material as in April 2022
Stormwater Drainage
The urban stormwater drainage network includes underground pipes, open drains, pits and drainage structures. Most of the stormwater drainage assets are located at town centres.
There are approximately 23.5 km of stormwater pipes and 954 pits included in the stormwater drainage asset class
Table 4 Stormwater Pipe Length by Pipe Diameter as in April 2022
Recreation and Open Space
This asset class includes 4 swimming pools, playgrounds, recreation reserves, parks and gardens. There is a vast range of asset types including, but not limited to, the following:
Transfer Station
Transfer stations where rubbish / recycling can be received are at the following locations:
• Rainbow Transfer Station, 16 Kruger Rd, Rainbow
• Jeparit Transfer Station, Jeparit East Rd, Jeparit.
• Dimboola Transfer Station, 73 High St, Dimboola
• Nhill Transfer Station, 102 Nhill-Netherby Rd, Nhill
Financial Summary of Assets
Each class of the assets has been valued by external consultants with internal guidance. The summary is provided in below table:
Table 6 Summary of Financial Values as in April 2022
Total Infrastructure Replacement Value
$372M
Service Levels
The levels of service will be based on:
• Community engagement and expectations,
• Information gathered from customers on expected quality and cost of services,
• Strategic and corporate goals,
• Legislation, regulations, environmental standards and industry and Australian Standards that impact on the way assets are managed, and
• Design standards and codes of practice.
Roads
The current service levels provided have been determined as part of the development of the Council’s Roads Hierarchy, having taken its account the following factors:
• Traffic assessment;
• The number of houses served;
• Whether the road is used by school buses, heavy vehicles etc.;
• Functional role; and
• Community consultation.
The following definitions are provided as a guide and as time proceeds, reclassification of these roads may be required to meet the needs and expectations of the community and the management of Council’s road assets.
Additionally the introduction of the Road Asset Management Plan Act 2004 requires the establishment of the Road Register. The development of the Road Register could see a variation in the Road Hierarchy in relation to unused or “Paper” roads in which Council decide not to assume responsibility.
Functional hierarchies applicable to assets included in this plan are:
Declared Roads
Primary Arterial -Freeway/Highway and Declared Main Roads.
These roads form the principal network of roads to cater for through traffic movements in a municipality and linkage to main townships. They would normally carry the highest level of traffic volumes and be constructed to the highest standards.
These Arterial roads are made up of the VicRoads Declared Road Network, which includes freeways/highways and declared main roads.
Local Roads
These roads provide the primary network on which the majority of resident’s travel occurs. They are essentially the financial responsibility of Council. The Hindmarsh Shire Council’s Road Hierarchy defines the following classes of local roads in both rural and urban areas.
RURAL
(1) Class 3R – Transport Routes
These local roads provide the major direct freight route for agriculture produce and agriculture chemicals such as gypsum, between the declared road network and rural localities. They would usually connect two towns, villages or districts and carry traffic both private and commercial from both within and outside the municipality.
Council will endeavour to provide a sealed road pavement and formation, which allows the safe and efficient movement of all vehicles. Improvements to these roads will depend on a number of factors including horizontal and vertical alignment and traffic count.
(2) Class 4R - Collector Roads
These roads provide the link between locations and districts. They also provide the link between residential and property access roads into the higher class roads. They would carry mainly traffic originating from within the municipality both private and commercial.
Council will endeavour to provide an all-weather pavement, which allows for the safe movement of all vehicles.
Changes in status of residence and property access roads could lead to a change in classification of existing collector roads.
(3)
Class 5R - Residential Access
These roads are probably the most important from an individual’s view as they are designed to provide all weather access for emergency and day to day activities.
Council will endeavour to provide all houses which are occupied for residential purposes with a road pavement of a type and depth capable of being trafficked under all normal weather conditions.
If a house has been unoccupied for residential purposes for more than two years, all weather access rights will be deemed to have lapsed. Any proposal for the access road to be upgraded or reinstated to residence access in the event that the house is subsequently re-occupied shall be treated as access for a new house in accordance with this policy.
(4)
Class 6R - Property Access
These roads are used by people requiring access to carry out farming or other legitimate activities on properties they own or lease. Ideally, every property would be provided with a good quality, all weather access. Unfortunately, such an approach is not possible in an environment of limited funds.
Council will endeavour to provide and maintain a minimum of an earth formation capable of providing dry weather access only. It is recognised that this may cause inconvenience from time to time; however limiting use of these roads during wet weather will ensure a more serviceable road surface.
Localised drainage or gravelling work may be undertaken by Council where it is required to reasonably maintain dry weather access.
Removal or trimming of native vegetation that results from the purchase of larger machinery by landowners will only be carried out following a contribution from the initiating landowner. Such work will not be as of right and will depend upon Council and planning permit approvals being obtained by the applicant.
(5)
Class 6S – Strategic Property Access
These roads are generally all weather access to rural commercial or industrial properties and serve as access to non-residential properties and link those non-residential properties to higher classification roads. Maintenance/grading is carried out annually. Shoulders and drains of road are maintained as required.
(6)
Class 7 – Strategic Property Access
These roads are dry weather access roads to non-residential properties and link to higher classification road. Maintenance/grading is carried out less frequently and only when required.
(7) Class 8 – Paper Roads
These roads are unconstructed roads and not maintained by Council. These roads may be on Council’s Road Register.
URBAN
(1) Class 3U – Transport Routes
These local roads provide the major direct freight route for agriculture produce and transport goods between the declared road network and local transport hubs. Council will endeavour to provide a sealed road pavement and formation, which allows the safe and efficient movement of all vehicles.
(2) Class 4U – Collector Roads
These roads/streets provide the link between residential access roads into higher class roads within the township areas
Council will endeavour to provide a sealed pavement which allows for the safe movement of all vehicles.
(3) Class 5U - Residential Access
These roads provide the access to residential commercial or industrial properties to allow for the carrying out of day to day activities, business or occupations.
Council will endeavour to provide a road pavement of a type and depth capable of being trafficked under all normal weather conditions.
(4) Class 6U - Secondary Access
Roads or laneways that provide alternate access to un-occupied properties and business or access to vacant land.
Council will endeavour to provide a minimum of an earth formation which is trafficable in dry weather.
Classifications for Grants Commission
Road Type
Classification
Kerbed Road Kerb on both sides of the road
Unkerbed Road Roads without kerbs both sides
Table 7 Grants Commission Road Type
Strategic Routes
Description
Classification Description
Kerbed Road Strategic Route
Unkerbed Strategic Route
• Bus route
• Road > 500vpd
• Road with at least 50 trucks/day
• Bus route
• Road >100vpd with at least 10 trucks/day
• Road >100vpd with average grade at least 6%
• Road >100vpd in drip or flood irrigated horticultural or agricultural area
Table 8 Strategic Routes Classification
Where:
• Bus Route: Normal scheduled public transport route. Special school only routes.
• Truck: Class 3 to class 12 vehicle
Classification by Purpose: Classification
Public road
Aerodrome, recreation reserve, park access roads
Car parks
Table 9 Road Purpose Classification
Community and Technical Service Levels
Council’s current position is to:
• Maintain current level of service, however upgrade if successful in obtaining grants to do so.
• Maintain existing levels of service, all weather access to be maintained to dwellings.
Current service levels are:
Service: Transport – Vehicle Access Assets utilised: Urban and rural sealed roads, gravel roads
Rural
Urban access to residence and property
Transport: Formed, drained,
Collector: Formed, drained, sealed or gravel
Access Residential: Formed, drained, sealed or gravel
Access Property & Access
Minor: Earth formation as minimum. Localised drainage or gravelling work may be undertaken by Council where it is required to reasonably maintain dry weather access.
Transport: N/a
Collector: Sealed
Access Residential: Formed, drained, sealed or gravel
Access Property & Minor: Earth formation
Sealed road provided to residence
Availability of the sealed network
Customer requests sealed access to individual property
K&C provided in urban areas
Availability of kerb and channel
Provide a safe roads network Safety & Responsivene ss
Customer requests for kerb and channel
Result of resident survey
Reduction in the number of injury vehicle crashes recorded
Downward trend in VicRoads Crash Statistics Annual in recorded injury crashes
Max length travel dwelling to sealed road
And/or
Min traffic volumes
Demonstrated need
Collector & Access Residential: Sealed if
• As per Road Management Plan (RMP)
• To resolve a drainage issue, or
• Define parking, or
• Dimension limitations
• Protection of public and property
Wider seal widths
Amenity and safety.
No inconvenience from dust
Amenity free from dust
Rough gravel roads Amenity of the road,
Customer requests for shoulder works, edge drop-offs
Customer requests
Customer requests corrugations
<1/year
Regular defect inspections
Number of identified defects outside intervention corrected within the response time as defined in the RMP
100% in compliance with RMP, refer Appendix 1-4
Seal width As per risk assessment and available budget for all categories.
As per RMP
Budget $ expended will be manage case by case basis as per customer request and RMP
Routine maintenance gravel road grading frequency (times per year) Or RMP
As per RMP, refer Appendix 1-4
Table 10 Roads Community and Technical Service Levels
Note: If a house has been unoccupied for residential purposes for more than two years, all weather access rights will be deemed to have lapsed. Any proposal for the access road to be upgraded or reinstated to residence access in the event that the house is subsequently re-occupied shall be treated as access for a new house in accordance with this policy and Road Management Plan.
Bridges, Weirs and Culverts
The Bridges, Weirs & Culverts hierarchy directly follows the Road Hierarchy as shown in page 12
Asset Classification by Type:
Classification Description
Bridge Structure incorporating several structural elements and can be of different materials
Weir Structure incorporating several structural elements and can be of different materials
Culvert Round or rectangular precast or cast-in-place elements generally of concrete material
Table 11
Bridges, Weirs and Culverts Classification
Community and Technical Service Levels
Current service levels are:
Bridges should be located to provide access to dwelling and property
Bridges should not have any load limits
Availability. Requests for new bridge
< 1/year Structure that provides all weather access.
Accessibility for heavy vehicles Customer requests for increased load capacity < 1/year Load limits present.
Transport Routes
All weather structure
Collector Roads
All weather structure
Access Roads
No structure or a floodway only may be provided taking into account:
• Probability access denied (eg. flooded)
• Length detour
• Hierarchy
• Traffic volumes
• Emergency access needs
Transport Routes
Increase load capacity when grant available.
Collector roads
Increase load capacity when grant available.
Access roads
May be load limited considering detour assessment of:
• Length & condition
• Travel time
• Frequency
• Traffic volumes
Bridges should be able to accommodate farm machinery
Accessibility for wide vehicles
Customer requests for increase in width < 1/year
Trafficable bridge width (between kerbs)
Refer Appendix 6
Transport routes
Upgrade to 7.5m minimum when grant available
Collector & Access roads
• May be restricted provided reasonable detour
Bridges should be safe Safety
Bridges should be well maintained
Buildings
Buildings
High Use
Amenity: Bridges are maintained in a smooth, safe manner
Number of accidents/year < 1 bridge /year
Number of requests for bridge maintenance < 5/year
• Structures shall only be upgraded at time of scheduled replacement.
Bridge Safety Score Continuous improvement
Bridge Structure maintenance expenditure
Requirements of Road Management Act are met
• Significance at Municipal Level
• Significance at Community level
• Critical To Council Operations
• Critical To Service Delivery
• Key Heritage Or Icon
• Must Meet Stringent, Special Requirements
100% of budget expended annually
No bridge defects exceeding intervention, and service requests are dealt with adopted response frames. Refer Appendix 6
Medium Use
Low Use
• Significance At Town or Locality Level
• Important To Council Operations Or Service Delivery
• Need To Meet Special Requirements
• Significance at locality level
• Can operate in very basic conditions
• Ancillary to main function
Table 13 Buildings Hierarchy Classifications Community and Technical Service
Table 12 Bridges, Weirs and Culverts Community and Technical Service Levels
Pathways
Pathways Hierarchy
Hierarchy
Commercial Footpath
Function
Provides access to businesses in the central activity centre. Also used by businesses to conduct trade to through traffic. Generally experiences the highest foot traffic within the towns.
Key Access Footpaths
Residential Footpaths
Links the Commercial Footpaths to major facilities within the towns including hospitals, schools and facilities frequently used by the community.
Residential Footpaths make up a majority of the footpath network. They provide access to properties.
Park Paths Footpaths that are located on Council property or Crown land and act as part of the footpath network. As they are not located within the road reserve managed by Council, they are not subject to Council's Road Management Plan.
Trails Trails are pathways that are used for recreation and tourism. These pathways are found alongside the Wimmera River or within parks and reserves. Users of these paths are undertaking exercise, accessing recreational facilities or enjoying the environment.
Shared Paths
Shared paths are wide paths that allow both pedestrians and cyclists to use the same pathway. People over the age of 12 are not allowed to ride a bike on a footpath in Victoria. Shared paths help separate cyclists from vehicle traffic on busy routes, creating a safer cycling environment. Currently there are no shared path within Council.
Table 15 Pathways Hierarchy Classification
Characteristic
Paths are constructed with reinforced concrete, but can also include clay/stone pavers, tinted concrete or bricks when aesthetics need to be enhanced. Footpaths generally extend from shop front to back of kerb. New path to be DDA compliant, and program to be implemented to bring existing paths to DDA compliance where possible.
Paths are constructed with reinforced concrete. Path widths should be between 1.5m and 2.0m. The wider paths allow for mobility vehicles to pass each other comfortably without forcing each other off the footpath. New path to be DDA compliant, and program to be implemented to bring existing paths to DDA compliance where possible.
Paths are constructed within reinforced concrete. Paths are to be 1.5m wide. New path to be DDA compliant, and program to be implemented to bring existing paths to DDA compliance where possible.
Paths are to be constructed with reinforced concrete, gravel, bricks or pavers. Paths are to be 1.5m wide. If for aesthetic reasons a pervious material layer is used, paths are to be 2.0m wide for maintenance reasons.
Paths are generally made from sandstone/limestone, granitic sand, crushed rock and wood chips. Paths widths range from 2.0m to 3.0m to allow vehicle traffic for maintenance and emergency services.
Bike paths are constructed with reinforced concrete or bitumen/asphalt. Signage and line marking is required to identify that the path is shared between cyclists and pedestrians. Path widths should be no less than 2.5m and no greater than 3.0m. Bollards should be erected where the path crosses roads to discourage vehicles using the shared path.
Community and Technical Service Levels
Footpaths current service levels are:
Customer Expectation
My house will be connected to the footpath networkAvailability
Constructed footpath present, refer Appendix 5
• Commercial – Constructed concrete (or brick) paths will be constructed adjacent to commercial properties in the CBD and between key destinations
• Key Access – Constructed concrete path will be provided
• Residential – Constructed concrete path will be provided on one side of the road only
Paths will be wide enoughAmenity
Width of path
• Commercial – Generally full width from property line to kerb or >2.0m width
• Key Access – 1.5m – 2.5m
• Residential – 1.5m
Paths will be safe to useSafety Compliance with the RMP, refer Appendix 5 100% compliance
Paths should include features such as seats and drinking fountains -Quality
Accessible by a wheelchair or pram - Accessibility
Availability of Path furniture
No. Crossings with complaint DDA ramp.
• Commercial – CBD seats at 100m interval.
• Key Access & Residential – Path furniture will not be provided
100%
Table 16 Footpath Community and Technical Service Levels
Trails Technical Service Levels
Trails current service levels are:
Recreation paths will be provided - Availability
Paths will be wide enoughAmenity
Paths should include features such as seats -Quality
Constructed trail present, refer Appendix 5
Width of path
Availability of Path furniture
Table 17 Trails Community and Technical Service Levels
• High, Medium: In accordance with adopted strategy
• Low: N/a
• High, Medium: 2m minimum for shared use.
• Low: N/a
• High: Seats and shade at 1000m intervals
• Medium, Low: No path furniture provided.
Stormwater Drainage
Functional hierarchies applicable to assets included in this plan are: Hierarchy Description
1
Intensely developed business and industrial where flooding would cause serious damage or inconvenience
2 Other business and industrial areas, developed residential
3 Sparsely populated residential such as parks, playing fields
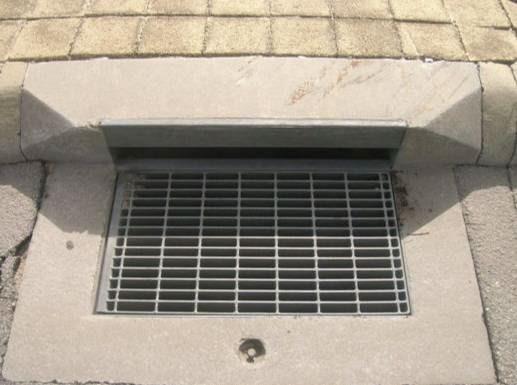
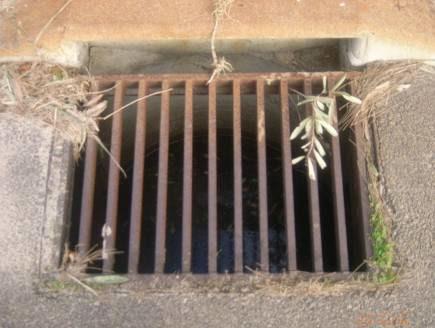
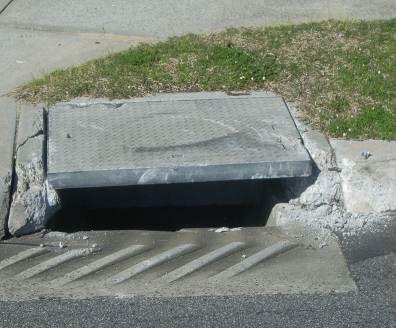
Concern with children entering pipes Public health & Safety
Pipe entry barriers present
Pedestrian barriers present
Open drains are untidy Amenity Drain type
Barriers to entry provided at all piped sections >600mm dia meter.
All locations with fall > 1m adjacent or near to a pedestrian path
Pipe all main drains when grant/fund available Litter is getting into the river
Environmental Litter traps present Litter traps to be provided on channel outfalls
Table 19 Stormwater Drainage Community and Technical Service Levels
Recreation and Open Space
Functional hierarchies applicable to assets included in this plan are:
Regional
District
Neighbourhood
• Would cater for high use
• It would have a large number of play experiences, include accessible features, typically consisting of an 'adventure' style configuration.
• Would be an attraction in itself.
• Would service a larger town
• Most likely co-located with a sport reserve or other community infrastructure
• Basic multifunction equipment and include accessible features.
• Would be similar to a District playground
• Within walking distance
• Only minimal equipment
Table 20 Recreation and Open Space Hierarchy Classification
Community and Technical Service Levels
Current service levels are:
Expectation
A playground nearby (availability)
Number, location & distribution of playgrounds
Diversity and originality of play (quality)
Fully accessible equipment (accessibility)
A safe playground (safety, responsiveness)
Facilities provided
Playgrounds provided at: 1 equipment /200
• Towns. 1 x District CBD. 1 x Neighbourhood @ Rec reserve, kindergarten
• Hamlet: Nil
Skate parks provided at:
• Town x 1
District: 5 items
Neighbourhood: 3 items
Shade
Supervision seating
Water
District No
Neighbourhood No
Defect Inspections 100% completed as scheduled No. reported accidents 0 year
Table 21 Recreation and Open Space Community and Technical Service Levels
Condition Assessments
Regular condition assessments are critical to guide Council’s asset maintenance and renewal priorities. Customer initiated maintenance requests also inform this understanding of asset condition. A summary of a generalised condition ranges applied to individual assets is provided in table below
The infrastructure in the system has
6 The infrastructure in the system shows general sign of deterioration that requires attention; some element requires significant deficiencies Fair
7 Between Fair and Poor
8 A large portion of the system exhibits significant deterioration
9 Between Poor and Very Poor
10 Many component of system exhibit sign of failure which
Table 22 Condition Assessment Rating 0 - 10 Scale
Council had adopted the industry standard colours (Green represents Good whilst Red represents Poor) to represent asset condition grades as above.
Condition Assessment Timetable
Condition assessment has a critical role in renewal and maintenance planning works whilst the assessment can be very expensive to carryout. Council has scheduled a comprehensive condition assessment program listed as below.
Table 23 Infrastructure Condition Assessment Program
The following shows the condition profile for each asset class based on the most recent assessment as shown with the date in the chart caption. Non-financial roads are excluded from the condition analysis.
Roads
Roads condition assessment was carried out in October 2021 by an external contractor.
Sealed Roads SURFACE Condition Distribution
(m)
Condition Rating
Most sealed roads surface is between condition 2 and condition 5. Condition 7, 8 and 9 road surface needs immediate attention.
Figure 2 Sealed Roads Surface Condition Distribution as in October 2021
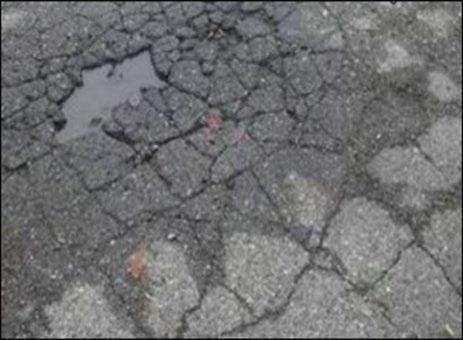
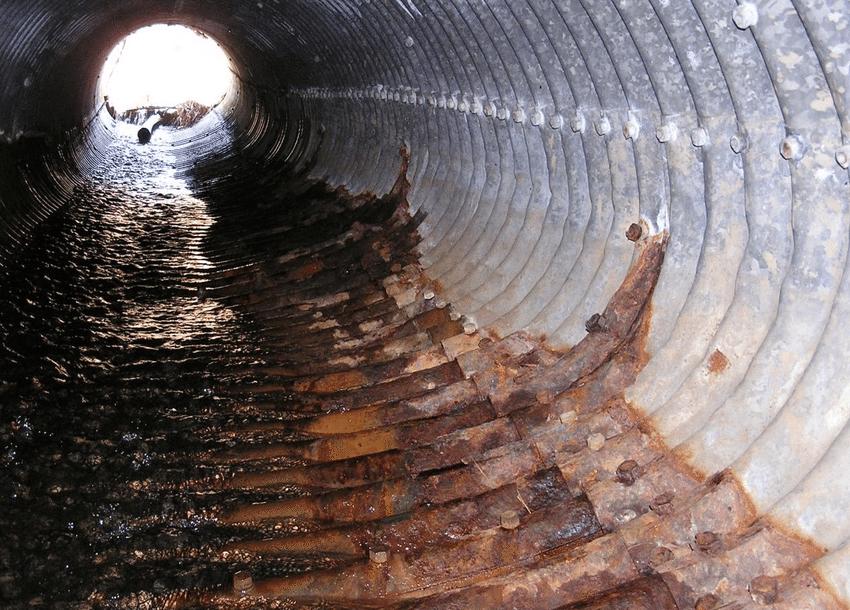
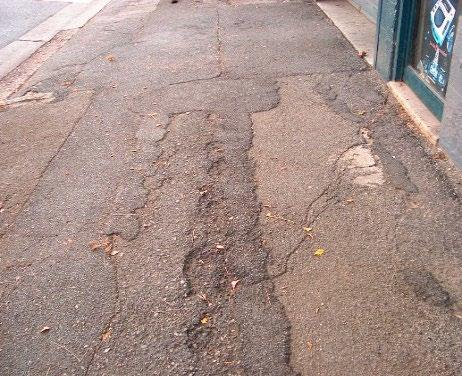
Figure 3 Road Condition Example: 0, 6, 9 from left to right
Sealed
Roads PAVEMENT Condition Distribution
Condition Rating
4 Sealed Roads Pavement Condition Distribution as in October 2021
The sealed roads pavement condition pattern is similar to the road surface, large percentage in the middle and small percentage at both ends.
Unsealed Roads Pavement Condition Distribution
Condition Rating
5 Unsealed Roads Pavement Condition Distribution as in October 2021
The unsealed roads exhibits different condition pattern to the sealed roads. Condition 0 to condition 4 (Brand New to Good) consists approx. 80% of the road network. Condition 9 and 10 unsealed roads will be re-sheeted as priority work.
Figure
Figure
Kerb Overall Condition Distribution
Most of the kerbs are between Condition 0 and Condition 6 whilst Condition 7 and 8 kerbs require immediate attention.
Bridges, Weirs and Culverts
The bridges and weirs were inspected in 2016 by external contractor and updated internally in April 2022.
Table 24 Bridge and Weir Overall Condition as in April 2022
Figure 6 Kerb Overall Condition Distribution as in October 2021
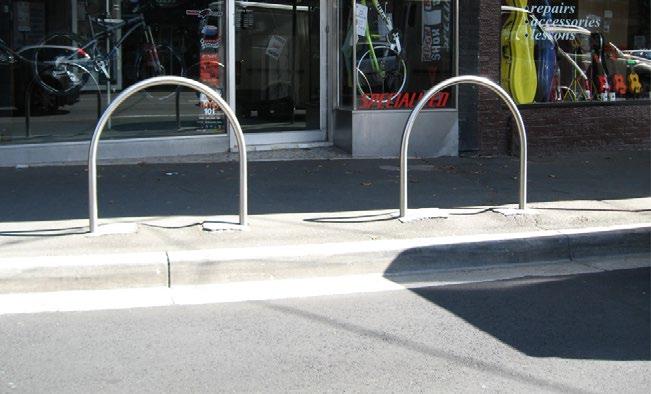
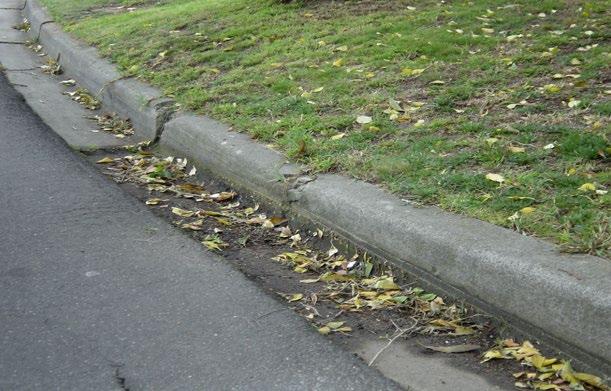
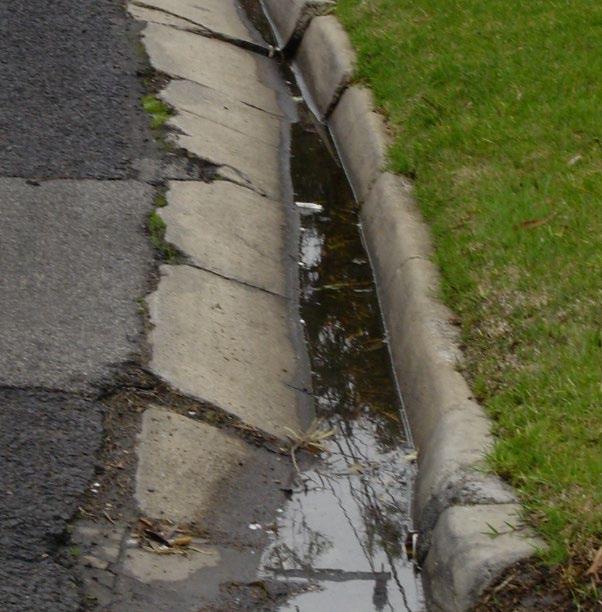
Figure 7 Kerb Condition Example: 1, 5, 9 left to right
Approximately half of the culverts was inspected by Council staff in June 2020 and the remaining culverts’ overall condition is derived from a study undertaken in 2009.
Condition Rating
Majority of the culverts do not need any intervention except 8 metre is in condition 7.
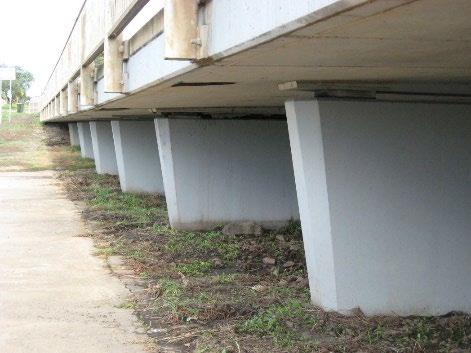
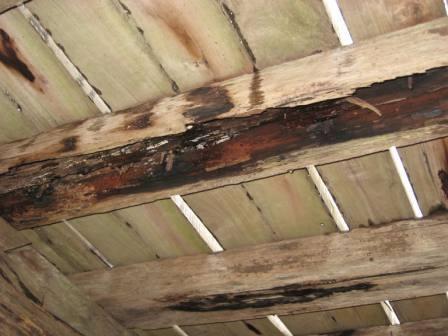
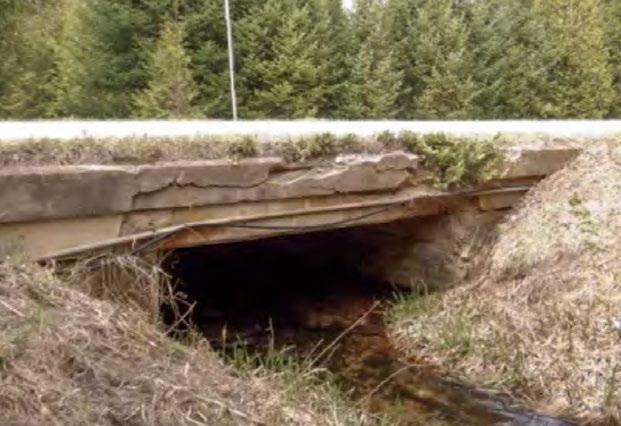
Figure 8 Bridge Condition Example: 1, 4, 9 from left to right
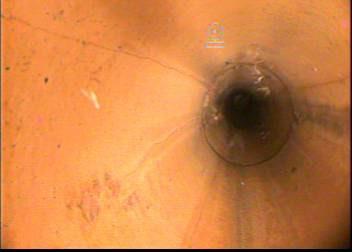
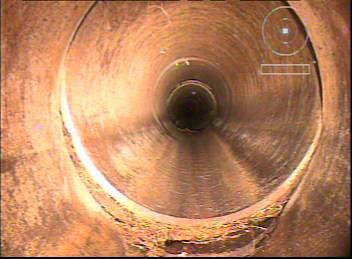
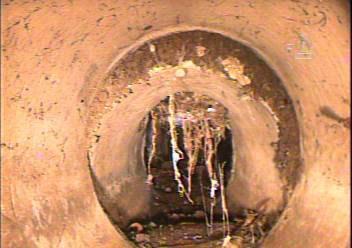
Figure 9 Culverts Overall Condition Distribution as in April 2022
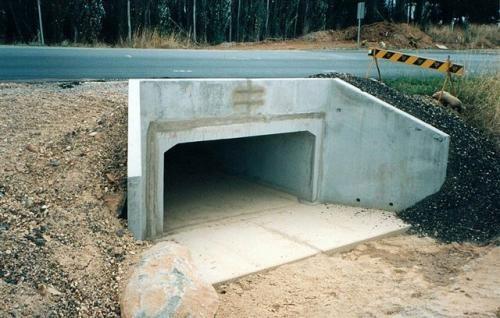
Figure 10 Culverts Condition Example: 1, 5, 7 from left to right
Culverts Overall Condition Distribution
Buildings
Buildings were inspected and valued by an external contractor in 2021.
Buildings Overall Condition Distribution
Figure 11 Buildings Overall Condition Distribution as 2021
Approx. $46 million building components are in condition 3, approx. $170,000 building components (condition 6 and 7) require immediate capital work.
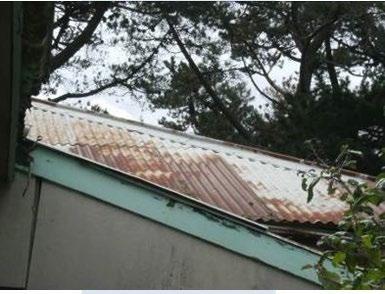
Figure 12 Buildings Condition Example: 1, 5, 8 from left to right
Pathways
Pathways were inspected in July 2017 by an external contractor. The conditions are updated with time factor in April 2022.
Pathways Overall Condition Distribution
Condition Rating
Figure 13 Pathways Overall Condition Distribution as April 2022
Condition 5 and 6 pathways which consists half of the overall pathways network are going to transit into condition 7 and 8 in the next decade. 684m of pathways require immediate capital work.
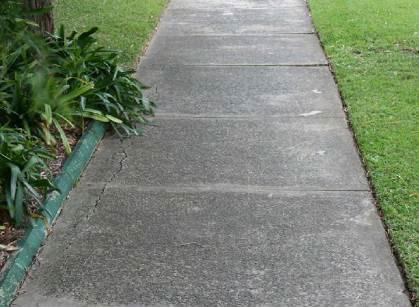
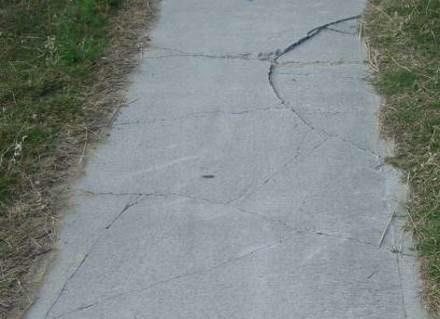
Figure 14 Pathways Condition Example: 4, 6, 9 from left to right
Stormwater Drainage
As the drainage network is buried it is not readily practicable to conduct regular inspections of the condition of drainage pipes. Council undertakes in-pipe CCTV inspections of some sections of the drainage network based on the identification of parts of the network that are performing poorly, and that are not responding to routine maintenance. The stormwater pipe and pit condition is based on the study undertaken in 2009, then applied an age factor at year 2022.
Stormwater Pipes Overall Condition Distribution
Rating
Majority of the stormwater pipes are still at the early stage of their expected useful life. Condition 3 pipes consist of two thirds of whole pipe network.
Figure 15 Stormwater Pipes Overall Condition Distribution as April 2022
Figure 16 Pipe Condition Example: 2, 5, 8 from left to right
The pits exhibits a similar condition pattern as the pipes, a large proportion in Condition 3 and 4 whilst a small percentage at condition 6 and 7.
Figure 17 Stormwater Pits Overall Condition Distribution as in April 2022
Figure 18 Pit Condition Example: 1, 4, 7 from left to right
Recreation and Open Space
The play equipment’s overall condition is derived from the age of the equipment as a percentage of the expected useful life in 2022.
Play Equipment Overall Condition Distribution
The play equipment conditions exhibits a scattered pattern.
The park infrastructures’ conditions were assessed in 2016 and updated with an age factor in 2022.
Park Infrastructure Overall Condition Distribution
60% of the park infrastructures is in Condition 4 whilst 3 assets are in condition 8 which requires immediate attention.
Figure 19 Play Equipment Overall Condition as in April 2022
Figure 20 Park Infrastructure Overall Condition as in April 2022
The swimming pools were renovated at various levels in the past decade, the overall condition had been updated by internal staff in April 2022
Table
Transfer Stations
Council had undertaken a desktop study for transfer stations condition assessment by internal staff in April 2022.
Future Demand
According to the Australian Bureau of Statistics, the Shire’s estimated residential population at the 2016 Census was 5,721. The 2021 census will be released in June 2022. Almost 90% of the population live in the townships of Dimboola (1,730), Jeparit (477), Nhill (2,184) and Rainbow (683). Based on the 2016 Census data, our shire has the second lowest population density in the State of Victoria at less than one person per square kilometre.
Hindmarsh Shire Council has a small population base with aging population issues. The new migrants program is unlikely to have a significant impact on the demand of various assets.
Roads Increasing Truck Mass Legal axle loads for trucks have steadily increased
Changes in Farming Practices
Rural Population
The shift towards cropping away from grazing has resulted in a significant increase in the tonnage of goods carted off-farm with a corresponding effect on the road pavement Blue gums
Reduction in occupied rural residences requires less all-weather access roads
New Development Council will consider any development proposal that requires upgrade of the existing standard of road to meet the need of the development, on its merits.
Should Council approve such an upgrade, the owner / developer would be expected to fully contribute to upgrading the access to current Council standards. A maintenance contribution may also apply.
Review B-double and HML access
Monitor
Monitor
Investigate, negotiate and monitor
Bridges, Weirs & Culverts
Heavy vehicle legal load increases
Movement of grazing to cropping
Buildings Greater public mobility.
Changes in building uses. Eg
New recreation reserve social rooms duplicating halls.
Population and demographic changes. Eg aging population
Changes in service preferences
Pathways
Ageing population
Greater number of bridges with load restrictions
Increased number of heavy vehicle trips. Greater impact on users from any detours
Decreases demand for facilities
Duplication of services. Additional costs
Main factor in changing demand for services
Investigate formal bridge upgrade program
Monitor traffic counts and impact on levels of service
Refer to service plans and availability levels of service
Monitor use and refer to Disposal process
Refer to service plans
Factor in changing demand for services Refer to service plans
With the ageing population there is a corresponding growth in the use of scooters for mobility and a greater need for level wellconstructed paths
Disability Discrimination Act The Act requires that Council provides equitable access for all. This requires Council to:
- Improve kerb ramps to remove the obstacle created by the lip,
- Install tactile surface indicators on key connector paths for the visually impaired, and
Monitor
Continue with Kerb Ramp Upgrade program
Asset Class Demand Factors
Stormwater Drainage
Recreational Paths
Impact on the Plan Actions
- Improve paths to provide for the passage of wheelchairs and similar. Council is obligated to progressively address these issues.
Walking is a popular growing activity. Refer to Service Planning Increased use of scooters (gophers) Increased demand for kerb ramps, smooth, new paths New upgrade program to remove lip from existing kerb ramps.
Climate change
New developments
(residential, industrial)
Open Space Playgrounds
Transfer Stations
Rural Population
Table 27 Infrastructure Future Demand
It is possible that climate change will cause more severe rainfall events that will place additional stress on the drainage networks. Council will need to be aware of any deficiencies that become evident and respond in an appropriate manner.
Monitor
Increased loading on downstream existing assets. Include retention requirements in new subdivisions
There has been a growing number of initiatives to manage urban stormwater in a more sustainable manner. This integration of management of urban stormwater with urban planning and design is known as Water Sensitive Urban Design (WSUD). WSUD has environmental benefits including improving urban landscape, reducing pollutant export, retarding storm flows and reducing irrigation requirements.
Demographics: Increase in child, youth population
Consider in design solutions
No impact: declining population
Reduction in occupied rural residences requires less waste treatment Monitor
Financial Summary
Current and Historical Costs
Council’s current cost profile for managing all asset classes is presented separately as renewal and maintenance.
The
and maintenance costs over the last two years are presented in the table below:
Table 28 Current and Historical Renewal and Maintenance Cost
Future Costs
Council had adopted an industry leading predictive software – Assetic Predictor to model the lifecycle costs of its infrastructure assets. Modelling has been undertaken for up to a 10-year period for each asset class to estimate the financial demands for renewal funding balancing short life and long life assets using the data that is available The modelling also splits roads into several key elements / categories (including sealed and unsealed roads, and kerb and channel).
The modelling tool has been configured so that the standard life and condition at end of life can be varied so that assets can be renewed when they reach those intervention levels. The purpose of the modelling is to provide an estimate for each asset class on what the demand on funding is by applying unlimited funding. This is based on a set of assumptions and provides an indication both on how the funding demand varies with time and on how the certain asset classes may have spikes in funding demand. 2% inflation factor has been used to estimate the future costs.
For this Plan the longer-term average funding requirement has been reported together with the time-based funding profile generated by the model. While both figures are based on the best available information there is ongoing work to refine assumptions and balance funding and service levels and affordability.
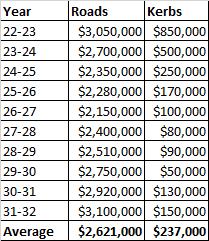
Roads
The road network has been modelled assuming resealing at $4.6-$6.5/m2 for spray seal and $7.86 for asphalt surface. Road pavement work costs $30-$38/m2 for different road hierarchies. The intervention levels are condition 7-7.5 for different sealed road hierarchies. Gravel resheet is assumed to cost $7.5/m2. Re-sheet intervention level is set at condition 6.5. It is assumed kerbs are renewed when they reach a condition of 7.5 at a replacement cost of $500/m.
Roads and Kerbs Unlimited Budget Scenario Required Renewal Roads Kerbs
Bridges, Weirs and Culverts
Bridges and weirs will be partially renewed when they reach the intervention condition of 5.5 with 15% replacement value as the partial renewal cost. Culverts are expected to be renewed at condition 6.5 with replacement value as the renewal cost.
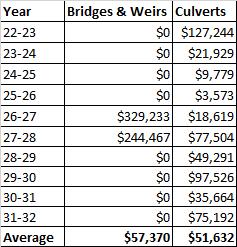
Bridges, Weirs and Culverts Unlimited Budget Scenario Required Renewal
Thousands
Renewal
Figure 21. 10 Years Roads and Kerbs Unlimited Budget Scenario Required Renewal
Figure 22. 10 Years Bridges, Weirs and Culverts Unlimited Budget Scenario Required
Bridges & Weirs Culverts
Buildings
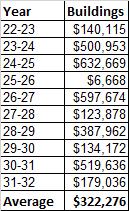
The buildings have been modelled so they are partially renewed (renovated) at condition 5.2 at the cost of 22% of the replacement value
23. 10 Years Buildings Unlimited Budget Scenario Required Renewal
Pathways
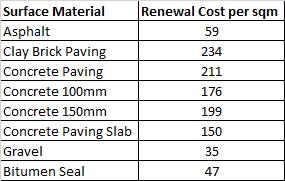
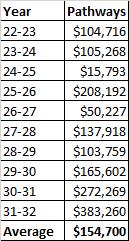
Pathways are modelled with the intervention level at condition 7. Different surface materials had been allocated with different renewal unit rate.
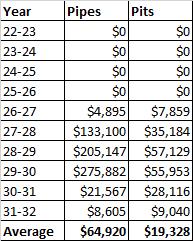
Stormwater Pipes are modelled with intervention level at condition 7 and stormwater pits are modelled with intervention level at condition 7.5. The renewal cost is the financial replacement cost.
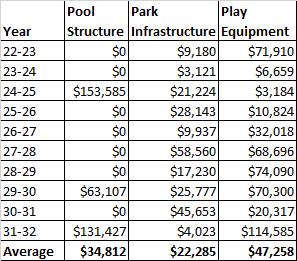
The pool structures are modelled with partial intervention at condition 5, the partial renewal is estimated to cost 5% of the replacement value. The park infrastructure and play equipment are modelled with intervention level of condition 7 and 8 respectively, the renewal cost is estimated using the financial replacement cost.
Recreation
Pool Structures
Park Infrastructure Play Equipment
Figure 25. 10 Years Stormwater Unlimited Budget Scenario Required Renewal
Figure 26 Recreation and Open Space Unlimited Budget Scenario Required Renewal
and Open Space Unlimited Budget Scenario Required Renewal
Transfer Stations
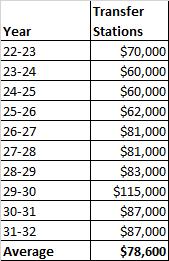
Council estimates the transfer stations’ long-term financial plan budget is sufficient for the unlimited budget scenario
Transfer Stations Unlimited Budget Scenario Required Renewal
Figure 27 Transfer Stations Unlimited Budget Scenario Required Renewal
Modelling Scenarios
The previous charts are based on the current data sources which require improvement to better forecast renewal for specific years. These data sets will require review and refinement in methodologies to better predict end of useful life and will be part of regular review and updates and part on an improvement plan.
Accordingly for the purposes of this plan, in order to even out spending an overall average expenditure for renewal has been determined based on attempting to reduce the deterioration of the asset base, recognising the uneven nature of the unlimited budget scenarios presented above.
Council had prepared a long-term financial plan from 2022 Financial Year to 2031 Financial Year. This modelling assumed 2032 Financial Year LTFP has the same budget as 2031 Financial Year.
Table 29 Long-Term Financial Plan in $,000’s (Capital Renewal Expenditure from 2023 to 2031)
The table below shows the proposed increase in average annual renewal funding to reduce the funding gap.
Table 30 Proposed average annual renewal expenditure v average annual demand
Below renewal funding profile illustrates the funding gap for each asset class. The main gap is forecasted to occur for roads, bridges and buildings.
Renewal Funding Profile
$3,000,000
$2,500,000
$2,000,000
$1,500,000
$1,000,000
In all cases the actual and planned spending does not meet theoretical demand. Further work is needed to refine the assumptions and data collected for determining demand. It is anticipated the theoretical demand will reduce in future versions of this plan.
As a result the planned renewal for this plan has the following impacts on increasing condition and potentially reducing service levels in the following groupings:
Figure 28 Renewal Funding Profile
Figure 29 Roads and Kerbs Average Condition - Unlimited Budget Scenario vs LTFP
Roads Bridges, Weirs & Culverts Buildings
Pathways
Drainage
The scale (condition 0 to 10) of the above figure had been modified to 0 – 5 in order to better illustrate the changing pattern overtime. Roads surface condition, pavement condition and kerb condition are almost identical between two scenarios as LTFP meets the unlimited renewal target, LTFP will achieve 0.1 better condition if LTFP is adopted from the 4th year.
Bridges, Weirs & Culverts
30 Bridges,
and
Average
- Unlimited
vs LTFP Bridges and weirs are forecasted to be 0.5 condition worse if Council adopts LTFP due to a renewal gap of $45,000 per year. Buildings
Figure
Weirs
Culverts
Condition
Budget Scenario
Figure
Pathways
32 Pathways Average Condition - Unlimited Budget Scenario vs LTFP
Both funding scenarios are forecasted to achieve the same condition pattern as the renewal expenditures are almost identical.
Stormwater Drainage
Figure 33 Stormwater Drainage Average Condition - Unlimited Budget Scenario vs LTFP
Similar to Pathways, two scenarios are forecasted to achieve similar condition pattern as funding gap is minimal considering overall asset class replacement value.
Figure
Transfer Stations
Transfer Stations are forecasted to achieve the same average condition over ten years as the funding is identical for both scenarios.
Transfer Stations Unlimited Budget Scenario vs LTFP
Life Cycle Costs
The Asset Life Cycle
The lifecycle management plan provides information about assets, including particular actions and costs to provide a defined (current and/or target) level of service in the most cost effective manner.
This section provides background information on the assets and details of what is planned to manage the assets. Note that most of the background information may be constantly changing and is only accurate at the time of this plan. The location of up to date information should be identified in each plan.
Council ensure the most efficient actions are taken through the life of assets in the following ways.
Planning
Council consult with the community to ensure the correct services are being provided and prioritised Purchase of Assets
Council complete a comprehensive study prior to purchase which considers the following:
• Is the asset fit for service (ie will it perform the intended outcome)
• Is it the best way to provide the service (are there other non-asset solutions that are better)
• Complete life cycle costs
• Risk assessment
• Maintenance and operation. It is paramount that recognition of all costs associated with the operation and maintenance of an asset over its entire life is considered when determining the performance of that asset. In undertaking this assessment it is important to also recognise that initiatives to reduce life cycle costs can be considered in 5 key stages;
o planning;
o design;
o construction/acquisition;
o maintenance & operation; and
o disposal
It is essential to quality asset management that the data is accurate and in many cases reinforced each year by field inspections.
Where the data is sourced from personal judgement and/or extracted from hard copy data sources, a follow up program is essential to allow the asset management software to re-adjust the outputs based on more reliable information.
The condition, remaining service life, repair/replacement imperatives and the timing of rehabilitation or replacements are critical factors in assessing the asset and constructing models to manipulate available or needed funding that produce affordable and acceptable long-term outcomes.
In some cases infrastructure and community assets can be renewed or rehabilitated throughout their lifecycle so that their lives may be almost infinite. Nevertheless, the risk might well be that the asset has certain characteristics, which may lead to extremely expensive maintenance requirements. Examples may include timber bridge structures, or a recreational facility with particular component and/or physical characteristics, or a masonry structure requiring particular stonemason skills which may be impossible to obtain.
Operations/Maintenance
Operations expenditure is incurred on assets that require regular and ongoing activities to service and clean assets so that they continue to deliver the services expected by the community. This includes the development of systems and processes needed the help manage assets in a systematic way.
Maintenance is driven by Council’s approach to inspecting assets and identifying defects and planning rectification works in line with set intervention and service levels. Council is also responsive to community requests. Council strives to be proactive in planning and delivering programmed maintenance works and is also responsive to issues identified in a more reactive manner.
Historic maintenance costs from 2021FY to 2022FY have averaged $2.8 million per year The future maintenance cost is predicted according to the condition of the assets. In general, the maintenance cost would be higher as the assets approaching the end of their useful life, for example, a condition 5 road surface will cost significantly more to maintain than a condition 1 road surface.
For the purpose of this plan $2.8 million operation cost has been adopted for year 2021-22 and a 2% indexation has been allowed for each subsequent year.
Allowance has not been made for the increase in maintenance cost in time because of the introduction of new assets. Consideration in future versions of this plan will look at the impact on the increase in maintenance cost for new assets for growth or to meet demand.
Projected Operation and Maintenance Expenditure Based on LTFP
Roads Bridges, Weirs & Culverts Buildings Pathways Stormwater Drainage Recreation and Open Space Transfer Station
Renewal
Asset renewal is driven by a condition-based assessment process which considers the useful life of the assets with consideration to their utilisation and service level. The utilisation is represented in the asset hierarchy. Council has developed a rigorous approach to regularly inspecting assets and predicting their remaining life. When assets reach end of life they are programmed and budgeted for replacement with the most appropriate treatment (considering whole-of-life costs) to ensure the asset continues to provide the required services to the community.
This plan has been developed based on the assumptions included in the modelling with the inclusion of other structures and allowances for escalation This funding level, which is an increase from historic levels, is considered appropriate recognising the overall condition in the future will be deteriorate further then today. By doing this the majority of assets are maintained to be serviceable and are treated prior to them reaching an unserviceable condition.
The allocation of funding for renewal should be sustained to maintain service levels. An annual CPI index of 2% is included.
Upgrades
Upgrades are driven by the need to increase the capacity of assets to cope with the current or emerging need or demand of the community.
Figure 35 Projected Operation and Maintenance Expenditure Based on LTFP
Council has developed a systematic approach to these upgrades, based on definition of standard service levels to be provided from assets, and reflecting the hierarchy of assets in each asset class. The gaps between the current and desired service levels is a key driver of planned asset upgrades in the roads, bridges, buildings and open space asset classes.
A second driver for upgrades is the range of strategies developed by Council which identify changes to existing services or in some cases new services that Council aims to provide. These strategies may identify either upgrades or new asset requirements.
The proposed expenditure profile in response to the demand drivers can be summarised as follows:
• Roads – deficiencies in road width on freight corridors is driving the road upgrade plan.
• Bridge and Major Culverts – with increases in heavy vehicles, bridges need to be assessed against current bridge codes and upgraded for future demand. In the meantime, strategies to manage the risk to road users are being considered.
• Buildings– in response to driving economic development in the region consider investment is planned.
• Pathways - in response to demand drivers for having footpaths on both sides of the street on main routes, improving pedestrian access to key destinations, and increasing shared paths, allowance is made for significant expansion of the footpath network.
• Stormwater Drainage – the perceived demand for stormwater upgrade is low and limited funding is allocated to stormwater. New subdivisions will be required to incorporate detention systems that do not increase the discharge from the historic land use into the drainage system.
The timing of works will be driven by availability of funding and projects will be prioritised in accordance with documented methodologies included in the Long Term Capex Plan, presented later in this document.
Upgrades will impact the future depreciation and sustainability of the Council as the more assets it has the more money is needed to manage them together with increases in depreciation. This is being factored into the development of the Long Term Financial Plan so that there is a balance between demand and financial sustainability.
Acquisition
In some cases, to deliver a new or upgraded service as identified in a strategy, Council may need to either acquire land or a developed property to achieve the planned outcome. Acquisition of these assets will be through normal commercial processes and based on a business case assessed by Council (subject to the level of expenditure / officer delegations).
Expansion
Council manages this expansion by requiring compliance with a set of infrastructure standards, known as the Infrastructure Design Manual (and the Sustainable Infrastructure Guidelines – which are under development), which has been adopted by many councils across rural Victoria. Council both reviews the submitted plans and oversees works to ensure the developments are constructed to these standards.
On completion of the works, many of these assets are then “gifted” to Council, which then takes on the ongoing maintenance and renewal responsibility. Assets typically gifted to Council include roads, kerb and channel, footpaths, drainage (including wetlands) and open space. Other assets may be gifted to various utilities, e.g. GWM Water.
Disposal
Where assets are obsolete to current and future requirements, Council can plan to dispose of assets no longer meeting a community need, and by doing so ensure that Council only manages assets that are required by the community.
Council maintains an asset disposal policy to ensure that good value is obtained from any disposal of assets and that transparent processes are used in the disposal.
Decommission
Decommissioning is the final stage of the asset lifecycle.
Planning for decommissioning is often done as part of the initial planning of a new project, so that any asset that may no longer be required on completion of a new project or change to service can be identified and its future determined. Assets may also be decommissioned in other cases where there is no ongoing service need or where the delivery approach has altered, and an asset is no longer required to supply services to or for the community and is surplus to Council’s needs.
Decommissioning of an asset may involve a range of options, including:
• Demolition and returning to previous condition of the asset.
• Disposal / sale of an asset, including potentially land on the open market.
Long Term Capex Plan
Development of Long Term Capex Plan
Council has established a systematic process for development of its 10-year, Long Term Capex (Capital Expenditure) Plan (LTCP). Two key elements contribute to the projects and costs of the Plan, these are:
• The costs of asset renewal, as identified in this Asset Plan.
• Upgrade and new projects identified in the Council Plan and a range of other strategies and plans. Project cost estimates were developed for all projects, as well as the identification of the potential source of funds for projects. A key to this funding is the reliance on grants.
There are many semi-regular grant funds available from the Australian and Victorian Governments which enable Council to match its own funds on a 1:1 basis for some projects. For some larger projects, a greater level of grant funding is required to enable these projects to proceed. Development of this LTCP enables Council to focus on the further development of business cases and advocacy efforts for these key projects.
Prioritisation
A systematic approach to prioritisation of capex projects has been developed. This is based on the following key parameters:
• The service level standard for the hierarchy of that asset, compared to the current service level of the asset
• The level of use of the asset,
• Equitable service levels between areas, and
• The ability for assets to be multi-use (depending on the class of asset).
Different parameters are used for different asset classes, with the detailed scoring process outlined in Appendix B of this Plan.
The scoring developed through this process was used in the initial prioritisation of projects in the LTCP. Ultimately, some minor adjustments in priority are required to achieve a balanced and affordable program of works in each year’s budget taking into account factors such as the mix of available funds, including the potential availability of suitable grants.
Community Panel Recommendations
This plan is to be reviewed by the community.
Long Term Capex Plan Expenditure
Below table illustrates Council’s adopted Long Term Capex Plan in thousands from 2023 FY to 2031 FY. Please note below table includes budget for non-infrastructure assets.
Long Term Financial Projection
The financial projections are shown in table below for the projected operations, maintenance, capital renewal and capital new/upgrade and estimate budget funding.
Table 31 Projected Operation, Maintenance and Capital Expenditure
$14,000,000
$12,000,000
$10,000,000
$8,000,000
$6,000,000
$4,000,000
$2,000,000
$-
Projected Operation and Maintenance and Capital Budget Operations & Maintenance
Table 32 Projected 10-Year Operation and Maintenance and Capital Budget
Note1: Level 1 inspection frequencies have been split into Day and Night as some defects are more readily identified at night.
Note2: Inspections to be scheduled such that each inspection type is carried out at the frequencies shown. Each inspection type is to be carried out independently of other inspections for each road.
APPENDIX 2 RISK ASSESSMENT AND
REMEDIATION – SEALED
NATURE
INSPECTION
Pothole Patching
Regulation of Wheel Ruts and Depressions
Edge Repairs
Pavement Failures
Hole is to be repaired to a smooth surface consistent to line and level of surrounding
Return to line, level, and trafficable surface, with no ponding of water evident.
To provide a trafficable lane.
Failure is to be repaired to a smooth pavement surface consistent with line and level of surrounding pavement.
Kerb and Channel Minimal ponding
Hole is more than 450mm diameter or more than 75mm deep.
Wheel rut or depression is more than 75mm deep and more than 20m2 in
Edge breakaway is more than 125mm over 5m in length.
Surface disruption is more than 75mm over area more than 20m2.
When ponded water extends outside the lip of the channel. Subject to funding Subject to funding Subject to funding Subject to funding
Table Drains Minimal ponding Any obstruction that significantly prevents free flow of water.
Culverts/inc. separated Culverts
Shoulder Grading
Roadside Signage/Gui de Posts
Roadside Grass Cutting
Water flow is unrestricted
Provision of a trafficable surface which is free draining and which prolongs the pavement life.
A fully visual signposted and delineated road network.
To maintain sight distance and reduce fire risk.
Silting or 50% obstruction of cross section.
Edge Drop off is more than 100mm over more than 50m in length.
Illegible or missing warning signs or missing guide posts at culverts.
Inadequate visibility at intersections or on curves.
(see note 3)
(see note 3)
In conjunction with works
Note 1: Where the defect warrants emergency action, this is taken within 24 hours of receipt of notification
Note 2: The times shown in the above tabulation are subject to variation in times of extreme weather conditions when extra demands may be placed on Council resources.
Note 3: Depends on availability of signs/guideposts.
Note 4: Signage/notifications may be used as an intervention.
Appendix 3 RISK ASSESSMENT AND REMEDIATION – UNSEALED
Potholes and Corrugations Trafficable pavement free of potholes, corrugations and other surface defects.
Pavement Failure Failure is to be repaired to a smooth pavement surface consistent with line and level of
Roadside Signage / Guide Posts
A fully visual signposted and delineated road network.
Roadside Grass Cutting To maintain sight distance and reduce fire risk.
Potholes and corrugations are more than 600mm diameter and 150mm deep
Area of failed pavement is more than 20m2 in area.
Illegible or missing warning signs or missing guide posts at culverts.
Inadequate visibility at intersections or on curves.
Table Drains Minimal ponding Any obstruction that significantly obstructs free flow of water.
Culverts Water flow is unrestricted Silting or 50% obstruction of cross section
(see note 3)
Note 1: Where the defect warrants emergency action, this is taken within 24 hours of receipt of notification
Note 2: The times shown in the above tabulation are subject to variation in times of extreme weather conditions when extra demands may be placed on Council resources.
Note 3: Depends on availability of signs/guideposts.
APPENDIX 4 ROUTINE MAINTENANCE SERVICE LEVELS & STANDARDS
ROADS HIERARCHY – URBAN ROADS
CLASSIFICATION DEFINITION
4U COLLECTOR OR THROUGH
5U RESIDENTIAL PRIMARY ACCESS
Unclassified roads linking parts of the townships or leading to the town centre. Would be sealed or surfaced all weather roads.
Unclassified road providing access to occupied residential, industrial or commercial properties. Would be sealed or surfaced all weather roads.
6U PROPERTY SECONDARY ACCESS
Annually or when I.L. exceeded. Annually or when I.L. exceeded
Annually or when I.L. exceeded. Annually As necessary When I.L. exceeded As necessary As necessary
Roads or laneways providing alternate access to occupied properties or access to vacant land. Would not necessarily be all weather construction. Annually Annually As
ROADS HIERARCHY – RURAL ROADS
3R LINK
4R COLLECTOR
5R RESIDENTIAL ACCESS
Unclassified roads connecting two towns, villages or districts. May be sealed or formed and surfaced.
Unclassified road linking residence and property access roads into higher class roads. May be sealed or formed and surfaced.
Unclassified road providing all weather access to occupied houses in rural or rural residential areas.
Annually or When I.L. exceeded. 2 times per year or when I.L. exceeded
Annually or When I.L. exceeded.
Annually or When I.L. exceeded
Annually or When I.L. exceeded 2 times per year or when I.L. exceeded Annually
Annually or When I.L. exceeded
Annually As necessary As necessary As necessary As necessary
6S STRATEGIC Class 6 road considered strategic and maintained more regularly N/A N/A N/A Annually or When I.L. exceeded As necessary
6R PROPERTY ACCESS
Roads providing access to rural properties for farming purposes. Would not necessarily be an allweather road. N/A N/A N/A As necessary As necessary I.L. – Intervention level
Appendix 5 FOOTPATHS AND VEGETATION FREQUENCY
Appendix 6 BRIDGE INSPECTION FREQUENCY
The following tabulation, in accordance with the VicRoads Bridge Inspections Manual guidelines, indicates the frequency and detail required for the inspections of all bridges within the Shire.
LEVEL 1 To check the general serviceability of the structure, particularly for the safety of road users, and identify any emerging problems
LEVEL 2 To assess and rate the conditions of the structure (as a basis for assessing the effectiveness of past maintenance treatments, identifying current maintenance needs, modelling and forecasting future changes in condition and estimating future budget requirements)
LEVEL 3 To assess the structural condition and behaviour of a structure, to identify and quantify the current and projected deterioration of the structure, and to assess appropriate management options.
Every 6 months
All new structures within 12 months of opening, thereafter on a 5 year cycle.
Bridges;
• reporting poor condition in the Bridge Inspection System
• showing evidence of accelerated deterioration
• for which significant works such as rehab, strengthening or widening is proposed