1.4 ContextofInformationinGeomatics
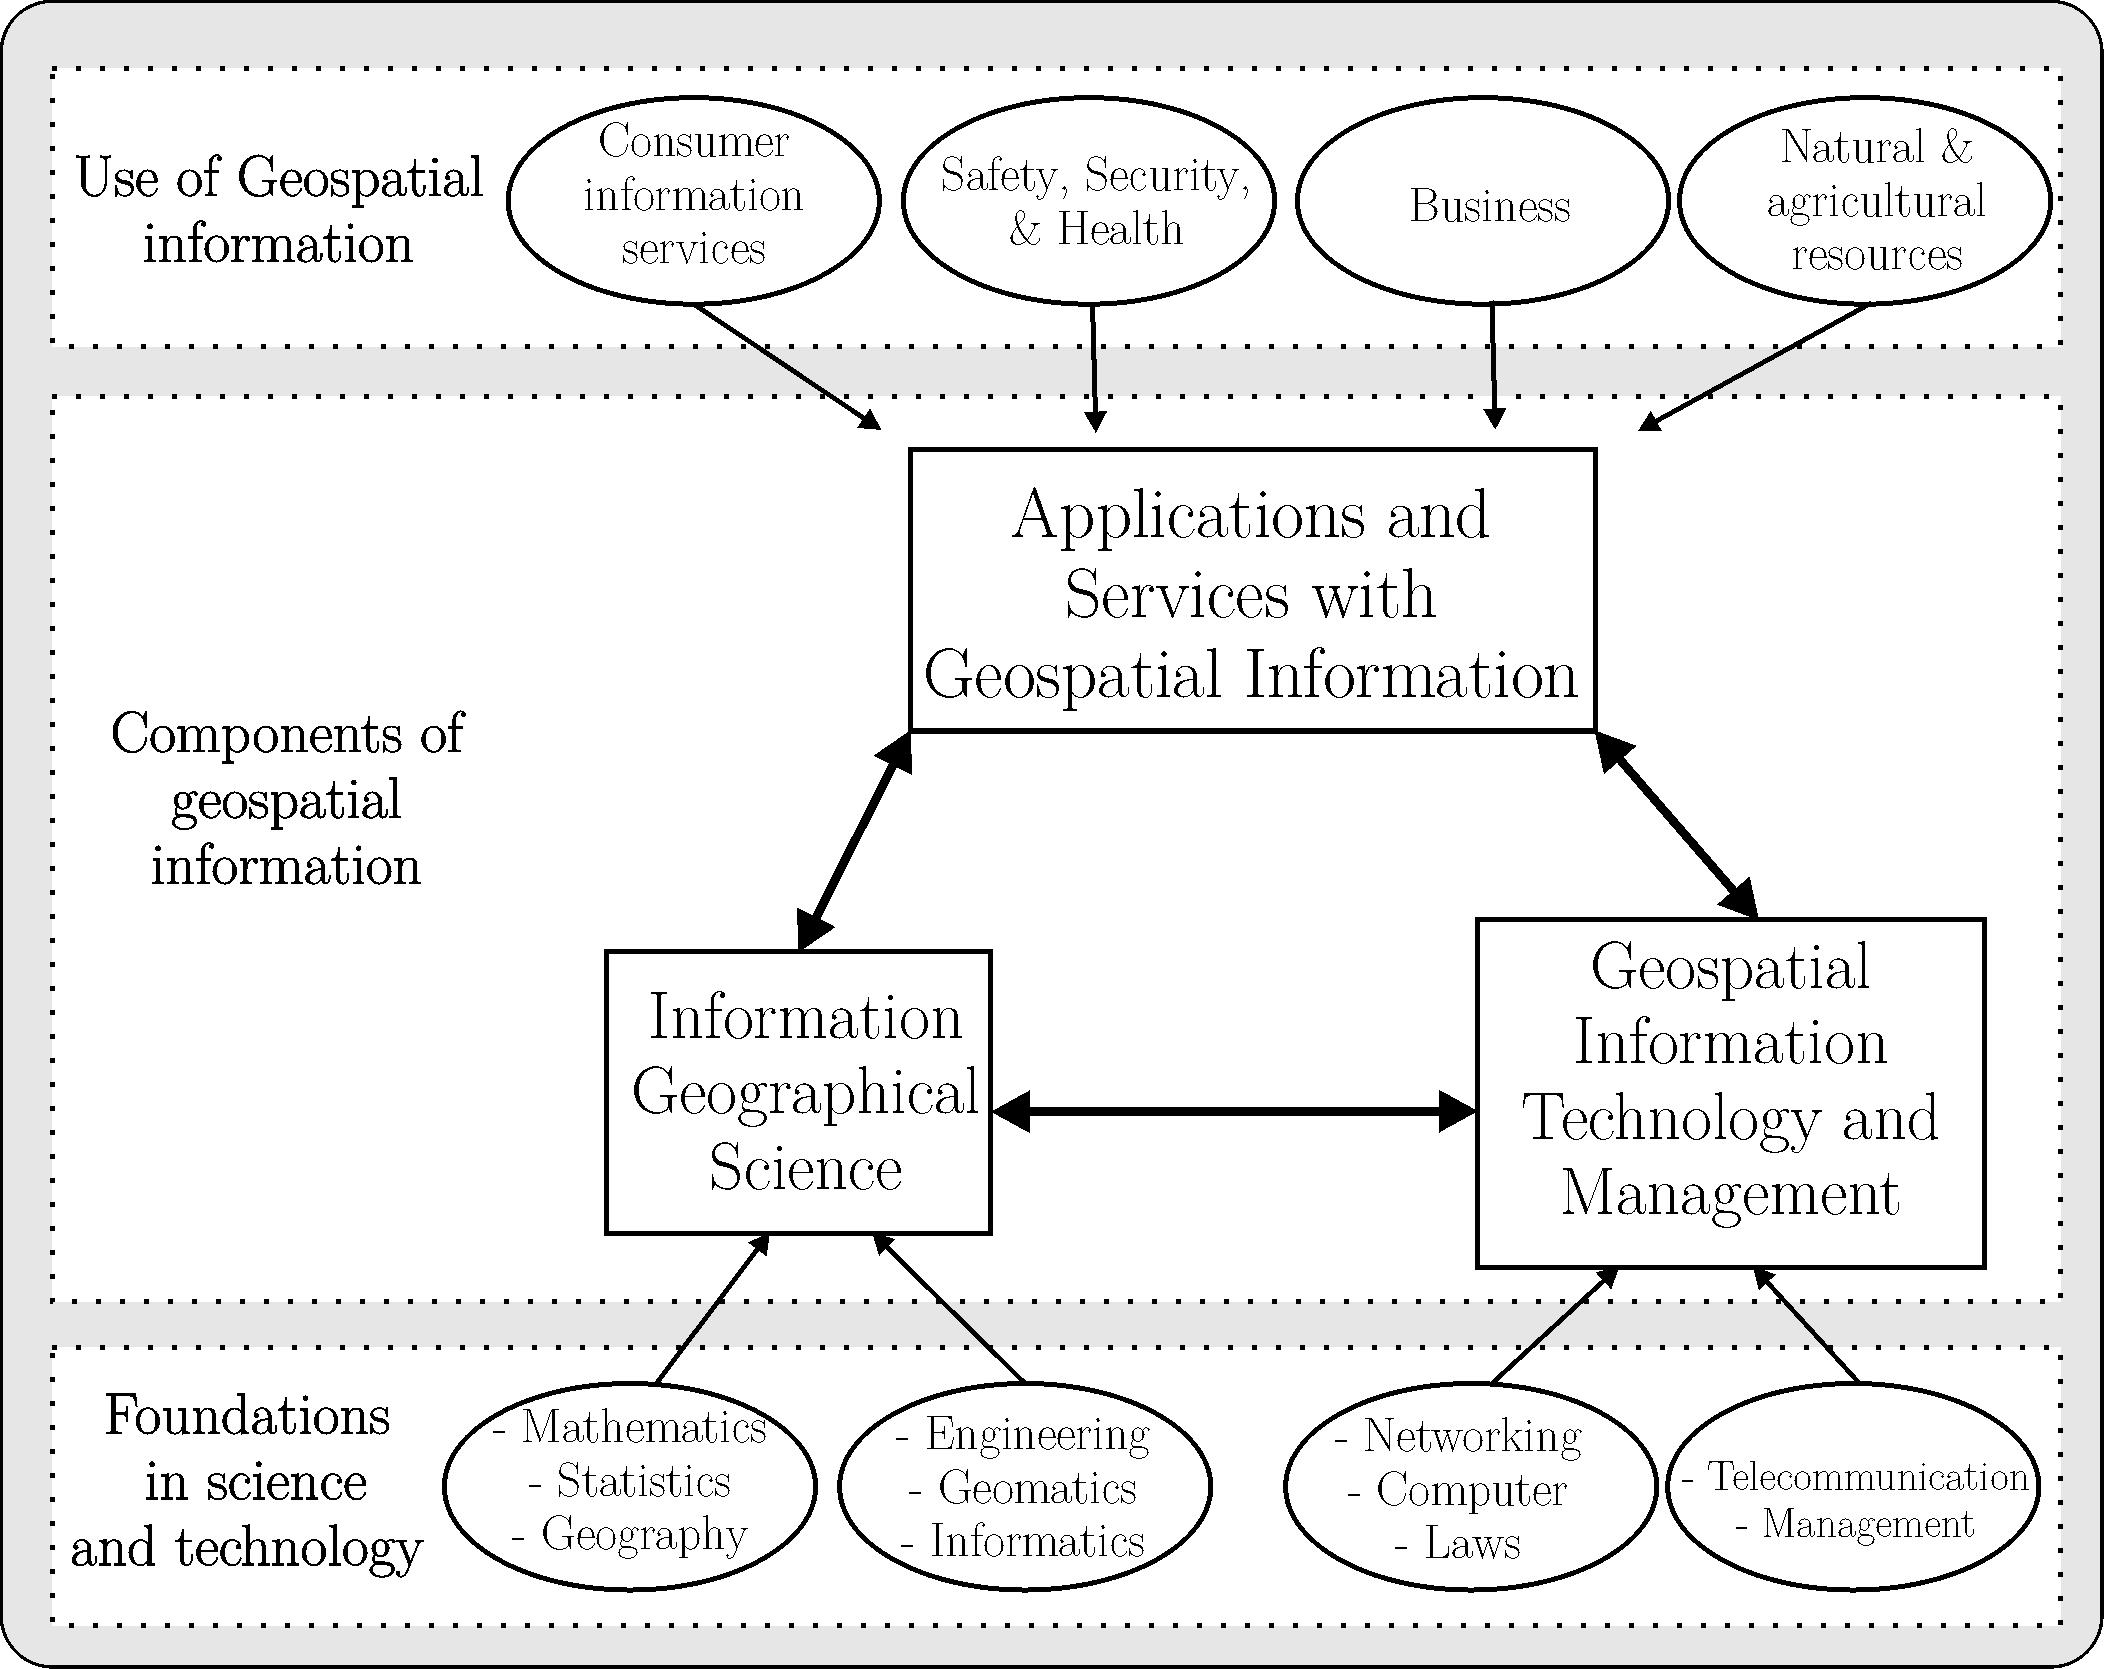
Thegeospatialinformationusedoccursinacontextconsistingofthesetofknowledgeacquired inscientificresearchandgeospatialapplications,technologiesappliedtodevelopandmanage computersystemsandtheinstitutionscreatedtofacilitatetheacquisitionanddevelopmentof geospatialinformation.Thecontextofgeospatialinformationaffecteddifferentsectorsofthe economy(Figure1.1)(LoandYeung, 2007).
Themainsourcesofgeospatialinformationproductionare(BurroughandMcDonnell, 1998):
•Topographicmapping;
•Propertyregistrationandcadastre;
•Hydrographicmapping;
•Militaryorganizations;
•Remotesensingandsatelliteagenciesandcompanies;
•Surveyofnaturalresources,suchasgeology,hydrology,soil,ecology,biogeography,meteorology,climatology,andoceonography.
Themaintypesofgeographicdataavailableare(BurroughandMcDonnell, 1998):
•Topographicmapsatdifferentscales;
•Imageryatdifferentdatacollectionaltitudesandresolutions;
•Administrativeboundaries,censusdata,zipcode,statistics,people,landcoverandlanduse atdifferentresolutions;
•Marketingsurveydata;
•Utilitydata,suchasgas,water,sewage,powerlines,andInternetnetworkandtheirlocation;
•Dataonrocks,water,soil,atmosphere,biologicalactivity,naturaldisasters,andothertypes.
Themainapplicationsofgeographicdataare(BurroughandMcDonnell, 1998; Nevesetal., 1998; SilvaandAssad, 1998):
1.1: Geospatialinformationcontext.
•Agriculturalsciences,formonitoring,management,descriptionandscenariobuilding;
•Archaeology,fordescriptionandstudyofthepast;
•Environmentalmonitoringandmanagement;
•Healthandepidemiology,forlocatingdiseasesinrelationtotheenvironment;
•Emergencyservices,foroptimizingroutesforambulance,police,fireescape,investigationand locationofcrimes;
•Navigation,forair,sea,andland;
•Marketing,forlocatingplacesandtargetgroups,deliveryoptimization;
•Regionalandlocalcostplanning,maintenance,andsitemanagement;
•Planningandmanagementofhighways,railroads,andairways;
•Propertyandinventoryevaluation,calculationofcut,fill,andvolumeofmaterials;
•Socialstudiestoanalyzepopulationmovement,localandregionaldevelopment;
•Tourism,forlocatingandmanagingattractionsandfacilities;
•Everydayutilitiesforlocating,managing,andplanningwater,drainage,gas,electricity,telephone,andcablingservices.
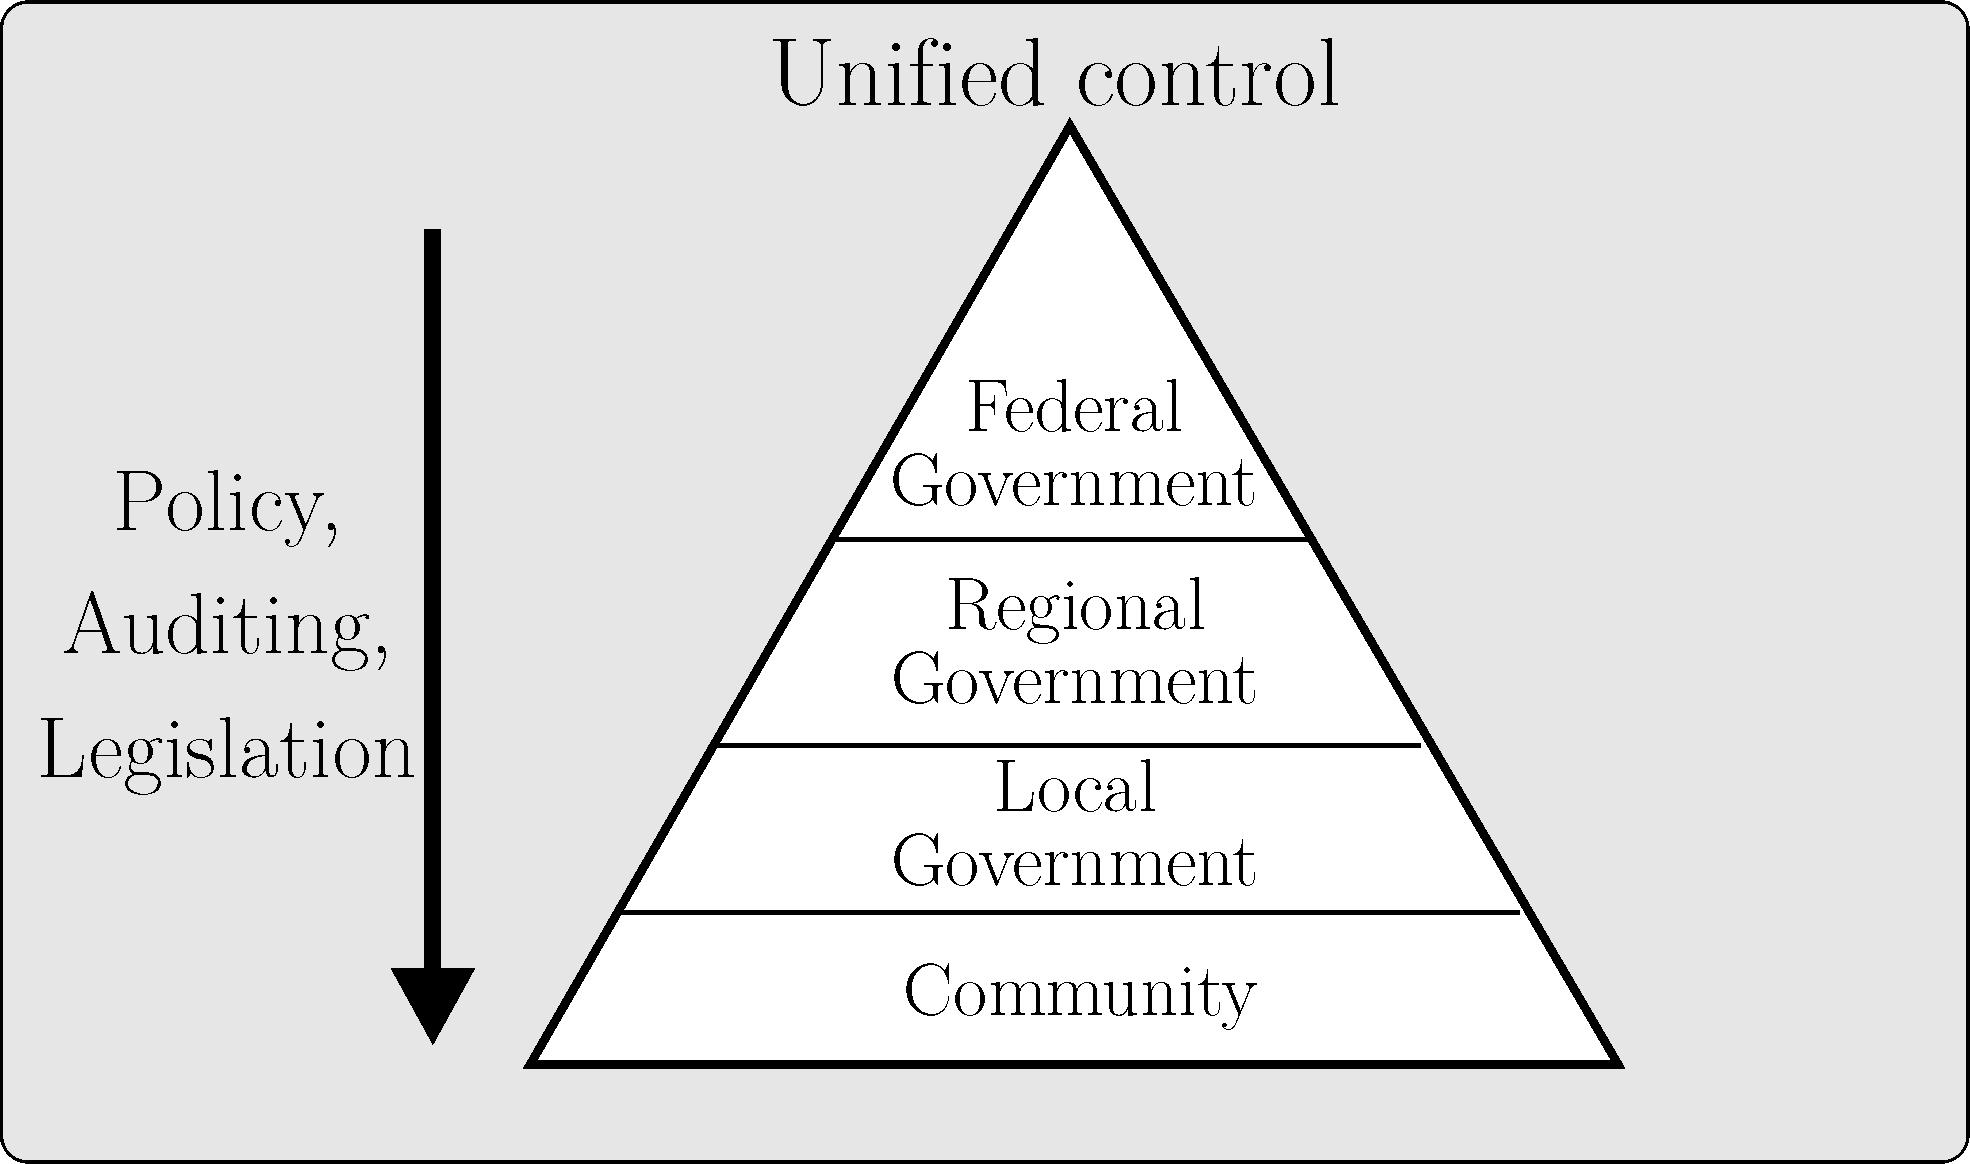
Withtheneedtoimprovethequalityofproducts,services,andprocesses,geomaticshasbeen usedatdifferentstructurallevelsofgovernmentorganizationsinthefollowingapplications(Figure 1.2)(Longleyetal., 2001):
•Inventoryresourcesandinfrastructure,planningtransportationrouting,improvingpublic
FIGURE
servicedelivery,managinglanddevelopment,andgeneratingrevenuebyincreasedeconomic activity;
•Useofgeomaticsinlong-termgeographicproblemswithhealth,safetyandwelfareofcitizens, incorporatingpublicvaluesindecisionmaking,providingservicesinafairandequitable manner,andrepresentingcitizens’opinionsbydemocraticwork;
•Applicationsofgeomaticsinpublichealthriskmonitoring,housingstockmanagement,social welfarefundallocation,crimetracking,geodemographyanalysis,operational,tacticaland strategicdecisionmakinginenforcement,healthplanningandeducationmanagement;
•Assetinventory,policyanalysis,modelingandstrategicplanning.
1.2: Useofgeomaticsatdifferentstructurallevelsofgovernmentaldecisionmaking.
1.5 ScientificApplicationsofGeomatics
Inthedevelopmentofscientificapplicationsofgeomatics,somefundamentalconceptsarepresentedinordertoclarifyanyconceptualdoubtsaboutscience,scientist,research,experiment, andhypothesis(Table1.1).
Inthedeductivescientificmethod,achainofdescendingreasoningofanalysisfromthegeneralto theparticularisusedtoreachaconclusion.Intheinductivescientificmethod,inferencesabout ageneraloruniversaltruthnotcontainedintheobservationsaremadefromparticularobserved data.
Inbasicresearch,usefulknowledgeisgeneratedfortheadvancementofsciencewithnoforeseen practicalapplication.Inappliedresearch,thegenerationofknowledgeforpracticalapplicationis directedtothesolutionofspecificproblems.
Sinceinsciencethegoalofknowingandsolvinggeographicproblemsvariedaccordingtothe
FIGURE
complexityofavailablescientificprinciplesandtechniques,someprojectgoalsusedingeomatics are(Longleyetal., 2001):
•Rational,effectiveandefficientallocationofresourcesaccordingtocriteria;
•Monitoringandunderstandingthegeospatialcontext;
•Understandingregionaldifferencesofanobjectorprocess;
•Understandingprocessesinnaturalandanthropicenvironments;
•Prescribingstrategiesforenvironmentalmaintenance,airquality,soilandwaterconservation.
Applicationsofgeomaticsshouldbebasedonsoundconceptsandtheorytosolvedifferenttypes ofgeographicproblems(Longleyetal., 2001).
1.6Elaboration ofScientificProjectsinGeomatics
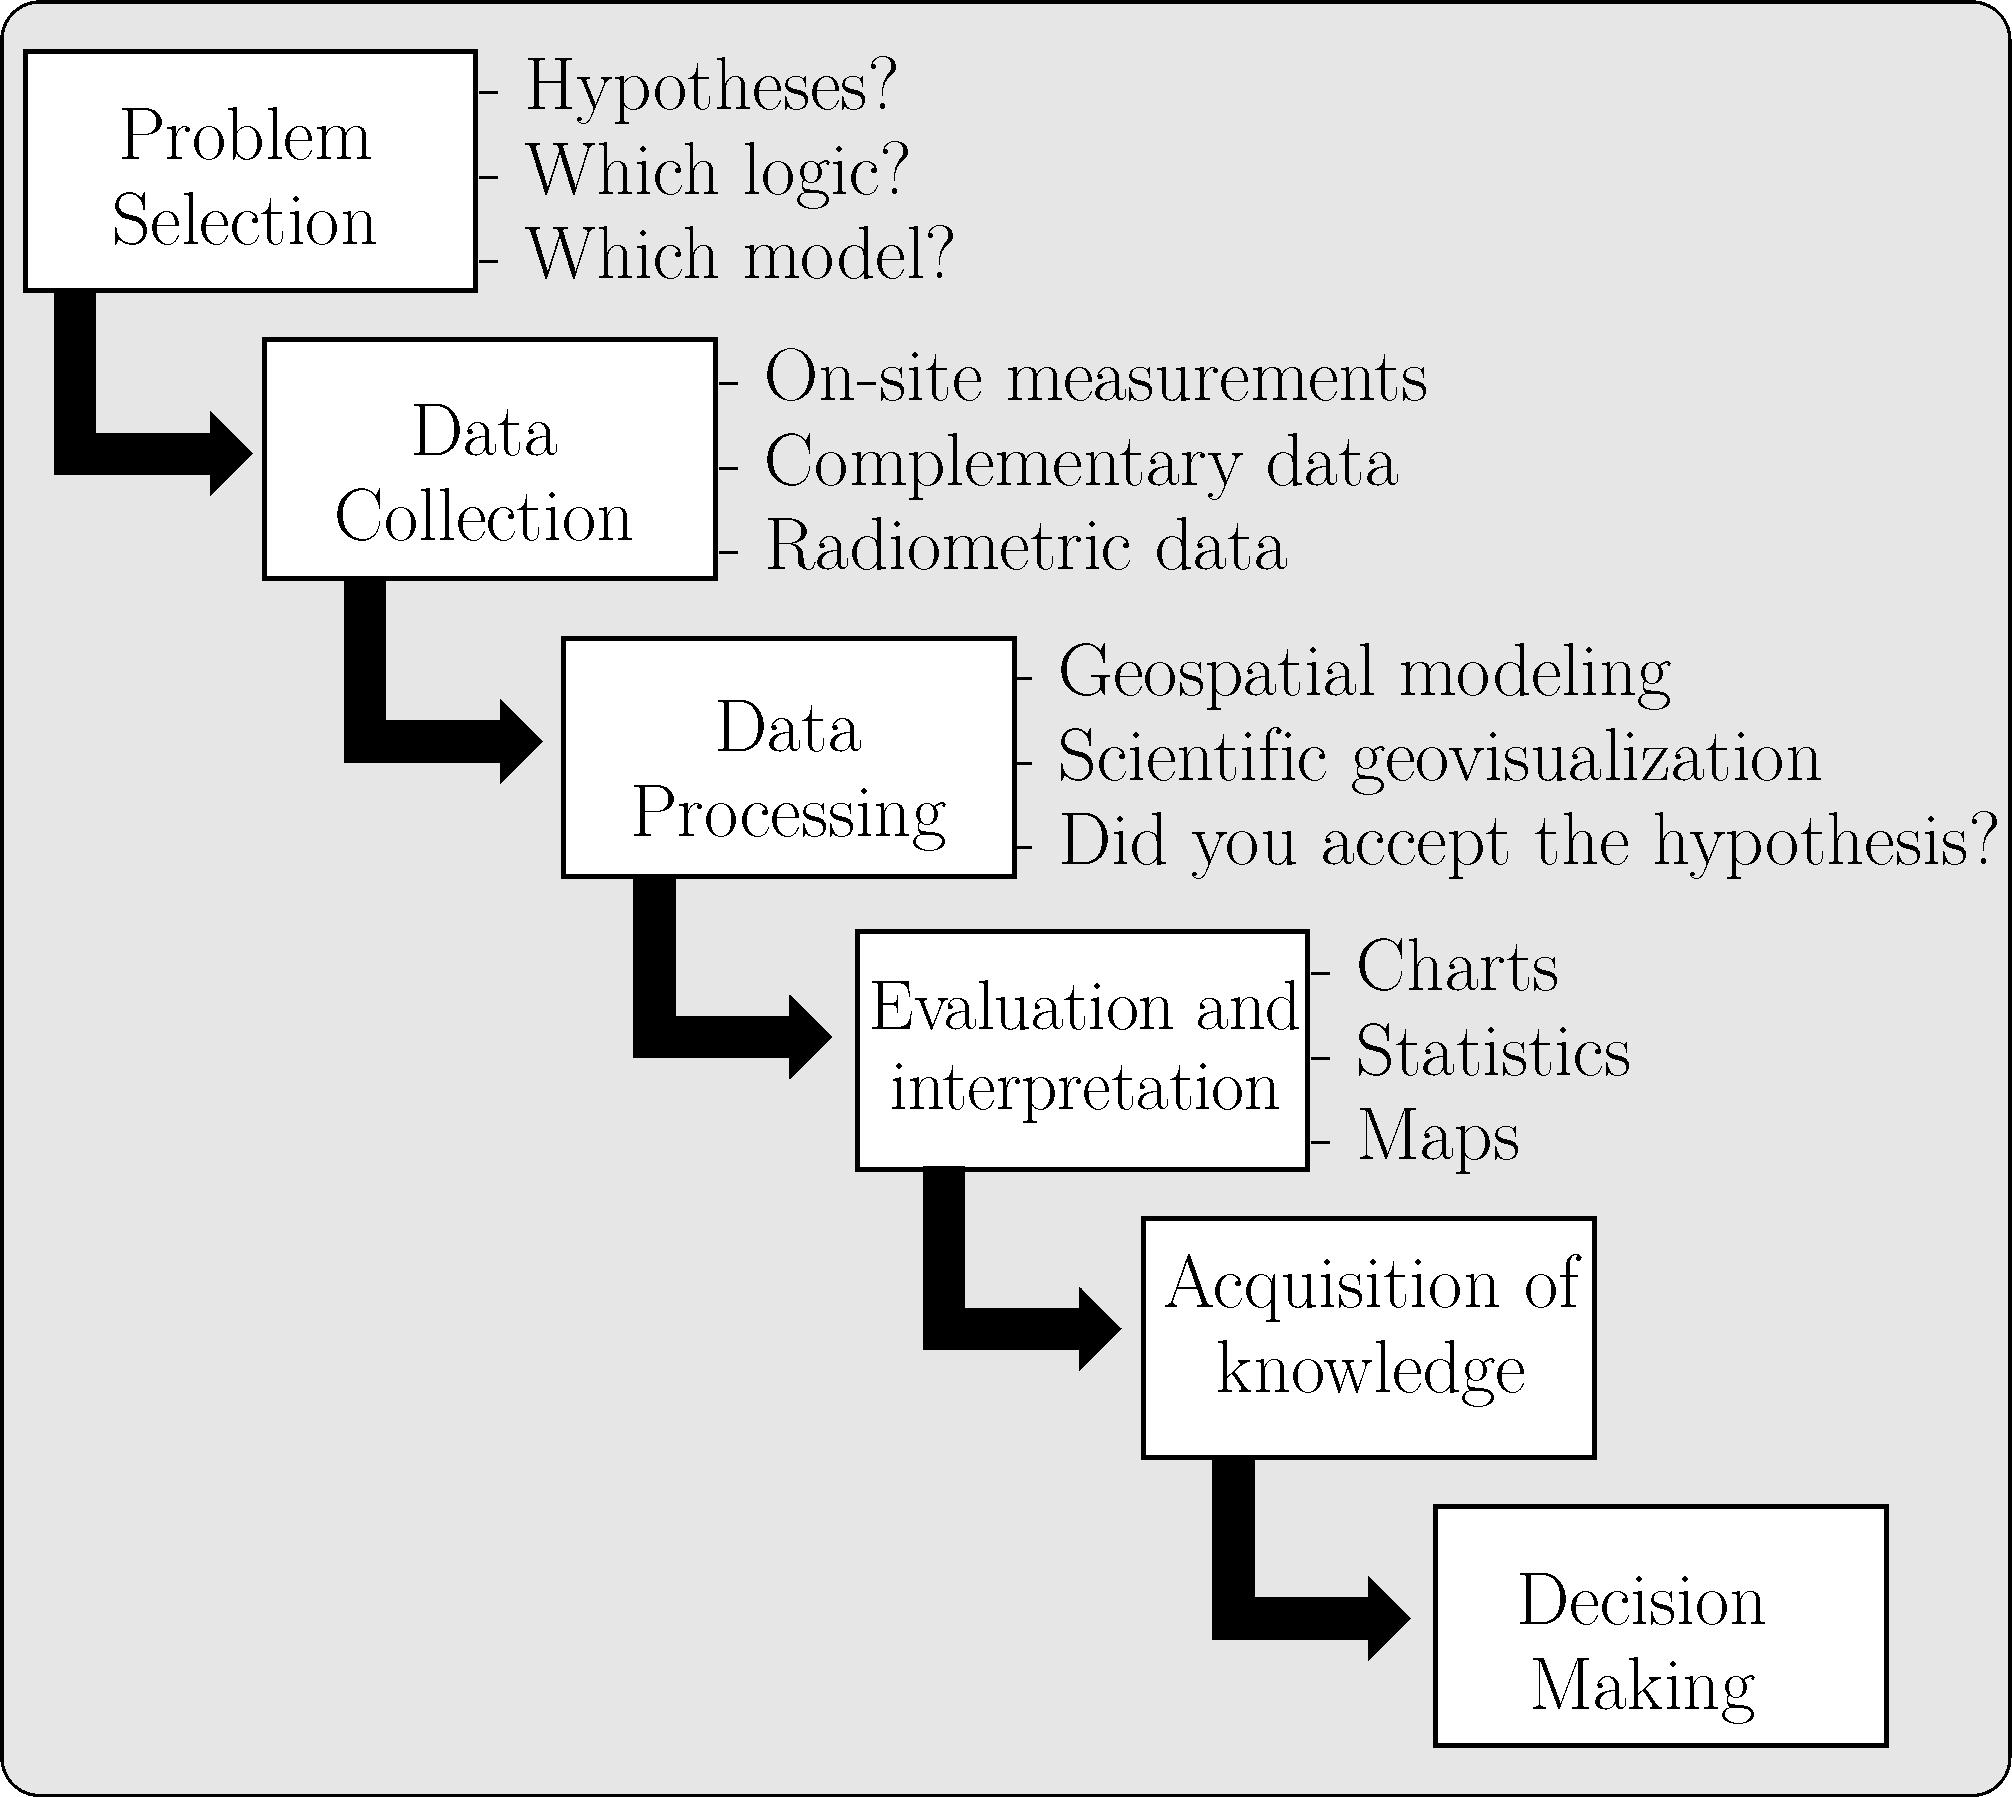
Intheprocessofdevelopingtopographyapplications,thefollowingphasesareaddressedtoobtain theknowledgeneededtomakedecisionsusinggeomatics:
•Hypothesistesting;
•Datacollection insitu;
•Geospatialinfrastructuredatacollection;
•Definitionofsystematicmethodologytoevaluateandinterprettheresultsobtained(Figure 1.3).
Thefullcontentofknowndigitallibrariescanbeusedtoperformkeywordsearchesforgeomatics relatedsubjectsofinterest(Arvanitouetal., 2021):
•WebofScience1;
•ScienceDirect2;
•IEEExplore3;
•ACM4;
•Scopus5;
•GoogleScholar6 .
Inthepreparationofthescientificprojectintheareaofgeomaticssometermscanbewritten withtheverbforminthefuturetense,becausethetextispreparedinthecontextofpresenting apropositiontostudyandgeneraterelevantscientificconclusionsaboutaparticulargeographic problem.Intheelaborationoftheresearchproject,fundamentalconceptsareimportantinscientificsurveyingapplicationsusedintheelaborationofascientificresearchproposalwithgeomatics andR(Table1.2).
1https://www.periodicos.capes.gov.br/?option=com_pcollection&mn=70&smn=79&cid=81
2https://www.sciencedirect.com/
3https://ieeexplore.ieee.org/Xplore/home.jsp
4https://dl.acm.org/
5https://www.scopus.com/home.uri
6https://scholar.google.com/
FIGURE1.3: Stagesofdecisionmakinginapplicationsciencewithgeomatics.
TABLE1.1: Fundamentalconceptsusedinscientificsurveyingapplications.
Term Meaning
Science
Knowingandsolvinggeographicalproblems
Scientist Individualwhogeneratesknowledge
Research Setofactivitiesorientedtowardthesearchforknowledge
Experiment Plannedactivitydesignedtoobtainnewfacts,confirmtheresultsof previousexperiments,orgenerateorvalidatetechnologies
Hypothesis Testablepropositionintheexperimentinvolvedinsolvingproblems
Methodology Useofexperimentalprocedures
1.7 ImplementationofScientificProjectsinGeomatics
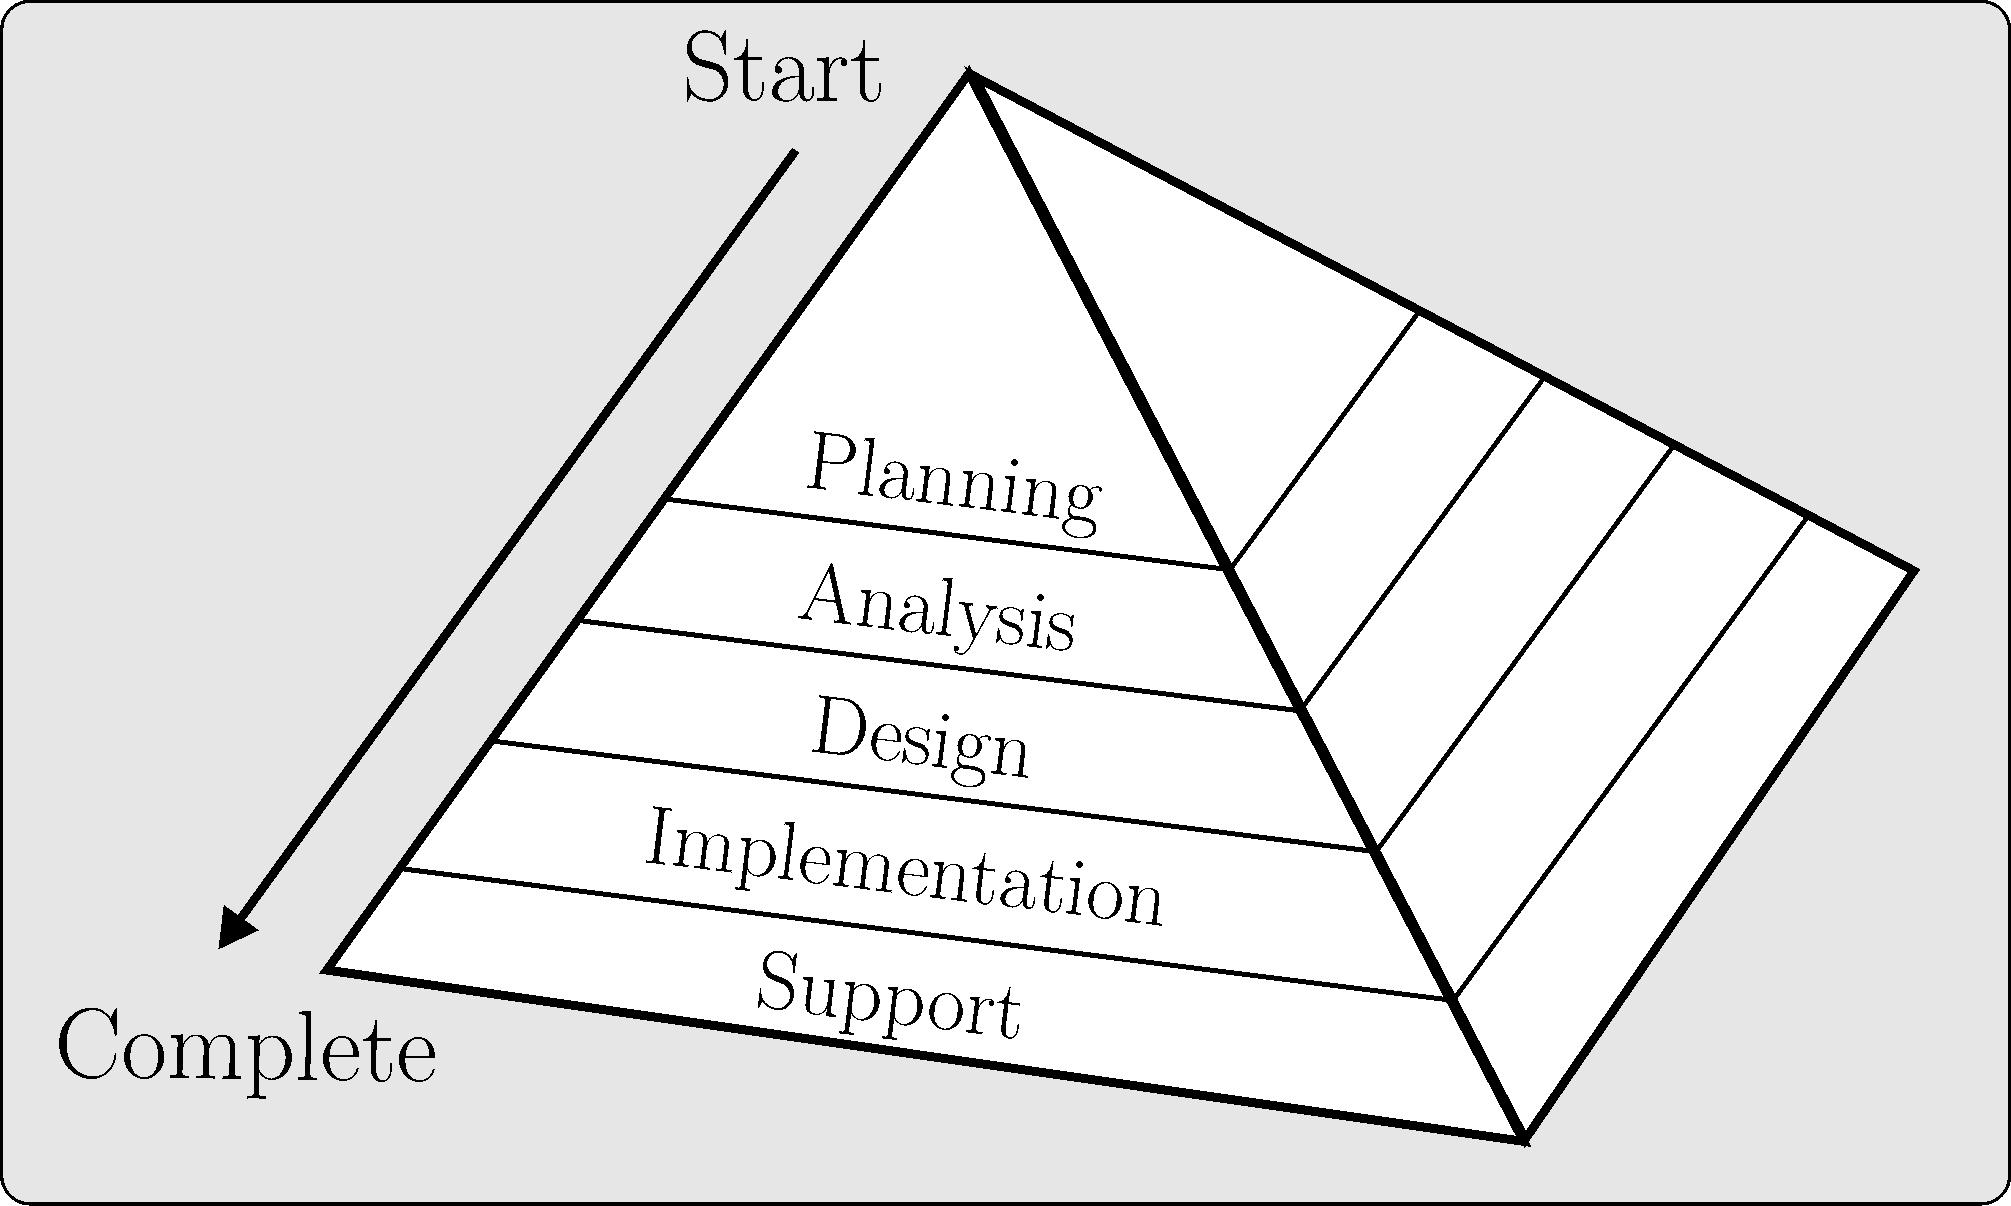
IntheimplementationcycleofscientificprojectsingeomaticsandR,thedevelopmentoccurred asacontinuousandrecursiveprocessinwhichmodificationsandimprovementscanbemade accordingtonecessaryadaptationsinthefaceofnewscientificandtechnologicaladvancesthat exist.Themodelisdividedintodifferentworkingphasesofthedevelopmentprocessinvolving: planning,analysis,design,implementationandsupport(Figure1.4)(LoandYeung, 2007).
FIGURE 1.4: Pyramidmodeloftheprojectimplementationcycleingeomatics.
TheimplementationofageomaticsprojectwithRcanencompassdifferentprojectmanagement andsupportactivities,suchas(LoandYeung, 2007):
•Planning,localizationandcontrol;
•Formalreviewofbusinesscasesandprojectproposals;
•Availabilityofstudiesbysimulationorprototypes;
•Dataandsoftwarequalitycontrol;
•Softwareevaluationandestablishmentofstandards;
•Softwareacquisition,installationandversioncontrol;
•Preparationandproductionoftechnicaldocumentsanduserguides;
•Riskanalysiswithcontingencyplantorecoverdataandsystemfailure.
1.8ScientificDisseminationinGeomatics
Inscientificdissemination,considerationsofscientificwritingintheformofascientificarticle andscientificpresentationintheformatofaslideshowarepresented.
TABLE1.2: Descriptionoftopicsusedinthedevelopmentofscientificprojectsingeomatics.
Topic Description
Title Shouldbesuccinctandcontaininafewwordswhattheprojectis intendedtoaccomplish
Autor Projectproponent,usuallytheprojectcoordinator.Providesinformation onthecallforproposalstowhichtheprojectwillbesubmitted
Abstractand
Keywords Includeindexwordsintheabstractthatarenotinsertedinthetitle
IntroductionDescribestheissuedirectly,pointingouttheproblemandthegenerating demand.Mentionsthediagnosisoftheproblemandhowyouwillsolve it.Obtaininformationaboutpreviousstudiesonsimilarissues HypothesisShouldbewritteninanaffirmativewayinordertoelucidatethetested propositionoftheproject ObjectivesShouldbewritteninawaythatleavesnodoubtastowhatisintended tobeachievedintheproject LiteraturereviewRecentscientificarticlespublishedinhighimpactjournalsonthe researchedsubject Methods Presentmethodologyandinformationthatwillbeusedintheproject
Expectedresults Presenttheexpectedresultsbasedondataanalysis
Execution schedule Timescheduleinwhichtheprojectwillbecarriedout
Technology diffusion Teaching,researchandextensionactivitiesassociatedwiththeproject
MembersResearchers’team,withinformationaboutbranches,institutionandhow theycontributedtotheproject
References Includethebibliographicalreferencesused
1.8.1Scientificwriting
Scientificwriting,althoughanindispensablestepinthescientificprocess,hasoftenbeenoverlookedinsomeundergraduatecoursesinfavorofmaximizingclasstimedevotedtoscientific concepts.However,theabilitytoeffectivelycommunicateresearchresultsiscrucialtosuccessin science.Studentsandprofessionalscientistsarejudgedbytheamountofpaperspublishedand thenumberofcitationsthosepapersreceived.Therefore,asolidfoundationinscientificwriting canbetterprepareundergraduateandgraduatestudentsforproductiveacademiccareers(Turbek etal., 2016).
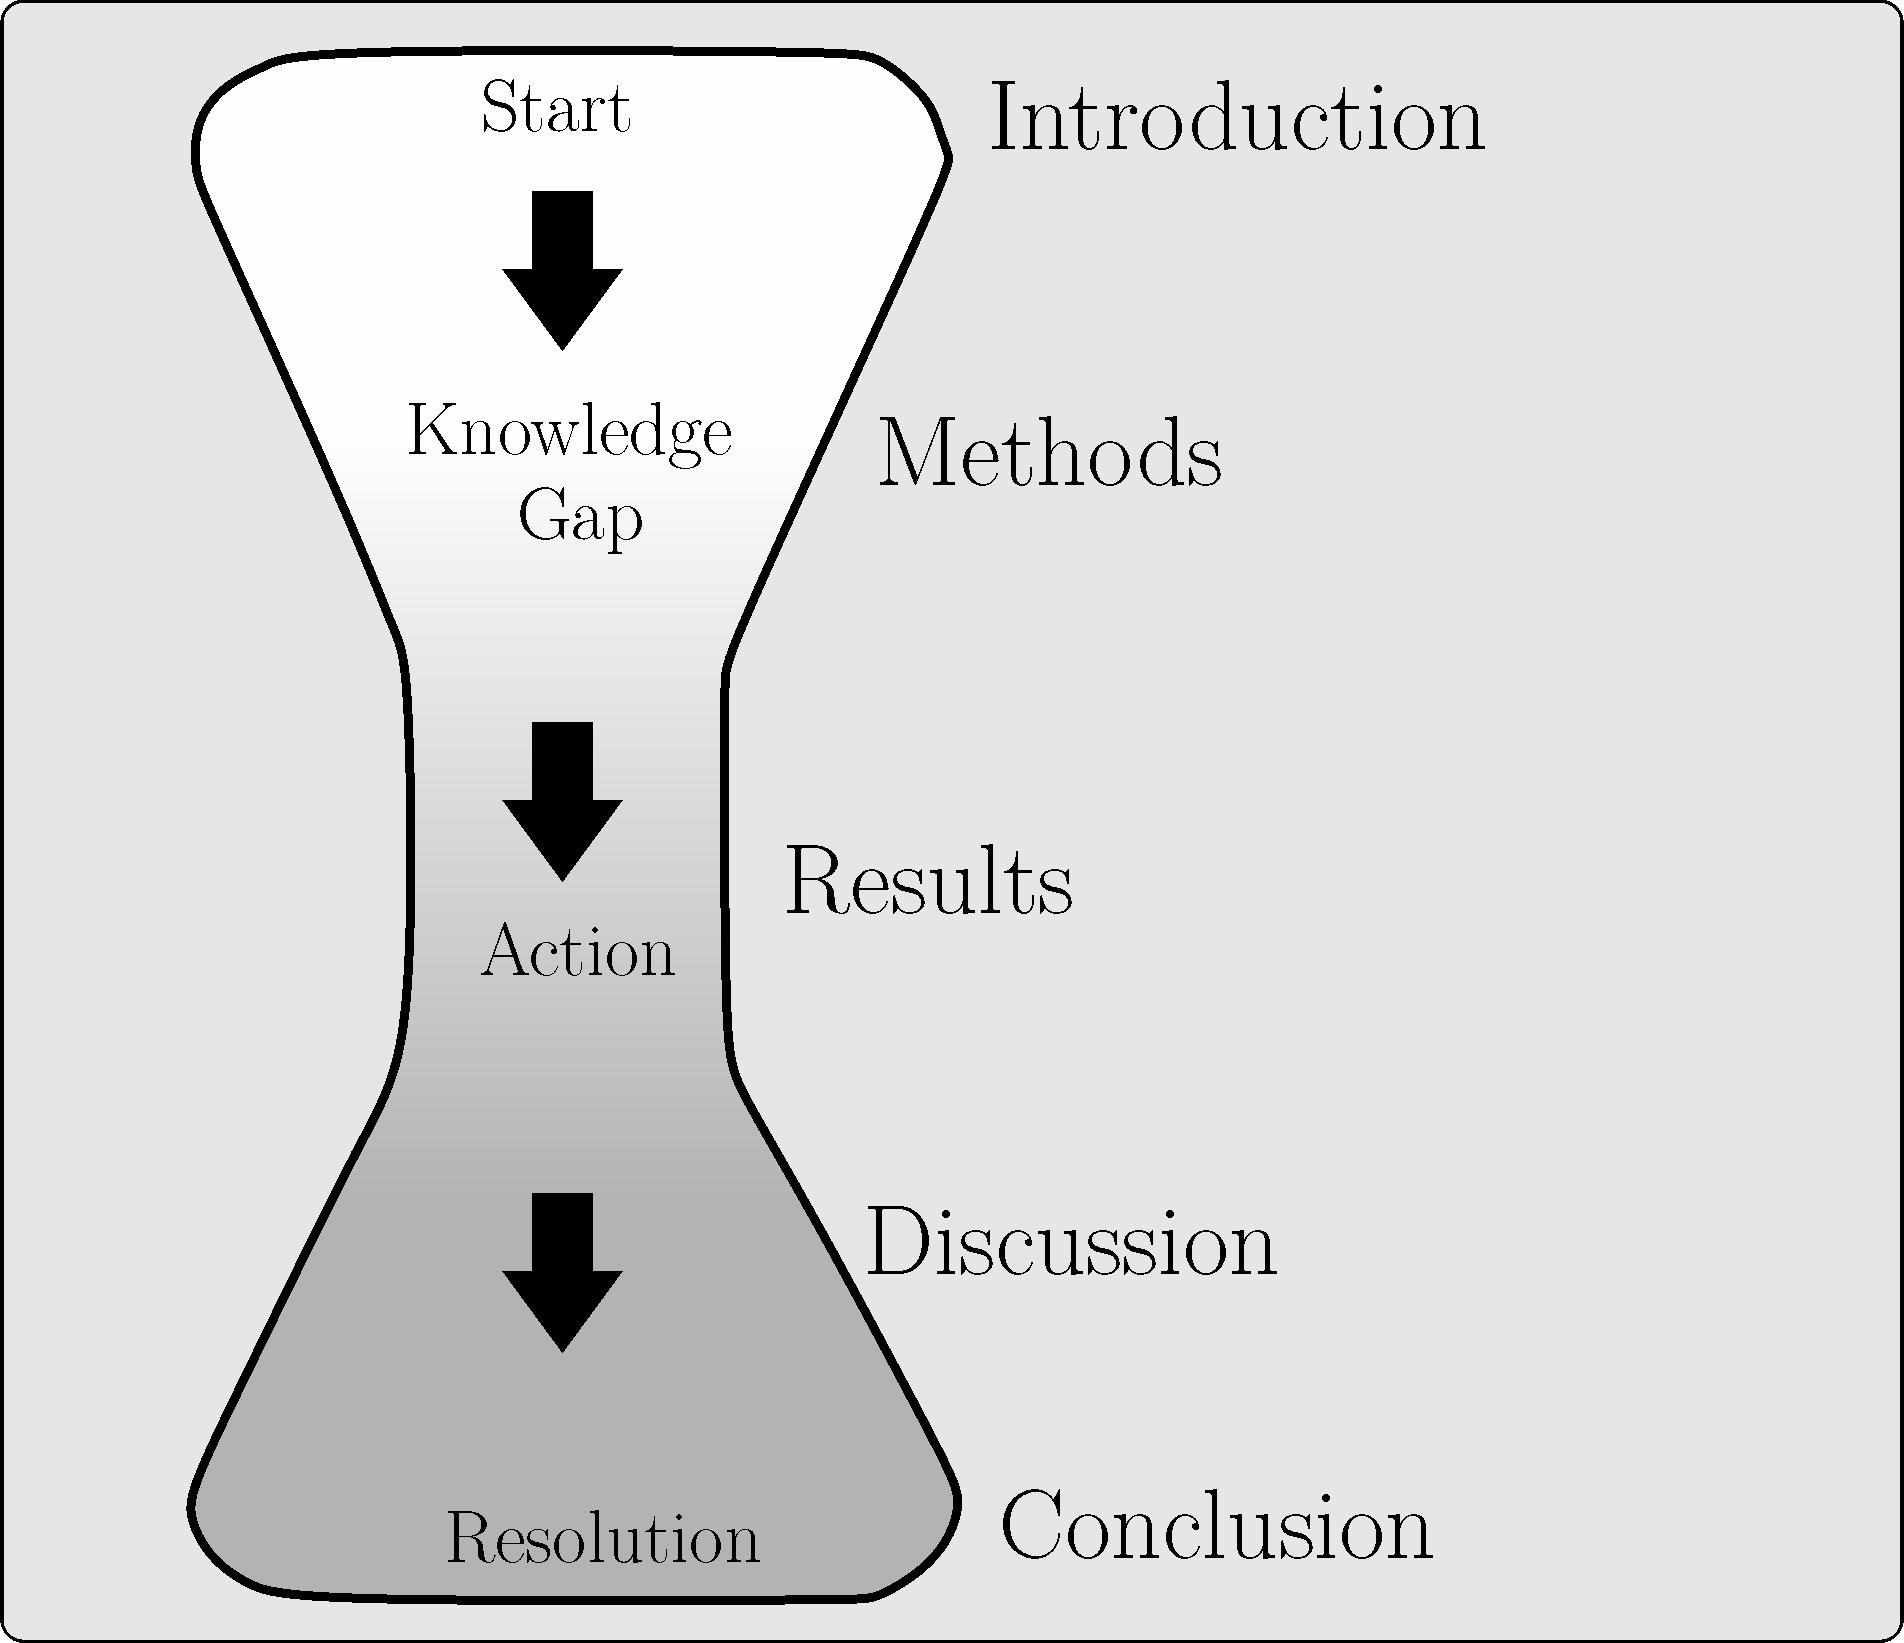
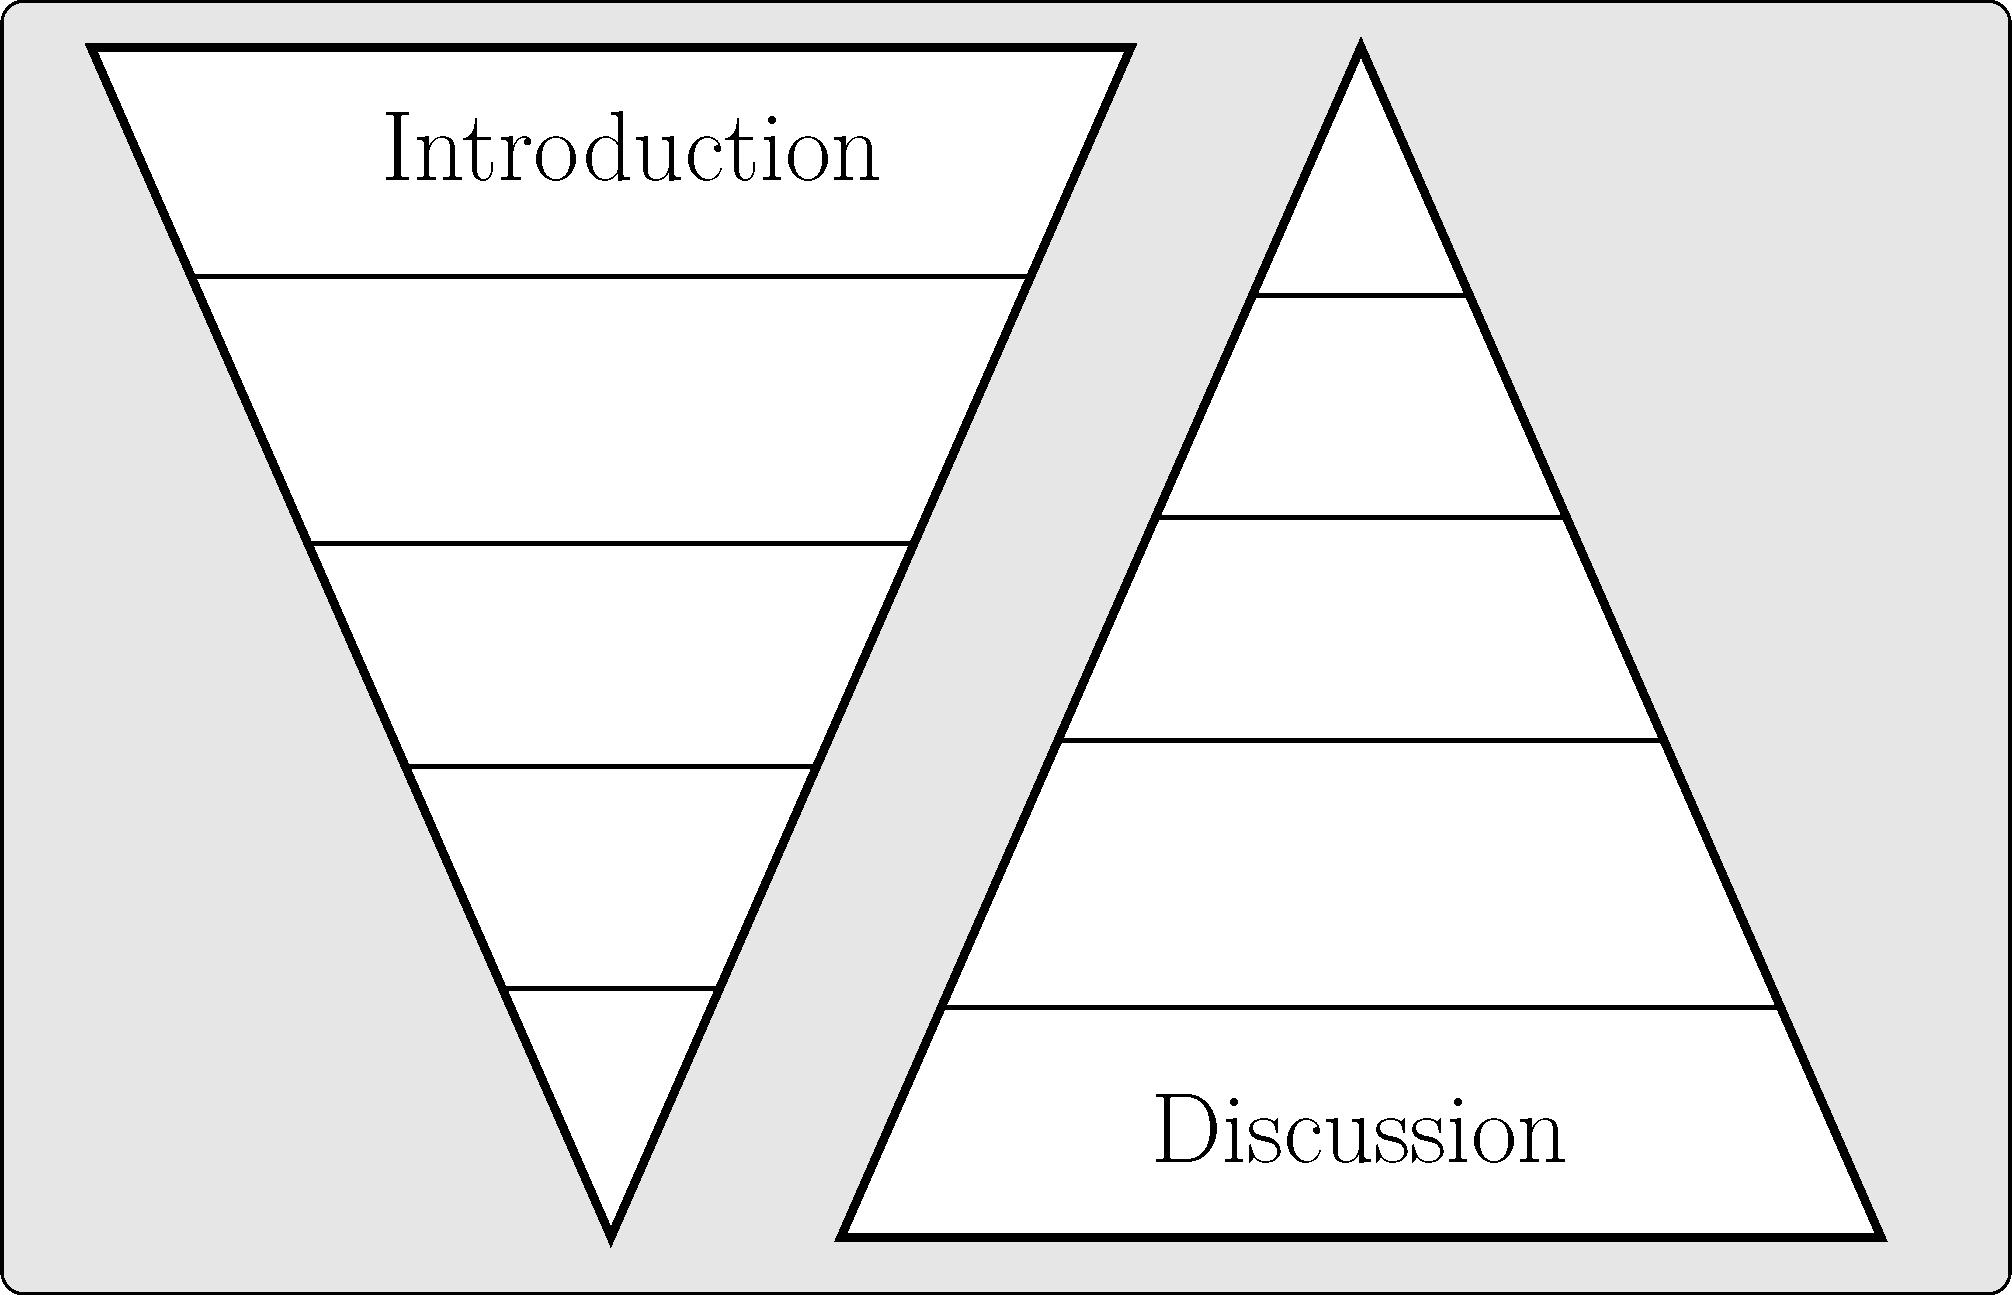
Whenwritingascientificpaper,thestructureofthemanuscriptshouldbesimilartothatofan hourglass,withanopenandbroadbeginning,taperingoffasitnarrowsdowntotherelevant literaturethatdeterminestherelevanceofthepaperasunpublished,definitionofthehypothesis, materialandmethodsused.Theknowledgegapthatwillbeevaluatedshouldbeclearbythis point.Intheresultsphase,correspondingtothemiddleofthehourglass,theobjectivesare achievedthroughofgeomaticsandstatisticaltechniquesusedtoevaluatetheacceptanceofthe
hypothesis.Inthediscussionphaseoftheresultsobtained,thehourglassisagainextendedto interprettheresultsbasedontheexistingliterature,inordertomakeitclearthattheknowledge gappreviouslydetectedisfilled,culminatinginconclusionsandimplicationofthework(Figure 1.5).
FIGURE 1.5: Structureofascientificpapercomparedtotheoutflowofanhourglass.
Therefore,intheIntroductiononeshouldstartfrombroadideastospecificquestions,usinga structurethatresemblestheimageofafunneloraninvertedpyramid.Theoperationofthe DiscussionandIntroductionsectionsareoppositeandmirrored.IntheDiscussion,thepyramidpresentstheconventionalformat,startingfromspecificquestions(studyfindings)tomore comprehensiveelaborations(Figure1.6)(Cáceresetal., 2011).
Theimmutablecharacteristicsofgoodscientificwritingdistinctamongotherliteratureare(Lindsay, 2011):
•Accuracy; •Clarity; •Brevity.
Avaguetextcannotbeconsideredascientifictextbecauseofitslackofclarityorambiguity.A prolixandunnecessarilydiscursivescientificmanuscriptisconsideredpoorintermsofscientific
writing.Therefore,aclear,preciseandbrieftextcanbereadandunderstoodbyalargernumber ofreaders(Lindsay, 2011).
Inthepreparationofthescientificarticleintheareaofgeomatics,thetopicsshouldbewritten withtheverbforminthepasttense,becausethetextwaspreparedinthecontextofpresenting theresultsofaworkinwhichrelevantscientificconclusionsaregeneratedaboutaparticular geographicproblem.
1.8.2Scientificdissemination
Formalscientificdisseminationhasbeendisseminatedthroughpresentationsindifferenttypesof media.Theuseofshortvideopresentationshasbeenaformofpresentationusedbyresearchers andinscientificjournalsandbooks.However,transformingascientificpublicationintoashort videowithaccessiblelanguagecanbeacomplexmissionforresearcherswithlittleaffinityand availabilityoftheseresources.
Disseminationofsciencemeansallowingotherpeopletolearnabouttheresearchconducted. Scientistsworkinginacademia(universities,researchcenters)andinresearchanddevelopment inlargecorporationsandsmallcompaniesneedtodisseminateresearchresultstogainrespect andcredibilityinsocietyandboostcareers.Thiscancreateamarketforproductsandattract talentedemployees,aswellasbuildanetworkofcollaborationswithotherresearchgroups.This canincreasethechancesofobtainingfundingforprojectsandresearchwithpublicandprivate investors(CAPES, 2020).
Scientistsshouldinformcontributorsandinvestorsaboutaccountabilityandifpossiblethepositiveimpactofresearchonhealthandsocio-economicprogressofsociety.Aneffectivecommunicationstrategycanincreasethelikelihoodthatitwillattracttheattentionofdecisionmakers
FIGURE1.6: MirroredstructureoftheIntroductionandDiscussionsections.
andthatsciencewillbeusedtosupportdecisionsaboutstrategicevidence-basedpolicypriorities tomeettheneedsofthepopulation(CAPES, 2020).
Researcherscandisseminatescientificworkthrougharticles,reviewpapers,workshops,posters, talksatconferencesandseminarsandinreports.Inaddition,writtenandvisualmaterials(video andinfographics)canbeusedforflyers,brochures,pressreleases,websites,newsletters,blogs, andtheentirebroadspectrumofsocialmedia(CAPES, 2020).
Inpreparingthepresentationofthescientificarticlethroughslides,thefollowingaspectsoneach topicproposedinthedisclosureoftheresearchareconsidered(Table1.3).
TABLE1.3: Aspectsconsideredindevelopingpresentationtopicsforscientificpapersingeomaticswithslides.
Topic AspectConsidered
TitleShould bebriefandcontaininafewwordswhatisaccomplishedwiththe work
AuthorsIncludeauthors,advisorsandaffiliationaccordingtothenorms.Authors’ namesshouldappearonthefrontcover,belowthetitle IntroductionShouldbestraighttothepoint,pointingouttheproblemandthedemand thatgeneratedit.Mentionsthediagnosisoftheproblemandhowitwas solved.Getsinformationaboutpreviousstudiesonsimilarissues.Thetext shouldbepresentedinasummarizedformintopicsthatfacilitatethe sequenceofideas
ObjectivesShouldbewritteninawaythatleavesnodoubtastowhatthework intendedtoachieve MethodsMaterialsandmethodsshouldbepresentedindetail,butwithout exaggeration,asvariablestudied,metadatainformation,analysis ResultsShouldpresenttheresultsobtainedbasedondataanalysis.Images,graphs, tablesshouldbelegible DiscussionShoulddiscusstheresultsobtainedbasedontheavailableliterature ConclusionShouldbeaddressedwiththeexecutionoftheworkwithinwhatwas proposedintheobjective References Includethereferencesused
1.8.3 Predatoryjournals
Withthecurrenttechnologicaldevelopment,onecanpublishabookorscientificarticleona websitewithallthenecessaryfeaturestosimulatetheimageandproceduresofamajorpublisher. Inpredatoryjournals,classifiedasopenaccess,thescientificqualityofthepublicationsishighly questionable.Inthesejournals,peerreviewoflowqualityacademicmanuscriptsisrequested fromtheauthors.Theamountofarticlesinthesejournalsthatareactuallyread,cited,orhad anysignificantresearchimpactinthesameareaofknowledgeislow.Citationstatisticsovera five-yearperiodinGoogleScholarfor250randomarticlespublishedinpredatoryjournalsin2014 averaged2.6citationsperarticle,with56%ofthearticleshavingnocitationsatall.Basedona comparativerandomsampleofarticlespublishedinapproximately25000peer-reviewedjournals includedintheScopusindex,anaverageof18.1articlecitationswasobservedoverthesame period,withonly9%ofarticleshavingnocitationsatall.Therefore,weconcludedthatarticles publishedinpredatoryjournalspresentedlittlescientificimpact(Björketal., 2020).
Withthesubversionofthescientificpublicationprocess,notvalidatedbypeers,thebasicfoundationofcommunicationinsciencecanbediscredited,ultimatelyturningitintomereopinion piecesdisguisedasscientificarticles,withoutanyvalidationofthepublishedcontent.Therefore,
thechoiceofthejournalinwhichtopublishapapercanbeachallengefullofpitfallsfortheless andmoreexperiencedauthors,anditisimportanttoevaluateifsomeknowledgeaboutthecredibilityofthejournalandthepublisherhasbeenmadeavailable,besidesexercisingtheauthors’ criticalsenseinchoosingajournalwithcredibility(PenedoandBorges, 2017).
1.9Computation
Asacomputationpractice,ascientificprojectiscarriedoutwiththegoalofmappingtheCOVID19pandemicinSouthAmericaintheyear2020andmakingascientificsummaryabouttheproject andthemanuscriptpaper.TheCOVID-19dataareobtainedfromonlinenational-levelgovernmentsourcesusingtheRpackage, COVID19.TheRpackage rnaturalearth isusedtoobtainthe countrydatabase.OthertopographyfunctionsareperformedwiththeRrnaturalearth packages, sf, dplyr, tidyr, rgdal, tmap and ggplot2
1.9.1Preparationoftheprojectabstract
Thetitle,abstractandkeywordsoftheprojectarepreparedasfollows: GeospatialandTemporalProgressofCOVID-19inSouthAmericain2020
MarcelodeCarvalhoAlves-FederalUniversityofLavras,AgriculturalEngineeringDepartment, email: ��������������.����������@��������.����
LucianaSanches-FederalUniversityofMatoGrosso,DepartmentofSanitaryandEnvironmental Engineering,email: ����������ℎ����@ℎ������������.������
Abstract
WiththeadventofthenewSARS-CoV-2coronavirus,causingCOVID-19,therehavebeenunprecedentedsocioeconomicchangesonaglobalscale.OnMarch11,2020,withmorethan100,000 casesofCOVID-19onEarth,theWorldHealthOrganization(WHO)declaredapandemicscenario.Weaimedtoevaluateatopographicanalysismethodologytoassesstheprogressofthe COVID-19pandemicin13SouthAmericancountries.Wehypothesizedthatthroughgraphsof temporalvariationofthediseaseandquantilechoroplethmaps,itispossibletocomparatively evaluatetheprogressofthediseaseinSouthAmericancountries.DataontheincidenceofCOVID19intheSouthAmericanpopulationwillbeobtainedfromtheRpackage COVID19 referringto governmentsourcesatthenationalleveluntil12/31/2020.Time-varyingcurveswillbeperformed ondeaths,confirmedcases,recoverycasesandperformedtestsofCOVID-19inSouthAmerican countries.
Keywords: confirmation,deaths,epidemiology,geomatics,recovery,testing.
1.9.2Elaborationofthescientificarticle
Abstract
WiththeadventofthenewSARS-CoV-2coronavirus,causingCOVID-19,therehavebeenunprecedentedsocioeconomicchangesonaglobalscale.OnMarch11,2020,withmorethan100,000 casesofCOVID-19onEarth,theWorldHealthOrganization(WHO)declaredapandemicscenario.Weaimedtoevaluateageomaticsanalysismethodologytoassesstheprogressofthe COVID-19pandemicin13SouthAmericancountries.DataontheincidenceofCOVID-19in
theSouthAmericanpopulationwereobtainedbytheRpackage COVID19 referringtogovernment sourcesatthenationalleveluntil12/31/2020.Timevariationcurveswereperformedondeaths, confirmedcases,recoverycases,andtestsperformedofCOVID-19inSouthAmericancountries. Diseasetime-variationplotsandchoroplethquantilemapsenabledtocomparativelyevaluate theprogressofthediseaseinSouthAmericancountriesintheperiods4/19/2020,7/28/2020, 9/16/2020and11/4/2020.COVID-19temporalvariationplotsandquantilechoroplethmaps enabledcomparativelyassessingdiseasespatialprogressinSouthAmericancountries.
Anabridgedversionofthetopicsrequiredinascientificpaperwiththecodesusedinthecomputationpracticearebrieflypresentedbelow.
1.9.3Introduction
TheSARS-CoV-2coronavirus,causingCOVID-19disease,hasgeneratedunprecedentedsocioeconomicdisruptiononaglobalscale.OnMarch11,2020,theWorldHealthOrganization(WHO) declaredtheprogressofthediseaseaspandemic.Anincreasingnumberofpatientsrequiredintensivecareunit(ICU)beds,andtherateofspreadofthediseasemaypeakwithdemandon ICUbedcapacityinmanycountries(Sunetal., 2020; González-Bustamante, 2021).
ThefirstcasesofCOVID-19inSouthAmericancountriesoccurredbetweenlateFebruaryand earlyMarch.TheArgentinepresident,AlbertoFernández,consideredthepandemicaseverethreat tohiscountry(González-Bustamante, 2021).StartinginthethirdweekofMarch,alargenumber ofSouthAmericancountriesimplementedaseriesofmeasurestopreventthepandemic.Insome countries,suchasUruguayandParaguay,thepandemicprogresswaslow,whileothers,suchas BrazilandPeru,weremoreaffectedbyCOVID-19.Inaddition,itdeservesconsiderationthatthe crisiscausedbytheviruswascombinedwithcountrymanagementproblems.Incountrieslike BoliviaandChile,therewasacontextofsuperficialtrustininstitutions,massiveprotests,and socialunrestinthemonthsbeforethepandemic.BetweenAprilandMay2020,severalcountries reducedintensityofthemeasuresinitiallyimplemented(González-Bustamante, 2021).
Thus,basedonthehypothesisthatitispossibletocomparativelyassesstheprogressofthedisease inSouthAmericancountriesusingtime-varyingplotsandchoroplethquantilemaps,weevaluated theapplicabilityofgeomaticstechniquestoassesstheprogressoftheCOVID-19pandemicin13 SouthAmericancountries.
1.9.4Methods
LatinAmerica’sdevelopmentduringthe20thcenturyhasbeenassociatedwithhistoricalsocioeconomicprocessesofinequalityandlackoftrustininstitutions(GrassiandMemoli, 2016). Inaddition,therehasbeenaninabilitytoadequatelyprovidepublicgoodsandservicestothe population(González-Bustamante, 2021).
COVID-19datawereobtainedfromgovernmentsourcesatthenationallevelobtainedfromthe InternetthroughtheRpackage COVID19 (Guidotti, 2021),toevaluatethetemporalprogressand maptheCOVID-19pandemicinSouthAmericaintheyear2020.Temporalvariationondeaths, confirmedcases,recoverycases,andtestsperformedofCOVID-19inSouthAmericancountries weredeterminedbetween01/22/2020to12/31/2020.FourreferencedatesformappingCOVID19inSouthAmericawereseton4/19/2020,7/28/2020,9/16/2020,and11/4/2020,respectively. Summarystatisticsweredeterminedonthedataofdeaths,confirmedcases,recoverycases,and testsperformedofCOVID-19inSouthAmericainthesameperiodswhenthemappingwas performed.
TheRpackage rnaturalearth (South, 2021)wasusedtoobtainthecountrydatabase.Geocomputationfunctionswereusedtoperformoperationstoobtainasubsetandjoinsinageographic
database.MappingswereperformedwiththeRpackages sf (Pebesma, 2021, 2018), dplyr (Wickhametal., 2021), tidyr (Wickham, 2021), rgdal (Bivandetal., 2019), tmap (Tennekes, 2021, 2018),and ggplot2 (Wickhametal., 2020).
1.9.4.1InstallingRpackages
The install.packages functionwasusedtoinstallthe sf, tmap, dplyr, COVID19, readr, rnaturalearth, rgdal, gridExtra and ggplot2 packagesthroughRconsole.
install.packages("sf")
install.packages("tmap") install.packages("dplyr") install.packages("COVID19") install.packages("rnaturalearth") install.packages("rgdal") install.packages("ggplot2") install.packages("tidyr") install.packages("readr", repos=c("http://rstudio.org/_packages", "http://cran.rstudio.com")) install.packages("gridExtra")
1.9.4.2
EnablingRpackages
The library functionwasusedtoenablethe sf, tmap, dplyr, COVID19, readr, rnaturalearth, rgdal, raster, gridExtra and ggplot2 packagesthroughRconsole.
library(sf) library(tmap) library(dplyr) library(COVID19) library(rnaturalearth) library(rgdal) library(ggplot2) library(tidyr) library(readr) library(raster) library(gridExtra)
1.9.4.3
ObtainingupdatedCOVID-19data
The COVID19 functionwasusedtogetup-to-dateCOVID-19dataatthecountrylevelby 12/31/2020.
d <-COVID19::covid19(end= "2020-12-31")
Thedatacanbeexportedtoadirectoryonyourcomputerusingthe write.csv functionforfurther use.
write.csv(d, "files/d.csv")
The datacanthenbeimportedintothecomputertoperformtemporalandgeospatialanalysis.
d <-readr::read_csv("files/d.csv")
1.9.4.4Obtaininggeospatialpolygonswithcountryborders
Geospatialpolygonswithcountryborderscanbeobtainedwiththe ne_download function.Fora moredetailedanalysisofthisfunction,areviewofavignette7 onthesubjectisrecommended.
# Getgeographicdata world_rnatural<-rnaturalearth::ne_download(returnclass= "sf") names(world_iso) #Evaluateavailablevariablesindatabase
Geospatialpolygonscanbeexportedintoaparticulardirectoryforposteriorusethroughofthe st_write function.
st_write(world_iso, 'G:/covid/world_iso.shp', "world_iso.shp")
The read_sf function wasusedtoimportthepolygonsbackintoR.
world_iso <-sf::read_sf("files/world_iso.shp")
1.9.4.5ObtainingsubsetofpolygonswithcountrybordersofSouthAmerica
AsubsetofpolygonswithcountryborderswastakeninSouthAmericaandthecountriesofSouth America:Argentina,Chile,FalklandIslands,Uruguay,Brazil,Bolivia,Peru,Colombia,Venezuela, Guyana,Suriname,Ecuador,andParaguay.
# SubsetinSouthAmerica world_america<-world_iso[world_iso$CONTINENT == "SouthAmerica",]
#SubsetinSouthAmericancountries ARG<-world_iso[world_iso$ISO_A3_EH == "ARG",] #Argentina CHL<-world_iso[world_iso$ISO_A3_EH == "CHL",] #Chile FLK<-world_iso[world_iso$ISO_A3_EH == "FLK",] #I.Falkland URY<-world_iso[world_iso$ISO_A3_EH == "URY",] #Uruguay BRA<-world_iso[world_iso$ISO_A3_EH == "BRA",] #Brazil BOL<-world_iso[world_iso$ISO_A3_EH == "BOL",] #Bolivia PER<-world_iso[world_iso$ISO_A3_EH == "PER",] #Peru
7https://rdrr.io/cran/rnaturalearth/f/vignettes/what-is-a-country.Rmd
COL<- world_iso[world_iso$ISO_A3_EH == "COL",] #Colombia VEN<- world_iso[world_iso$ISO_A3_EH == "VEN",] #Venezuela
GUY<- world_iso[world_iso$ISO_A3_EH == "GUY",] #Guyana
SUR<- world_iso[world_iso$ISO_A3_EH == "SUR",] #Suriname
ECU<- world_iso[world_iso$ISO_A3_EH == "ECU",] #Ecuador PRY<- world_iso[world_iso$ISO_A3_EH == "PRY",] #Paraguay
1.9.4.6MergingglobalCOVID-19datawithcountrypolygonsinSouthAmerica GlobalCOVID-19datawasmergedwithcountrypolygonsinSouthAmericaandforeachofthe 13countriesevaluated.
#MergeCOVID-19datainSouthAmerica w<- dplyr::left_join(world_america,d, by= c("ISO_A3_EH"= "id")) #MergingofCOVID-19datainSouthAmericancountries ar= dplyr::left_join(ARG,d, by= c("ISO_A3_EH"= "id")) #Argentina ch= dplyr::left_join(CHL,d, by= c("ISO_A3_EH"= "id")) #Chile fl= dplyr::left_join(FLK,d, by= c("ISO_A3_EH"= "id")) #I.Falkland ur= dplyr::left_join(URY,d, by= c("ISO_A3_EH"= "id")) #Uruguay br= dplyr::left_join(BRA,d, by= c("ISO_A3_EH"= "id")) #Brazil bo= dplyr::left_join(BOL,d, by= c("ISO_A3_EH"= "id")) #Bolivia pe= dplyr::left_join(PER,d, by= c("ISO_A3_EH"= "id")) #Peru co= dplyr::left_join(COL,d, by= c("ISO_A3_EH"= "id")) #Colombia ve= dplyr::left_join(VEN,d, by= c("ISO_A3_EH"= "id")) #Venezuela gu= dplyr::left_join(GUY,d, by= c("ISO_A3_EH"= "id")) #Guyana su= dplyr::left_join(SUR,d, by= c("ISO_A3_EH"= "id")) #Suriname ec= dplyr::left_join(ECU,d, by= c("ISO_A3_EH"= "id")) #Ecuador pr= dplyr::left_join(PRY,d, by= c("ISO_A3_EH"= "id")) #Paraguay #Grouptheresults all<- rbind(ar,ch,fl,ur,br,bo,pe,co,ve,gu,su,ec,pr)
ThespatialpolygonsofSouthAmericawiththeCOVID-19datawereexportedforfurtheruse.
st_write(w, 'G:/covid/w.shp', "w.shp")
1.9.4.7SettingreferencedatesformappingCOVID-19inSouthAmerica
FourreferencedatesformappingCOVID-19inSouthAmericawereseton4/19/2020,7/28/2020, 9/16/2020,and11/4/2020.The filter functionwasusedtoobtainthedataattheperiodsof interest.
#COVID-19dataon4/19/2020 w_200 <- w %>%
filter(date == as.Date("2020-04-19", na.rm= T))
#COVID-19dataon7/28/2020
w_100 <- w %>%
filter(date == as.Date("2020-07-28", na.rm = T))
#COVID-19dataon9/16/2020
w_50 <-w %>%
filter(date == as.Date("2020-09-16", na.rm= T))
#COVID-19dataon11/4/2020
w_1 <-w %>%
filter(date == as.Date("2020-11-4", na.rm= T))
1.9.4.8Areadescription
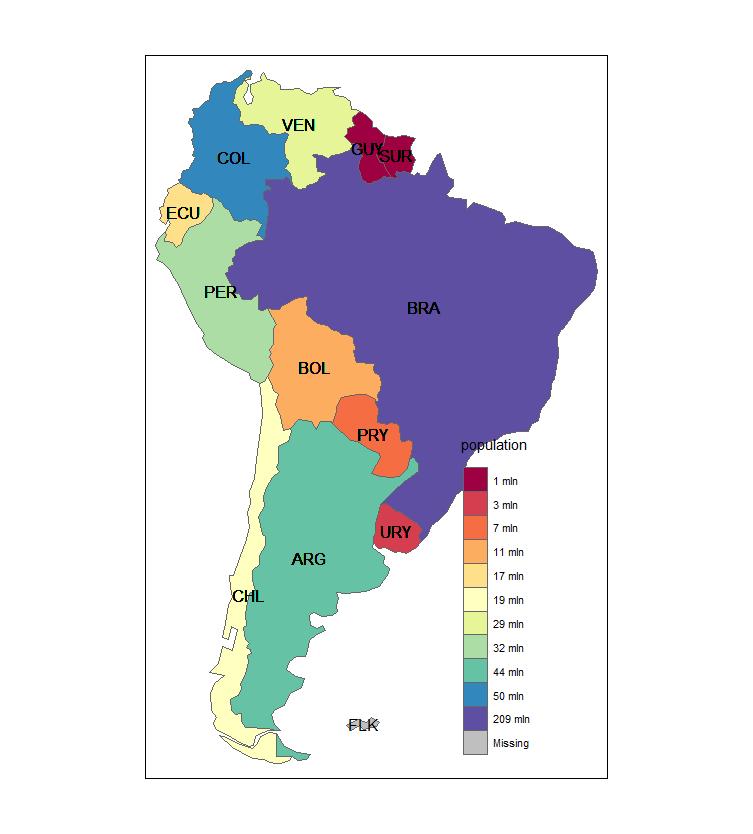
ThepopulationofSouthAmericahasnotbeenevenlydistributed,withsparseareasalongsideothersofrelativelyhighdensityduetophysicalandhumanfactors.Amongthecausesofpopulation distributioninSouthAmericaaredesertregions,suchasPatagonia,thedrypampa,Atacama, andSechura;equatorialforestzones,suchastheAmazon;andgrasslandareas,withextensive cattleraisingandlowerpopulationdensity.BasedonmappingofthepopulationinSouthAmerica,BrazilhadthelargestpopulationfollowedbyColombia,Argentina,Peru,Venezuela,Chile, Ecuador,Bolivia,Paraguay,Uruguay,Guyana,Suriname,andtheFalklandIslands(Figure1.7).
qtm(w,fill="population", fill.style="cat", text="ISO_A3_EH", text.col="black", fill.palette="Spectral")
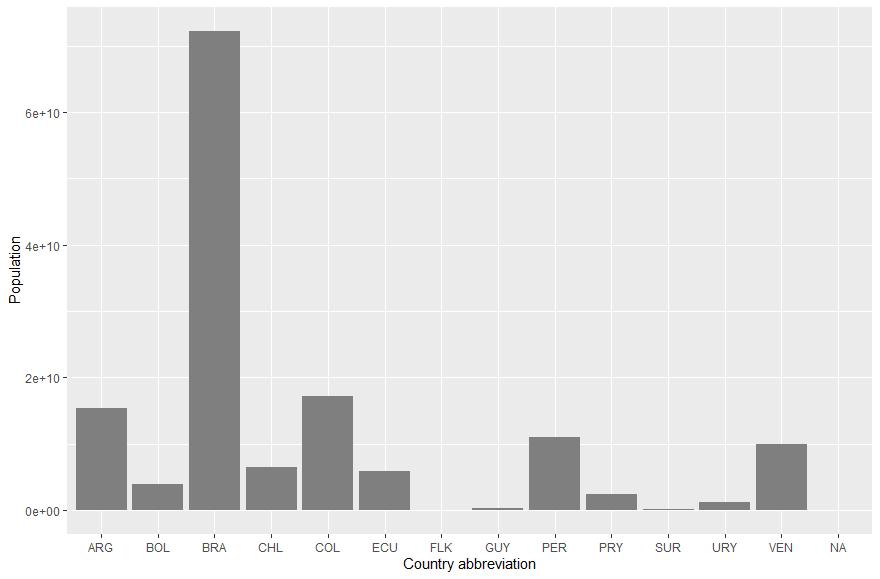
The samemappedresultswereobservedingraphicalformatforbettercomparison(Figure1.8).
ggplot(all, aes(x = ISO_A3_EH, y= population)) + geom_bar(stat="identity", fill="grey50") + xlab("Countryabbreviation")+ ylab("Population")
1.9.5Results
Thetemporalvariationondeaths,confirmedcases,recoverycasesandtestsperformed(Figure 1.9)ofCOVID-19inSouthAmericancountriesweredeterminedusingthe ggplot2 function.
# Deaths
a<-ggplot(all, aes(x= date, y= deaths)) + geom_line(aes(color= NAME_LONG), size= 1) + scale_color_manual(values= c("blue", "red", "yellow", "green", "black", "gray", "tan3","purple", "brown","orange","cyan", "darkorchid","coral"))+ labs(color= "Country")
#Confirmedcases
b<-ggplot(all, aes(x= date, y= confirmed)) + geom_line(aes(color= NAME_LONG), size= 1) + scale_color_manual(values= c("blue", "red", "yellow", "green", "black", "gray", "tan3","purple", "brown","orange","cyan",
PopulationmappingofSouthAmericancountries.
FIGURE1.7:
FIGURE1.8: PopulationofSouthAmericancountriesinabarplot.
"darkorchid","coral"))+ labs(color= "Country")
#Recoverycases
c<-ggplot(all, aes(x= date, y= recovered)) + geom_line(aes(color= NAME_LONG), size= 1) + scale_color_manual(values= c("blue", "red", "yellow", "green", "black", "gray", "tan3","purple", "brown","orange","cyan", "darkorchid","coral"))+ labs(color= "Country")
#Testsperformed
d<-ggplot(all, aes(x= date, y= tests)) + geom_line(aes(color= NAME_LONG), size= 1) + scale_color_manual(values= c("blue", "red", "yellow", "green", "black", "gray", "tan3","purple", "brown","orange","cyan", "darkorchid","coral"))+ labs(color= "Country")
grid.arrange(a,b,c,d, ncol=2)
Basedonthediseaseprogresscurves,thehighestincreasingnumberofdeathswasobservedin Brazil,followedbyPeru,Colombia,Argentina,Chile,Ecuador,andBolivia.Intheothercountries, nosignificanttrendofincreasingdeathsovertimewasobserved.Thedeathcurveseemedtoreach apointneartheclimaxinBrazil,PeruandColombiaafterOctober,withvaluesofapproximately 150,000and30,000and25,000deaths,respectively.Similarpatternsoftemporalvariationwere observedwithrespecttothenumberofconfirmationsandcasesofrecoveryfromthedisease, sothatafterOctobermorethan5millionconfirmedcasesand4millioncasesofrecoverywere