SUSTAINABLE HAWAI‘I

2021 Environmental | Social | Governance Report

Contents ESG Leadership 4 Alignment with a Net Zero Ambition 6 HEI Our Companies at a Glance 10 Highlights 11 Our Mission 12 Operating with Integrity 18 Consolidated HEI ESG Priority Assessment 20 Consolidated Climate Strategy 30 TCFD Disclosures 36 HEI Charitable Foundation 53 Political Activities 55 Hawaiian Electric Partnering to Decarbonize Hawai‘i’s Economy 58 Our Environment 70 Reliability & Resilience 75 Our Customers 79 Our Community 84 Our Employees 88 American Savings Bank Our Community 96 Our Environment 101 Our Customers 103 Our Teammates 105 Ethical Banking Practices 110 Pacific Current Introduction 113 Strategies 114 Appendix 118 Quantitative SASB Index – Hawaiian Electric 122 SASB Index – American Savings Bank 139 EEI ESG Metrics – Hawaiian Electric 151 Note: Photographs in this report include some taken prior to the COVID-19 pandemic.
About this Report
This is HEI’s third consolidated Environmental, Social and Governance (ESG) Report. This report is designed to help investors, customers, employees and other stakeholders understand how our strategies and operations advance our ESG objectives and long-term value creation.

This report encompasses ESG policies, principles and results from January through December 2021 across our two primary operating subsidiaries, Hawaiian Electric and American Savings Bank (ASB), which represented 64% and 36%, respectively, of subsidiary contributions to net income in 2021. This report also describes how Pacific Current, a sustainable infrastructure investment platform and our newest subsidiary, contributes to our mission to be a catalyst for a better Hawai‘i, including our commitments to a sustainable future and our state’s ambitious sustainability goals. New this year is our enterprise-wide greenhouse gas (GHG) emissions inventory, which covers historical emissions by scope across all of our companies’ operations.
This report was prepared in accordance with Sustainability Accounting Standards Board (SASB) guidance, using the electric utilities standard for Hawaiian Electric, and the commercial banks, commercial finance, and mortgage finance standards for American Savings Bank. This report includes disclosures aligned with Task Force on Climate-related Financial Disclosures (TCFD) recommendations as well as our utility data in the Edison Electric Institute (EEI) template format.
This report should be read in conjunction with our Securities and Exchange Commission (SEC) filings (including our 2021 Annual Report on Form 10-K and our Form 10-Q for the quarter ended March 31, 2022), as well as certain presentations, documents and other information that may be of interest to investors, all of which are available at www.hei.com
Note: Inclusion of information in this report does not necessarily mean we have determined such information is material or financially significant. For additional information regarding HEI, please see our filings with the SEC.
ESG Leadership
Aloha kākou, greetings everyone.
Regardless of how it’s measured, a business’ long-term success must be sustainable. And sustainability is a function of how a business contributes to the success of its stakeholders.
At HEI, this principle has informed our actions for a very long time. It’s also why over the past three years we have significantly increased our reporting on environmental, social and governance (ESG) activities. Our ESG actions demonstrate our commitment not only to operating a sustainable business, but also to building a sustainable Hawai‘i in which our children and grandchildren, our communities, our customers and our fellow employees will thrive together both now and for generations to come.
As providers of critical infrastructure and services, the HEI family of companies plays an essential role in transitioning Hawai‘i away from fossil fuels and toward a net zero economy – one in which our industries remove whatever greenhouse gas (GHG) emissions they create. We view it as our kuleana (responsibility) to set ambitious climate goals and plans, and by doing so, to inspire and enable other sectors of the economy to take action to reduce GHG emissions and transition away from fossil fuels. Our board of directors, our customers, partners and suppliers, and every one of our employees plays a role in this transition, reflecting the way in which the climate crisis demands our community’s collective action.
Our utility, Hawaiian Electric, anchors these efforts, as it works to directly decarbonize Hawai‘i’s electricity and ground
transportation sectors while enhancing the resilience of our electricity system and protecting our communities from the impacts of climate change. We made tremendous progress in 2021, achieving a consolidated renewable portfolio standard (RPS) of 38.4% that puts us well ahead of schedule to achieve Hawai‘i’s statutory goal of 40% RPS by 2030. We also set a new goal to reduce GHG emissions from electricity generation by 70% compared to 2005 on our way to net zero emissions from electricity generation by 2045. Our preliminary 2021 GHG emissions from electricity generation were 22% below 2005 levels.
Supporting Hawai‘i’s economy and affordability for those who live here continued to be a central focus for American Savings Bank in 2021. From 2020 through year-end 2021, ASB deployed Paycheck Protection Program funding totaling $551 million to support Hawai‘i businesses representing more than 40,000 employees. In 2021 ASB’s teammates also led a statewide business holiday card program that provided $750,000 in direct support to Hawai‘i’s restaurant and food supply industries. These efforts have helped small businesses stay afloat during the pandemic and keep jobs in our communities. In addition, ASB is helping address climate change by providing financing for customers to invest in clean energy and storage, energy efficiency and resilience projects and by improving energy efficiency across its banking operations.
Our infrastructure investment platform, Pacific Current, made steady progress in its mission to accelerate Hawai‘i’s transition to a sustainable future. For example, in 2021 Pacific Current
4
increased deployment of EverCharge electric vehicle charging systems to accelerate electrification of transportation and made its first investment in the water sector through a water-energy purchase agreement project. These efforts help to keep money in the state by investing local capital into local projects and local communities, contribute to local job creation, and build Hawai‘i’s talent base for the future.
We’re proud of how the HEI family of companies and our employees have responded to the escalating effects of climate change, a fast-moving pandemic and disruptive sociopolitical events. We’ve provided continuous essential services, supported our customers through economic hardships, and executed transformative strategies that include our utility’s climate change action plan and our bank’s digital transition.
This year’s ESG Report includes our first enterprise-wide GHG emissions inventory, an important initiative that will further guide our ambitious ESG strategies and provide even greater transparency around our companies’ progress on climate issues.
Yet there’s more work to do. As we write this letter, the global community is grappling with Russia’s invasion of Ukraine, an event with environmental, economic and humanitarian implications for people everywhere – including here in Hawai‘i. Until recently, approximately 30% of Hawai‘i’s crude oil was sourced from Russia. We denounce Russia’s actions, which only strengthen our resolve to end our state’s reliance on imported fossil fuel, and our thoughts, prayers and aloha are with the people of Ukraine.
We’re committed to doing our part to build a future for Hawai‘i that is economically, environmentally and socially sustainable. We know continued success will require teamwork, discipline, imagination and thoughtful action as we meet the challenges ahead. Through the integrated efforts of our companies, we aim to put Hawai‘i at the forefront of clean energy, create a sustainable and growing local economy, and empower our families and communities to flourish.
Me ke aloha pumehana – with warm regards,

 Scott Seu President and Chief Executive Officer
 Adm. Thomas Fargo Chair, Board of Directors

5
Alignment with a Net Zero Ambition

Our company, state, and communities have much at stake from the effects of climate change. Hawai‘i’s geographic isolation, extreme weather events, and direct exposure to sea level rise keep the climate crisis top of mind for our companies and our stakeholders. That’s why our state and our company have sought to be leaders in setting goals and demonstrating real progress in the near term – not 20 or 30 years from now. Hawai‘i was selected to host one of the UN’s first Local2030 sustainability hubs in 2018, reflecting its suitability as a role model and learning ground for other island communities. Hawai‘i has long been on the forefront of U.S. states in setting ambitious climate goals, with goals to achieve a carbon neutral to carbon negative economy by 2045 and a 100% renewable portfolio standard (RPS) by 2045, with interim RPS milestones of 30% by 2020, 40% by 2030 and 70% by 2040.
At HEI, we recognize the critical role we play in reaching these goals. Our subsidiaries are uniquely positioned to advance statewide climate change mitigation and adaptation efforts. We expect to achieve net zero emissions from power generation by 2045 and have aligned our strategies with this ambition. In its 2021 Climate Change Action Plan, Hawaiian Electric committed to reduce carbon emissions from generation by 70% by 2030 (from 2005 baseline levels). We’re making strong progress. On a preliminary basis, in 2021 we reduced greenhouse gas (GHG) emissions from electricity generation by 22% compared to 2005. We also surpassed an RPS of 38%, well on track to exceed our next state milestone of 40% by 2030. Throughout this report, including on pages 58-69, we describe our progress to date and the many efforts we have underway to reach these important goals.
In 2021, Hawaiian Electric signed the Science Based Target initiative’s (SBTi) Business Ambition for 1.5°C campaign, pledging to validate our goals through the SBTi. We are committed to continuing to work closely and collaboratively with policymakers and our communities to reach our collective goals.
At HEI we believe our goals and plans place us on a strong path to reaching net zero carbon emissions by 2045. Hawaiian Electric’s climate commitment is a significant down payment on the economy-wide emissions reduction that Hawai‘i will have to achieve to be in line with the U.S. emissions reduction commitment of at least 50% by 2030 compared to 2005. With the completion of our first enterprise-wide GHG emissions inventory, we have laid the foundation to further reduce emissions across the rest of the HEI enterprise. We will provide an update on that work in our future reporting.


HEI HAWAIIAN ELECTRIC AMERICAN SAVINGS BANK PACIFIC CURRENT QUANTITATIVE < CONTENTS
About HEI
From the time that human beings first landed on Hawai‘i’s shores, a deep sense of obligation to care for and steward these islands has been passed from one generation to the next, developing a culture of sustainability that guides us today.
At HEI, our family of Hawai‘i-based companies provides energy and financial services while advancing our state’s clean energy and sustainability goals.
As a company with a strategy focused on Hawai‘i, and with all of our operations in the state, our ability to deliver long-term value for our stakeholders is tied to the strength and sustainability of Hawai‘i’s communities.

Our Companies at a Glance
HEI is the parent company of three subsidiaries delivering essential services and advancing a more sustainable Hawai‘i.

of Hawai‘i’s population
3RD
largest financial institution in Hawai‘i
Established in
2017
to advance Hawai‘i’s sustainability goals through infrastructure investment Provides the energy that has fueled our islands’ growth and prosperity for

Provides the capital that has helped Hawai‘i grow for
131 YRS
95% Serves 64% 36%
of subsidiaries’ contribution to net income*
97 YRS
of subsidiaries’ contribution to net income*
Multi-pronged strategy involving energy, water and transportation sectors
Operates five separate electric systems on the islands of O‘ahu, Hawai‘i Island, Maui, Moloka‘i and Lāna‘i
Branches on five islands — O‘ahu, Hawai‘i Island, Kaua‘i, Maui and Moloka‘i
*Based on LTM 12/31/21 earnings to common shareholders and excludes other segment’s net losses.
Projects on four islands, including O‘ahu, Hawai‘i Island, Kaua‘i and Maui
HEI HAWAIIAN
AMERICAN SAVINGS BANK PACIFIC CURRENT QUANTITATIVE
ELECTRIC
< CONTENTS
AMERICAN SAVINGS BANK
38% RENEWABLE PORTFOLIO STANDARD IN 2021

99.98% RELIABILITY IN 2021 average service availability
$2.4B VALUE OF LOANS ORIGINATED IN 2021
4,956 NEW RESIDENTIAL ROOFTOP SOLAR SYSTEMS ADDED IN 2021
30% INCREASE IN ELECTRIC VEHICLES IN HAWAI‘I from January to December 2021
13 YRS BEST PLACES TO WORK American Savings Bank Hawaii Business Magazine List
1,019MW TOTAL SOLAR CAPACITY
-22% REDUCTION IN GHG EMISSIONS FROM GENERATION (VS. 2005 BASELINE) based on preliminary 2021 data*
$5M CHARITABLE COMMITMENTS in 2021
*Includes whole system generation stack emissions.
17,000+ EMPLOYEE VOLUNTEER HOURS in 2021
SERVICE ON
200+ NON-PROFIT BOARDS AND COMMISSIONS in 2021
Highlights
$551M IN PAYCHECK PROTECTION PROGRAM LOANS 2020-21 to businesses representing 40,000+ jobs HAWAIIAN ELECTRIC HEI
Our Mission: To be a Catalyst for a Better Hawai‘i Our Success is Tied to Hawai‘i’s Success
Our companies provide the energy and financial infrastructure that empower much of the economic and community activity of our state. We have always understood that our longterm success and our ability to deliver sustainable value for our stakeholders — including our shareholders — is inextricably linked to the well-being of our employees, communities, economy, and environment. That is why we see our mission of being a catalyst for a better Hawai‘i as advancing our long-term financial sustainability. Our three primary subsidiaries all contribute meaningfully to this mission.

12 HEI HAWAIIAN ELECTRIC AMERICAN SAVINGS BANK PACIFIC CURRENT QUANTITATIVE < CONTENTS
Our companies provide the energy and financial infrastructure that empower much of the economic and community activity of our state.”
Hawaiian Electric — Leading a Community-Wide Energy Transition
Hawai‘i has a history of leading the nation in establishing ambitious climate goals, and our utility is at the center of efforts to achieve them.

Together with the state of Hawai‘i and the U.S. Department of Energy, in 2008 we established what was then viewed as an extraordinary goal1 to use renewable resources to power 40% of our electricity needs. This was at a time when Hawai‘i’s economy was almost entirely fueled by oil and coal and when the technologies to achieve our ambitions were largely not yet proven.
In 2015, Hawai‘i became the first state to set a goal of achieving a 100% RPS by 2045, with interim milestones of 30% by 2020, 40% by 2030 and 70% by 2040. We’re striving to outperform these goals both in magnitude and timeframe to more rapidly decarbonize our power system and Hawai‘i’s broader economy. In 2021 we achieved a 38% RPS. We plan to continue accelerating our efforts to exceed the established RPS milestones.
In 2018, Hawai‘i also became the first state to set an economywide carbon neutral to carbon negative target, also by 2045. Embracing our leadership role in this effort, we have also committed to ensuring our emissions from power generation are carbon neutral or negative by 2045. In 2021 we announced our Climate Change Action Plan to reduce GHGs in stack emissions from electricity generation by 70% from 2005 levels by 2030. This achievement would provide a significant portion of the reduction the entire Hawai‘i economy needs to meet
the U.S. target of cutting carbon emissions by at least 50% economy-wide by 2030. We know that meeting this goal will require a broad effort across the entire economy, and we’ll continue increasing renewable energy integration and providing infrastructure and programs to help other sectors, such as transportation and buildings, decarbonize effectively.
We’re working with stakeholders and community members to help drive a clean energy transition that benefits our whole community. Our work includes running the largest renewable energy procurement effort ever undertaken in the state so we can reduce fossil-fuel usage and the energy bill fluctuations that come with it; integrating the nation’s highest percentage2 of rooftop solar per capita among investor-owned utilities; expanding community-based renewable energy programs to enable those without the ability to add rooftop solar to benefit from renewable energy; modernizing the grid and helping electrify more of our economy. 2021 marked the first year of Hawai‘i’s performance-based regulation (PBR) framework, which is designed to support the state’s renewable energy policies while ensuring the financial integrity of the utility.
To achieve our goals in the right way for our island state, we must balance affordability, social equity, reliability, resilience and important environmental and cultural considerations. A key challenge is the competing priorities for land, including affordable housing, agriculture, renewable energy and conservation. All will have impacts on communities and ecosystems.
This is why we say reaching our goals takes everyone working together in a way that is right and just for our communities. Only together can we find the solutions that strike the right balance for our island home.
13
American Savings Bank — Advancing Economic Sustainability for Hawai‘i

American Savings Bank’s success relies upon the economic health of businesses and families in our state. That’s why ASB is actively engaged in building a sustainable local economy. We do this through our core banking operations by financing businesses that help diversify our economy and create new jobs; lending for clean energy, electrification and energy efficiency projects that support our state’s decarbonization efforts; and providing funding for community development efforts and sustainable, affordable and workforce housing to enable more Hawai‘i families to thrive.
We also work to build a more sustainable local economy by fostering innovation and entrepreneurship and by working to further financial literacy among our own customers and in the broader community.
ASB has been a leader in making our own operations more environmentally sustainable. We’ve reduced our total physical footprint, invested in energy and water efficiency, rooftop solar and electric vehicle charging for our headquarters, and rolled out many of these improvements for our branches. We also incentivize our teammates to reduce their own carbon footprint through our green transportation employee benefit.
Pacific
Current — Investing in Sustainable Infrastructure
Pacific Current was created in 2017 with the mission to advance Hawai‘i’s sustainability through infrastructure investment. We see sustainable infrastructure — to advance clean transportation, renewable energy, local agriculture and water and wastewater management — as an opportunity to help solve important challenges for our state, create local jobs and support our economy while also earning a return for investors.
Pacific Current’s investments to date are contributing to greater sustainability. Its Hamakua Energy generating facility is transitioning to renewable energy by incorporating locally produced biodiesel. Its Port Allen solar facility is providing clean power for the island of Kaua‘i. Pacific Current has partnered with the University of Hawai‘i system (UH) and Johnson Controls to develop solar plus storage systems to help five UH campuses achieve their net zero goals (Pacific Current is the long-term owner of the systems). Its joint venture with EverCharge is helping advance electric vehicle adoption by providing affordable, scalable charging infrastructure. Pacific Current has also entered the water sector, partnering with Cambrian Innovation to deploy a cost- and resource-efficient clean water, renewable energy and water treatment project.
14 HEI HAWAIIAN ELECTRIC AMERICAN SAVINGS BANK PACIFIC CURRENT QUANTITATIVE < CONTENTS
ESG Risk Management
We see ESG-related strategies and risks as having the same potential as other strategies and risks to impact long-term value creation. As such, we’ve identified priority ESG factors across our businesses and have integrated them into our governance structures and management activities.
Company strategies are overseen by the HEI Board of Directors (Board) as a whole and are managed through our strategic planning and oversight process. The Board provides guidance on strategic priorities and plans and approves the budget to allocate resources for agreed-upon strategies.
Our Board reviews and provides input on major risks and determines our risk appetite. This includes risks relating to safety, resilience and climate change impacts. The HEI Audit & Risk Committee oversees our Enterprise Risk Management (ERM) program, which is designed to identify, assess and report key risks to the Board, along with strategies for mitigating and managing such risks. The Hawaiian Electric Audit & Risk Committee and the ASB Risk Committee assist in risk oversight of those subsidiaries.

The HEI Nominating & Corporate Governance Committee is responsible for ensuring appropriate Board oversight and governance for all material matters, including material ESG issues. It is also responsible for Board and senior executive succession planning.
Human capital management and diversity, equity and inclusion were previously overseen by the Nominating & Corporate Governance Committee. The Board determined that these areas better align with the focus of the HEI Compensation Committee, and thus assigned these areas to that committee and renamed it the Compensation & Human Capital Management Committee to reflect this expansion. This committee is also responsible for overseeing executive compensation, including establishing incentive goals to drive performance.
See the TCFD section of this report for further detail on ESG risk management.
ESG Performance Incentives
15
...we’ve identified priority ESG factors across our businesses and have integrated them into our governance structures and management activities.”
Several ESG goals are included in incentive compensation for HEI and utility executives. Our bank executive goals focus predominantly on bank financial performance, while bank executives also have individual goals, some of which tie to ESG matters such as human capital management. See our 2022 proxy statement for more information on executive performance goals.
Long-term Performance Incentive (HEI and Utility)
20% of HEI and utility executive long-term incentive for 2020-22 and 2021-23 is based on RPS achievement. While Hawai‘i law requires us to achieve 40% RPS by 2030, we seek to achieve that well ahead of time, and are incentivizing executives to do so by linking their pay to the following goals:
Beginning with the 2022-24 performance period, in light of Hawaiian Electric’s new goal to reduce carbon emissions from generation 70% by 2030 compared to a 2005 baseline, the climate goal component of the long-term incentive plan will focus on carbon emissions reductions achieved rather than RPS achievement.
16 HEI HAWAIIAN ELECTRIC AMERICAN SAVINGS BANK PACIFIC CURRENT QUANTITATIVE < CONTENTS 2021 Annual Performance Incentive HEI Consolidated net income Core earnings goal 60% Utility operations (largely ESG metrics) Includes utility metrics below except net income, supporting effective utility operations for all stakeholders 25% ASB return on assets Focuses on efficient deployment of bank assets 15% UTILITY Utility net income Core earnings goal 40% Utility customer satisfaction Seeks to improve customer experience 15% Utility human capital management Promotes development of an effective workforce, with a focus on diversity, equity & inclusion (DEI), leadership development and employee engagement 15% Utility reliability Promotes reliable power for customers 10% Utility safety Focuses on employee safety 10% Utility Performance Incentive Mechanisms (PIMs) Focuses on overall utility performance within Performance Based Regulation (PBR) framework 5% Utility electrification Promotes the decarbonization of Hawai‘i through adoption of EVs 5%
Min. Target Max. RPS by 2022 32% 40% 50% RPS by 2023 40% 45% 50%
Board Sustainability Expertise
The HEI Board possesses critical ESG expertise to oversee our enterprise and strategies. Below we’ve highlighted the ESG expertise of five of our independent directors who have direct experience on ESG topics, including renewable energy, climate change strategy and environmental management.
Celeste Connors is a climate risk expert and has advised U.S. presidents and other officials on clean energy and sustainable development. She served as Director for Climate Change & Environment at the National Security Council and National Economic Council. She is Executive Director of Hawai‘i Green Growth Local2030 Hub, one of the world’s first UN-recognized local sustainability hubs.
Richard Dahl oversaw the development of sustainability strategies as President & COO of Dole Food Company. Under his leadership, Dole increased its investments in sustainability initiatives (including a carbon offset program to secure a carbon neutral operating footprint) and was named one of the World’s Most Ethical Companies by Ethisphere Magazine.
Peggy Fowler was CEO for Portland General Electric (PGE) when PGE made the strategic decision to reduce its use of oil and coal. Under her leadership, wind and solar projects were constructed and integrated into the PGE grid. PGE has been ranked #1 on multiple occasions for supplying more renewable power to residential customers than any other U.S. utility.


Micah Kāne leads the Hawai‘i Community Foundation, Hawai‘i’s largest foundation. A Native Hawaiian community leader, he brings invaluable experience in understanding Hawai‘i’s complex cultural and land use history. He has worked to bring the community together to address important issues facing Hawai‘i, including sustainability, homelessness and affordable housing.
Jim Scilacci has extensive experience overseeing the financial aspects of utility clean energy transitions and managing risks, including ESG-related risks such as climate change impacts. His career includes serving as CFO of Edison International and its subsidiary Southern California Edison, a leading utility with respect to grid modernization, transportation electrification and renewable energy.
17
BOARD OF DIRECTORS COMPOSITION (8 of 9 are independent) Average tenure: 5.9 Years TENURE GENDER ETHNICITY 10+ yrs 33% < 3 yrs 56% 4-10 yrs 11% Average age: 60.8 Years AGE < 50 22% 70+ 45% 50-59 22% 60-69 11% Female 33% Male 67% Asian 11% Hispanic 5.5% Caucasian 67% Native Hawaiian 16.5%
Operating with Integrity
Business Ethics
HEI’s Corporate Code of Conduct establishes high ethical standards across our family of companies. The Code applies to all board members, executive officers, employees (including part-time), and third parties (e.g., vendors, suppliers, contractors) in their engagements with HEI.
All of us at HEI have a responsibility to know, understand and adhere to our Code of Conduct, company policies, and applicable laws and regulations. HEI strives to promote a culture in which employees feel comfortable raising concerns and reporting issues in good faith without fear of retaliation. We provide annual training on the Code of Conduct. We also provide several avenues for confidential, anonymous reporting of suspected violations, including through the company’s EthicsPoint platform. We have procedures for investigating reported concerns or suspected violations, and we do not tolerate retaliation against employees who report in good faith any ethics or compliance issues. Our Board of Directors reviews and approves the Code of Conduct as needed and reviews reports of potential violations with management on a quarterly basis.
Human Rights
Our Code of Conduct includes several components focused on respect for human rights. For example, the Code of Conduct outlines our zero tolerance policy with respect to human trafficking and forced labor; this policy applies to all those covered by the Code of Conduct, including vendors and contractors. In addition, the Code of Conduct describes our commitment to providing a work environment that is safe, dignified, productive and free of harassment and discrimination. We plan to further detail our commitment to and policies regarding human rights in future materials.
100% OF ACTIVE EMPLOYEES ACROSS THE HEI FAMILY OF COMPANIES COMPLETED HEI CODE OF CONDUCT TRAINING AND ACKNOWLEDGMENT IN 2021

18 HEI HAWAIIAN ELECTRIC AMERICAN SAVINGS BANK PACIFIC CURRENT QUANTITATIVE < CONTENTS
of Conduct
Read our HEI C orporate Code of Conduct
HEI Corporate Code of Conduct
Areas addressed by the Code include (not exhaustive):
Our Shared Responsibility and Commitment
Examples of Violations
Resources and Reporting Avenues
Anti-Retaliation
We Act in the Best Interest of Our Company and Our Customers
Protecting Confidential Information
Protection and Use of Company Assets

Conflicts of Interest
We Act with Honesty and Integrity
Fair Dealing, Antitrust and Anti-Tying
Anti-Corruption and Anti-Bribery
Anti-Human Trafficking
We Honor Our Legal Obligations
Insider Trading
Financial Reporting Obligations
Anti-Money Laundering, Anti-Terrorist Financing and Trade Sanctions
We Welcome Diversity and Foster a Productive Work Environment
Equal Employment Opportunity and Anti-Discrimination
Anti-Harassment and Anti-Violence
Alcohol and Drug-Free Workplace
We Care About Our Community and Neighbors
Environmental Management and Training
Charitable Contributions
Political Activity, Lobbying, Contributions and Endorsements
19 Decarbonization 1 Economic Health & Affordability 2 Reliability & Resilience 3 Secure Digitalization 4 Diversity, Equity & Inclusion 5 Employee Engagement 6 Climate-Related Risks & Opportunities 7 PRIORITY AREAS
to strive to be righteous ‘imi pono
Code
HEI’s Corporate Code of Conduct establishes high ethical standards across our family of companies.”
Corporate
Consolidated HEI ESG Priority Assessment
We developed our consolidated HEI ESG priority assessment in 2021, building upon earlier assessments conducted by each of our subsidiaries. This combined assessment prioritizes issues based on their importance to our business performance and value creation and to our stakeholders, including customers, employees, investors, policy makers, community leaders and non-profit organizations.
In the paragraphs that follow we describe our top ESG priority areas and why they are important to us. In the remaining sections of this report we detail our strategies, initiatives and achievements that support these priorities.
Our ESG Priority Areas
We identified 19 ESG priority areas and grouped them according to the five Sustainability Accounting Standards Board (SASB) dimensions: environment, social capital, human capital, business model & innovation, and leadership & governance. While we view all 19 areas as important and have management activities in place for each, we continue placing special focus on the seven topics in the upper-right quadrant of the matrix shown on the next page, as those ranked high in importance both to our business and to our stakeholders.
Our top ESG priority areas reflect the essential connection between the health of Hawai‘i’s environment, economy and communities and our success as a company. These priority areas are decarbonization, economic health & affordability, reliability & resilience, secure digitalization, employee engagement, climate-related risks & opportunities, and diversity, equity & inclusion.

20 HEI HAWAIIAN ELECTRIC AMERICAN SAVINGS BANK PACIFIC CURRENT QUANTITATIVE < CONTENTS
We identified 19 ESG priority areas and grouped them according to the five Sustainability Accounting Standards Board (SASB) dimensions...”
IMPORTANCE TO STAKEHOLDERS
Consolidated HEI ESG Priority Areas
Diversity, Equity & Inclusion
Climate-Related Risks & Opportunities
Community Involvement
Transparency
Disasters
Sustainable Supply Chain
Customer Satisfaction
Waste Ethical Business Practices
Economic Health & Affordability
Employee Engagement
Decarbonization
Reliability & Resilience
Secure Digitalization
Effective Governance Practices
Infrastructure Investment & Modernization
Stakeholder Engagement
Safety
Beneficial Electrification
Environment
Social Capital
IMPORTANCE TO BUSINESS
SASB DIMENSIONS
Human Capital
Business Model & Innovation
Our ESG Priority Areas
Leadership & Governance
1 2 3 4 5 6 7
Decarbonization
Economic Health & Affordability
Reliability & Resilience Secure Digitalization Diversity, Equity & Inclusion
ENVIRONMENT SOCIAL CAPITAL SOCIAL CAPITAL SOCIAL CAPITAL SOCIAL CAPITAL HUMAN CAPITAL
Employee Engagement
ClimateRelated Risks & Opportunities
HUMAN CAPITAL BUSINESS MODEL & INNOVATION
21
LOW
LOW OUR PRI O R I T Y AREAS 1 2 3 4 5 6 7
HIGH
HIGH
ENVIRONMENT Decarbonization
How we define it
Providing leadership and developing infrastructure, programs, and services to advance economy-wide decarbonization in Hawai‘i. Reducing GHG emissions across our operations, including by transitioning away from fossil fuels, electrifying fleets, increasing facility energy efficiency and through carbon removal and offsets.

Why it’s important
Decarbonization is a major focus of both state policy and our strategy. As an island state, Hawai‘i has much at stake from climate change. For that reason, our state has been one of the nation’s leaders in setting ambitious climate goals, including a 100% RPS and a carbon neutral to carbon negative economy by 2045. We have aligned our enterprise strategy with state policy and work closely with our stakeholders to consider environmental justice, reliability and resilience. Our energy sector climate commitments will be major drivers of this statewide transition.
SOCIAL CAPITAL Economic Health & Affordability
How we define it
Working to strengthen Hawai‘i’s economy by promoting innovation, entrepreneurship, diversification and energy independence. Directly supporting the economy through job creation, infrastructure investments, financing offerings and local sourcing and partnerships. Helping address Hawai‘i’s high cost of living through our ability to impact affordability drivers in the state. Efforts may include cost reduction strategies for equitable rates, low- to moderate-income (LMI) programs, affordable housing strategies and enhancing financial fitness.
Why it’s important
A strong, diverse state economy that provides well-paying jobs in a range of industries and offers an affordable cost of living is essential to the growth and continued financial strength of our entire enterprise. An economically resilient, affordable Hawai‘i can drive opportunities for our companies, including greater stability in the event of future broad economic shocks, lending opportunities for our bank, more investment opportunities for Pacific Current, greater regulatory and public support for utility decarbonization and resilience investments and the ability to attract and retain a strong workforce.
22 HEI HAWAIIAN ELECTRIC AMERICAN SAVINGS BANK PACIFIC CURRENT QUANTITATIVE < CONTENTS
1 2
SOCIAL CAPITAL Reliability & Resilience
How we define it
Investing in and upgrading infrastructure to proactively address potential challenges (e.g., ensure system reliability, resilience, environmental compliance), improve our capabilities and service (e.g., grid modernization, digitization), build resilience in our communities and enhance sustainability for all of our customers.
Why it’s important
Delivering reliable electric service is foundational for our utility to earn and retain the support of our customers and regulators. Reliable infrastructure benefits our society by providing customers across all segments with access to greater economic opportunity and mobility. As we add more renewable and distributed energy resources to our utility system, it is critical that we make the accompanying investments needed to ensure system resilience and reliability. Resilience is an essential goal across our companies and our economy, underscored by Hawai‘i’s urgent need to adapt to climate change impacts. We provide critical services for Hawai‘i through our utility and bank, and must be prepared to withstand and quickly recover from potential natural disasters and economic disruption in a changing physical and geopolitical climate.
SOCIAL CAPITAL Secure Digitalization
How we define it
Successfully shifting our operations and customer interactions to more digital approaches while maintaining the security of our digital assets and operations (including system operations, corporate information technology systems and mobile solutions). Protecting proprietary corporate and private customer information against malicious and deliberate attempts to access and utilize such information.
Why it’s important
Business operations and customer interactions at our utility and bank are rapidly shifting to more digital approaches, enabling more automated IT and operational technology (OT) systems, efficient operations and increasing our ability to tailor products and services to customers’ needs. Initiatives such as our utility’s Grid Modernization program and our bank’s Anytime, Anywhere Banking transition are transforming customer experiences to meet rising expectations. Cybersecurity challenges are also increasing, and it is critical that we stay ahead of those challenges to ensure resilient operations and maintain stakeholder trust. We must also ensure we have a workforce with the skills needed for an increasingly digital world, and that we offer workplace flexibility options that will enable us to effectively compete for talent.
23 Decarbonization 1 Economic Health & Affordability 2 Reliability & Resilience 3 Secure Digitalization 4 Diversity, Equity & Inclusion 5 Employee Engagement 6 Climate-Related Risks & Opportunities 7 PRIORITY AREAS 3
4
SOCIAL CAPITAL / HUMAN CAPITAL Diversity, Equity & Inclusion
How we define it
Promoting a diverse, equitable and inclusive workplace and advancing social equity and inclusion through our customer programs and services. Diversity is the range of human differences, including but not limited to race, ethnicity, gender, gender identity, sexual orientation, age, economic status, physical ability or attributes, religious or ethical values system, national origin and political beliefs. Equity and inclusion considers issues related to equity in opportunity, access and impact as they relate to the company’s culture, products, services and activities.
Why it’s important
Advancing diversity, equity and inclusion both within our company and in the broader community is a key consideration in all that we do and helps drive stronger performance.

Internally, while the diversity of our employee base reflects Hawai‘i’s diversity, we recognize the ongoing importance of programs and initiatives to cultivate a culture where all employees have equitable opportunities and where diverse perspectives and experiences are valued, included and help lead to stronger performance.
Externally, promoting diversity, equity and inclusion through our engagement activities and through our programs, products and services is important to our long-term success. For our utility, it is critical that Hawai‘i’s decarbonization not leave any part of our community behind, that policies and programs be designed to avoid inequitable shifting of costs and that siting of renewable energy and other infrastructure projects considers environmental justice and community needs. For our bank, advancing economic equity and inclusion and financial fitness strengthens the financial health of its customer base and the overall economy.
24 HEI HAWAIIAN ELECTRIC AMERICAN SAVINGS BANK PACIFIC CURRENT QUANTITATIVE < CONTENTS
5
HUMAN CAPITAL Employee Engagement
How we define it
Creating a company culture where all employees belong, contribute and can thrive. Working to foster employee enthusiasm and commitment to the organization and its mission to be a catalyst for a better Hawai‘i, improving employee satisfaction and retention and attracting talent. Maintaining a strong focus on development and training and fair labor practices such as those relating to pay, benefits and hours.
Why it’s important
An engaged and qualified workforce is one of our greatest assets in achieving our decarbonization and other company goals, developing strong relationships with our customers and communities and remaining competitive. Strong employee engagement promotes high performance and innovation and helps attract and retain talented employees. We believe in providing leadership opportunities and development for our employees across the HEI family of companies who have a sense of responsibility to meet the needs of our customers and communities.
BUSINESS MODEL & INNOVATION
Climate-Related Risks & Opportunities

How we define it
Identification of and preparation for the impacts of climate change, including physical and transition risks. Positioning our companies for opportunities including the deployment of clean energy solutions, increasing electrification and identification of potential business growth areas to address climate change.
Why it’s important
Climate change has wide-ranging implications for our economy, our communities and our companies. The leadership demonstrated by our companies in this area can serve as an example to others and spur action in other local industries. While global decarbonization efforts hold the potential to curb the worst effects of climate change, our climate is already changing. Here in Hawai‘i we’re seeing longer periods of warmer temperatures, greater frequency of high tide flooding and more severe weather events. We expect further impacts in the future, including more frequent and severe storms and a potential 3.2-foot rise in sea level in Honolulu by the end of the century.3
Climate change presents both risks and opportunities as we adapt, innovate and address its challenges. As an essential service provider, our utility has been focused on climate impact for some time and is at the forefront of community-wide climate mitigation and adaptation efforts. Our bank evaluates potential climate change risks to its loan portfolio, real estate assets and its operations, and proactively monitors and develops mitigation plans.
25 Decarbonization 1 Economic Health & Affordability 2 Reliability & Resilience 3 Secure Digitalization 4 Diversity, Equity & Inclusion 5 Employee Engagement 6 Climate-Related Risks & Opportunities 7 PRIORITY AREAS
6
7
HEI’s Climate Constellation* HEI’s Employee Engagement Constellation*
Interrelationship. Many of our top ESG priorities are related to one another. The charts above illustrate some of the key areas of interrelationship.
Our ability to successfully decarbonize our state’s economy and deliver reliable and resilient power is influenced by our ability to identify, adapt and respond to climate-related risks and opportunities. It also relies on infrastructure investment and modernization, must be aligned with our stakeholders and must be done in a manner that is inclusive, affordable and shares the costs and benefits of the transition equitably. See “HEI’s Climate Constellation,” above.
In order to engage employees successfully, we need to advance diversity, equity and inclusion within our enterprise, ensure the safety of our employees and the public, use effective governance and ethical business practices and communicate transparently with employees and external audiences. See “HEI’s Employee Engagement Constellation,” above.
26 HEI HAWAIIAN ELECTRIC AMERICAN SAVINGS BANK PACIFIC CURRENT QUANTITATIVE < CONTENTS
IMPORTANCE TO BUSINESS IMPORTANCE TO STAKEHOLDERS
Reliability & Resilience
Risks & Opportunities
Investment & Modernization Stakeholder Engagement Economic Health & Affordability Diversity, Equity & Inclusion HIGH LOW HIGH LOW
Decarbonization
Climate-Related
Infrastructure
Ethical Business Practices Safety Effective
Diversity, Equity & Inclusion Employee Engagement IMPORTANCE TO BUSINESS IMPORTANCE TO STAKEHOLDERS HIGH LOW HIGH LOW SASB DIMENSIONS Environment Business Model & Innovation Social Capital Leadership & Governance Human Capital
Constellation = a group or cluster of related elements.
Transparency
Governance Practices
*
Our Methodology
Our consolidated HEI ESG priority assessment was developed through a robust process that incorporated internal and external stakeholder input.
1. Subsidiary ESG Priority Assessments
We began by identifying potential ESG factors from reporting standards, particularly SASB and TCFD, industry peer benchmarking, credit rating agencies, ESG rating organizations, institutional investors and frameworks such as the UN Sustainable Development Goals (UN SDGs).

Interviews were conducted across a range of external and internal stakeholders, including community and non-profit organization leaders and employees and executives from each subsidiary. Insights were augmented by our companies’ ongoing customer and other stakeholder engagement and by a utility customer survey on ESG priorities.
Subsidiary executives refined their ESG priorities through structured workshops and obtained board input through discussions at a multi-day board retreat.
The resulting subsidiary ESG priority matrices guide integration of ESG priorities into each subsidiary’s strategic planning and risk management activities.
27 Decarbonization 1 Economic Health & Affordability 2 Reliability & Resilience 3 Secure Digitalization 4 Diversity, Equity & Inclusion 5 Employee Engagement 6 Climate-Related Risks & Opportunities 7 PRIORITY AREAS
Executive workshops Board review and input Utility subject matter expert interviews Utility customer survey Reporting guidelines and ESG frameworks Community stakeholder interviews
2. Consolidated HEI ESG Priority Assessment
We leveraged the subsidiary ESG priority assessments to identify initial potential priorities for the consolidated HEI enterprise.
Extensive sentiment and media analyses were completed to review priorities and expectations of key stakeholder groups. This included review of equity research reports and public materials from institutional investors to understand their ESG priorities, and was informed by our ongoing engagement with investors and other stakeholders.

Interviews were completed with a diverse cross-section of HEI and subsidiary leaders to refine focus areas and understand any shifts in prioritization of topics from the subsidiary ESG priority assessments.
Executives from across the enterprise participated in structured workshops to review, validate and prioritize the identified ESG topics for the consolidated enterprise. A sub-group of Board members provided input prior to full Board review of the resulting set of priority issues.
28 HEI HAWAIIAN ELECTRIC AMERICAN SAVINGS BANK PACIFIC CURRENT QUANTITATIVE < CONTENTS
HEI and subsidiary executive interviews Executive workshops Industry peer and leader benchmarking Board review and input Investor and other stakeholder research
and ESG
Results of subsidiary ESG assessments Media search
sentiment analysis
Alignment with United Nations Sustainable Development Goals (UN SDGs) and the Aloha+ Challenge
Our top ESG priority areas align with nine of the 17 UN SDGs and with the Aloha+ Challenge. The UN SDGs were created by the UN in 2015 as part of a global sustainable development agenda aimed to end poverty, protect the planet, and ensure prosperity for all. The Aloha+ Challenge is Hawai‘i’s statewide sustainability framework, and has been recognized as a model for local implementation of the UN SDGs and for other island economies as they tackle challenges like energy and food security, waste management and economic growth.

Hawai‘i Green Growth, which has been designated a UN Local2030 Hub, worked with stakeholders across the islands to develop the Aloha+ Challenge. Progress on the Aloha+ Challenge goals is tracked through an online dashboard and measured through community co-developed metrics and indicators.
SOCIAL CAPITAL
SOCIAL CAPITAL / HUMAN CAPITAL Diversity, Equity & Inclusion HUMAN
BUSINESS MODEL & INNOVATION
Climate-Related Risks & Opportunities
29 Decarbonization 1 Economic Health & Affordability 2 Reliability & Resilience 3 Secure Digitalization 4 Diversity, Equity & Inclusion 5 Employee Engagement 6 Climate-Related Risks & Opportunities 7 PRIORITY AREAS
CAPITAL Employee Engagement
ENVIRONMENT Decarbonization
Economic
Health & Affordability
SOCIAL CAPITAL Reliability & Resilience
Digitalization 1 2 3 4 5 6 7
SOCIAL CAPITAL Secure
Consolidated Climate Strategy
HEI’s core strategies are deeply integrated with climate change mitigation and adaptation outcomes. The long-term value of our enterprise is directly linked to our ability to support climate goals at the local, national and global levels.
Our companies are uniquely positioned to advance Hawai‘i’s statewide climate efforts. As providers of critical infrastructure and services, our subsidiaries play essential roles in Hawai‘i’s transition to a net zero economy. Hawaiian Electric anchors our climate change strategy, as the utility aggressively decarbonizes Hawai‘i’s energy and transportation sectors while building resilience to the impacts of climate change. American Savings Bank provides financing for its customers to invest in clean energy and resilience projects and is focused on making its banking operations more sustainable. Pacific Current is deploying innovative sustainability projects to help Hawai‘i achieve its climate ambitions and a more sustainable future.
HEI Consolidated Climate Strategy
Leverage the strength of our companies to:
Lead and facilitate GHG emissions reductions across Hawai‘i
Reduce enterprise-wide carbon emissions
Increase climate adaptation efforts, with a focus on resilience
Invest in business models that drive climate solutions (e.g., electrification)
Advocate for sound policies to meet climate objectives
LEADING THE ENERGY TRANSITION
ADVANCING ECONOMIC SUSTAINABILITY
INVESTING IN SUSTAINABLE INFRASTRUCTURE
Execute Climate Change Action Plan to achieve aggressive electricity generation emissions reductions
Promote beneficial electrification to reduce emissions in other sectors (e.g., transportation)
Evaluate emissions removal options (e.g., carbon removal, offsets) as levers towards net zero goal
Enhance system resilience
Navigate energy transition with attention to affordability, reliability and environmental justice
Finance Hawai‘i’s climate transition through lending for energy efficiency, renewable energy and storage, electric vehicles, fleet electrification and resilience
Fund sustainable and affordable housing
Improve resource efficiency across bank operations
Invest in non-regulated sustainable infrastructure, including vehicle charging, renewable energy and storage
Contribute to sustainability efforts in other sectors, including water, wastewater, agriculture and carbon removal, storage and re-use technologies
30 HEI HAWAIIAN ELECTRIC AMERICAN SAVINGS BANK PACIFIC CURRENT QUANTITATIVE < CONTENTS
HEI’s core strategies are deeply integrated with climate change mitigation and adaptation outcomes.”
Greenhouse Gas (GHG) Emissions Inventory
In 2022, HEI completed its first enterprise-wide GHG emissions inventory. Given how integral ESG is to our strategies, this was a priority undertaking to understand the detailed emissions footprint across all our companies. As the emissions reporting landscape remains dynamic, we worked with experienced advisors to calculate and categorize our emissions in accordance with global and industry standards.4 This initial inventory, which will be refined and expanded over time, will guide development of our future climate-related targets and action plans.
This initial inventory builds upon our previously disclosed utility generation emissions,5 which comprise the bulk of our enterprise-wide emissions. The GHG emissions inventory captures the types of emissions listed in the table below over the last three years (relative to a 2015 baseline).
Net enterprise-wide GHG emissions in measured categories decreased 15% from 2015 to 2021, driven largely by reductions in the utility’s generation-related emissions.
The following pages include a summary of our consolidated enterprise inventory and each entity’s historical GHG emissions inventory and components. Please see Appendix – GHG Inventory Methodology for notes on methodologies and emissions factors used in developing the inventory.
We have chosen to display both (a) a consolidated view of our inventory to show our combined footprint and (b) GHG inventories by subsidiary to reflect categories and sources
specific to each operating business, which is where the sources can be most impacted by company actions. With respect to the consolidated inventory, please note that since all of our companies operate in Hawai‘i and one of those companies is an electric utility, enterprise-wide emissions will not exactly equal a sum of the emissions from each entity. For example, for ASB, the HEI holding company and Pacific Current, Scope 2 purchased electricity emissions largely represent electricity these entities purchase from our utility and are thus already reflected in our utility Scope 1 and 3 generation emissions. Similarly, Pacific Current’s Scope 1 owned generation largely represents energy that it generates at its Hamakua Energy facility and sells to Hawaiian Electric for resale on Hawai‘i Island; thus it is counted in the utility’s Scope 3 purchased electricity for resale category.

Future Intent: On March 21, 2022, the SEC proposed expanded climate-related disclosure rules. Our future reporting disclosures will be aligned with the SEC’s rules as finalized and as appropriate. We plan to obtain third-party verification and attestation of our GHG emissions inventory for future reporting. We also plan to expand coverage of categories in future GHG emissions inventories, including with respect to Scope 3 categories for non-utility subsidiaries.
GHG EMISSION SCOPES
SCOPE 1
Direct emissions, including:
Company-owned generation
Company vehicle fleet
Fugitive emissions from company operations
Indirect emissions, primarily:
Purchased electricity for use in own operations
Evaluated for all entities.
Utility generation represents nearly the entirety of Scope 1 enterprise emissions.
SCOPE 2
Fugitive emissions from HVAC units in leased facilities
Evaluated for all entities. Utility electricity is generated directly from company-owned power plants or from the grid. As the utility is vertically integrated and does not access wholesale markets, its Scope 2 emissions are already fully accounted for in its Scope 1 and 3 generation emissions.
SCOPE 3
Value chain emissions, including:
Purchased electricity for resale
Upstream emissions from purchased fuel-related activities, such as extraction and production Business travel and employee commuting
Evaluated for the utility, as its Scope 3 emissions are significant and include generation-related categories. We intend to include Scope 3 categories for our non-utility entities in future inventories.
31 Decarbonization 1 Economic Health & Affordability 2 Reliability & Resilience 3 Secure Digitalization 4 Diversity, Equity & Inclusion 5 Employee Engagement 6 Climate-Related Risks & Opportunities 7 PRIORITY AREAS
HEI Enterprise-Wide GHG Emissions (MT CO2e)
Note: Figures have been developed in partnership with an experienced GHG emissions advisor, and should be considered preliminary and subject to future verification. Numbers may not add up precisely due to rounding.
i As a vertically integrated utility without access to wholesale electricity markets, the utility’s Scope 2 electricity use is already reflected in its Scope 1 and 3 generation emissions.
ii SF6 emissions are from T&D equipment losses from O‘ahu only, and do not include Hawai‘i Island or Maui County.
iii T&D losses associated with purchased power are included in Scope 3 purchased electricity emissions.
iv Biogenic CO2 emissions from biofuel combustion are reported separately and not included in totals (CH4 and N2O from biofuel are included in totals).
v Scope 2 fugitive emissions include emissions from HVAC units not owned or controlled (generally leased facilities).
vi Categories in purple are also reflected in utility Scope 1 and 3 generation emissions; adjustment amounts exclude ASB electricity purchased outside of Hawaiian Electric service areas.
2015 (BASELINE) 2019 2020 2021 Scope 1 Scope 2 Scope 3 Scope 1 Scope 2 Scope 3 Scope 1 Scope 2 Scope 3 Scope 1 Scope 2 Scope 3 Hawaiian Electric i 4,097,705 3,872,421 4,056,115 3,582,872 3,740,976 3,168,996 3,689,982 3,120,896 Stationary Combustion 4,085,494 4,042,889 3,732,129 3,679,601 Mobile Combustion 6,007 5,944 5,137 4,618 SF 6 Fugitives ii 6,204 7,283 3,710 5,762 Purchased Electricity for Resale iii 3,012,754 2,720,829 2,376,162 2,337,351 Upstream Stationary Fuel 851,884 853,844 788,648 779,959 Upstream Mobile Fuel 1,718 1,731 1,487 1,236 Employee Commuting 4,515 4,451 2,084 2,000 Business Travel 1,549 2,017 615 351 Not included in totals: Biogenic CO2iv 68,557 434,257 32,880 445,344 18,683 500,620 15,970 496,603 American Savings Bank 49 5,052 133 6,175 113 4,395 71 4,131 Mobile Combustion 2 2 2 Fugitives v 49 25 131 23 111 19 69 18 Purchased Electricity 5,027 6,153 4,376 4,114 Pacific Current 235,498 2 121,248 12 111,604 118 Stationary Combustion 235,498 121,248 111,604 Fugitives v Purchased Electricity 2 12 118 HEI Holding Company 2 499 2 511 1 232 1 222 Fugitives v 2 2 1 1 Purchased Electricity 0 499 511 232 222 CONSOLIDATED ENTERPRISE (excludes biogenic CO 2) 4 Gross Enterprise-Wide Emissions 4,097,756 5,551 3,872,421 4,291,748 6,688 3,582,872 3,862,338 4,639 3,168,996 3,801,658 4,471 3,120,896 Enterprise-Wide Adjustmentsvi (5,455) (235,498) (6,609) (121,248) (4,562) (111,604) (4,392) Net Enterprise-Wide Emissions (by Scope) 4,097,756 96 3,872,421 4,056,250 79 3,582,872 3,741,090 77 3,168,996 3,690,054 80 3,120,896 Net Enterprise-Wide Emissions (all Scopes) 7,970,273 7,639,201 6,910,163 6,811,030
32 HEI HAWAIIAN ELECTRIC AMERICAN SAVINGS BANK PACIFIC CURRENT QUANTITATIVE < CONTENTS
HEI Enterprise-Wide GHG Inventory (MT CO2e)
15%
Decrease in net enterprise-wide GHG emissions in measured categories vs. 2015*
Climate Change Action Plan
Hawaiian Electric’s Climate Change Action Plan targets generation-related emissions that comprise the bulk of the company’s carbon footprint. Details are available on page 59
70% Carbon Emissions
*Based on preliminary 2021 data.
2045 GOAL
Net Zero Emissions
The utility signed the Science Based Targets initiative (SBTi) Business Ambition for 1.5°C campaign and intends to submit its targets for third-party validation by 2023.
Reduction in CO2e in stack emissions from Scope 1 and 3 power generation as compared to 2005 baseline
CO2e in stack emissions from Scope 1 and 3 power generation
SCOPE 1: Direct Emissions SCOPE 2: Indirect Emissions SCOPE 3: Value Chain Emissions 2015 BASELINE 2019 2020 2021 4.1M 3.9M 4.1M 3.6M 3.7M 3.2M 3.7M 3.1M 8.0M 7.6M 6.9M 6.8M 33 Decarbonization 1 Economic Health & Affordability 2 Reliability & Resilience 3 Secure Digitalization 4 Diversity, Equity & Inclusion 5 Employee Engagement 6 Climate-Related Risks & Opportunities 7 PRIORITY AREAS
2030
TARGET
Hawaiian Electric GHG Inventory (MT CO2e)
Note: Reductions driven largely by transitioning generation to clean and renewable energy sources.
Hawaiian Electric’s Scope 2 emissions are from electricity produced either on-site or from the grid, and are already captured in generation-related Scope 1 and 3 emissions.
*Includes fugitive SF6 T&D emissions and mobile combustion (company vehicle fleet)
**Includes upstream mobile fuel emissions, employee commuting and business travel
As noted above, the utility’s structure (vertically integrated with no access to wholesale electricity markets) means that its Scope 2 electricity use emissions are already reflected in its Scope 1 and 3 generation emissions. The utility’s generation emissions are also inclusive of transmission and distribution (T&D) losses, reflecting the electricity that is consumed/lost in a T&D system. While utilities sometimes report independent power producer (IPP) T&D losses as Scope 2 emissions (as the reporting landscape evolves), the utility has categorized these IPP T&D losses (estimated as 130,892 MT CO2e in 20216) as Scope 3 to remain consistent with its other IPP-related public reporting.
As of 2021, the utility’s preliminary GHG emissions from generation7 represented a 22% reduction from the 2005 baseline. The utility maintains a publicly available, online GHG emissions scorecard8 to report annual emissions from sources that supply electricity to our grids.
Notes: All figures should be considered preliminary and subject to future verification. Detailed GHG methodology and assumptions are available on page 156. Although utility Scope 2 emissions are captured in Scopes 1 and 3 for the utility (as discussed above), the company intends to further quantify utility Scope 2 emissions in subsequent reports in order to better inform efficiency-related emissions reduction strategies. Biogenic CO2 emissions from biofuel combustion are considered carbon neutral. They are calculated and shown on page 32 but not included in utility emissions totals9, in line with the GHG Protocol guidance.
34 HEI HAWAIIAN ELECTRIC AMERICAN SAVINGS BANK PACIFIC CURRENT QUANTITATIVE < CONTENTS
SCOPE 1: Direct Emissions SCOPE 2: Indirect Emissions SCOPE 3: Value Chain Emissions 2015 BASELINE 2M 4M 6M 8M 0M 2019 CO 2 e EMISSIONS (MT) 2020 2021 4.1M 8.0M 3.9M 3.6M 3.2M 3.1M 4.1M 7.6M 6.9M 6.8M 3.7M 3.7M 2021
2 e EMISSIONS 0.2% Other Scope 1* 11.5% Upstream Stationary Fuel 0.1% Other Scope 3** 34.3% Purchased Electricity for Resale 54.0% Stationary Combustion
HAWAIIAN ELECTRIC CO
6.8M MT CO2e
American Savings Bank GHG Inventory (MT CO2e)
Note: Changes driven largely by the bank's move to its current campus in 2019 (overlapping administrative space during move in 2019 and reductions in administrative space since) and shrinkage of branch footprint.
Pacific Current GHG Inventory (MT CO2e)
Note: Reductions driven largely by transitioning a portion of generation to biofuels.
HEI Holding Company GHG Inventory (MT CO2e)
Note: Reductions driven by decreases in administrative space and electricity use.
35 Decarbonization 1 Economic Health & Affordability 2 Reliability & Resilience 3 Secure Digitalization 4 Diversity, Equity & Inclusion 5 Employee Engagement 6 Climate-Related Risks & Opportunities 7 PRIORITY AREAS
SCOPE 1: Direct Emissions SCOPE 2: Indirect Emissions SCOPE 3: Value Chain Emissions 2015 BASELINE 2015 BASELINE 2019 2019 2019 0K 0K 0 2K 100K 50K 200 100 4K 250K 200K 150K 500 400 300 6K CO 2 e EMISSIONS (MT) CO 2 e EMISSIONS (MT) CO 2 e EMISSIONS (MT) 2020 2020 2020 2021 2021 2021 5.1K 501 4.5K 233 4.2K 111.7K 223 6.3K 235.8K 513 2021 ASB CO 2 e EMISSIONS 2021 PACIFIC CURRENT CO 2 e EMISSIONS 2021 HEI CO 2 e EMISSIONS 0.1% Mobile Combustion 0.1% Purchased Electricity 0.5% Fugitives 97.9% Purchased Electricity 99.9% Stationary Combustion 99.5% Purchased Electricity 121.2K 235.5K
2.1% Fugitives 4.2K MT CO2e 111.7K MT CO2e 223 MT CO2e
Task Force on Climate-Related Financial Disclosures (TCFD)
At HEI we have committed to maturing and further quantifying our TCFD responses over time. In this TCFD-aligned disclosure, we outline our governance and risk management approach for climate change, identify key climate-related risks and opportunities, provide a high-level analysis of implications of a transition climate scenario and a physical scenario, and summarize our current primary metrics and targets related to climate change. As our utility’s Integrated Grid Planning (IGP) process continues progressing, we intend to use these longrange planning and climate insights to further enhance our TCFD reporting moving forward.
Governance & Risk Management
What is Our Approach for Governance of Climate-Related Risks and Opportunities?

ESG-related risks, opportunities and strategies, including those related to climate change, have the same potential to impact long-term value as other significant risks and opportunities. As a result, the Board and management determined that all priority ESG factors should be identified and formally integrated into our existing governance structures and management activities.
In addition, the Board and its Nominating & Corporate Governance (NCG) Committee work to ensure we have directors with highly relevant experience on ESG topics applicable to our businesses and strategies, including renewable energy, climate change strategy and environmental management. Five independent members of the Board have direct experience in one or more of these areas, bringing deep expertise to the Board’s oversight of climaterelated risks and opportunities.
See page 17 for additional details on board expertise.
36 < CONTENTS HEI HAWAIIAN ELECTRIC AMERICAN SAVINGS BANK PACIFIC CURRENT QUANTITATIVE
Many of our strategies, plans and investments relate to reducing the severity of climate change in the future through decarbonization...”
1 2 3 4 5 6 7
Four Elements of Recommended Climate-Related Financial Disclosures
Governance
The organization’s governance around climate-related risks and opportunities Strategy
The actual and potential impacts of climate-related risks and opportunities on the organization’s business, strategy and financial planning
Risk Management
The processes used by the organization to identify, assess and manage climate-related risks
Metrics and Targets
The metrics and targets used to assess and manage relevant climate-related risks and opportunities
Company strategies are overseen by the Board as a whole and are managed through HEI’s strategic planning processes. The Board provides guidance on strategic priorities and plans and approves the overall corporate budget to allocate resources for agreed-upon strategies. The Board carries out these responsibilities through its annual strategic retreat, regular Board meetings, review of written reports and ongoing engagement with management. ESG-related matters have been an increasingly important focus of management and the Board and have become a key component of our long-term business strategy and operational planning processes.
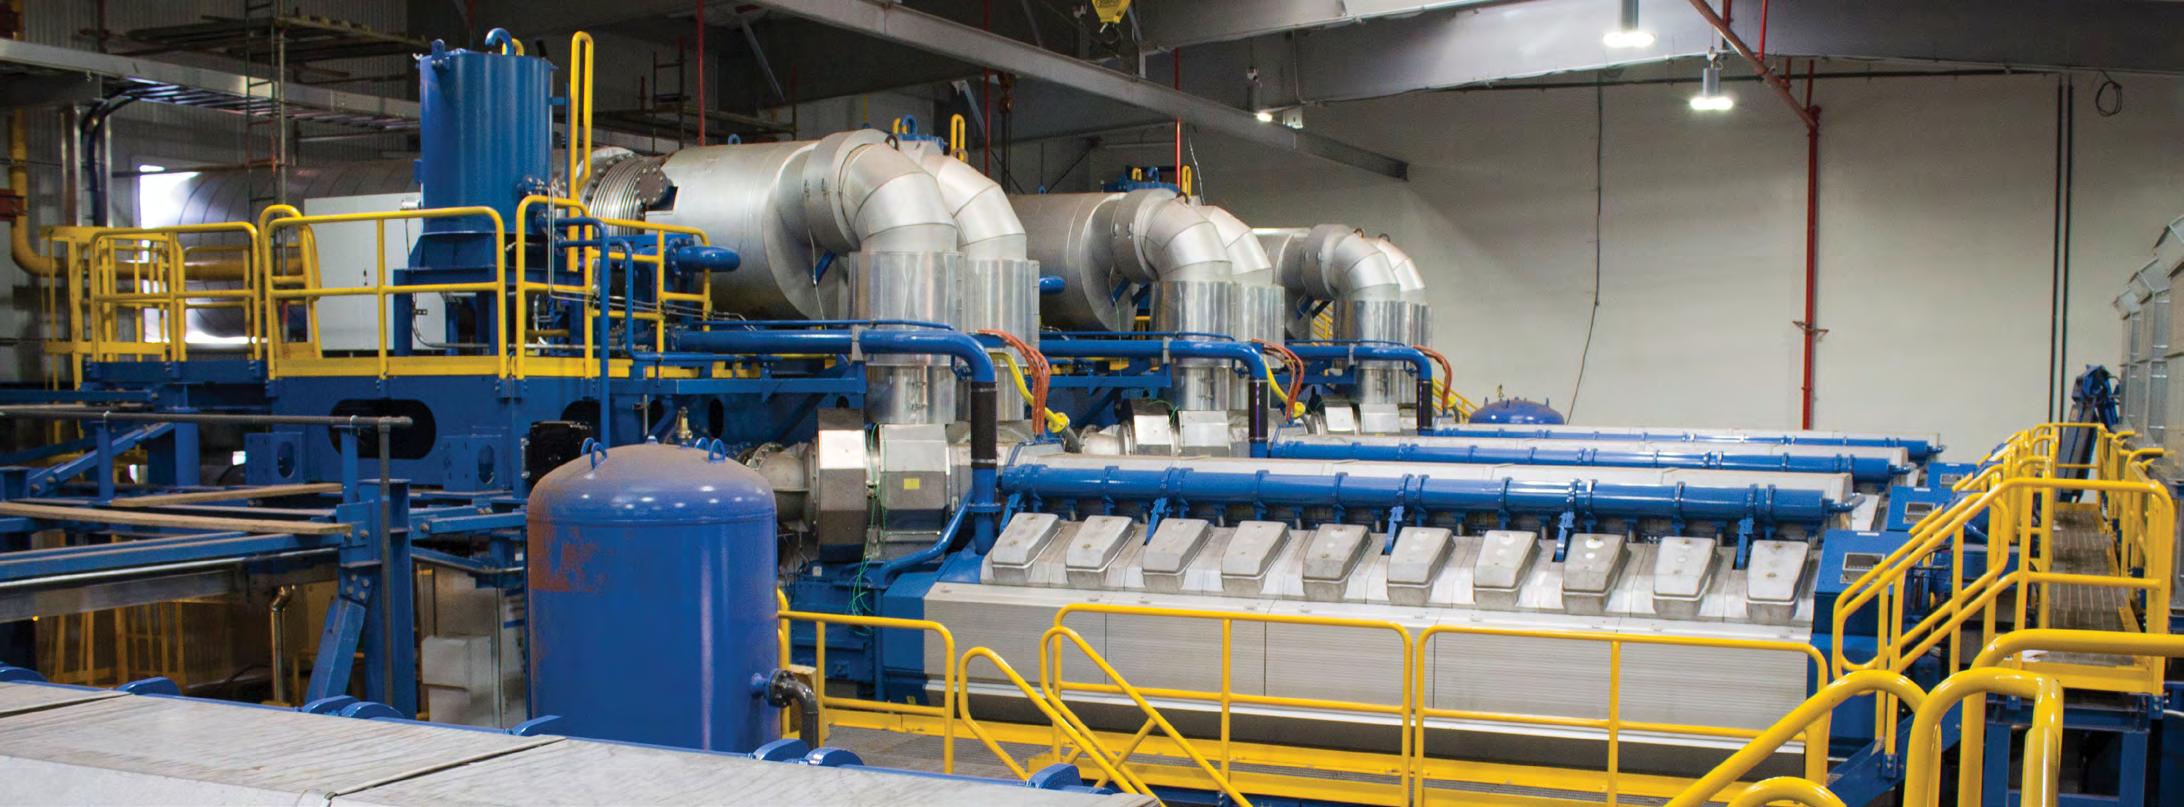
Many of our strategies, plans and investments relate to reducing the severity of climate change in the future through decarbonization, such as the utility’s work to retire fossil fuelbased generation and increase the use of renewable energy and storage and the utility’s and Pacific Current’s efforts to increase electrification of Hawai‘i’s economy, including transportation. We also have set into motion strategies, programs and plans to prepare our companies to withstand future impacts of climate change and improve the resilience of our infrastructure and operational capabilities and processes. This includes investments like the utility’s Schofield Generating Station, which enhances resilience through its location away from the shoreline, its quick-starting capability to respond to fluctuations in solar and wind generation and its ability to use biofuels or conventional fuels. We also regularly monitor and make other investments to increase the reliability of our island power grids.
The Board, along with the operating company boards of Hawaiian Electric and American Savings Bank, are involved in frequent discussions about and receive regular reports on ESGrelated strategic matters. Such discussions and reports have included:
Annual review of company strategy and enterprise risk at board strategy retreats:
2019: “deep dive” on climate change risk and sea level rise, which included presentations by a leading climate risk analytics firm and by each operating company on climate-related risks and mitigation plans
2020: update on the integration of material ESG elements, including climate change, into risk management and strategic planning
2021: “deep dive” on decarbonization strategies, alignment with global climate ambitions, and development of utility’s climate targets and pathways to achieve net zero carbon emissions
Quarterly review of progress on strategic initiatives as part of regular board meetings
Monthly updates on Hawaiian Electric’s progress on initiatives to achieve Hawai‘i RPS goals and Climate Change Action Plan targets
37 Decarbonization 1 Economic Health & Affordability 2 Reliability & Resilience 3 Secure Digitalization 4 Diversity, Equity & Inclusion 5 Employee Engagement 6 Climate-Related Risks & Opportunities 7 PRIORITY AREAS
Governance Strategy Risk Management
Metrics and Targets
Source: TCFD, "Implementing the Recommendations of the Task Force on Climate-Related Financial Disclosures" (June 2017)
Climate-related risks are integrated into HEI’s overall Enterprise Risk Management (ERM) processes. The Board provides oversight of climate-related and other risks through comprehensive and integrated ERM processes and regular reporting on the material risks that can potentially impact our operations, strategies and long-term financial performance. The Board also reviews and provides feedback on the company’s ERM processes for identifying, monitoring, managing and mitigating risks to ensure these processes are effective. Topics discussed at the board level include utility reliability and resilience, technology innovation and integration, increased frequency of natural disasters and extreme weather events and their potential impacts for our companies, sea-level rise and its potential implications for physical assets and financial assets such as the bank’s loan portfolio, and land use and prevailing community sentiment in the context of accelerated renewable energy development.
Each Board committee has responsibilities with respect to oversight of climate-related risks and opportunities, and reports on its activities and recommendations through regular and, as necessary, special Board and/or committee meetings:
The NCG Committee is responsible for ensuring all priority ESG issues, including climate-related risks and opportunities, have appropriate Board oversight.
The Audit & Risk Committee is responsible for overseeing (i) the ERM program, which includes management of climate-related risks and (ii) financial and other reporting to ensure transparency and consistency with best practices and standards.
The Compensation & Human Capital Management Committee oversees executive compensation, including establishing incentive goals to drive execution of strategy, as well as human capital management matters such as diversity, equity and inclusion. Several ESG goals, including climate change-related goals, are included in executive incentive compensation for HEI and utility executives. This includes goals related to accelerating RPS achievement, reducing GHG emissions, and improving reliability and electrification of transportation (EOT).
In addition to the Board committees, the Hawaiian Electric Audit & Risk Committee assists in overseeing the utility ERM program and the ASB Risk Committee assists in overseeing the bank’s ERM program.
What is the Oversight Process for Climate-Related Risks and Opportunities?
The Board has approved a consolidated ERM system recommended by management. The system is designed to identify and assess risks across the HEI enterprise so that information regarding the enterprise risks can be reported to the Board along with proposed strategies for mitigating and managing these risks. The structure of the ERM system is decentralized, with separate chief risk officers at Hawaiian Electric and ASB in addition to HEI’s chief risk officer (HEI CRO). The ERM functions for “other” operations of HEI, such as Pacific Current, are performed by the HEI CRO or HEI employees under the supervision of the HEI CRO. Each subsidiary chief risk officer reports directly to the respective subsidiary president and functionally to the HEI CRO, who reviews and evaluates such risks on a consolidated basis. The Board believes that this decentralized risk management structure is appropriate and effective for the company’s diverse operations and holding company structure, because it allows for industry-specific risk identification and management at the subsidiary levels while also ensuring an integrated and consolidated view of risk at the holding company level.
Business and strategic planning are designed to develop goals and priorities, establish key performance indicators and identify challenges to successfully implementing company strategy. Management hosts and actively participates in an annual multiday strategy retreat with the Board, where plans and strategic initiatives across the HEI enterprise are reviewed, providing the basis for the annual budgeting process and update to our multiyear financial forecast. Strategies and progress updates toward achieving key goals, such as the RPS, are discussed with the Board in depth at the retreat, as well as through Board meetings over the course of the year. On an ongoing basis, management plans and executes strategies to achieve organizational priorities, including ESG responsibilities and initiatives.
Future Intent
As the climate change landscape evolves, we will continue to build upon the strong base level of experience and knowledge within senior management and the Board, as well as continue to consider climate change expertise in Board succession planning. The full Board will continue to monitor our sustainability performance and approve updates to our sustainability strategy and goals.
38 HEI HAWAIIAN ELECTRIC AMERICAN SAVINGS BANK PACIFIC CURRENT QUANTITATIVE < CONTENTS
RISK THEMES 1 2 3 4 5 6 7
RISK THEME DESCRIPTIONS THEME
Strategy
What Climate-Related Risks and Opportunities has HEI Identified Over the Short, Medium and Long Term?
HEI defines risk as uncertainty that could have an adverse effect leading to financial, physical and/or reputational loss, harm and/or damage. Opportunities arise when conditions, trends and/or company strengths present the potential to generate financial or other benefits. In preparation for this report, risks and opportunities were considered for three time horizons –short term (<5 years), medium term (5-15 years) and long term (15+ years).
TECHNOLOGY
MARKET
DESCRIPTION
Risks posed to operations and assets by climate change. Physical risks originating from climate change can (a) be eventdriven (acute), such as increased severity of extreme weather events (e.g., hurricanes, droughts, floods and fires) or (b) relate to longer-term (chronic) shifts, such as increases in precipitation and temperature, greater variability in weather patterns and sea level rise.
Risks associated with the substitution of existing products and services with lower emission options, unsuccessful investment in new technologies and costs to transition to lower emissions technology.
Risks associated with a significant change in consumer behavior and expectations or with consumers seeking new, enhanced and/or innovative goods and services, which may include low-carbon energy solutions and digitalized services. Risks also include other disruptions such as geopolitical and pandemic-related challenges.
POLICY & LEGAL
Risks associated with legislative and regulatory actions to reduce carbon emissions (such as acceleration of energy transition requirements, pricing of GHG emissions, enhanced emissions reporting obligations, mandates on and regulation of existing products and services or new product development) and exposure to litigation. Risks also include financial exposure of stranded assets and increased disclosure requirements.
REPUTATION
Risks arising from stakeholders’ expectations of how businesses respond to climate change issues. Risks in this area can lead to loss of revenue or market share if these expectations are not addressed.

39 Decarbonization 1 Economic Health & Affordability 2 Reliability & Resilience 3 Secure Digitalization 4 Diversity, Equity & Inclusion 5 Employee Engagement 6 Climate-Related Risks & Opportunities 7 PRIORITY AREAS
In line with TCFD recommendations, HEI categorizes risks into five themes: Physical, Technology, Market, Policy & Legal and Reputation. Physical Technology Market Policy & Legal Reputation
PHYSICAL
Examples of risks identified through HEI’s physical climate risk assessment are provided below and categorized by risk theme and timing:
PHYSICAL
Flooding (Acute) Short
Sea level rise (Chronic)
Increased frequency of intense/severe storms (Chronic)
Reliability
TECHNOLOGY
System resilience
Unsuccessful investment in new technologies
Affordability
Increased cost of raw material and key inputs
Access to capital to adequately fund investments
MARKET
Change in customer behavior/expectations (e.g., customer reliance on fossil fuel self-service distributed generation)
Negative impacts to state’s economy
Managing public and regulatory policies / expectations / perceptions, including delayed regulatory approvals
Medium term
Medium term
Short term
Short term
Medium term
Short term
Short term
Medium term
Short term
Medium term
Short term
POLICY & LEGAL
GHG emissions pricing
Increased stakeholder concern
REPUTATION
Stigmatization of sectors, technologies and products
Short term
Short term
Medium term
40 HEI HAWAIIAN ELECTRIC AMERICAN SAVINGS BANK PACIFIC CURRENT QUANTITATIVE < CONTENTS
Short Term <5 yrs 0 5 Years TIMELINE HORIZON 15 Years Medium Term 5-15 yrs Long Term 15+ yrs
THEME RISK
TIMELINE
RISK TIMELINE
NAME
term
OPPORTUNITY THEME DESCRIPTIONS
THEME DESCRIPTION
ENERGY SOURCE
RESOURCE EFFICIENCY
PRODUCTS & SERVICES
MARKETS
Opportunities typically associated with the utilization of lower emission sources of energy, supportive policy incentives and new technologies.
Opportunities relating to more efficient energy production and distribution and modes of transportation, increased efficiency in buildings (including water, energy and cooling/heating) and the reduction of water usage and consumption.
Opportunities relating to the development and/or expanded use of goods and services with lower emissions, development of climate adaptation solutions and development of new products or services.
Opportunities related to expansion of and access to new markets, supporting and facilitating integration of new lowcarbon and climate adaptation technologies, products and services, and use of public sector incentives to enable more timely and efficient energy transition and climate adaptation.
RESILIENCE
OPPORTUNITY TIMELINE
ENERGY SOURCE
Opportunities related to improvement of system resilience and reliability, e.g., through resource and/or geographic diversification, system hardening, deployment of new technologies and customer participation in new programs.
RESOURCE EFFICIENCY
Increased use of renewable energy sources
Growth of decentralized/distributed generation and grid services
Electrification of transportation and other sectors
More efficient transmission and distribution system and operations
Shift in customer preferences creating opportunities for new energy products and programs
Financing physical relocation or reinforcement of properties
Short term
Short term
Short term
Short term
Short term
Short term
PRODUCTS & SERVICES
Financing the renewable energy transition and investing in R&D of negative emissions technologies
Water/wastewater management
Affordable housing
MARKET
Local catalyst for change
Sustainable / affordable / resilient community (re-)development
Hardening of critical infrastructure assets and diversification of geography (e.g., siting of infrastructure at higher elevations and/or other islands within the state)
Short term
Short term
Short term
Short term
Medium term
Short to long term
RESILIENCE
Hawai‘i as center of climate change research and solutions
Medium term
41 Decarbonization 1 Economic Health & Affordability 2 Reliability & Resilience 3 Secure Digitalization 4 Diversity, Equity & Inclusion 5 Employee Engagement 6 Climate-Related Risks & Opportunities 7 PRIORITY AREAS
THEME OPPORTUNITY
NAME TIMELINE
What is the Impact of Climate-Related Risks and Opportunities on HEI’s Businesses, Strategy and Financial Planning?
Climate change presents a range of risks as well as meaningful opportunities for our companies. With our remote island location, we see many climate-related risks – and our need to address them – as beginning in the near term. We also see many of our opportunities as presenting themselves in the near term. The paragraphs that follow discuss key risks and opportunities related to climate change that we’re addressing and factoring into our strategies and plans.
Risks
Climate change is expected to increase the severity and frequency of hurricanes, flooding and droughts in Hawai‘i while leading to rising temperatures and sea level across the state. If not appropriately planned for and addressed, these physical climate change impacts could cause damage to (i) Hawaiian Electric facilities, impacting operations and reliability, (ii) the properties that secure American Savings Bank’s residential and commercial loans, impacting the value of that collateral and (iii) the state economy, affecting the financial health of our customer base. We’re focused on managing and mitigating physical risks to our operations from climate change and are leaders in community planning initiatives to promote physical and economic resilience in the state.

The utility continues its work to assess resilience threats and prioritize improvements to enhance resilience. This has included an independent review of potential resilience vulnerabilities, using climate risk analytics to refine and prioritize specific needs and engaging with stakeholders to incorporate their
perspectives. These considerations are part of our Integrated Grid Planning (IGP) process, which is our in-progress planning effort to determine future generation, transmission and distribution needs for our system.
The utility engaged a leading consulting firm in electric utility resilience to perform an independent assessment to identify key vulnerabilities to severe natural events. Following this assessment, the consultant report outlined a set of recommendations to ensure quick restoration of power to critical customers, reduce total restoration time and minimize the total amount of damage from a severe natural event. This included recommendations for system hardening, substation flood monitoring, enhanced vegetation management, emergency restoration, damage prediction modeling and additional in-depth studies.
The utility engaged a leading provider of predictive climate risk analytics software to support climate risk analyses for its generation, transmission and distribution infrastructure. The utility is using climate risk analysis to inform decisions about the location, prioritization and timing of investments to improve electric system resilience.
The utility is also using these analyses to inform its IGP process and planning. The IGP process includes a Resilience Working Group composed of stakeholders representing critical infrastructure providers, emergency management agencies, state and local government energy, planning, climate change and resilience officials, the hospitality and healthcare industries, the military, solar and other renewable energy providers and other stakeholders. Thus far, the Resilience Working Group has identified key resilience threats and associated scenarios; developed recommendations for: 1) the IGP process, 2) utility work outside of the IGP process and 3) key customer and infrastructure partners to improve resilience; developed a taxonomy for categorizing and prioritizing critical customers; and assessed the capabilities and needs of key customers and infrastructure.
The utility is using insights from these analyses and the IGP Resilience Working Group to develop a five-year Climate Adaptation Transmission and Distribution Resilience Program. The program prioritizes high-impact, costeffective projects on O‘ahu, Maui, and Hawai‘i Island to address climate-related vulnerabilities. Key elements of this plan include strategic investments in critical transmission and distribution asset hardening, wildfire prevention and mitigation and hazard tree removal.
42 HEI HAWAIIAN ELECTRIC AMERICAN SAVINGS BANK PACIFIC CURRENT QUANTITATIVE < CONTENTS
1 2 3 4 7
In parallel, the utility continues to focus on strengthening its emergency response capabilities through training and development as well as by engaging with community leaders and stakeholders to strengthen broader community resilience. See page 86 for more on our work to advance community resilience.
As the utility adopts and procures new technology and solutions to increase clean energy and meet customers’ evolving expectations, there is a risk of locking in long-term infrastructure or contractual commitments that will be overtaken by more efficient or more economical options. One of the utility’s core planning principles is to not let today’s technology crowd out tomorrow’s breakthroughs. The utility carefully assesses new technologies and closely monitors developing technologies and cost curves before investing in or contracting for new generation or other resources.
American Savings Bank regularly monitors its credit exposure in areas at risk of sea-level rise and increased exposure to climaterelated weather events. Its appraisal team performs property research to confirm flood zones, and its underwriting decisions evaluate flood zone maps, which consider property location, topography and elevation. The bank requires borrowers with property in a Special Flood Hazard Area, as defined by the Federal Emergency Management Agency (FEMA), to maintain sufficient flood insurance throughout the life of the loan. Should Special Flood Hazard Areas change due to sea-level rise, the bank may require affected borrowers to obtain flood insurance. The bank monitors leading indicators to assess how and when
market valuations may reflect potential future climate change impacts and discusses such indicators and any mitigation recommendations with the ASB Risk Committee, HEI CRO and HEI Audit & Risk Committee.

The bank also considers and plans for other physical risks related to climate change, such as the potential for business interruption due to severe weather. To promote resilience and continued customer service, the bank’s core processing is located on the U.S. mainland with back-ups in several different U.S. states. This geographic diversification supports the bank’s ability to serve its customers even in the event of severe storms, flooding or other acute events impacting Hawai‘i.
The health of HEI as a consolidated enterprise is inextricably linked to the strength of the local economy, community and environment of our state. Adverse climate-related changes in Hawai‘i could impact the state’s environmental and cultural assets and its appeal as a visitor destination and place to live. Adverse climate change impacts on the U.S. mainland could reduce the market for travel to Hawai‘i. Such conditions could negatively impact HEI’s businesses to the extent they affect the state’s tourism sector, currently the largest driver of Hawai‘i’s economy, or decisions by Hawai‘i businesses and families to relocate out of state. Examples include warmer temperatures; warmer oceans that place stress on coral reefs and sea life, potentially reducing the abundance and variety of marine life; and sea-level rise and coastal erosion, which could adversely impact the state’s beaches and near-shore infrastructure, homes and businesses.
43 Decarbonization 1 Economic Health & Affordability 2 Reliability & Resilience 3 Secure Digitalization 4 Diversity, Equity & Inclusion 5 Employee Engagement 6 Climate-Related Risks & Opportunities 7 PRIORITY AREAS
Opportunities
While climate change presents significant risks, it also offers meaningful opportunities for HEI and its subsidiaries. As the state of Hawai‘i strives to transition to a carbon neutral to carbon negative economy and continues one of the nation’s most ambitious energy transformations, our companies have opportunities to invest in decarbonization and resilience, advance electrification of our economy to benefit all customers, offer new products and services, and partner with our communities to advance a more sustainable future for Hawai‘i.
Hawaiian Electric Climate Change Opportunities
Adding hundreds of megawatts of renewable energy to our system and retiring fossil fuel-based generation to reduce carbon emissions, increase energy independence and promote customer bill stability
Incorporating battery storage to help integrate increasing amounts of intermittent renewable energy such as solar or wind resources
Creating opportunities for customers to benefit from and participate in the clean energy transition by providing programs and rate structures to integrate customer-owned distributed energy resources (DERs) that include private rooftop solar, battery storage, energy efficiency and electric vehicles
Expanding access to clean energy benefits through our community based renewable energy (community solar) program, enabling customers without the ability to add private rooftop solar, as well as qualified LMI customers, to participate in the clean energy transition and benefit from bill credits
Enabling the use of customer DERs to provide grid services, supporting reliable grid operations, responding to variability in electricity supply and demand and providing new opportunities for customers to gain value from connection to the grid
Advancing opportunities to electrify the state’s economy, including the transportation sector, and thus reducing Hawai‘i’s overall carbon emissions; this includes deploying utility-owned fast chargers, proposing make-ready infrastructure to support electric buses and fleets, providing educational resources to help overcome barriers to electric vehicle adoption and collaborating with stakeholders to further advance electrification
Modernizing our grid to facilitate increased integration of clean energy and distributed resources, greater efficiency, resilience, improved reliability and more customer options
Enhancing the resilience of our system through partnering with key customers, including the military, to develop resilient generation and microgrids that can be isolated from the grid when needed; hardening or reinforcing critical transmission, sub-transmission and distribution circuits; locating equipment outside areas prone to flooding; and considering alternative paths for transmission circuits to increase geographic diversity
Evaluating economy-wide net zero pathways for Hawai‘i and the impacts electrification will have on utility operations
Identifying opportunities to partner with different industries to deploy mitigation strategies that drive efficient infrastructure investment to address climate impact and opportunities
Earning financial incentives for accelerating the growth of renewable energy on our system through the RPS-A performance incentive (see further discussion on page 50)
44 HEI HAWAIIAN ELECTRIC AMERICAN SAVINGS BANK PACIFIC CURRENT QUANTITATIVE < CONTENTS
1 2 3 4 5 6 7
American Savings Bank Climate Change Opportunities
Pacific Current Climate Change Opportunities
Financing customer investments in energy efficiency, renewable energy, storage, electric vehicles and resilience as businesses and consumers throughout Hawai‘i work to address climate change mitigation and adaptation
Participating in tax credit programs, such as New Markets Tax Credits (NMTC), to help fund renewable energy and other projects in disadvantaged communities; through a Hawai‘i-based community development entity formed in partnership with the O‘ahu Economic Development Board, the bank has helped deploy over $100 million in NMTCs and plans to apply for future allocations – these allocations bring new investments, services and jobs to underserved, low-income communities and include direct investment in renewable energy projects as part of our state’s clean energy transition
Deepening customer relationships by offering educational resources to help customers plan for climate change impacts, such as sea-level rise or increased severity of storms, to homes and businesses
Enhancing the energy and water efficiency of the bank’s real estate footprint (reduced in recent years through office and branch consolidations) and incentivizing employees to use low-carbon transportation options
Reducing reliance on the physical retail branch network, increasing resource efficiency as the bank upgrades facilities and transitions to mobile-and technology-enabled “Anytime, Anywhere Banking”
Financing the development of sustainable, affordable and workforce housing; such housing can be equipped with features such as solar water heating, solar plus battery storage and efficient water and water re-use systems, presenting the potential for the bank and Pacific Current to partner to offer these solutions (as demonstrated in a recent workforce housing project)
Investing in renewable energy projects supporting the transition to clean energy
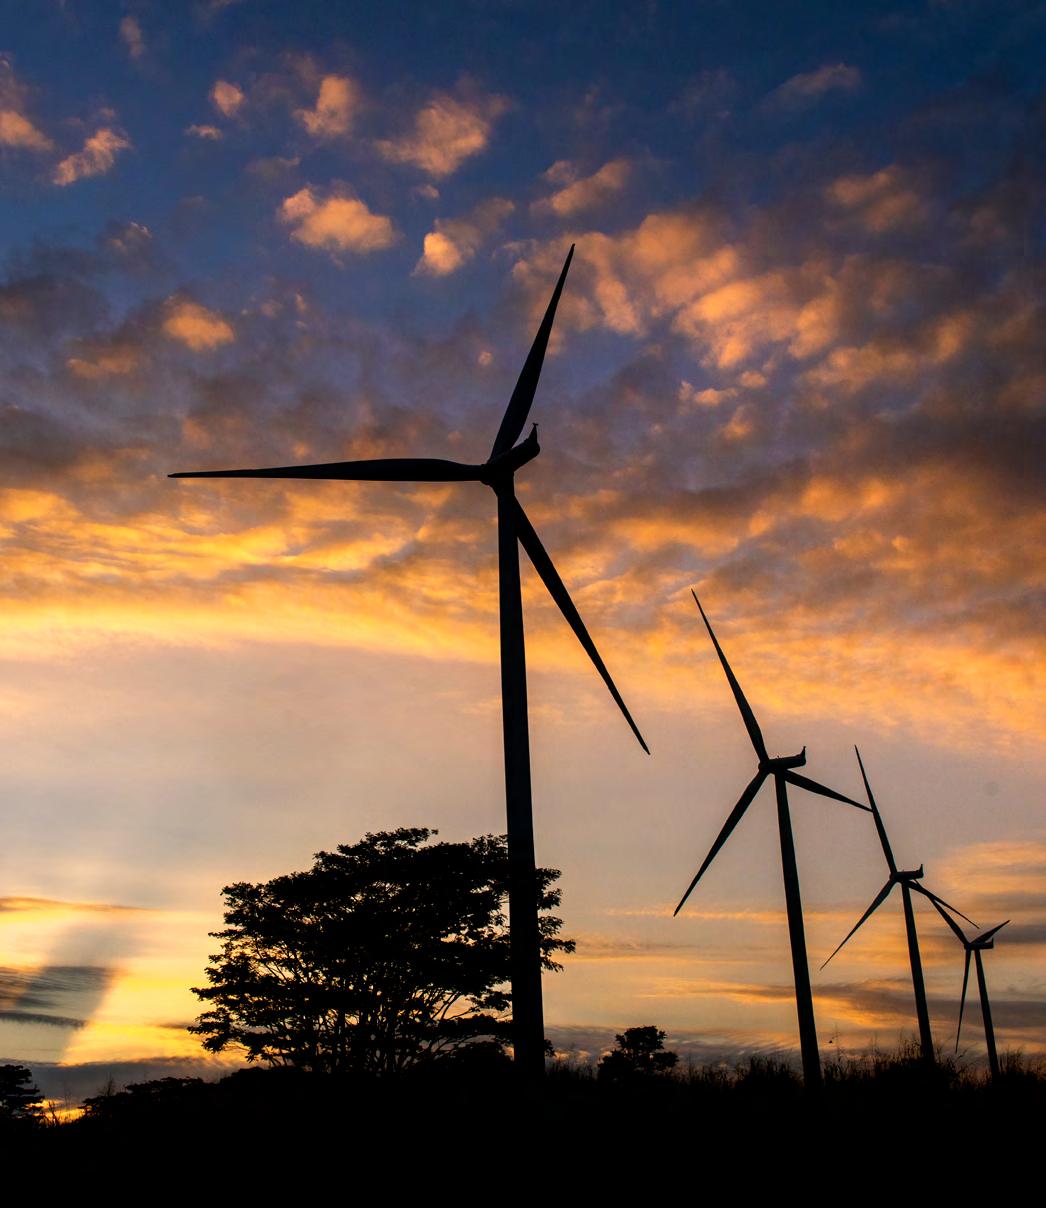
Expanding deployment of EverCharge Hawai‘i charging infrastructure to provide affordable charging systems that optimize existing infrastructure
Exploring market-based business models to scale up reforestation, conservation and carbon sequestration solutions, potentially in conjunction with renewable energy and agriculture
Partnering with water reuse and wastewater treatment technology providers to deploy distributed wastewater treatment solutions that enable water reuse and production of renewable natural gas
45 Decarbonization 1 Economic Health & Affordability 2 Reliability & Resilience 3 Secure Digitalization 4 Diversity, Equity & Inclusion 5 Employee Engagement 6 Climate-Related Risks & Opportunities 7 PRIORITY AREAS
What is the Potential Impact of Different Scenarios, Including a 2°C or Lower Scenario, for HEI?
In preparing this report, we conducted a high-level scenario analysis to assess the impact on our business, strategy and financial planning of certain climate scenarios. To inform our analysis of potential risks and opportunities, we selected one transition scenario, the International Energy Agency’s Energy Technology Perspectives (ETP) 2ºC Scenario, and one physical scenario, the Intergovernmental Panel on Climate Change’s (IPCC) Representative Concentration Pathways (RCP) 6.0.
Transition Scenario
In early 2021, we selected the ETP 2°C Scenario as a basis for our analysis. This choice was partially informed by our anticipation of an eventual shift to 1.5°C alignment. The ETP’s inclusion of a “Faster Innovation Case” provides an accelerated scenario focused on achieving a 1.5°C target by 2050. Considering the urgent takeaways from the UN’s November 2021 COP 26 deliberations and IPCC Sixth Assessment Report (AR6), we are focusing our efforts toward 1.5°C-aligned scenarios.
We selected the accelerated ETP Scenario as it (i) recognizes the importance of decarbonizing economic sectors beyond electricity to reach net zero global emissions by 2050 (in line with a 1.5°C target) and (ii) highlights the role of the electricity sector in enabling broader economy decarbonization.
The accelerated ETP Scenario assumes a transformation of energy generation and consumption to yield a broad reduction in carbon emissions across energy generation, transportation, industry and buildings. Under this scenario, significant increases in renewable electricity generation enable decarbonization of other sectors. As more companies and sectors electrify, electricity consumption is expected to grow significantly. The scenario assumes renewable energy generation, process electrification and other technologies, such as carbon capture, utilization and storage (CCUS) and low-carbon fuels needed to effectuate carbon reductions, are commercially available or sufficiently advanced in their development lifecycle. Policymakers will have a critical role in enabling the transition, including through policies to incentivize investment in new technologies and in electrification of the transport, industry and building sectors.
ANALYSIS
ETP 2ºC Scenario

Transitional Scenario
RCP 6.0 Scenario
Physical Scenario
46 HEI HAWAIIAN ELECTRIC AMERICAN SAVINGS BANK PACIFIC CURRENT QUANTITATIVE < CONTENTS
Key Transition Impacts Under the Accelerated ETP Scenario:
Increase in beneficial electrification. Electrification of transportation and other sectors would drive increased electricity demand. For our utility, this would require procurement and/or construction of more renewable energy generation to meet RPS and decarbonization targets, as well as infrastructure investment (such as makeready infrastructure for electric vehicle charging) and upgrades to the transmission and distribution system. Increased electrification would enable the cost of such investments to be spread across a larger base, and thus would be expected to reduce the per-unit cost of electricity for customers. However, greater generation needs could further pressure land use issues on O‘ahu (e.g., due to limited availability of land appropriate for siting utilityscale renewable energy projects), making large-scale projects challenging. The utility’s goal of net zero emissions from generation by 2045 is consistent with the 2050 economy-wide net zero target identified in 1.5°C scenarios.
Electric grid transitions toward a platform business model. Increased reliance on electricity across other economic sectors would be expected to stimulate more demand for energy efficiency solutions as well as tools to manage and optimize energy usage. Customers are playing a more active role in energy generation and in providing services to the grid and this trend is expected to continue. Further growth in distributed energy resources (DERs) and aggregation of DERs to provide grid services increases the need for a sophisticated grid and customer programs to integrate and optimize such resources. The role of the utility may evolve to a platform or marketplace that provides and manages a range of customer DERs and services from third-party service providers. A key challenge in this context is optimizing our state’s island grids using all available levers, including energy efficiency and other demand-side programs.
Availability of reliable, low-carbon fuels. As the economy becomes more dependent on the delivery of electricity, a reliable energy system requires that low carbon or carbon-free fuels continue developing and reach commercial scale.
Opportunities to finance the clean energy transition. Our bank would be expected to see greater demand for financing solutions from retail and commercial customers to acquire and install distributed generation and storage assets, invest in energy efficiency and vehicle electrification and pursue other carbon reduction solutions, such as CCUS.
Affordable/workforce housing and sustainable investment. The bank would also be expected to see greater demand for financing solutions to develop and deliver more affordable, sustainable and energy-efficient housing options. Pacific Current is well-positioned to contribute to this effort by providing renewable energy projects and energyand water-efficient solutions to make the cost of living in these homes more affordable.
Investment in customer relationships. The changing energy landscape creates opportunities for new customer segments and service offerings. Expanded customer relationships may require additional investments by our utility to adapt to evolving customer expectations. Our bank may also need to invest in additional customer analytics and marketing to develop and deploy new banking products and services for customers investing in clean energy, efficiency and resilience measures.
Creation of new jobs and employment opportunities. The transition to a low-carbon economy and the corresponding evolving role of the utility to a more technology-enabled delivery model will require increased technological skills within our utility workforce. These changes are likely to be similar at the bank, as customers increasingly expect technology-enabled banking solutions. Hawai‘i’s clean economy transition may also support other industries (e.g., ecotourism).
47 Decarbonization 1 Economic Health & Affordability 2 Reliability & Resilience 3 Secure Digitalization 4 Diversity, Equity & Inclusion 5 Employee Engagement 6 Climate-Related Risks & Opportunities 7 PRIORITY AREAS
1 2 6 4 5
Physical Scenario
For our physical scenario we selected the RCP 6.0 Scenario. This scenario assumes a moderate approach to developing and integrating low-carbon solutions in the global economy. Under this scenario, global mean surface temperature is forecast to increase by 0.8 to 1.8ºC by mid-century and could increase up to 3.1ºC by 2100, leading to a range of climate impacts. Our climate risk models also incorporate parameters from the more severe RCP 8.5 Scenario. Honolulu Climate Change Commission models indicate Hawai‘i could experience sea-level rise of 1 to 2 feet in the coming decades and as much as 3.2 feet by the end of the century. Increased temperatures and sea level can lead to higher, more frequent storm surges, increased coastal flooding and erosion, increased inland flooding, more frequent periods of extreme heat and increased storm intensity and frequency. Hotter, drier conditions could also develop on some parts of the islands and could lead to increased frequency of wildfires.
Key Physical Impacts Under the RCP 6.0 Scenario:
Physical ramifications of climate change. Climate change could impact our utility’s physical assets, increase operational disruptions and negatively affect our customers. This would require further investments to “harden” our system, prevent and protect against wildfires, ensure sufficient geographic distribution of generation and transmission assets to enhance reliability and protect against safety risks to employees and customers. Investments to protect against/adapt to climate change physical impacts in advance are more cost effective than addressing those impacts after they occur.10
Lending zone shrinkage at the bank. For our bank these physical impacts necessitate appropriate risk mitigation steps to avoid valuation impacts to loan portfolio collateral. The bank monitors such risks and has identified risk mitigation steps to be implemented if and when needed. As climate-related impacts continue to intensify, the bank may need to cease lending in certain at-risk parts of the islands.
Potential impact on tourism and the state economy. Warmer temperatures, sea-level rise, increased flooding and coastal erosion and greater frequency of severe weather could adversely impact Hawai‘i’s appeal as a place to live and visit. Our success is closely tied to the health of Hawai‘i’s economy, and a decline in tourism and/or rise in Hawai‘i residents permanently leaving the islands could reduce our customer base or impact customers’ financial health.
Future Intent
While our utility regularly conducts scenario analysis for long-range planning and other purposes, 2021 was the first year that we conducted scenario analysis in line with TCFD. We have developed an internal roadmap to enhance our future TCFD scenario analysis, including aligning it with our utility’s plans to achieve a net zero carbon future. Going forward we may also consider expanding our assessments to include additional scenarios.
48 HEI HAWAIIAN ELECTRIC AMERICAN SAVINGS BANK PACIFIC CURRENT QUANTITATIVE < CONTENTS
2 3 6 7
Metrics and Targets
What Metrics are Used by HEI to Assess Climate-Related Risks and Opportunities?
HEI tracks a range of metrics to assess, monitor, and inform our actions to manage climaterelated matters. Several of these metrics are reported in other sections of this report, notably the enterprise-wide GHG inventory (see pages 32-33). For the utility our primary climate-related metrics are carbon and other GHG emissions (see pages 153-154), RPS performance (see page 59) and system reliability performance (see pages 135-137). For the bank, key climate-related metrics relate to sea-level rise, including the number and value of mortgage loans in the 100-year flood zone (see page 147) as well as internally monitored indicators of potential future shifts in Hawai‘i property market values. As we continue to mature our analyses of climate-related risks and opportunities we may refine and/or expand the metrics we track and report.
What Targets are Used by HEI to Manage Its Strategies for Addressing Climate-Related Risks and Opportunities?
We have aligned our efforts with Hawai‘i’s state RPS and carbon neutral to carbon negative economy goals. Since the enactment of the 100% RPS mandate, we’ve accelerated integrating renewable energy as described on the following page. The utility further accelerated procurement efforts that are expected to significantly reduce carbon emissions within the next few years. As a company and management team we’re incentivized to continue our efforts to outperform the RPS milestones in both magnitude and timeframe. We have also adopted our own additional GHG reduction goals. We measure our performance against:
Hawai‘i’s statutory RPS requirements, which are to achieve a 100% RPS by 2045, with interim goals of 30% by 2020, 40% by 2030, 70% by 2040. We outperformed the 2020 RPS goal reaching 34.5% RPS in 2020. We achieved 38.4% RPS in 2021, putting us on track to achieve the 40% goal well ahead of 2030. Hawaiian Electric reports its RPS progress quarterly via its website
Our utility’s Climate Change Action Plan goals, adopted in 2021, which are to reduce GHGs in stack emissions from power generation 70% by 2030 (compared to 2005 levels) and achieve or exceed carbon neutrality from power generation by 2045. As of 2021, we achieved a preliminary 22% reduction compared to 2005.
When we initially announced our Climate Change Action Plan goals, we estimated that by 2025 we would achieve ~60% reduction in GHG emissions from power generation compared to 2005. However, certain near-term projects and completion dates have been impacted by supply chain and inflation dynamics, as well as federal policies relating to solar panel imports. As such, previously anticipated reductions of ~60% by 2025 are now expected to be achieved a couple of years later. We remain committed to our 2030 goal and are pursuing continued procurements and programs toward achieving it.
Hawai‘i’s Performance Based Regulation (PBR) framework, which includes demand-side incentives in areas such as energy efficiency. Hawaiian Electric reports its performance against PBR metrics via its website
49 Decarbonization 1 Economic Health & Affordability 2 Reliability & Resilience 3 Secure Digitalization 4 Diversity, Equity & Inclusion 5 Employee Engagement 6 Climate-Related Risks & Opportunities 7 PRIORITY AREAS
We have aligned our efforts with Hawai‘i’s state RPS and carbon neutral to carbon negative economy goals.”
Renewable Portfolio Standard (RPS) and Greenhouse Gas (GHG) Targets
Hawaiian Electric has several financial incentives to outperform Hawai‘i’s statutory RPS goals:
Should Hawaiian Electric fall short of a statutory RPS milestone, it could be subject to a penalty of $20 for each MWh that it is deficient. The penalty may be reduced if the shortfall is due to circumstances outside the utility’s reasonable control.
In 2021, the Public Utilities Commission (PUC) implemented the RPS-A performance incentive to promote accelerated RPS achievement. The utility is eligible to earn a reward of $20/MWh in 2021-22, $15/MWh in 2023 and $10/MWh in 2024 and beyond should it outperform the RPS-A target each year. The RPS-A is more challenging to achieve than the statutory RPS calculation because RPS-A measures renewable generation as a percentage of total generation rather than as a percentage of sales, like the statutory RPS calculation. The annual RPS-A targets are an interpolation of the RPS goals for 2020, 2030, 2040 and 2045 (see summary of Statutory RPS versus RPS-A on following page).
RPS represents the percentage of electricity sales that are satisfied with renewable energy. GHG emissions are relative to a 2005 baseline and apply to stack emissions from power generation on Hawaiian Electric’s system from both utilityowned sources and independent power producers.
In 2021, the utility earned $1.0 million under the RPS-A incentive. Based on assumptions as of 2/11/22 regarding renewable project commercial operations dates and total generation, the 2022-2024 RPS-A performance incentive ranges are set forth in the table below. Projections may change as completion timelines shift (see Renewable Project Status Board on Hawaiianelectric.com for latest updates).
Projects approved or pending approval have potential to add ~600
50 HEI HAWAIIAN ELECTRIC AMERICAN SAVINGS BANK PACIFIC CURRENT QUANTITATIVE < CONTENTS
2021 RPS-A $1 $0-$4 $4-$10 $7-$11 2022 RPS-A 2023 RPS-A 2024 RPS-A $0M $2M $4M $6M $8M $10M $12M $ MILLIONS ESTIMATED RANGES FOR RPS-A PIM 2022-224 2021 AWARD (ACTUAL)
MW
solar
GWh of storage
of
and ~3
by ~2024
renewable energy projects
RPS-A PERFORMANCE INCENTIVES 30% 2020 70% 2040 100% 2045 40% 2030 RPS TARGETS CLIMATE CHANGE ACTION PLAN TARGETS 1 GHGS IN STACK EMISSIONS FROM ELECTRICITY GENERATION: NET ZERO BY 2045 70% REDUCTION BY 2030 (vs 2005)
RPS-A PIM potential grows as more
come online
Annual targets interpolated between statutory RPS milestones:
31% in 2021, 32% in 2022, ..., 39% in 2029
40% in 2030, 43% in 2031, …, 67% in 2039
In 2020 the Compensation Committee of the Board established a compensation incentive for HEI and utility executives to encourage executives to work toward achieving higher RPS levels well ahead of statutory requirements. For the 2020-22 and 2021-23 periods, 20% of such executives’ long-term incentive pay is tied to RPS performance.
Beginning with the 2022-24 performance period, in light of Hawaiian Electric’s new goal to reduce carbon emissions 70% by 2030 compared to a 2005 baseline, the climate goal component of the long-term incentive plan will focus on carbon emissions reductions achieved rather than RPS achievement.
Executive Compensation Climate Goals

51 Decarbonization 1 Economic Health & Affordability 2 Reliability & Resilience 3 Secure Digitalization 4 Diversity, Equity & Inclusion 5 Employee Engagement 6 Climate-Related Risks & Opportunities 7 PRIORITY AREAS
Minimum Target Maximum RPS BY 2022 32% 40% 50% RPS BY 2023 40% 45% 50% CO2e reduction by 2024 (vs 2005) 28% 32% 36% Statutory RPS vs RPS-A
Statutory RPS PBR RPS-A PIM
RPS = Grid Scale RE + Customer Sited RE Utility Sales
= Grid Scale RE + Customer Sited RE Total Net Generation + Customer RE Penalty for underperformance: $20/MWh penalty for every MWh deficient under RPS milestone Rewards for outperformance: 30% 40% 70% 100% 2020 2040 2030 2045 $20/MWh 2021-2022 $15/MWh 2023 $10/MWh 2024+ RE = Renewable Energy
RPS-A
Electrification Goals
Transportation is responsible for over half of Hawai‘i’s energy sector GHG emissions.11 As described on page 67, Hawaiian Electric is undertaking a number of actions to advance vehicle electrification to help decarbonize our state’s economy. To lead by example, the utility established a goal to electrify 100% of its fleet of more than 400 light duty vehicles by 2035.
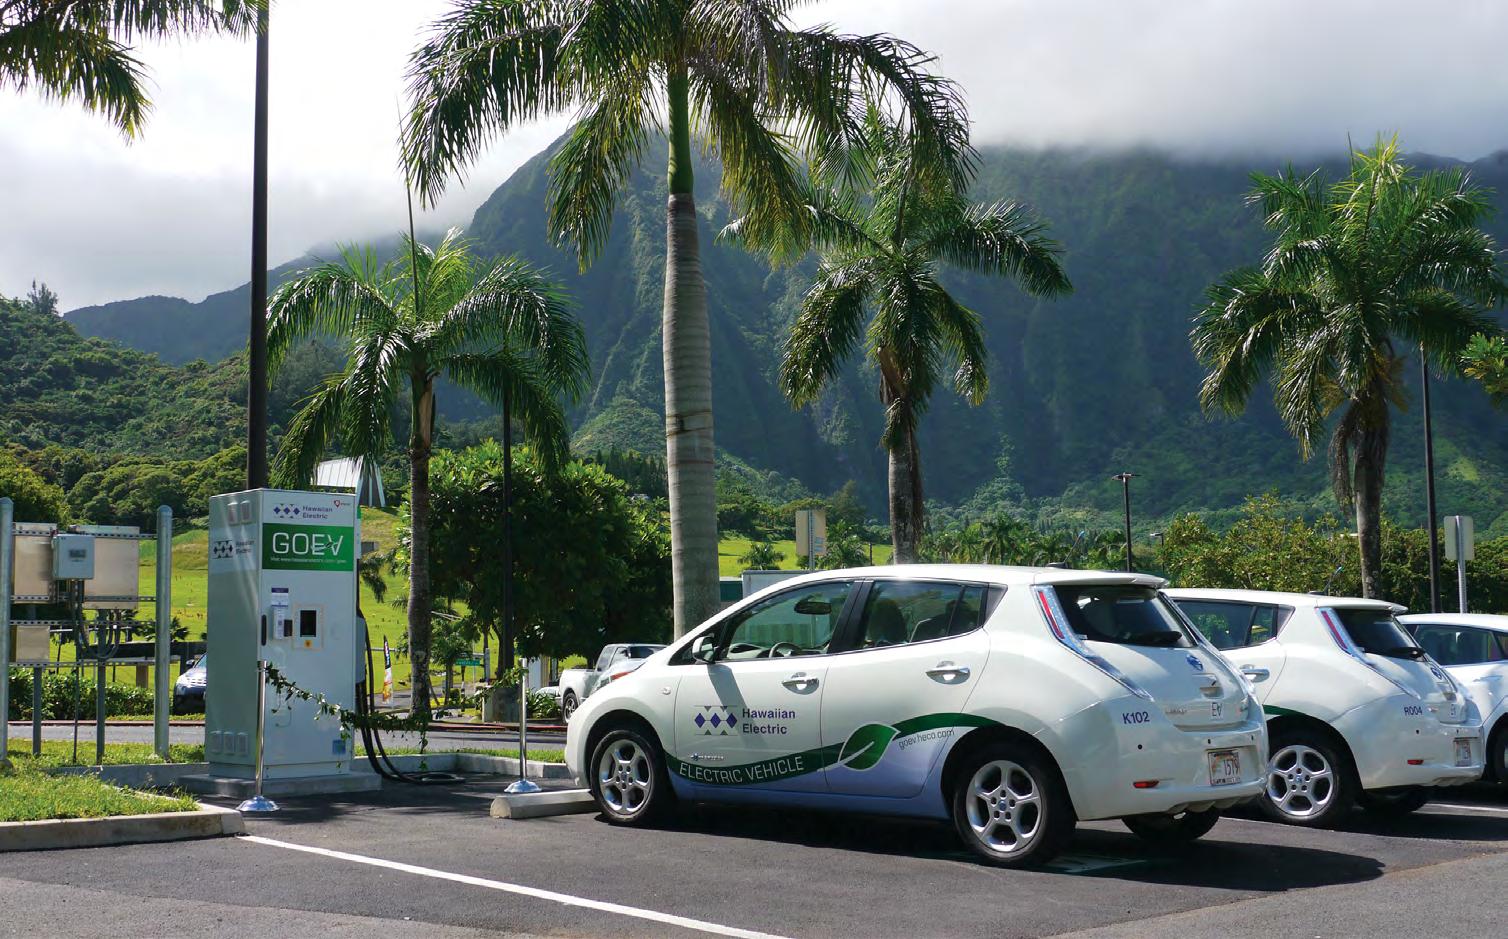
For 2021, HEI and Hawaiian Electric executives’ annual performance compensation included an incentive goal measuring growth in EV-related kWh sales and other revenue vs. the prior year. The maximum goal was achieved in 2021 (exceeding 20% growth vs. 2020). In 2022, the electrification goal has been reframed to focus on the commissioning of new company-owned and operated fast chargers, as well as the launch of new pilot projects.
PBR PIMs
As part of PBR, the PUC established several new Performance Incentive Mechanisms (PIMs) designed to incentivize the utility to achieve goals to advance an equitable, affordable clean energy transition. These PIMs include the RPS-A PIM described above and are discussed in detail on page 64
Future Goals
We anticipate that additional goals and targets will be established in the future as we continue to evolve our strategies and activities for advancing decarbonization and addressing climate-related matters.
52 HEI HAWAIIAN ELECTRIC AMERICAN SAVINGS BANK PACIFIC CURRENT QUANTITATIVE < CONTENTS
1 2 1 2 7 4 5 2021 Electrification Executive Compensation Goal Minimum Target Maximum EV kWh sales and other revenue vs 2020 baseline Maintain 10% growth 20% growth
Hawaiian Electric is undertaking a number of actions to advance vehicle electrification to help decarbonize our state’s economy.”
HEI Charitable Foundation
The HEI Charitable Foundation is a longstanding part of our presence in Hawai‘i. The foundation focuses on community programs that promote environmental sustainability, community resilience, economic strength and educational excellence. These areas align well with our ESG priorities. We take pride in giving back to the community through volunteerism, grants, donations, scholarships and our employee matching gift program.

Since 2010, the HEI Charitable Foundation has contributed more than $22 million to local charities and other nonprofit organizations. Moreover, since 2010 our employees donated or fundraised over $6 million, served on over 200 nonprofit boards and volunteered more than 200,000 hours.
The HEI Charitable Foundation established the Kōkua Community Champion Service Award to honor individual employees who have demonstrated exemplary volunteer service in our communities. Each year, the Foundation also awards college scholarships to children of employees through the HEI Scholars program. HEI Scholars are chosen based on factors including academic achievement, community service and career goals.
We are proud of the contributions our companies continue to make to our Hawai‘i communities — from preserving our environment, to improving the economic well-being of our state, to working with individuals and families experiencing financial hardship due to COVID-19. Together, we share a vision of a stronger, thriving Hawai‘i.

53 Decarbonization 1 Economic Health & Affordability 2 Reliability & Resilience 3 Secure Digitalization 4 Diversity, Equity & Inclusion 5 Employee Engagement 6 Climate-Related Risks & Opportunities 7 PRIORITY AREAS
1 2 3 5 6 7 HEI Foundation Report 2021 CATALYST –Dr. Martin Luther King, Jr. most persistent and question is, ‘What are doing for others?’” Read our 2021 HEI Charitable Foundation Report
Project Footprint – Working Together for a Sustainable Future
Project Footprint provides customers the knowledge and energy options they need to reduce their carbon footprint, helping Hawai‘i achieve its ambitious emissions reduction goals and transitioning our islands toward a more sustainable future.
Project Footprint gained national recognition and received numerous awards for its innovative approach to customer engagement, creative messaging and commitment to environmental sustainability.
One of the most effective ways to combat climate change is to plant a tree. An initiative of the HEI Charitable Foundation, Project Footprint encourages participants to have an endemic Hawaiian tree planted in their name or in the name of a loved one. Each tree is tagged with an RFID chip and GPS technology, which will enable customers to monitor and watch the tree grow online. All trees will be planted at the Project Footprint Legacy Forest by the Hawaiian Legacy Reforestation Initiative, a nonprofit that has already planted more than half a million trees.
Project Footprint also encourages customers to support, donate and volunteer at other nonprofits aligned with their mission. These community partners include Bikeshare Hawai‘i, Blue Planet, Coral Reef Alliance, Hawaiian Islands Land Trust, Institute for Climate and Peace, Kupu, Mālama Learning Center, Mālama Maunalua, Polynesian Voyaging Society, The Nature Conservancy of Hawai‘i and The Trust for Public Land.
We believe our collaborative efforts are key to curbing emissions, preserving our environment and protecting our island home. As is often said in Hawai‘i, no task is too big when done together by all.
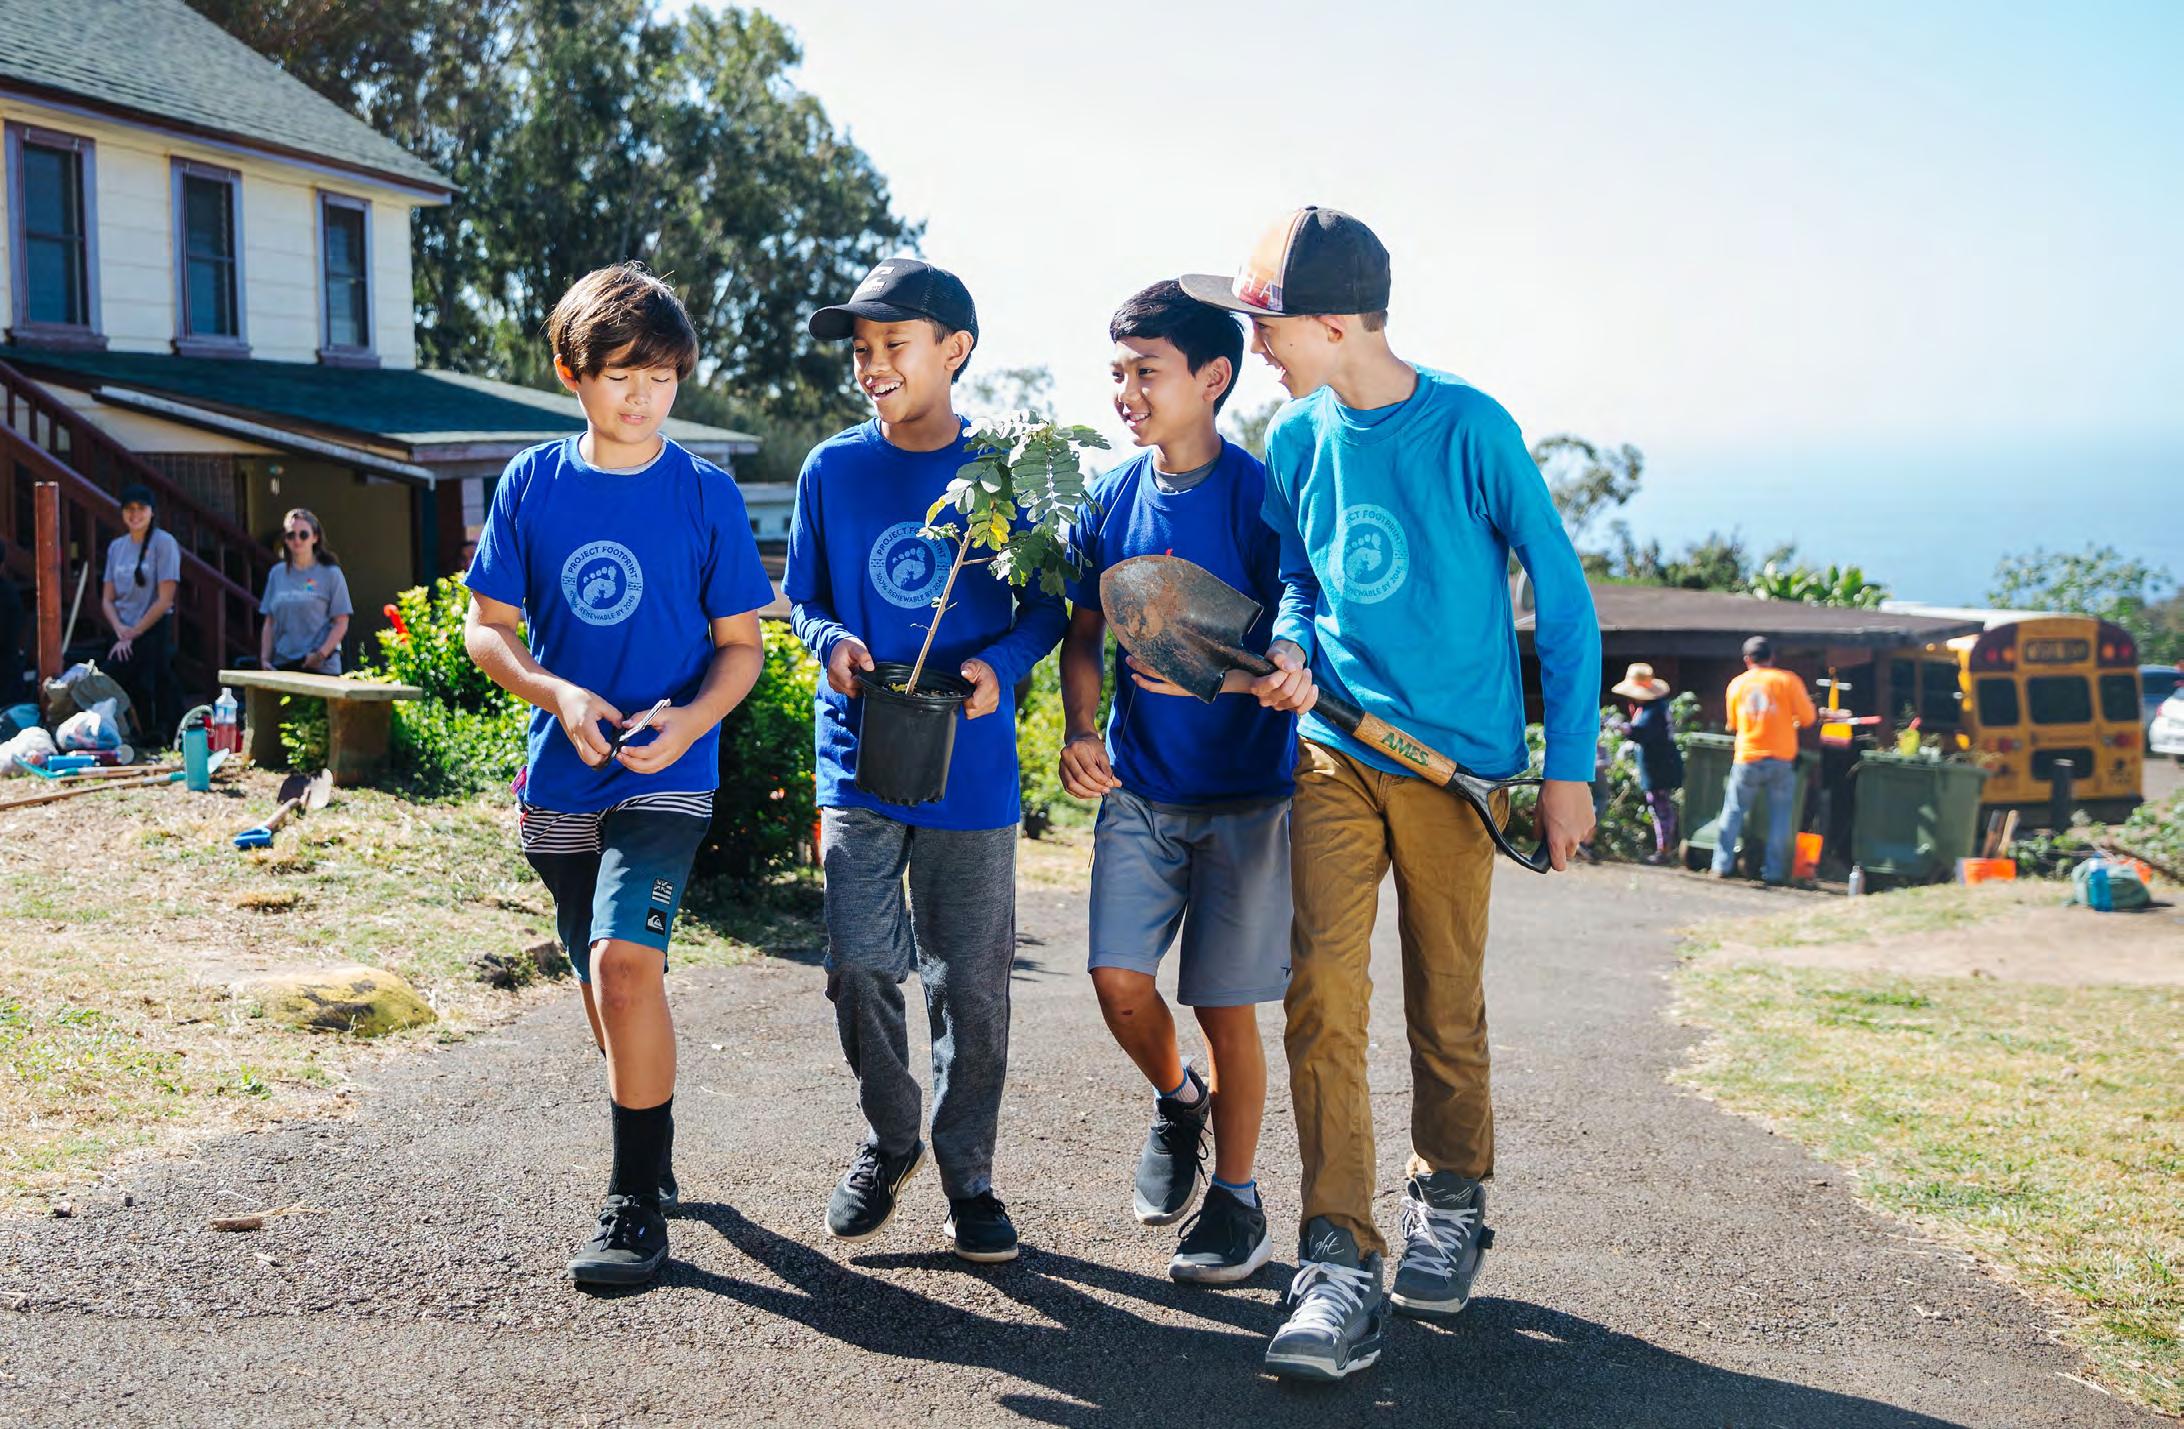
54 < CONTENTS HEI HAWAIIAN ELECTRIC AMERICAN SAVINGS BANK PACIFIC CURRENT QUANTITATIVE
1
Political Activities
Given the types of critical infrastructure that our companies provide, HEI must engage productively with elected officials and policymakers. Hawai‘i’s transition to a net zero economy depends on the development of sound public policy that considers the positions of a range of stakeholders, including HEI. We are committed to complying with all federal, state and local laws governing our participation in the political process and engaging in that process in a way that is transparent and ethical.

HEI companies hold memberships in national industry, trade and business associations representing the energy and banking industries and the business community. In addition, as important employers and proponents of economic development in Hawai‘i, our companies are members of local chambers of commerce, industry groups and business organizations. Our involvement with these organizations helps our companies build relationships, learn the views of others, obtain constructive feedback, support the community and gain insight into important social, business and community issues. Examples of trade associations and other business organizations we are members of include the Edison Electric Institute, Electric Power Research Institute, American Bankers Association, Hawaii Bankers Association, Chamber of Commerce of Hawaii and Hawaii Business Roundtable. Company leaders and team members participate in working groups and committees and serve on boards of such organizations to learn about and inform industry policies and positions. We plan to publish additional information on our memberships in future reports.
HEI has one political action committee (PAC), the HEI Committee for Enlightened Government (CEG), which was established in 1989 to participate in political advocacy on legislative matters and in contributions to candidates for state and county races in Hawai‘i. The CEG is registered with the Hawai‘i State Campaign Spending Commission and files reports of members’ contributions and political campaign donations several times each year, as required by state statute. These reports are public information and searchable online. No corporate funds are used for political contributions. Since 2006, the committee has been funded exclusively by executives and managers of the utility. Participation in the HEI CEG is voluntary. Employees are not reimbursed (either directly or indirectly). In 2021, contributions made by the HEI CEG totaled less than $5,000. HEI does not have a federal PAC.
Among the HEI companies, Hawaiian Electric has historically had the most involvement in political activities. The Hawaiian Electric Vice President of Government and Community Relations and Corporate Communications (“HE VP Government and Community Relations”) is responsible for managing Hawaiian Electric’s participation in the political process. Under the supervision of the HE VP Government and Community Relations, the Hawaiian Electric Government Relations Department is responsible for coordinating Hawaiian Electric’s involvement in the political process and ensuring that employees receive adequate communication and training on matters relating to that process. The HEI Board of Directors currently oversees Hawaiian Electric’s political participation through standing board meeting discussions with management at least quarterly. The HEI Nominating and Corporate Governance Committee reviews our overall governance structure and will consider whether specific oversight responsibilities should be delegated to a committee.
55 Decarbonization 1 Economic Health & Affordability 2 Reliability & Resilience 3 Secure Digitalization 4 Diversity, Equity & Inclusion 5 Employee Engagement 6 Climate-Related Risks & Opportunities 7 PRIORITY AREAS

HEI HAWAIIAN ELECTRIC AMERICAN SAVINGS BANK PACIFIC CURRENT QUANTITATIVE < CONTENTS
Hawaiian Electric
Hawaiian Electric is dedicated to serving Hawai‘i’s energy needs and caring for our environment with purpose, compassion, empathy and aloha. Our role is to empower Hawai‘i, our communities, our customers and our employees to thrive, together.
Hawaiian Electric has been one of the most aggressive utilities in the nation in transitioning to renewable energy12 and working through complex technical issues and social equity considerations to keep our system stable, reliable and affordable for all our customers.

Partnering to Decarbonize Hawai‘i’s Economy
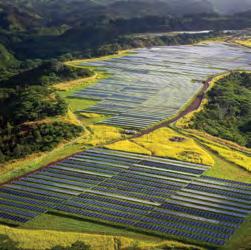
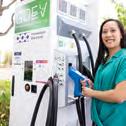
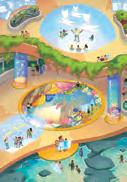


At Hawaiian Electric we are aligned with and committed to achieving our state’s goals — 30% RPS by 2020, 40% by 2030, 70% by 2040 and 100% by 2045. And we’re working to get there faster.
In 2021, we achieved an RPS of 38.4%. The increase in renewable energy was provided by a full year of production from Puna Geothermal Venture returning to service at partial capacity, a full year of production from the Na Pua Makani wind facility and the addition of 53 megawatts of private rooftop systems. We expect to surpass the next statutory RPS goal of 40% well before 2030. Both the company and our executives have financial incentives to achieve higher levels of RPS ahead of state targets. See “Metrics and Targets” on page 49 for more detail.
We know the utility alone will not set the pace of our transition. Factors such as affordability, reliability, social equity, indigenous and cultural considerations, limited land and competing needs for that resource will play a role in how and when we reach our goals. This is why we’re working with our community and our stakeholders to ensure we achieve our state’s renewable energy goals in a way that is right for Hawai‘i.
58 HAWAIIAN ELECTRIC AMERICAN SAVINGS BANK PACIFIC CURRENT QUANTITATIVE HEI < CONTENTS Read our 2021-2022 Utility Sustainability Report
1built areas. Some streamside schools have even begun SmartGrid network panels and gardens. Almost vegetables, leaving the urban our windows collect solar through the day and also O SUSTAINING WATERSHED INNOVATION –SUSTAINABILITY REPORT 21/ 22 TAKING ACTION ON CLIMATE CHANGE TOGETHER
Renewable Portfolio Standard Progress
Our Path to Cut GHG Emissions 70% by 2030*
Ending use of coal in Hawai‘i in September 2022 when contract with coal plant owner expires
Adding nearly 50,000 rooftop solar systems to the 92,500 now online
Using more grid-scale and customer-owned energy storage
Expanding geothermal resources
Retiring at least 6 fossil-fueled generating units and significantly reducing the use of others as new renewable resources come online
Adding renewable energy projects capable of generating a total of at least 1 gigawatt, including shared solar (community-based renewable energy)
Promoting energy efficiency
Creating innovative programs that provide customers incentives for using clean, lower-cost energy at certain times of the day and using less fossil-fueled energy at night
*compared to 2005 levels
59 Decarbonization 1 Economic Health & Affordability 2 Reliability & Resilience 3 Secure Digitalization 4 Diversity, Equity & Inclusion 5 Employee Engagement 6 Climate-Related Risks & Opportunities 7 PRIORITY AREAS
Hawai‘i Island
60.0%
PGV is seeking an additional 8MW, pending approval
Generating Facilities
These maps show existing and planned generating facilities and the maximum potential power in megawatts (MW) they can produce.
FIRM GENERATION: Energy available on demand which can be adjusted as needed.
VARIABLE GENERATION: Energy that may not always be available or controllable.
GRID-SCALE
*Awaiting
Keāhole Power Plant 77.6MW 12MW / 12MWh Pakini Nui Wind Farm 20.5MW * Shipman Steam Plant 15.2MW Decommissioned in 2015 Hill Steam Plant/Kanoelehua Plant 56.5MW Puna Steam Plant 36.7MW Puna Geothermal Venture 38MW Hū Honua (TBD)* 21.5MW Waiau Hydroelectric Plant 1.1MW Waimea Plant 7.5MW Hale Kuawehi Solar LLC** 30MW / 120MWh AES Waikoloa Solar, LLC** 30MW / 120MWh Hawi Renewable Development 10.5MW Hamakua Energy 60MW Wailuku River Hydroelectric Plant 12.1MW Pu‘u‘eo Hydroelectric Plant 3.4MW Customer-Sited Solar 116MW Shared Solar** 0.750MW 18.6% Customer-Sited Solar 17.6% Geothermal 14.8% Wind 4.5% Biofuel 4.1% Hydro 0.4% Grid-Scale Solar RENEWABLE MIX RENEWABLE PEAK July 1, 2021 87.0% Renewable
Energy
BIOMASS
BIOFUELS
GEOTHERMAL HYDRO
CUSTOMER-SITED SOLAR
ENERGY
SOLAR BATTERY
STORAGE SYSTEM
WASTE TO ENERGY
WIND COAL OIL
OIL (DEACTIVATED or DECOMMISSIONED)
progress
approval **In
60
O‘ahu
69.8%
*Awaiting approval **In progress
Solar Energy Fund I 5MW
Power Plant 650MW Kapolei Sustainable Energy Park 1MW
Industrial Park Generating Station 130MW H-POWER 68.5MW
Energy Storage** 185MW / 565MWh
Hawaii 180MW
Solar Energy Fund II 5MW
West Oahu Solar** 12.5MW / 50MWh
Solar 49MW Lanikuhana Solar 14.7MW Schofield Generating Station 50MW Waipio Solar 45.9MW Mililani I Solar** 39MW / 156MWh
North and South 5MW, 1.5MW
Wind 30MW Nā Pua Makani Wind Project 24MW Mauka FIT I 3.5MW
Power Plant 500MW
Power Plant 113MW Deactivated in 2014
Emergency Power Facility 8MW West Loch Solar 20MW
42MW
168MWh
Energy Park 5MW
Solar** 15MW
60MWh
I** 52MW
208MWh
Solar Two 5MW Kalaeloa Partners 208MW Customer-Sited Solar 763MW Shared Solar 0.270MW online / 4.720MW**
MIX Renewable Energy
Customer-Sited Solar 6.0% Grid-Scale Solar 5.9% Waste to Energy 4.4% Wind 0.4% Biofuels
Aloha
Kahe
Campbell
Kapolei
AES
Aloha
AES
Kawailoa
Waihonu
Kahuku
Waiau
Honolulu
Airport
Kupono Solar*
/
Kalaeloa Renewable
Barbers Point
/
Ho‘ohana Solar
/
Kalaeloa
RENEWABLE
16.0%
View Solar** 7MW / 35MWh
Solar 28MW Mahi Solar** 120MW / 480MWh
Power LLC** 36MW
144MWh
Solar** 30MW
240MWh
Wind 69MW
PEAK
17, 2021
32.8% Mountain
Wai‘anae
Waiawa Solar
/
Waiawa Phase 2
/
Kawailoa
RENEWABLE
March
61
Maui County
76.3%
Customer-Sited Solar 135MW Shared Solar 0.028MW
Customer-Sited Solar 2MW
Customer-Sited Solar 3MW Shared Solar** 0.250MW
Substation BESS 1MW / 1MWh
Solar** 15MW / 60MWh
Solar** 40MW / 160MWh
Solar** 40MW / 160MWh South Maui Renewable Resources 2.87MW Hāna Substation 2MW Waena BESS* 40MW / 160MWh Mā‘alaea Generating Station 212.1MW Kahului Power Plant 37.6MW AES Kuihelani Solar** 60MW / 240MWh Kahana Solar** 20MW / 80MWh Tier 3 FIT 17-2 .735MW Tier 3 FIT 17-1* 1MW Ku‘ia Solar 2.87MW Kaheawa Wind Farm 30MW Kaheawa Wind Power II 21MW / 10MW, 20MWh Mānele Bay Combined Heat and Power 1MW Retired in 2021 Lanai Sustainability Research, LLC 1.2MW / 1MW, .5MWh Miki Basin Power Plant 9.4MW Pālā‘au Plant 12MW Moloka‘i BESS 1MW / .397MWh 26.0% Wind 22.8% Customer-Sited Solar 1.4% Grid-Scale Solar 0.1% Biofuels RENEWABLE MIX
Renewable Energy Auwahi Wind 21MW / 11MW, 4.4MWh *Awaiting approval **In progress
RENEWABLE PEAK September 26, 2021
MAUI
LĀNA‘I
Wailea
Paeahu
Kamaole
Pulehu
50.2%
MOLOKA‘I
62
38.4% CONSOLIDATED
Our Generation Mix
2021 TOTAL SYSTEM GENERATION MIX
60.0% 32.8% 50.2%
Factors impacting RPS and Climate Change Action Plan progress:
Customer investments in rooftop solar and battery storage increase renewable generation and decrease sales, leading to higher RPS.
Energy efficiency measures reduce sales and thus increase RPS.
Greater adoption of electric vehicles (EVs) increases sales and may increase the renewable generation needed to reach RPS goals; EVs have many other benefits for customers, the electric system and decarbonization efforts.
Economic conditions can affect electricity sales; for example, COVID-19’s economic impacts reduced sales, causing RPS to increase.
Availability of existing utility-scale renewable projects can make a difference; for example, the Hawai‘i Island geothermal plant outage from 2018-20 reduced renewable generation, and its return to partial service in 2021 increased renewable generation.
In addition, several factors can affect when new utility-scale renewable energy projects are brought online, including:
Availability of cost-effective projects, which can be affected by many factors, including cost of financing, labor, materials and construction
Availability of land
Community acceptance
Independent power producer (IPP) force majeure claims related to the global pandemic; for example, global supply-chain issues, U.S. Customs and Border Protection Withhold Release Orders
Our renewable generation portfolio includes a diverse range of resources, including biomass, biofuels, wind, solar, hydro, geothermal and customer-sited solar. While grid-scale renewable energy is important, our largest source of renewable generation in 2021 was customer-sited solar.
Our current generation mix reflects our progress toward increasing renewable energy, as well as the limited resources available to serve as lower-emitting “bridge fuel” options during this transition. As batteries increase in capability and decline in price, we expect to add more to our system, enabling use of solar power at night or on cloudy days. For now, we need “firm” generation to provide enough electricity to meet demand and operational flexibility to balance fluctuations in intermittent solar and wind energy to ensure reliability. Firm generation resources play key roles because they can be relied on whenever they are needed for as long as they are needed.
Hawai‘i’s current firm generation options are limited. Geothermal, an excellent firm generation source, is only currently available on Hawai‘i Island. Unlike some places, like the Pacific Northwest, in Hawai‘i we do not have access to large hydroelectric power; we have few and relatively small rivers to supply hydroelectric power. Biofuel is a small part of our energy mix today; as cost-effective biofuel becomes available at greater scale we hope to add more. By state policy, nuclear generation is not allowed and the significant investment in and timeframe needed to import liquified natural gas has been discouraged since it is a fossil fuel. Thus, as we work to increase renewables, oil remains a necessary fuel to maintain reliability. This impacts our generation mix as well as our GHG emissions.
63
Decarbonization 1 Economic Health & Affordability 2 Reliability & Resilience 3 Secure Digitalization 4 Diversity, Equity & Inclusion 5 Employee Engagement 6 Climate-Related Risks & Opportunities 7 PRIORITY AREAS 2021 RPS
RPS
HAWAI‘I ISLAND O‘AHU MAUI COUNTY (Including Lāna‘i and Moloka‘i)
1 3
0.7% Biofuels 14.1% Customer Solar 11.0% Coal 7.0% Wind 0.4% Hydro 3.9% Utility-Scale Solar 1.8% Geothermal 3.6% Biomass 57.5% Petroleum
New Regulatory Framework: Performance-Based Regulation
In June 2021 a new performance-based regulation (PBR) framework went into effect for our utility. PBR seeks to incentivize the utility to achieve environmental and social outcomes relating to energy affordability, reliability, customer equity, GHG emissions reduction, electrification of transportation and resilience. By doing so, this framework provides a greater connection between our achievement of climate-related and social goals and our financial performance. For example, under PBR, the utility now has financial incentives tied to performance on:
Accelerating achievement of Hawai‘i’s RPS goals
Achieving faster interconnection times for new distributed energy resources
Efficiently acquiring grid services capabilities from distributed energy resources
Collaborating to deliver energy savings for low- to moderate-income customers
Effectively deploying and enabling advanced meters to enable smart grid capabilities
In 2021, the utility accrued $3.7 million in estimated performance incentive rewards (net of penalties from performance incentives established prior to PBR).
The Hawai‘i Public Utilities Commission, Hawaiian Electric and other stakeholders continue to consider opportunities to refine and improve the framework.

64 HAWAIIAN ELECTRIC AMERICAN SAVINGS BANK PACIFIC CURRENT QUANTITATIVE HEI < CONTENTS
Our Decarbonization Path
Adding Utility-Scale Renewable Energy and Storage
We are working aggressively to add more renewable energy to our system. Some of the new renewable energy facilities are owned by Hawaiian Electric, while many others are currently and are expected to continue to be developed and owned by third-party independent power producers (IPPs).
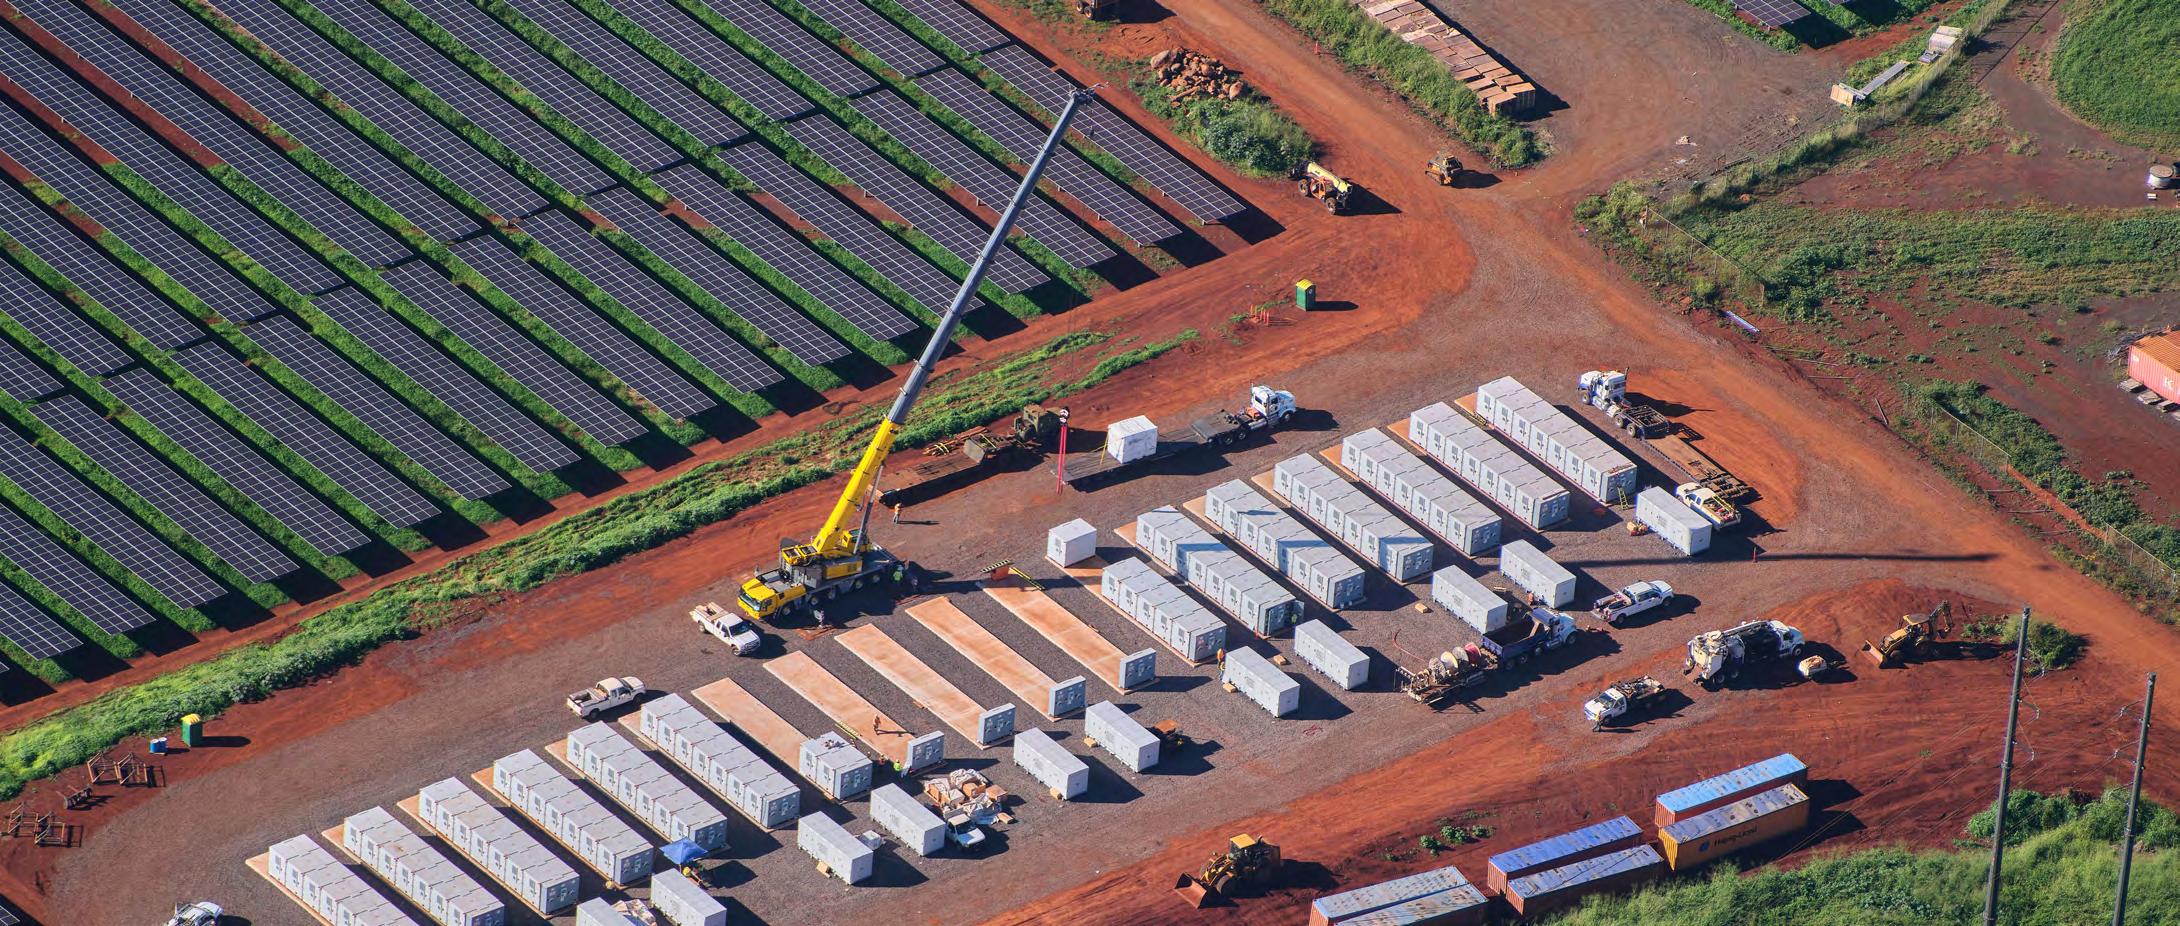
Our state’s policy is for the utility to create competitive procurements for the best technologies and pricing to provide energy options for our customers. We have a robust pipeline of utility-scale projects under development due to our recent renewable energy procurement efforts, the largest ever undertaken in Hawai‘i. Our online Renewable Project Status Board lists all pending renewable energy projects, how much they are anticipated to contribute to RPS, the year they are expected to come online and their current status. We are currently preparing the next round of renewable energy procurements.
Today the peak load for our entire five-island system is just over 1,600 MW. Together, projects under development or pending approval by the PUC from the two large renewable energy procurements we’ve run since 2018 have the potential to contribute an additional ~600 MW of solar and ~3 GWh of storage to our system by the end of 2024. Among the projects pending approval, three are Hawaiian Electric battery energy storage projects.
Deactivating Carbon-Based Generation
In 2014, we deactivated our 113 MW Honolulu Power Plant on O‘ahu and in 2015 we deactivated the 15 MW Shipman Plant on Hawai‘i Island. As sufficient new renewable resources come online, we will be able to continue decreasing the use of carbon-based generating units across our system and deactivating generating units. We plan to deactivate two additional generating units at our Waiau facility on O‘ahu in 2024. Supply chain impacts for projects in development may delay scheduled asset retirements, such as the planned 2024 deactivation of Kahului Power Plant on Maui.
65 Decarbonization 1 Economic Health & Affordability 2 Reliability & Resilience 3 Secure Digitalization 4 Diversity, Equity & Inclusion 5 Employee Engagement 6 Climate-Related Risks & Opportunities 7 PRIORITY AREAS
1 1
We have a robust pipeline of utility-scale projects under development due to our recent renewable energy procurement efforts.”
CUMULATIVE SOLAR INSTALLATIONS
Enabling Everyone to Participate in — and Benefit from — the Energy Transition
While Hawai‘i has abundant sun and wind resources, other resources, particularly land, are scarce. This shapes how we’ll achieve our renewable energy goals. To reach our goals, we need as many customers as possible to adopt rooftop solar and community-based renewable energy, or Shared Solar, and we’re transforming our grid to enable this to happen.
Today we have among the nation’s highest percentages of rooftop solar per capita (21% of residential customers, roughly 37% of single family homes on O‘ahu). We have 92,504 rooftop systems on our grid today; our Climate Change Action Plan envisions adding another 50,000 by 2030.
We’ve invested heavily in our grid and in programs to integrate all of this intermittent, distributed generation while maintaining the reliability our customers expect. Importantly, 91% of new rooftop solar applications also had battery storage in 2021.
This allows daytime excess solar production to be used to reduce fossil-based power at night. We’re continually working to increase participation and make the interconnection process easier for customers. In 2021, we launched our Quick Connect program to enable customers to interconnect their rooftop solar faster, and we also launched the Battery Bonus program providing further incentives for customers to add battery storage. We’re also pursuing grid services procurements to aggregate customer solar, storage and other customer-sited resources to provide a range of services to the broader system.
We’re developing programs for all customers to benefit from renewable energy, not just those who can afford to purchase their own rooftop solar system. We have now launched the second phase of our Shared Solar program, enabling up to 235 MW of renewable generation across our service territory. This new phase of Shared Solar will enable us to extend the benefits of clean energy to a wider range of residents, with priority to those who have been underrepresented in solar adoption, such as renters and customers with low- to moderate-incomes. In addition to private companies, Hawaiian Electric will be able to develop projects and recruit subscribers.
66 HAWAIIAN ELECTRIC AMERICAN SAVINGS BANK PACIFIC CURRENT QUANTITATIVE HEI < CONTENTS
1 2 5
1GW 121MW 5.7% 32% 21% SOLAR SYSTEMS
CAPACITY BATTERY STORAGE INCREASE IN SYSTEMS
HOMES
RESIDENTIAL CUSTOMERS
SOLAR
92,504
ON GRID
FROM 2020 SINGLE-FAMILY
HAVE ROOFTOP SOLAR
HAVE ROOFTOP
SYSTEMS 1,019MW
2021 CUSTOMER ENERGY RESOURCES
92,504
HAWAI‘I HAS AMONG THE HIGHEST PER CAPITA RATES OF ELECTRIC VEHICLES (EVs)
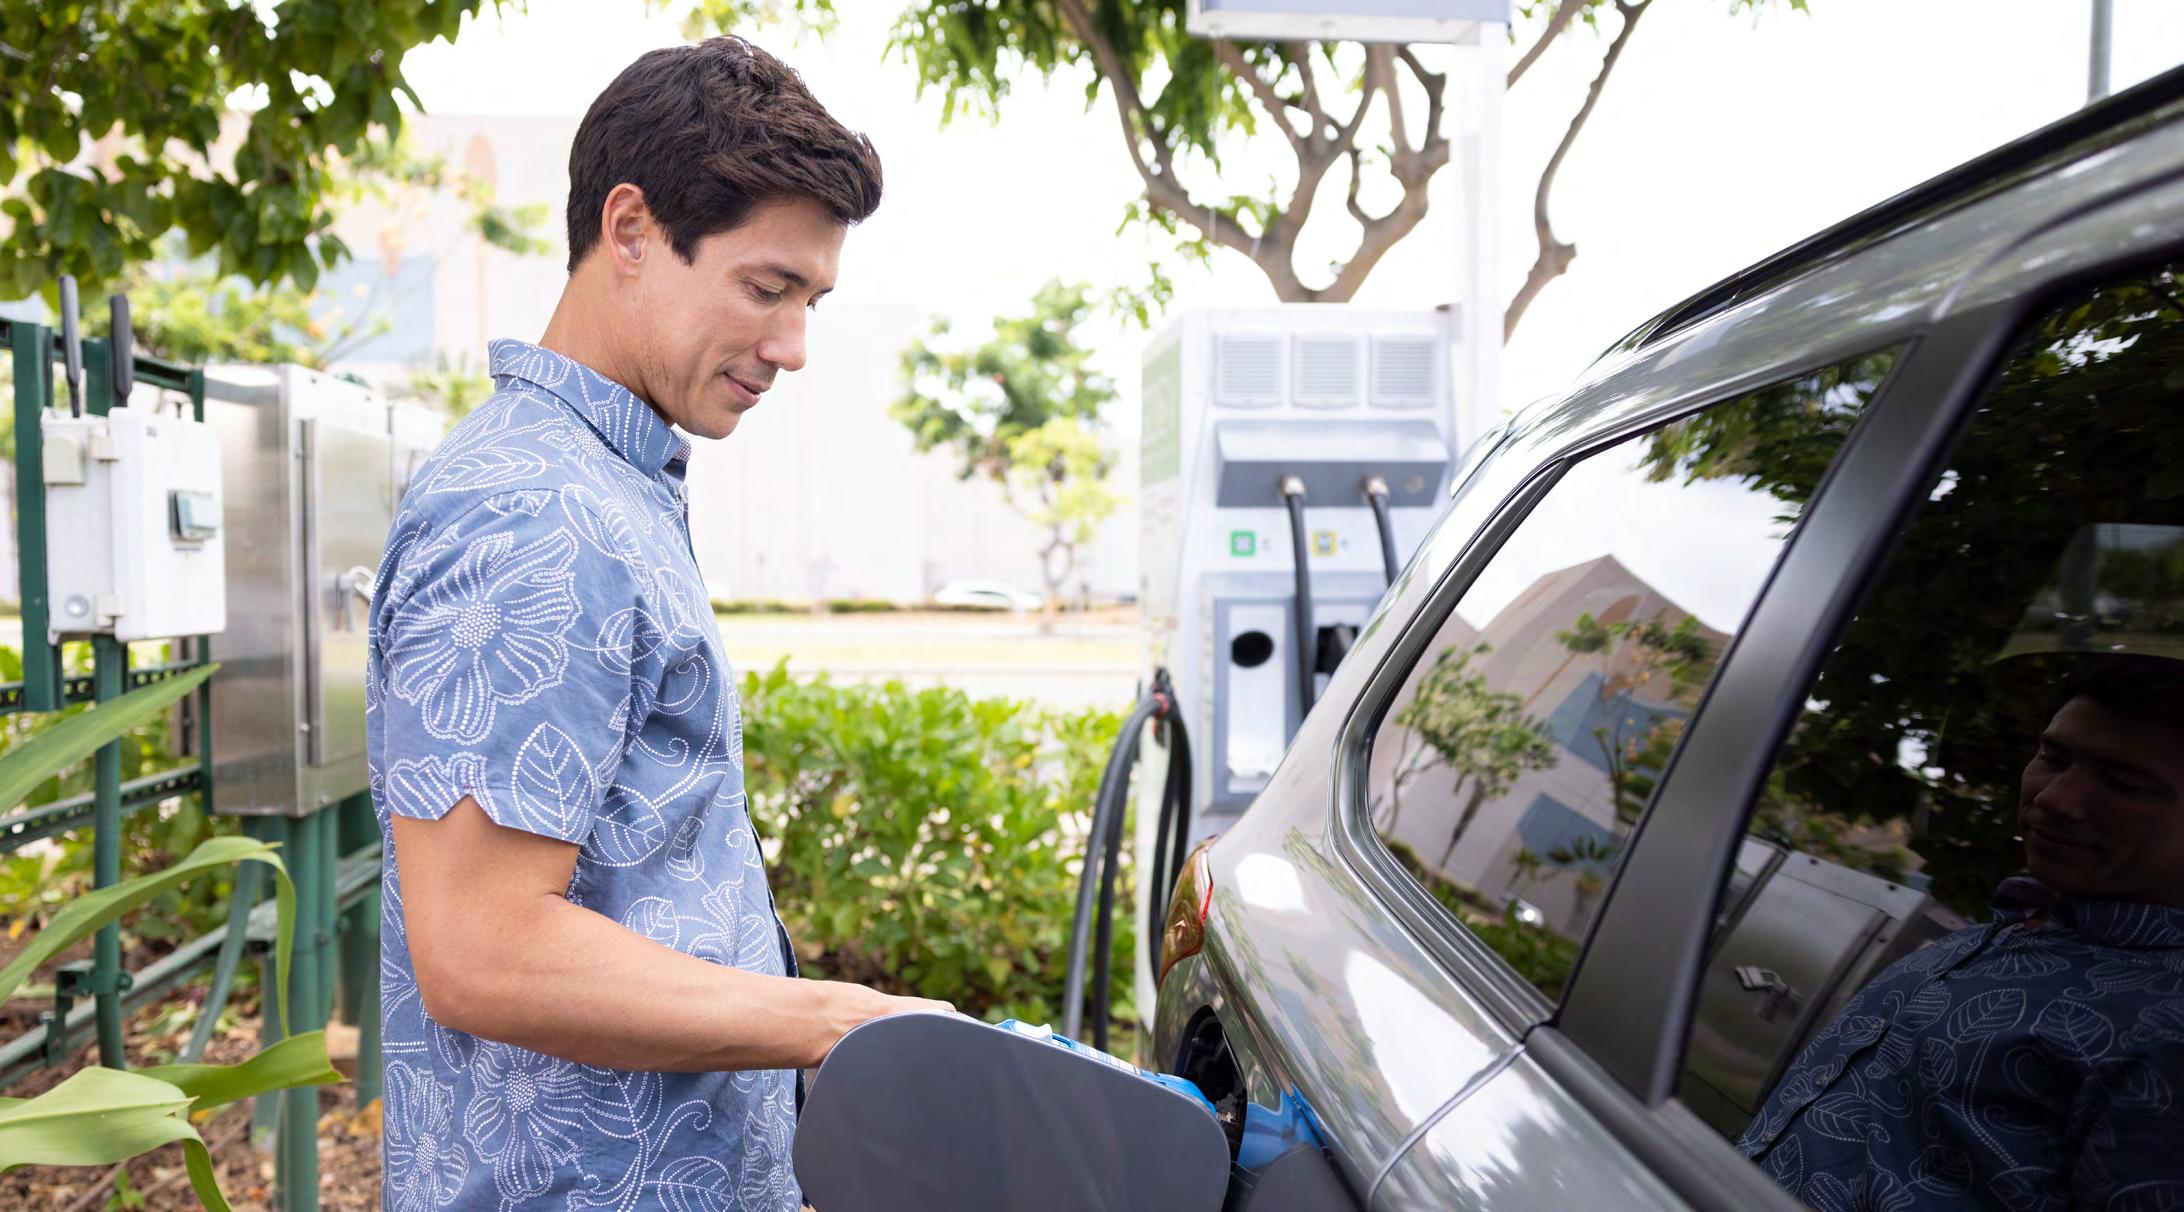
Accelerating Electrification of Transportation (EoT)
Transportation (ground, air and marine) is responsible for over half of Hawai‘i’s energy sector GHG emissions, with ground transportation accounting for the largest portion of transportation emissions.13 Increased renewable energy on our system and the growing market demand for electric vehicles (EVs) allows us to help decarbonize this sector. Hawai‘i has among the highest per capita rates of EVs in the country at 1.7 EVs per 100 passenger vehicles,14 and we expect that to increase at least sevenfold over the next 10 years.15
Electric transportation creates benefits for all customers by putting downward pressure on rates. This beneficial electrification spreads the cost of grid investments over more kilowatthours, reducing the per unit cost for everyone, and can be designed to provide grid services.
1.7 EVs
PER 100 REGISTERED PASSENGER VEHICLES AS OF JANUARY 2022
In 2016, we were founding partners of Drive Electric Hawai‘i, a coalition of public, private and nonprofit partners to promote transportation electrification. Hawaiian Electric’s 2017 EoT Strategic Roadmap set forth our electrification strategy, which includes 10 key initiatives. These initiatives result in three customer facing programs: public charging, EV rates and make-ready infrastructure. To date, Hawaiian Electric offers a network of 25 public DC fast charging stations and rates for public and electric bus charging, with four more public chargers to be installed by the end of 2022 and additional charging stations at existing sites in 2023. The company has proposed to install and operate an additional 150 single-port DC fast charging stations and 150 dual-port charging stations at 75 sites through 2030.
The PUC approved our proposals for pilot projects offering make-ready infrastructure to serve bus operators, multi-unit dwellings, commercial fleets, workplaces and charging hubs and commercial EV rates. We launched our pilot project for bus operators in February 2022 and expect to launch the remaining projects in the second half of 2022. We are leading by example by committing to electrify 100% of our light-duty fleet vehicles by 2035.
67 Decarbonization 1 Economic Health & Affordability 2 Reliability & Resilience 3 Secure Digitalization 4 Diversity, Equity & Inclusion 5 Employee Engagement 6 Climate-Related Risks & Opportunities 7 PRIORITY AREAS
1 2 5
Modernizing Our Grid
Hawaiian Electric is building the grid of the future to reliably support more renewable energy and electric vehicles, and to enable the evolving ways customers generate and consume electricity.
Our Grid Modernization Strategy is designed to empower customers with information to better manage their usage and take advantage of different rates and programs to fit their needs, reduce the number of customers impacted by outages when they occur and provide system operators more visibility and control to manage intermittent renewable energy and improve reliability.
Under Phase 1, we’ve implemented a system to collect and store advanced meter data, delivered an online customer energy portal and are rapidly deploying advanced meters and the enabling telecommunications network. The PUC recently approved an expansion of Phase 1, enabling full deployment of advanced meters across our system with an option for customers to opt out. When approved by the PUC and implemented, Phase 2 is expected to include deployment of field devices such as remote switches and line sensors to automatically respond to grid conditions, and an advanced distribution management system.
ADVANCED METERS BY THE NUMBERS
Data as of March 18, 2022
61,554 METERS INSTALLED
Planning Holistically
118,552 60-DAY ADVANCE NOTIFICATIONS MAILED
13% SERVICE TERRITORY COVERAGE
Our December 2016 Power Supply Improvement Plan (PSIP) Update outlined potential scenarios to meet or exceed the state’s renewable energy milestones. This report laid the groundwork for the renewable energy RFPs we’ve implemented since that time.
In our next phase of long-range planning we’re pursuing a fully integrated planning and procurement process called Integrated Grid Planning (IGP). This approach appraises the total needs of the system — including generation, transmission, distribution and resilience needs — and considers alternatives for meeting those needs (from customer-sited resources, independent providers and the utility), and then selects the lowest cost / best fit solution(s) to operate the grid more reliably and affordably. This process includes planning for resilience and considers potential impacts from climate change. Our IGP process includes in-depth customer and other stakeholder feedback.
Exploring Carbon Offsets and Removal
As the utility executes its Climate Change Action Plan, it is evaluating all potential levers to help achieve Hawai‘i’s carbon neutral to carbon negative economy goal. The company continues analyzing levers beyond its priority focus on emissions reduction, including technologies around carbon removal, sequestration and offsets.
68 HAWAIIAN ELECTRIC AMERICAN SAVINGS BANK PACIFIC CURRENT QUANTITATIVE HEI < CONTENTS
1 3 4 1
1 2 3 4 5 6 7
Our Grid Modernization Strategy is designed to empower customers with information to better manage their usage and take advantage of different rates and programs to fit their needs...”
Empowering Hawai‘i to Thrive, Together


Hawaiian Electric’s strategic priorities are centered on building a stronger Hawai‘i, creating customer value, and strengthening the foundation of the utility. In serving its customers and communities, Hawaiian Electric aims to build long-term value for all stakeholders. The utility intends to:
Drive Hawai‘i’s efforts to diversify the economy, create local job and investment opportunities and reimagine a sustainable and equitable future
Build a modern and resilient portfolio of clean energy assets, including firm and variable generation
Develop a workforce recognized as high-performing, safety-oriented, flexible, diverse and inclusive
Serve as a trusted energy partner by collaborating with customers to provide solutions that are sustainable, affordable, reliable and tailored to create value
Improve financial performance by maximizing efficiency and streamlining operations
BUILD A STRONGER HAWAI‘I
STRENGTHEN COMPANY FOUNDATION

The utility’s ability to thrive through evolution and disruption is ultimately determined by the value it can deliver to its customers. Operating as efficiently as possible improves our overall capabilities while driving customer and community support. Stakeholder support facilitates our ability to develop new solutions and invest in the renewable energy transformation. These areas positively reinforce one another and build a sustainable source of shared value for years to come.

69 Decarbonization 1 Economic Health & Affordability 2 Reliability & Resilience 3 Secure Digitalization 4 Diversity, Equity & Inclusion 5 Employee Engagement 6 Climate-Related Risks & Opportunities 7 PRIORITY AREAS
CREATE CUSTOMER VALUE
Our Environment
Mālama ‘Āina, to care for the land, is the traditional Hawaiian value of sustainability, a way of life that respects, conserves and protects our natural resources for future generations. At Hawaiian Electric we prioritize protecting Hawai‘i’s environment and culture as they are inherent in what makes Hawai‘i special.
Environmental Commitment and Management

More than 30 environmental professionals, including scientists, engineers, chemists and a wildlife biologist, work full-time at our utility to ensure employees and external contractors understand and comply with applicable environmental laws, regulations, permitting requirements and procedures regarding air and water quality, noise control, hazardous materials and protected species.
Critical elements of our programs include year-round risk and opportunities assessment, continuous improvement, compliance management, air and water quality monitoring and extensive training in air quality requirements, spill prevention control and countermeasures, storm water runoff, proper handling and disposal of hazardous materials and protected species awareness and protection. All contractors working at Hawaiian Electric sites are required to attend Contractor Environmental Orientation training conducted by our environmental staff.
70 HAWAIIAN ELECTRIC AMERICAN SAVINGS BANK PACIFIC CURRENT QUANTITATIVE HEI < CONTENTS
Mālama ‘Āina, to care for the land, is the traditional Hawaiian value of sustainability...”
Internal audits are conducted to verify compliance with permits, regulations and policies and support corporate risk management. Our internal audit team audits the Environmental Division at least once every three years. Audit reports are used to create Management Action Plans, ensuring high-risk items are given priority and addressed promptly. The Environmental Division also periodically audits utility facilities to identify areas for improvement.
Reducing Greenhouse Gas (GHG) Emissions
Our strategy for reducing GHG emissions is one and the same as our strategy described earlier in “Our Decarbonization Path.”
As we make this transition, several factors continue to impact our GHG emissions:
By design, our transition includes integrating customer- and third-party-owned renewable resources. Thus, it’s important to look at our generation mix and our GHG emissions on a whole-of-system basis. While more renewable generation and storage resources are being developed, legacy fossil fuel-based generation, some owned by the utility and some owned by IPPs, continues to provide power to meet customer needs and backup power when the sun isn’t shining and the wind isn’t blowing.
Responding to fluctuations in solar and wind power means we must operate our fossil-fueled generation fleet differently than it was designed for, making it less efficient. Operating the generating units at less efficient loads and conditions increases the intensity of GHG emissions from those units.
In addition to our state RPS goals, Hawai‘i regulations required power generators to reduce GHG emissions by at least 16% below 2010 levels by January 1, 2020, and to maintain GHG emissions below that level thereafter. For our owned generation facilities, we achieved a 16% reduction from the 2010 baseline in 2014 and have remained at or below that level since then. Under our Climate Change Action Plan, we are committed to reducing GHG emissions in 2030 by at least 70% below 2005 levels. Based on preliminary data, in 2021 our GHG emissions from our owned generation facilities and independent power producers were 22% lower than our 2005 emissions levels.
The utility includes GHG emissions analyses in its applications to the Hawai‘i PUC for project approvals. Our Environmental Division manages these analyses for all project applications.
Air Quality
Hawai‘i’s air is some of the cleanest in the nation due in part to a lack of heavy industry, relatively low population density, and a year-round temperate climate that brings abundant wind and rain to the islands. In the American Lung Association’s (ALA) 2021 State of the Air Report, Urban Honolulu was ranked #1 on the list of Top Cleanest Cities for Year-Round Particle Pollution, with Kahului-Wailuku-Lahaina on Maui coming in at #2. Year over year, Urban Honolulu is among the top five cleanest U.S. cities to live in with respect to low levels of air pollution.
Under the Clean Air Act, we’re focused on maintaining compliance with key regulations including the National Ambient Air Quality Standards (NAAQS), State Ambient Air Quality Standards (SAAQS), New Source Review / Prevention of Significant Deterioration, Mercury and Air Toxics Standard (MATS) and many others.
West O‘ahu Air Monitoring Network
As part of a commitment to the West O‘ahu community for the development of the Campbell Industrial Park (CIP) Generating Station, we voluntarily installed monitoring stations to measure the daily Air Quality Index in the area. Near real-time data for several air quality parameters, including SO2, O3, CO, PM10, PM2.5 and NO2, are available on www.westoahuair.com.
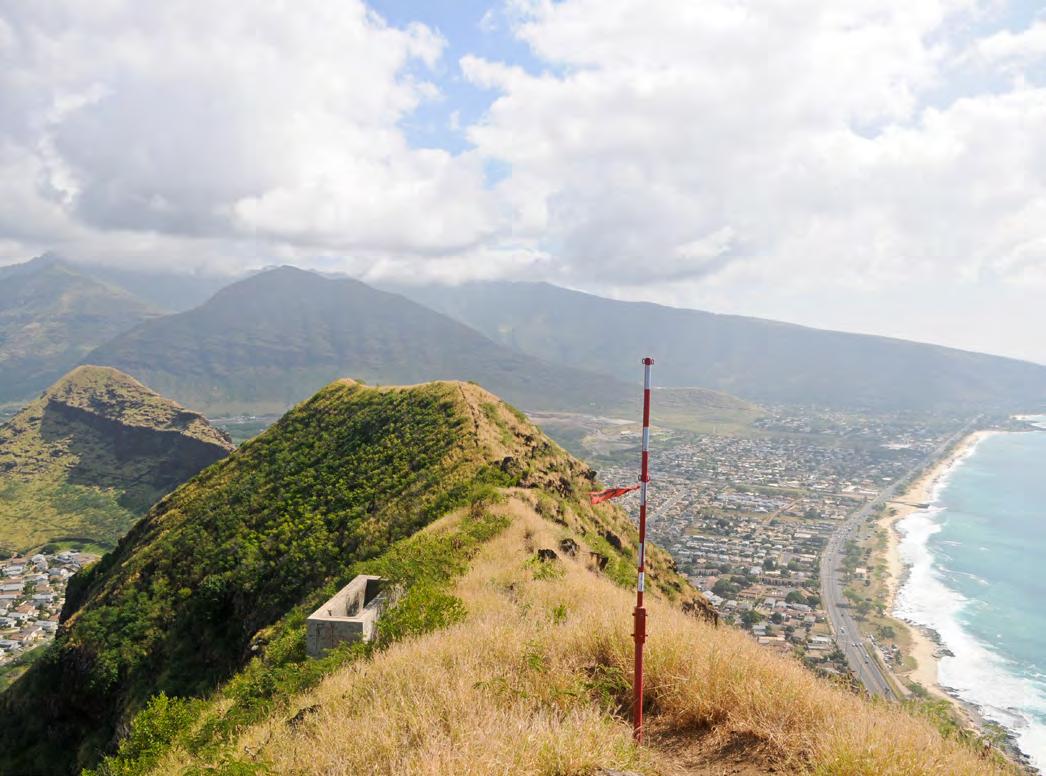
71 Decarbonization 1 Economic Health & Affordability 2 Reliability & Resilience 3 Secure Digitalization 4 Diversity, Equity & Inclusion 5 Employee Engagement 6 Climate-Related Risks & Opportunities 7 PRIORITY AREAS
1
Water Management
Hawai‘i, as an island state, is surrounded by the ocean. Natural fresh water is limited and the water cycle is a delicate balancing act between ocean water, evaporation, trade winds and precipitation. The ahupua‘a, or land division from the mountain to the sea, encompasses the watershed, rainforest, streams and groundwater. Sustaining these ecological climates is the kuleana, responsibility, of all who live here as they serve as natural water catchment, collection and storage systems for the islands’ rainfall.
At Hawaiian Electric, water plays a critical role in the generation of reliable, affordable power. We understand the vital need to conserve and protect our water resources, and for the most part use water from non-potable sources – mainly ocean water and brackish water wells – at our facilities.
For example, at our Kahe Power Plant and Campbell Industrial Park Generating Station in West O‘ahu, we minimize potable water for electricity generation by using sea water for cooling and reverse osmosis water from the Honouliuli Wastewater Treatment Plant for industrial purposes. The use of these nonpotable water sources offsets the demand for higher-quality water and reduces water supply risk.
Over 99% of the water we use in our once-through cooling systems is later returned to groundwater or surface/seawater. The less than 1% of the water consumed during power generation is primarily used in air emissions control systems and is not from fresh water or sea water sources.
As we add more clean, renewable energy to our system, such as solar-plus-battery storage and stand-alone battery storage, these projects will further minimize our environmental footprint as they do not need water resources to operate, thus optimizing both our resource efficiency and financial performance.
Waste Management
We focus on managing waste streams in accordance with local, state and federal regulations. We do not have any nuclear facilities and do not have any nuclear waste.
We implemented a Hazardous Waste Minimization Plan to reduce the volume of hazardous waste generated. The company facilities are typically categorized as either a very small or small quantity generator of hazardous waste as our operations generate fairly low amounts. In 2021, a total of 6,227 pounds was generated from maintenance and repair projects, which vary every year. If hazardous waste is generated, it is placed in designated areas
where it is safely stored, inventoried and inspected for leaks while awaiting timely disposal. We hire qualified hazardous waste shipping contractors to transport the waste to EPA-permitted treatment, storage and disposal facilities.
A prime example of our waste minimization strategy is the recycling of used oil for energy recovery. Used oil is one of the highest-volume industrial wastes produced by Hawaiian Electric’s facilities. Since the used oil has appreciable heat content, a number of our facilities are permitted to burn the used oil for energy recovery.
Protecting Hawai‘i’s Unique Biodiversity
Hawai‘i is home to many species of plants and animals found nowhere else in the world. For centuries, these species evolved and thrived free of predators, invasive species, habitat loss, or climate change. Today, many of Hawai‘i’s native, endemic species are threatened.
Save our Seabirds
Since 2007, Hawaiian Electric’s Maui County operations has partnered with the Hawai‘i Department of Land and Natural Resources Division of Forestry and Wildlife, National Park Service, Maui Nui Seabird Recovery Project, County of Maui and other businesses to help protect federal and state protected birds under the Save our Seabirds program. The main goals of the collaborative effort are to increase public awareness and mitigate impacts to seabirds on Maui, Lāna‘i and Moloka‘i. In addition to funding the design, print and distribution of the “Save our Seabirds” brochure, which provides information on common Maui Nui seabirds and helpful seabird recovery tips, Hawaiian Electric also supports their radio ads, theater billboards and educational outreach promoting the message.

72 HAWAIIAN ELECTRIC AMERICAN SAVINGS BANK PACIFIC CURRENT QUANTITATIVE HEI < CONTENTS
Our environmental stewardship efforts serve both to protect such species and minimize risk. Our Protected Species Program, under the guidance of a wildlife biologist, proactively works to minimize potential impacts our operations may have on protected species. Elements include awareness and training, design standards and guidelines, protocols for protected species interactions and partnerships with agencies to support predator control programs, native habitat conservation and restoration, species recovery and rehabilitation and public education.
We use Geographic Information System (GIS) mapping to show where known populations and historic distributions of protected species are located. This system guides our engineers in identifying risks when planning a project and triggers the involvement of an environmental representative if a proposed project falls within any known biological or culturally sensitive area.
Avian Protection
Our avian protection efforts include installing bird-friendly lighting or shielded fixtures at our power plants and substations to minimize onshore lighting that could distract seabirds during their nocturnal feeding. Operations employees who may come in contact with downed birds at our facilities or job sites receive training and bird recovery kits to transport birds to a rehabilitation facility.
Hawaiian Hoary Bat
To protect the endangered Hawaiian Hoary Bat, or ‘ōpe‘ape‘a, we developed detection protocols, including the use of thermal imaging devices, to minimize impact on bats while conducting vegetation management activities during the critical pupping season. No bats were detected in the species of trees trimmed within the utility corridors during five years of data collection. We also conduct acoustic monitoring at known roosting locations to identify risks near existing or planned infrastructure.
Sustained Fish Monitoring
Since the 1970s we’ve conducted marine monitoring along the leeward shores of O‘ahu to study the effects of warm water discharge from our Kahe Power Plant on coral, sand movement, water temperature and fish communities. Earlier studies demonstrated that storms in 1980 and hurricanes in 1982 and 1992 were the major sources of impact to marine communities rather than our Kahe plant operations. In the 2021 study, researchers found no significant changes that can be attributed to the Kahe Power Plant or our newer Campbell Industrial Park Generating Station.
Our Environmental Commitment
Our Code of Conduct instructs all employees and contractors to adhere to our environmental commitment, which includes:
Maintaining a robust environmental management system, including assigned roles and responsibilities for environmental management
Monitoring our environmental performance and regular reporting on our environmental management
Ensuring environmental training for all relevant employees
Consulting with stakeholders on environmental issues
Preparing for and responding to any emergency that might impact the environment
Our Environmental Principles and Compliance Policy acknowledges our company’s environmental responsibilities, and outlines principles for our employees including:

Protecting and minimizing the company’s impact on Hawai‘i’s unique historic and cultural heritage and environmental resources
Promoting the efficient use of energy and conserving natural resources
Direct accountability of executive leadership for environmental compliance and stewardship within their respective areas
73 Decarbonization 1 Economic Health & Affordability 2 Reliability & Resilience 3 Secure Digitalization 4 Diversity, Equity & Inclusion 5 Employee Engagement 6 Climate-Related Risks & Opportunities 7 PRIORITY AREAS
Volunteer Initiatives
In 2021 our Environmental Division marked 50 years, a milestone that signifies the critical importance of environmental conservation and stewardship to Hawaiian Electric. Beyond its work on environmental compliance, the division diligently works to protect Hawai‘i’s unique environment through volunteer initiatives that help improve air and water quality in communities, restore green spaces and valuable watersheds and protect native species and their critical habitats.
For more than 25 years, the division led an annual volunteer beach cleanup with more than 100 employees and their families collecting and bagging trash at Kahe Beach Park in West O‘ahu. The effort, part of the Ocean Conservancy’s International Coastal Cleanup, also raised awareness of keeping Hawai‘i’s beaches plastic and trash free while promoting ocean health.
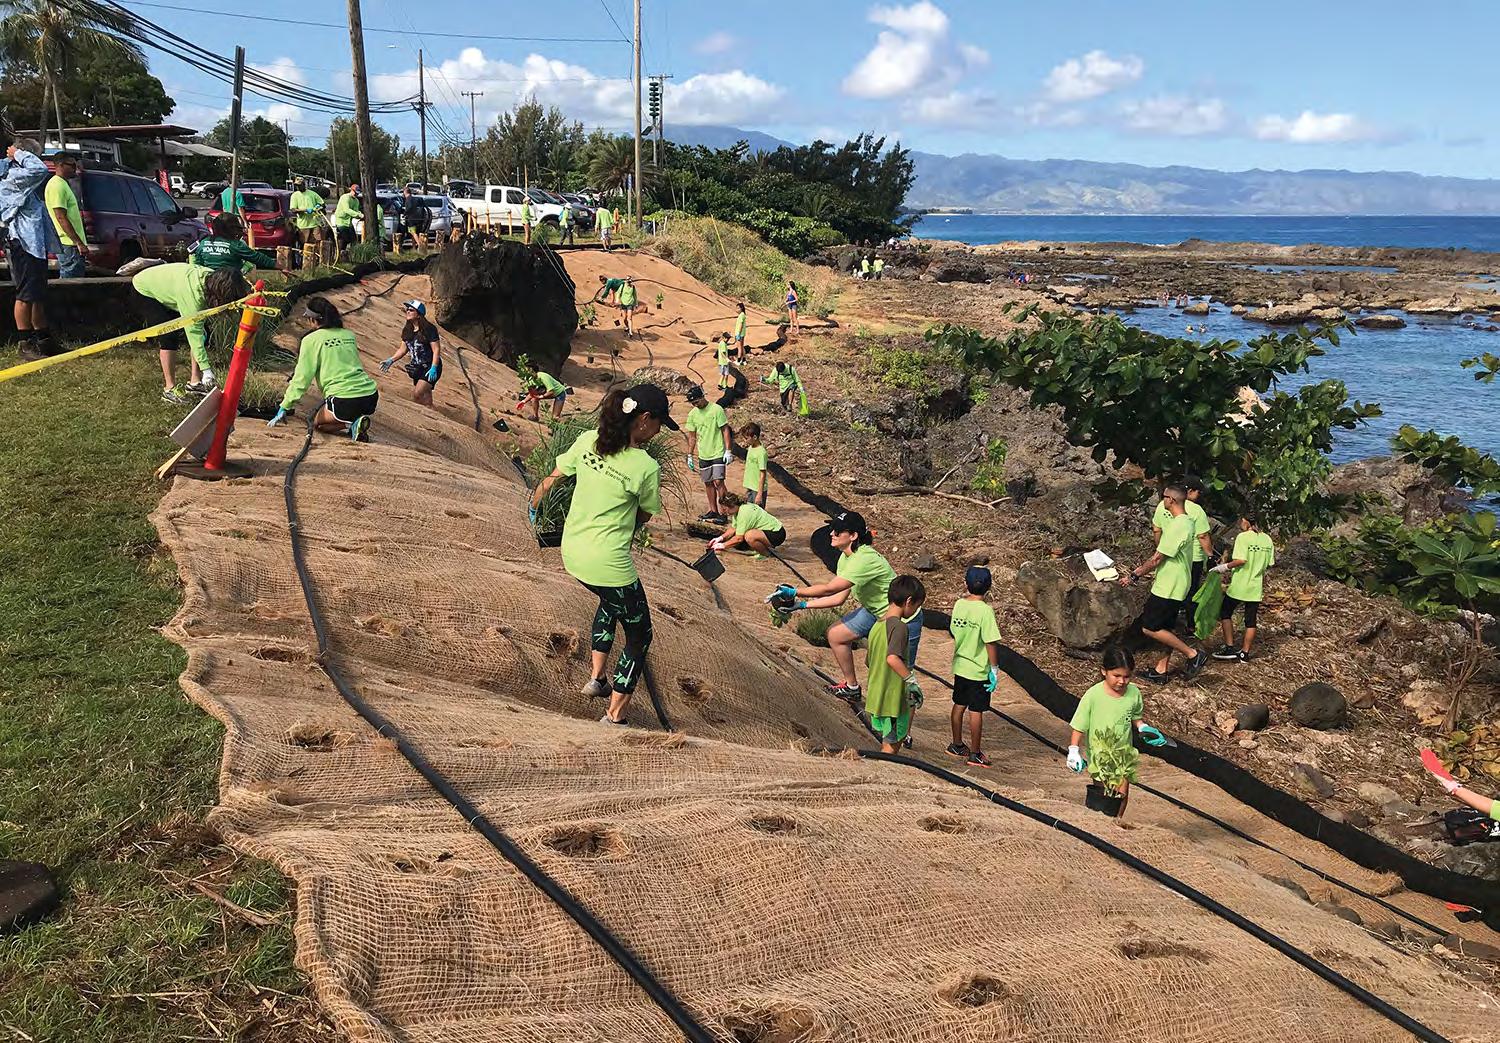
As part of a citizen science project with Hui Manu-o-Kū, our environmental scientists volunteer to help document and support conservation of the white tern, a native seabird that has defied the odds to thrive in urban Honolulu, which is one of the state’s busiest metropolitan areas.
Other projects include removing invasive species at Kānewai Springs, stream cleanups at Mānoa Stream, native tree plantings at Pālehua and Ulupō Nui and raising native plant seedlings to help reforest Pia Valley in East O‘ahu.
74 HAWAIIAN ELECTRIC AMERICAN SAVINGS BANK PACIFIC CURRENT QUANTITATIVE HEI < CONTENTS
Reliability and Resilience
We know the important role electricity plays in the lives of our customers and communities. From ensuring businesses and essential services can operate effectively, to providing comfort at home during the hottest of days, we work to provide power when it’s needed. We are constantly looking for ways to improve and strengthen our grid to deliver the reliability our customers expect, prepare for severe weather and other events, recover from any disruptions quickly and safely and minimize impacts to our customers.
Managing Reliability and Resilience Enhancing Resilience
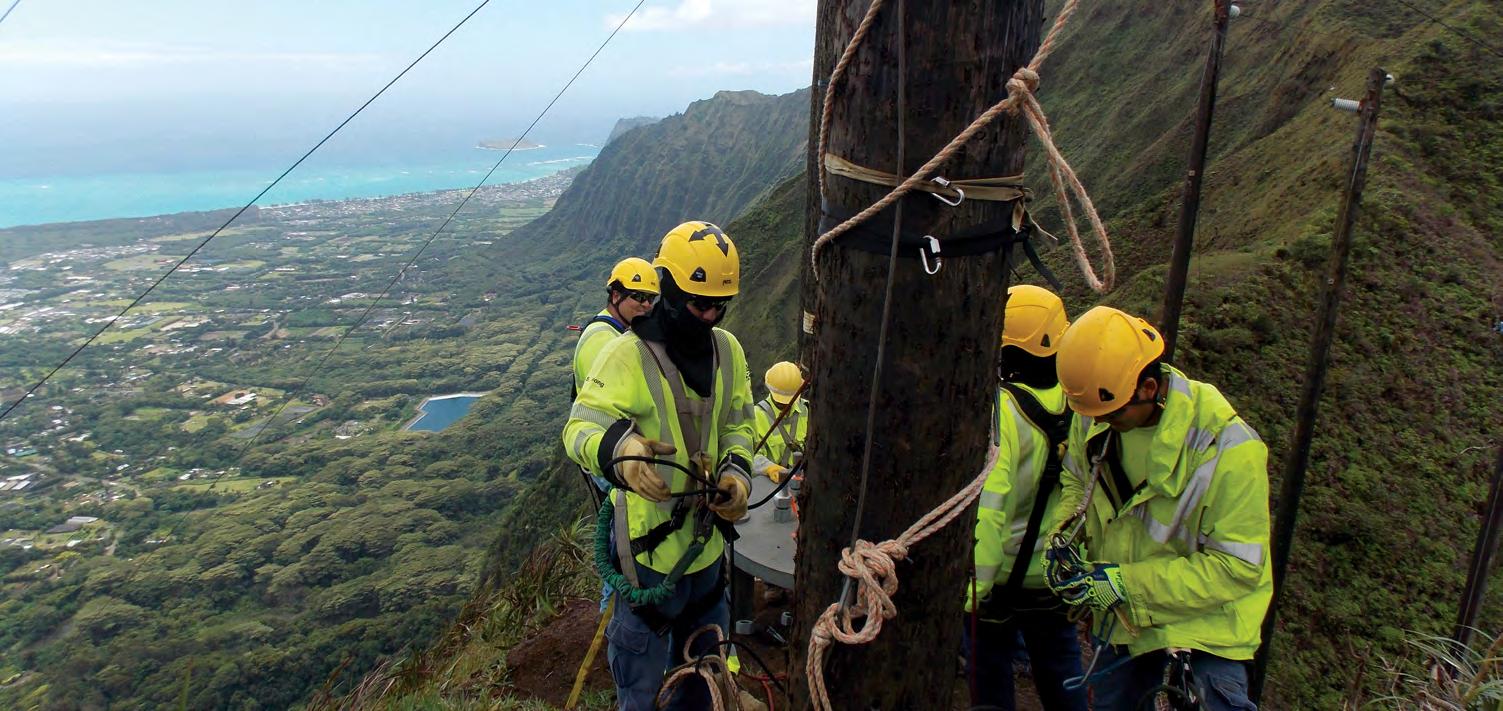
We are focused on ensuring the resilience of our system. Our efforts include:
Using advanced climate risk modeling to assess risks and inform our planning process
Deploying advanced meters and other technologies that allow us to respond more quickly to system interruptions
Developing damage prediction modeling to estimate damage and outages from severe natural event scenarios in order to support resilience planning efforts
Developing plans for community microgrids and/or critical customer hubs to be able to quickly restore power to critical customers
Building more modern and efficient power plants inland, away from the coastline. An example is the Schofield Generating Station, which was completed and brought online in 2018. The biofuel-capable generating facility is located on military property inland at a higher elevation. It can be isolated to serve the military base and other critical facilities in the event of an emergency, and feeds electricity to the grid that serves all O‘ahu customers the rest of the time.
Collaborating with key partners, such as the military, to supply energy to customers during an emergency
Engaging with stakeholders to incorporate resilience needs and priorities through our Integrated Grid Planning process, including its Resilience Working Group
75 Decarbonization 1 Economic Health & Affordability 2 Reliability & Resilience 3 Secure Digitalization 4 Diversity, Equity & Inclusion 5 Employee Engagement 6 Climate-Related Risks & Opportunities 7 PRIORITY AREAS
3 7
We are constantly looking for ways to improve and strengthen our grid to deliver the reliability our customers expect...”
As an island utility, we’re not connected to a large system of interconnected generation facilities like U.S. mainland utilities, nor are our individual islands interconnected. This means each island must independently provide high levels of reliability, and we must plan carefully to ensure resilience.
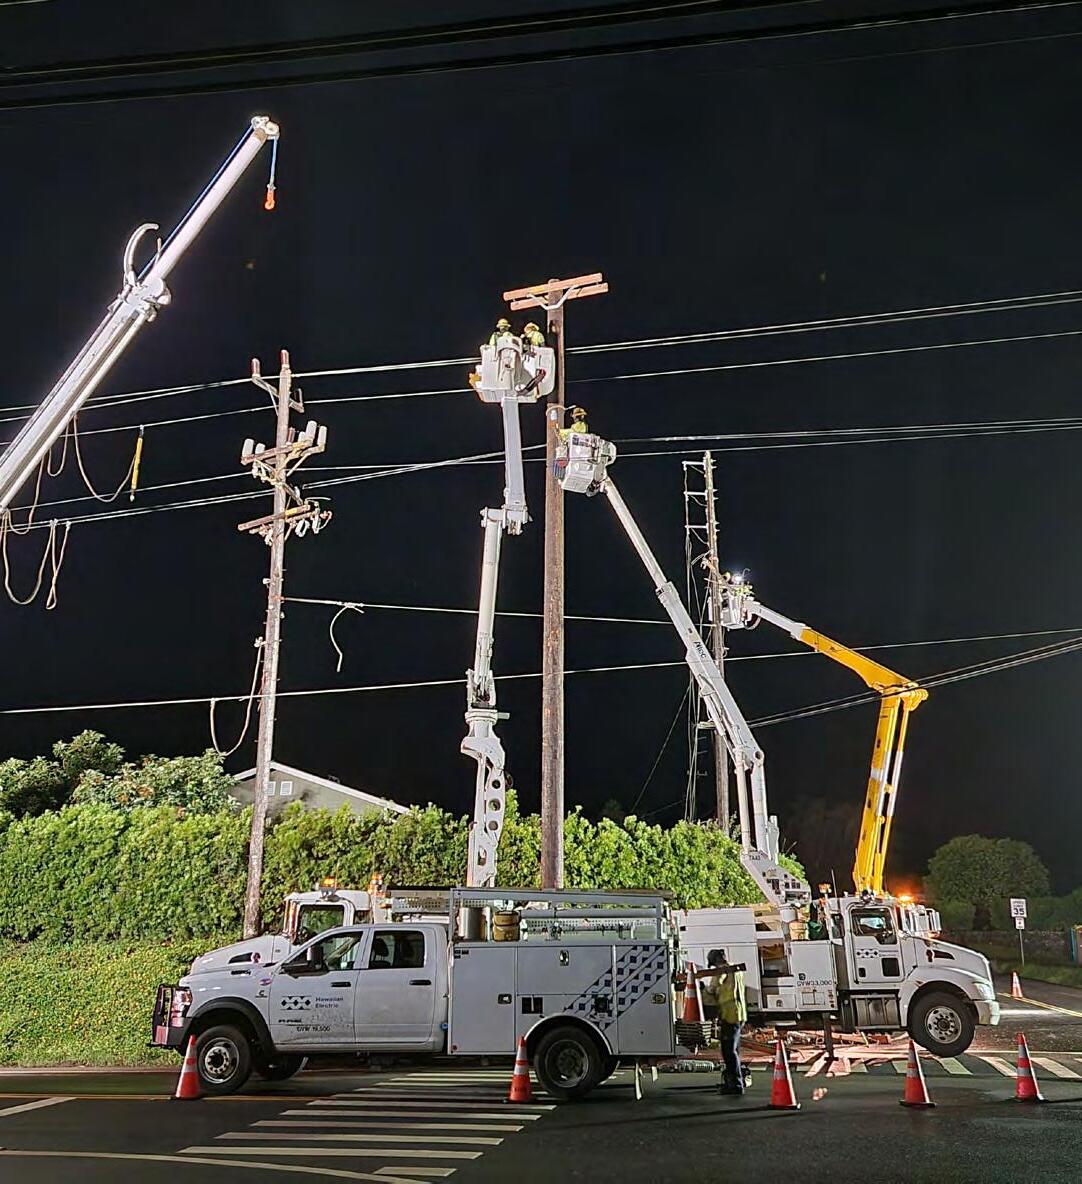
We continually maintain and upgrade our transmission and distribution system to ensure seamless delivery of power to our customers. Day-to-day maintenance is a key part of keeping the grid resilient. We regularly inspect our poles, lines, and other equipment, and work to replace and upgrade aging and faulty equipment before failures happen. We regularly trim the vegetation around our equipment, as many power outages during high winds and storms are due to tree branches or other vegetation falling onto power lines. We have also replaced traditional power lines with insulated conductor systems to improve reliability and resilience in targeted areas prone to vegetation-related outages.
We’re working to reduce the impact of outages by adding devices to section off parts of the grid to reduce the number of customers affected by an outage. We have also completed distribution protection studies to improve safety and mitigate risk on each of the five islands we serve. We measure and report reliability performance using metrics commonly used in the electric utility industry regarding the duration and frequency of power interruptions for customers.
Both the company (through performance incentives) and executives (through executive compensation goals) have financial incentives to promote strong reliability performance.
We are working on a multi-year plan and PUC application focused on foundational investments in transmission and distribution system resilience. Our proposed plan will include:
Strengthening our most critical transmission lines to withstand extreme winds
Hardening distribution lines serving critical community lifeline facilities such as hospitals, military sites, communications infrastructure, water and wastewater facilities, ports and emergency response facilities
Upgrading specific poles to improve restoration after a storm or hurricane
Moving lines underground in targeted areas prone to vegetation-related damage
Removing large trees that are at risk of falling into lines during a storm
Strengthening lines and deploying devices to help prevent and respond to wildfires
Installing equipment in select substations to reduce flood impacts
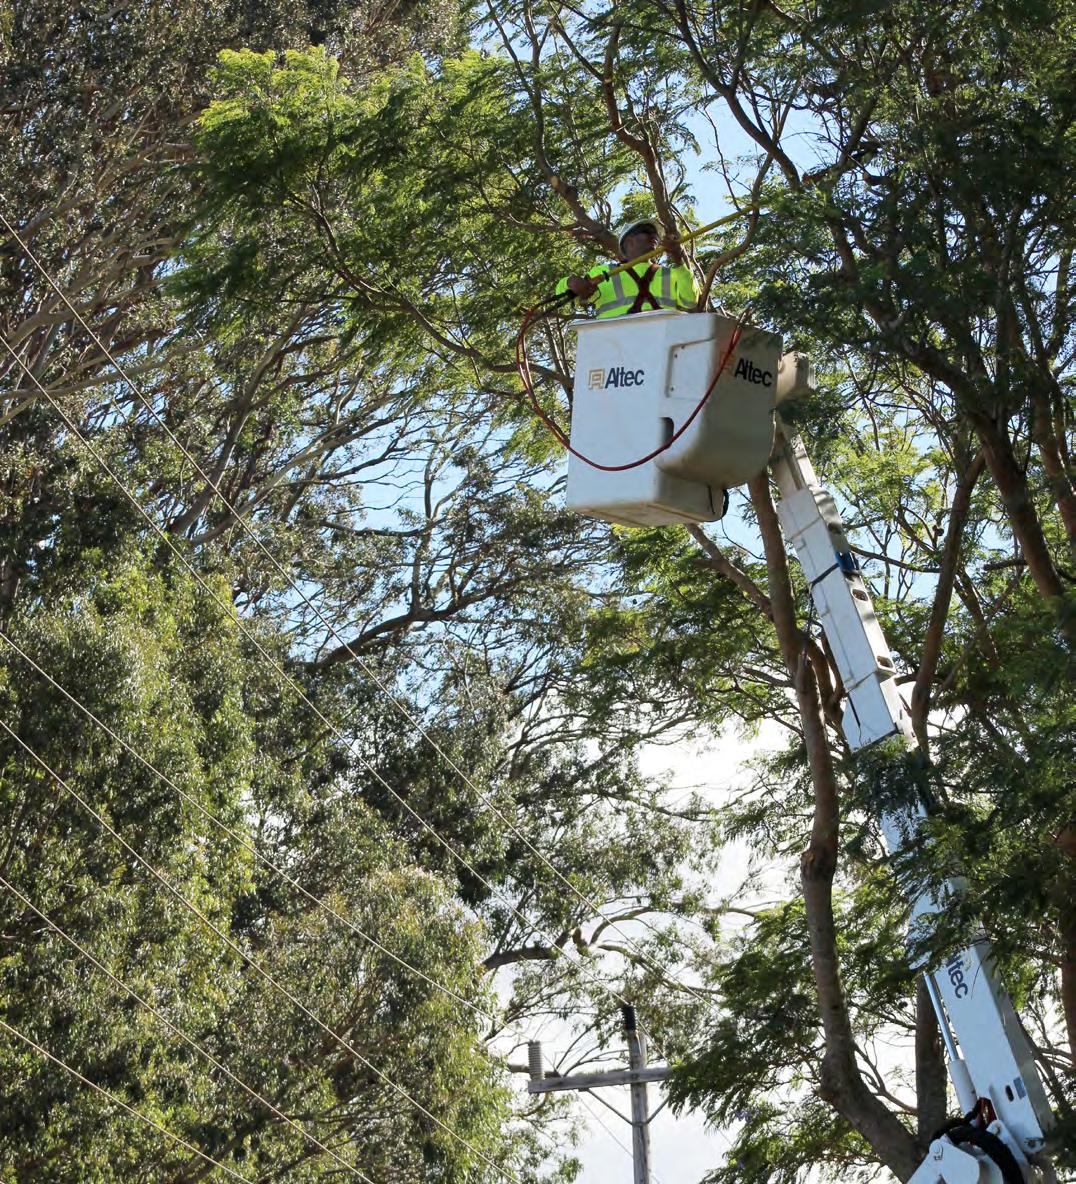
76 HAWAIIAN ELECTRIC AMERICAN SAVINGS BANK PACIFIC CURRENT QUANTITATIVE HEI < CONTENTS
Ensuring Grid Reliability


As we work to build a more resilient grid and add more variable generation such as solar and wind, it’s critical that we maintain grid reliability and stability. This requires modernization of our “firm” thermal generation fleet to increase operational flexibility and to be available during storms and cloudy, windless days. We also will need new, non-traditional grid solutions to provide limited duration capacity and fast frequency response to maintain system stability.
In addition, battery storage can provide rapid response to unexpected events such as a sudden drop in energy production, improving reliability and reducing likelihood of outages. On O‘ahu, the approved Kapolei Energy Storage 185 MW IPP battery energy storage (BESS) project will provide 50 MW of fast frequency response and is expected to be operational within the next year. If approved by the PUC, our proposed 12 MW BESS project at Keāhole on Hawai‘i Island and our proposed 40 MW Waena BESS project on Maui will will provide additional resources for those islands.
Emergency Preparedness


Being in the middle of the Pacific Ocean heightens the need for Hawaiian Electric to be prepared for disasters to limit damage and hasten recovery.
We work closely with state emergency management officials and county agencies to develop disaster plans and practice disaster response. Our employees are trained to utilize the National Incident Management System (NIMS) framework for disaster response and recovery. Our Electrical Service Restoration (ESRP), Cyber & Physical Security and COVID-19 Pandemic Emergency Management plans detail recovery activities for specific situations.
We maintain strong relationships with other utilities, transportation companies and contractors — both locally and nationally — to help speed recovery. We’re also a member of the Western Region Mutual Assistance Group, which enables us to gain insight into best practices. These partnerships help us secure labor and/or material resources in the event of a disaster.
Our ESRP outlines processes to prepare for and respond to emergencies, such as earthquakes, flooding, hurricanes and volcanic eruptions, so we can restore service to customers safely and efficiently. We conduct ESRP training annually, including practicing emergency scenarios through drills and tabletop exercises.
Where a potential outage incident is identifiable ahead of time, we inform employees, customers, mutual aid partners and other stakeholders in advance, advise them on our preparations and share ways customers can prepare, using a range of communications tools, including media outreach, online and social media.
We have publicly disclosed our emergency outage and response times since 2015. Our emergency response time metric measures the average time it takes to respond to an emergency event, such as energized lines down, downed poles or motor vehicle accidents involving utility equipment that result in lane closures.
Our Handbook for Emergency Preparedness is designed to help customers plan for emergencies. It is available in several languages and provides information on emergency supplies, evacuation plans and how to minimize inconveniences and dangers in emergencies.

77 Decarbonization 1 Economic Health & Affordability 2 Reliability & Resilience 3 Secure Digitalization 4 Diversity, Equity & Inclusion 5 Employee Engagement 6 Climate-Related Risks & Opportunities 7 PRIORITY AREAS
Read our Handbook for Emergency Preparedness Emergency Preparedness Be prepared Be informed Handbook For
We maintain strong relationships with other utilities, transportation companies and contractors... to help speed recovery.”
Promoting Community Resilience
We have led a series of community resilience-based workshops for the Ko‘olaupoko region of O‘ahu, a community that receives all of its electricity from transmission lines that cross the Ko‘olau mountain range and is thus vulnerable to outages in the event of a major disaster. The workshops drew community and government leaders together in a collaborative process to identify actions to strengthen the region’s resilience.
Secure Digitalization

Cybersecurity is consistently recognized as one of the top risks facing the electric utility industry. As digitalization of our operations increases, ensuring cybersecurity of our system and customer data is of increasing importance. We apply a disciplined risk management approach based on industry standards and best practices, prioritizing our investments and resources to protect our most critical assets and sensitive data.
We engage with local, state and federal agencies, utility peers and experts to share threat information and best practices, perform tests and assessments and conduct cybersecurity exercises. We also participate in mutual assistance programs including the Cyber Mutual Assistance Program, the Cybersecurity Risk Information Sharing Program and the Electricity Information Sharing and Analysis Center. Our customer and community outreach efforts include awareness campaigns via television, radio and social media. Internally, we promote a strong cybersecurity culture through email phishing tests, cyber awareness campaigns and annual training.
Wildfire Prevention & Mitigation
Episodic drought, a warming climate and the expansion of nonnative fire-prone grasses and shrubs has led to an increase in wildfires in Hawai‘i. 98% of wildfires in Hawai‘i are human caused17 and the threat to communities is high year-round. In addition to the utility’s own wildfire mitigation plans, we have joined with community members and wildfire collaborators to help prevent and mitigate wildfires in known hot spots across our service areas. As members of the Wai‘anae Wildfire Hui in West O‘ahu and Pacific Fire Exchange on Maui, we meet monthly to share ideas and discuss priority projects. We support the Hawai‘i Wildfire Management Organization on Hawai‘i Island, which works with communities across the state on wildfire planning, prevention and mitigation activities. By raising awareness, implementing key land management practices and collaborating on projects, these organizations are working to reduce the wildfire risk in Hawai‘i and build strong, resilient communities.
We continue to increase our cyber resilience and strengthen our protection, detection and response capabilities across people, processes and technology to defend our networks, our customers and our grid. The enterprise cybersecurity and business continuity programs prescribe a comprehensive set of governance, management, operational and technical controls aligned to an industry-standard framework and tailored to address our unique risk profile. Controls are continuously monitored for effectiveness, with tracking of key performance indicators. These metrics are presented to the Board of Directors and the Board Audit and Risk Committee each quarter.
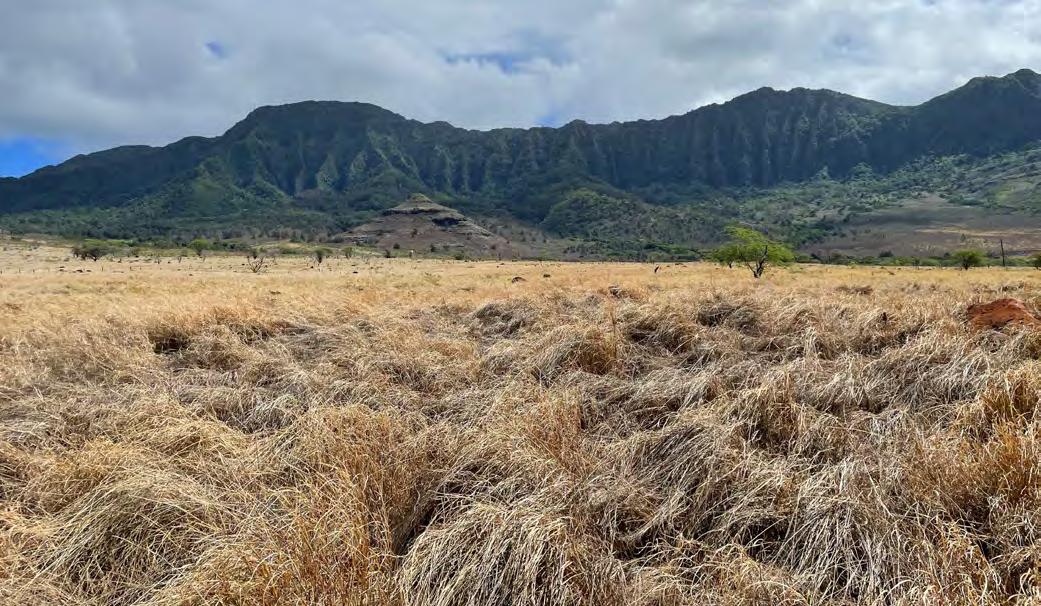
78 HAWAIIAN ELECTRIC AMERICAN SAVINGS BANK PACIFIC CURRENT QUANTITATIVE HEI < CONTENTS
4
Our Customers
We are deeply rooted in our communities and take pride in serving our customers, our extended ‘ohana (family). Our primary customer service goal is to create positive and meaningful experiences, making it easy to do business with us. We understand that addressing the needs of our customers is key to delivering value, and our strategy relies on continuous evaluation and improvement so we can evolve as a customer-centric, community-focused organization.
Energy Affordability
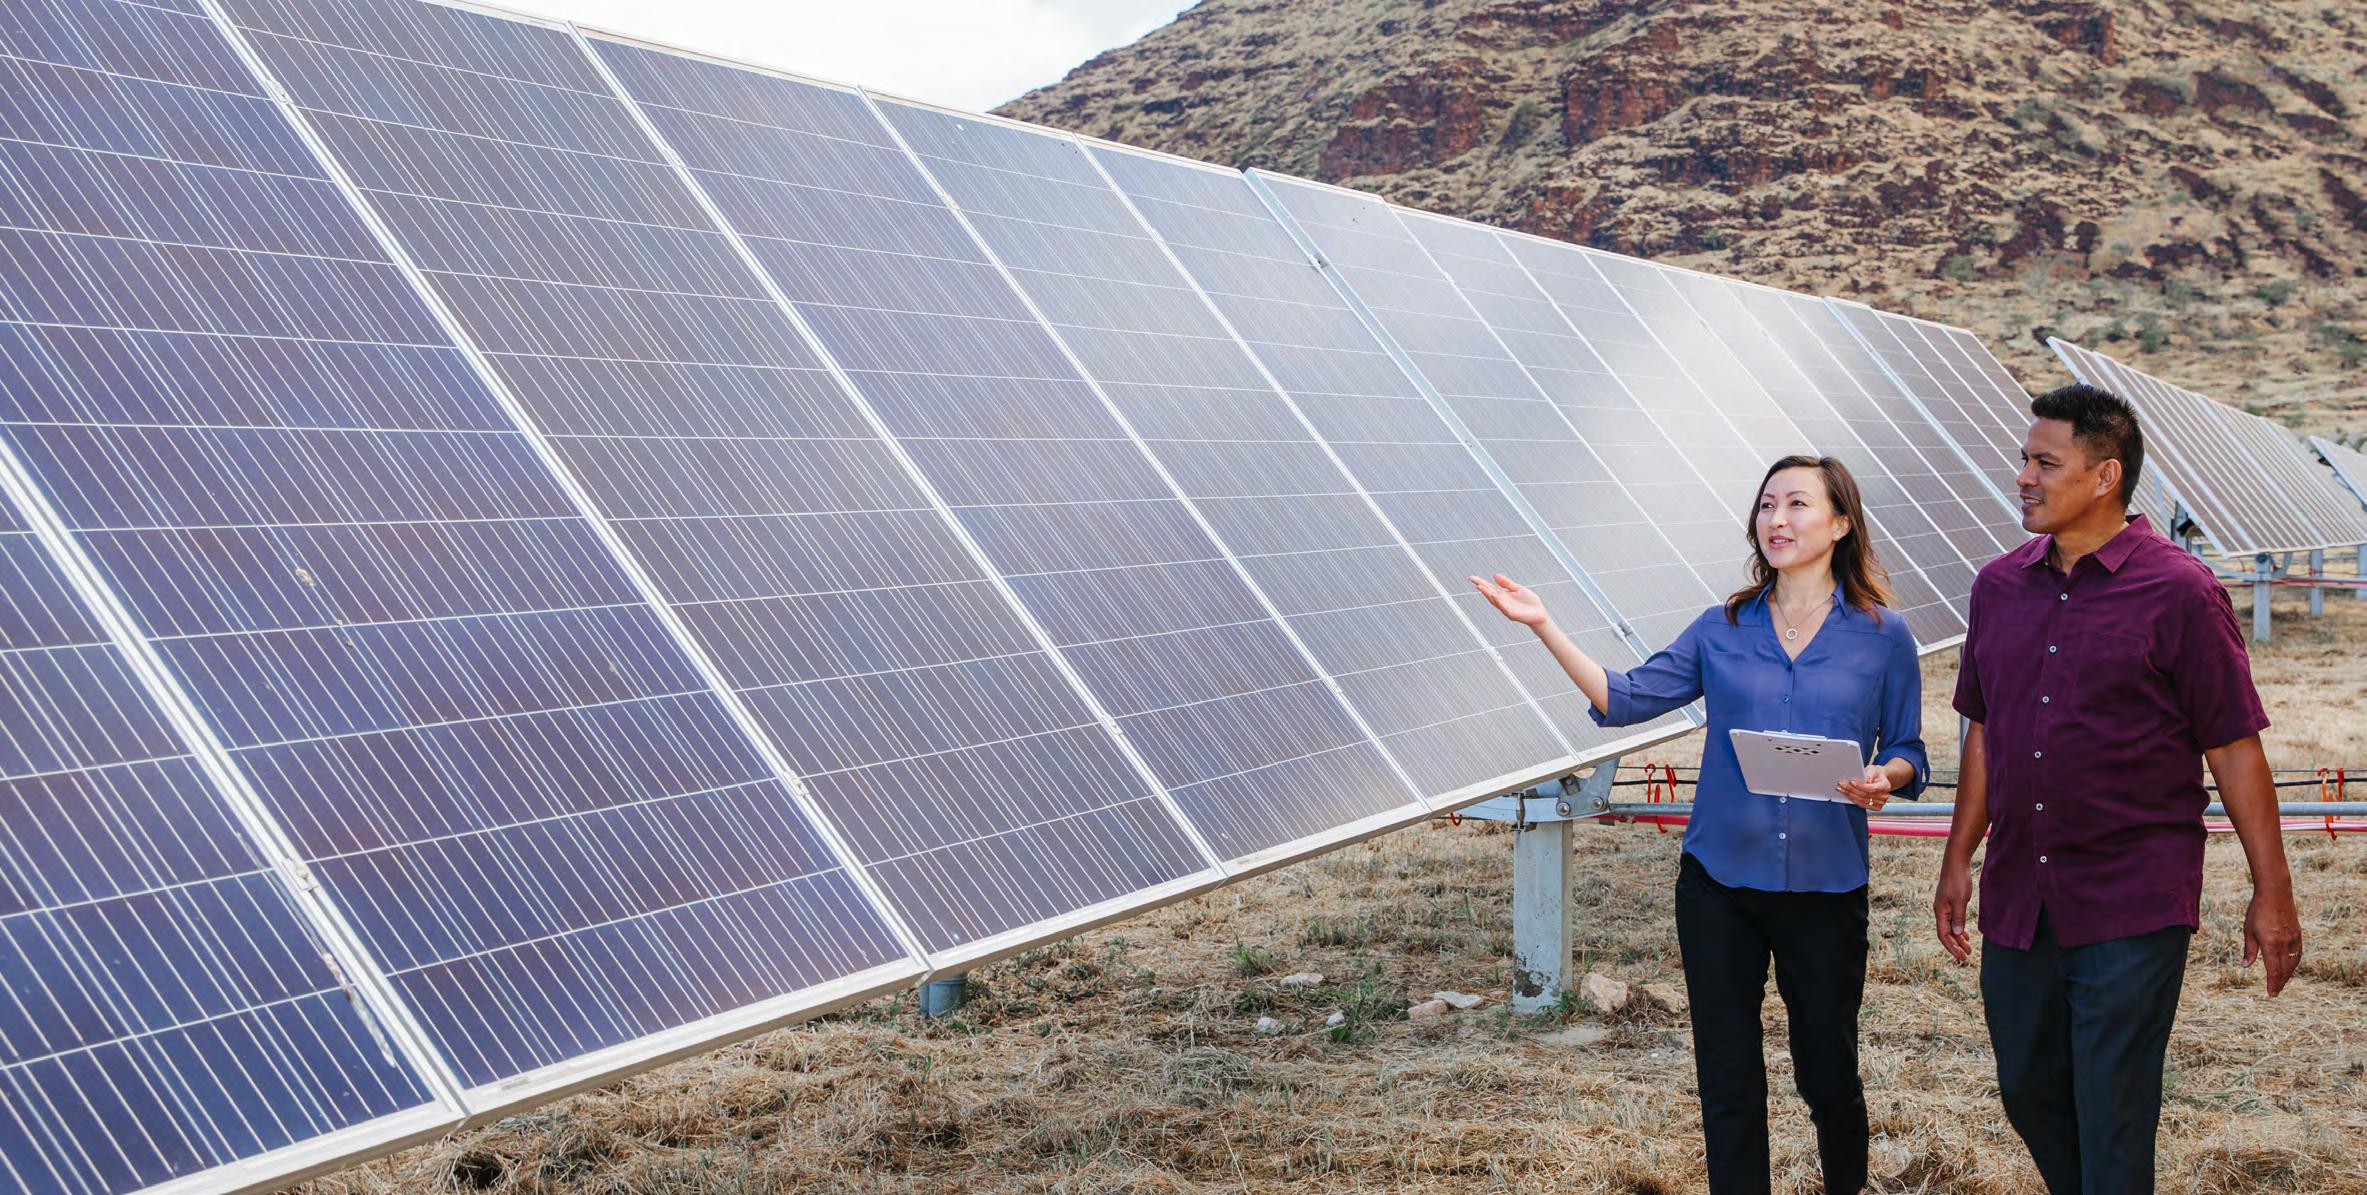
Energy affordability is a key priority for us given the high cost of living in our state. With limited land, real estate values are high. Almost all materials and goods must be shipped into the state. These factors increase the cost of everything from housing to groceries. According to the U.S. Bureau of Economic Analysis, in 2020 Hawai‘i had the country’s highest “all items regional price parity,” a measure of cost of living that reflects the price of goods and services, such as food, transportation and education, as well as housing rents, compared to a national baseline price level.
Electricity prices in Hawai‘i are among the highest in the nation,16 due in part to the cost of imported oil used to power many of the islands’ generators. In 2021, oil-driven cost components (fuel, purchased energy from fossil fuels, and revenue taxes) comprised approximately 47% of a typical residential bill for a customer on O‘ahu. Our isolated geographic location also contributes to the higher cost of electricity. Each island grid must operate a stand-alone system, unable to draw power from other islands or the mainland if needed. As such, system reliability requires that we have reserve generating capacity and multiple distribution routes.
79 Decarbonization 1 Economic Health & Affordability 2 Reliability & Resilience 3 Secure Digitalization 4 Diversity, Equity & Inclusion 5 Employee Engagement 6 Climate-Related Risks & Opportunities 7 PRIORITY AREAS
2 5
Our primary customer service goal is to create positive and meaningful experiences...”
Increasing Efficiency and Delivering Savings
In 2021, we delivered $8 million in customer savings through efficiency and productivity measures while also advancing our climate change action plan. Continuing to manage costs will remain a central focus as we operate under the new Performance Based Regulation (PBR) framework. We continue to identify and execute on efforts that reduce costs, through improved planning and scheduling of work, process improvement initiatives, strategic sourcing of goods and services and reducing our office footprint.
Transitioning Away from Fossil Fuels and Towards Energy Independence
At the time of this report’s publication, Russia’s invasion of Ukraine has upended global stability. Our company stands with the people of Ukraine, and following the invasion denounced Russia’s actions. We expressed our concerns about buying oil from Russia to our fuel supplier, as roughly 30% of Hawai‘i’s statewide fuel supply (including the oil used in power generating units) in recent years has come from Russia.
We supported our supplier’s decision to suspend oil imports from Russia, even prior to the announcement of U.S. sanctions. We believe that our responsibilities extend beyond our own conduct to include our selection of those with whom we do business.
The human rights issues surfaced by the Russian invasion underscore our urgency to combat climate change and end Hawai‘i’s reliance on imported fossil fuel. The impact of geopolitical events on energy prices is also felt by our customers. We have reduced the use of oil for power generation by 113 million gallons, or 25%, since 2008. Substituting fixedprice, lower-cost renewable energy resources for fossil fuel-based generation is the best opportunity to provide customers with lower and more stable electric rates. This renewable energy transition can also drive savings in other sectors (e.g., lowering costs of operating electric vehicles).
LESS OIL USED FOR POWER GENERATION
(In millions of gallons)
113M REDUCTION FROM 2008
80 HAWAIIAN ELECTRIC AMERICAN SAVINGS BANK PACIFIC CURRENT QUANTITATIVE HEI < CONTENTS
2 1 2
We have reduced the use of oil for power generation by 113 million gallons, or 25%, since 2008.”
Helping Customers Manage Their Usage and Bills
The company facilitates a range of programs to assist customers in managing their energy use and bills:
LIHEAP (Low Income Home Energy Assistance Program) provides qualifying low-income households a one-time credit to offset energy costs. As part of this program, in 2020 we helped more than 8,000 families receive $3.9 million in energy assistance.
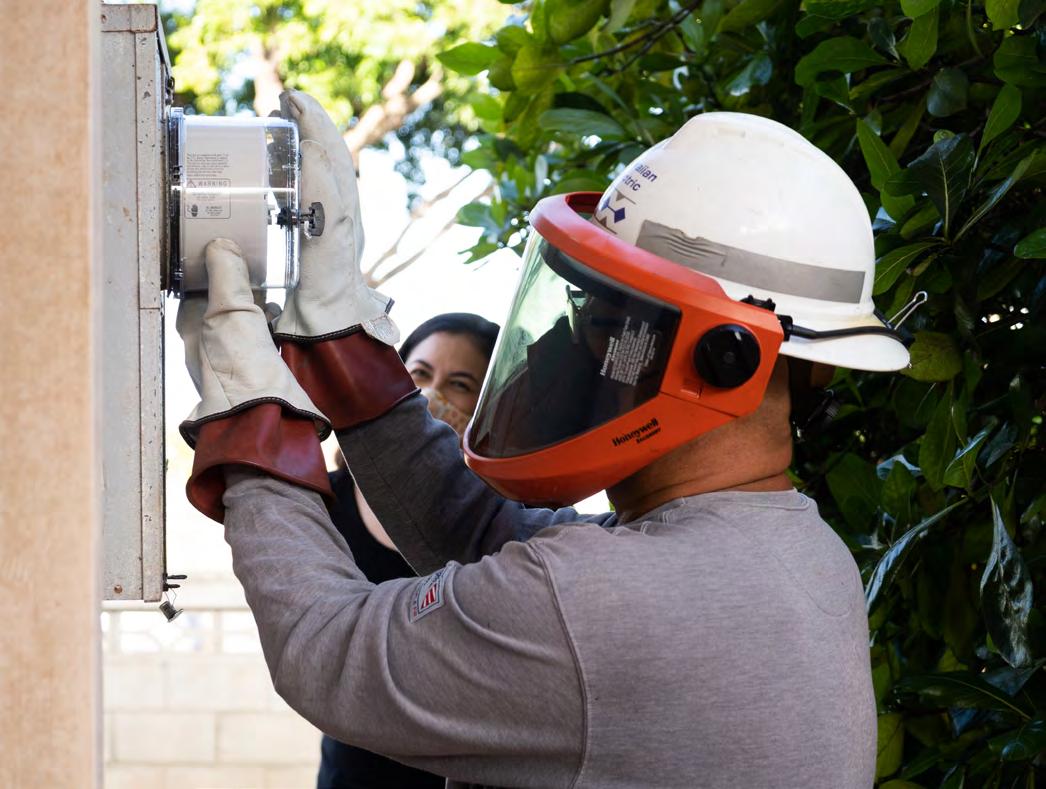
The Hawai‘i Green Infrastructure Authority (HGIA) Green Energy Money $aver (GEM$) On-Bill Program helps customers reduce electricity costs by installing energy improvements such as rooftop solar, solar hot water systems and/or commercial energy efficiency retrofits, which are repaid through the customer’s electric bill.
The Special Medical Needs Program is designed to provide reduced electricity rates for qualified customers who are dependent on life-support equipment used in their homes and/or have increased heating and cooling needs due to their medical conditions.
We also partner with nonprofits who provide utility payment assistance and connect our customers with nonprofits for help.
In light of the economic impact COVID-19 has had on our customers:
We voluntarily suspended disconnections for nonpayment beginning in March 2020; the PUC extended disconnection suspensions for all utilities in Hawai‘i through end of May 2021. Collection efforts resumed in Q3 2021 beginning with the largest and oldest balances in arrears.
We’re offering flexible payment arrangements and helping customers access public assistance, including federal stimulus programs, to help reduce their outstanding balance.
In 2021, we were the founding sponsor of a program to help families throughout the state struggling from the impacts of the pandemic pay bills for electric, water, sewer and gas utilities, and in 2022 we established a $2 million bill credit program to help our customers who continue to struggle from the impacts of the pandemic.
Enabling Distributed Energy Resources (DER)
In the past, electricity generation took place only at large-scale, centralized power plants. Distributed energy resources, or DER, refers to smaller generators and storage devices located throughout the energy grid, such as rooftop solar on customers’ homes and businesses, customer-sited energy storage, electric vehicles that store and use electricity, and demand response devices like grid-interactive water heaters, which can be turned off during system peak usage.
Our DER strategy is anchored by three principles:
Need. Customer-sited distributed energy resources are essential to achieving our 100% renewable energy goal and our Climate Change Action Plan. (Our Climate Change Action Plan calls for 50,000 more rooftop systems by 2030.)
Opportunity. The utility must expand opportunities for costeffective distributed energy resources.
Equity. The expansion of distributed energy resources must benefit all customers.
Affordability and equity are central to our DER strategies. We’re committed to integrating distributed generation with fair pricing for all customers. With one of the highest rates of rooftop solar adoption in the U.S., we have identified a critical opportunity to ensure prices remain fair as we push for further DER adoption.
We are working to avoid scenarios in which customers without DER unfairly subsidize customers with DER. While we want to encourage DER adoption, there are valid reasons why some customers might not be able to access DER (e.g., renters, properties without appropriate roofs, upfront cost structure),
81 Decarbonization 1 Economic Health & Affordability 2 Reliability & Resilience 3 Secure Digitalization 4 Diversity, Equity & Inclusion 5 Employee Engagement 6 Climate-Related Risks & Opportunities 7 PRIORITY AREAS
1 2 5 2 5
and we are determined to make sure those customers are not paying more than their fair share. This means customers with DER fairly contribute to the fixed costs of operating the electric grid on which they depend, often daily, for electricity when their system is not producing, while at the same time DER customers are fairly compensated for the services they provide to the grid.
To promote fair pricing we have implemented several programs for customers who would like to offset their energy bill by investing in clean energy generation, including Customer GridSupply Plus and Smart Export (these programs compensate customers for exporting energy to the grid at prices that place less burden on non-DER customers). Net Energy Metering, which compensated customers at the full retail rate, was closed to new participants in 2015.
We’re developing new DER tariffs and programs to benefit all customers. For example, we’re expanding our CommunityBased Renewable Energy or Shared Solar program and are evaluating a rooftop rental program in which customers get paid by the utility to rent their roof for DER systems that can provide benefits to the entire system. We have procured aggregated grid services from customer DERs, which provide additional economic benefits to DER customers while providing costeffective ancillary services that benefit all customers.
More than ever, equity is important to us. It is our obligation to provide solutions that work for all, so that everyone has access to affordable, reliable, clean energy. Solutions that work for “most” are not sufficient if they do not address the needs of those who face the greatest challenges. Whether considering issues of project siting, rate design, or community resilience, we’re committed to leveraging Hawai‘i’s renewable transition to address societal inequities.
Advanced Rate Design
In the rate design track of the DER Policies docket we proposed advanced rate designs in March 2021 that would allow optout time-of-use (TOU) rates for customers who have received advanced meters in the Grid Modernization Phase 1 rollout. These rates provide cost-based price signals that are more equitable across customers while providing greater opportunity to manage the electric bill. These proposed TOU rate designs are under PUC review. In that filing we also proposed a framework that targets reduction of electric bills as a proportion of household income as an approach for potential subsidy of low- to middleincome customers for the PUC’s further consideration. In the program track of the DER Policies docket, we have proposed standard DER tariffs that are also before the PUC for review. In separate dockets, we have proposed EV rate designs to incentivize daytime charging when solar energy is readily available. The PUC has approved commercial EV charging rate options in March 2022, and other options remain under review.
Promoting Customer Satisfaction
We strive to improve customer satisfaction by increasing service accessibility and improving customer service quality at all points of engagement.
Over the past five years we improved customer service by expanding online and creating mobile options. Our Online Customer Service Center enables customers to pay bills, start/ stop service and update their account. By the end of 2021, 30% of our customers had signed up for paperless billing. Our mobile app allows O‘ahu customers to pay bills, start/stop service, report and get updates on power outages and receive
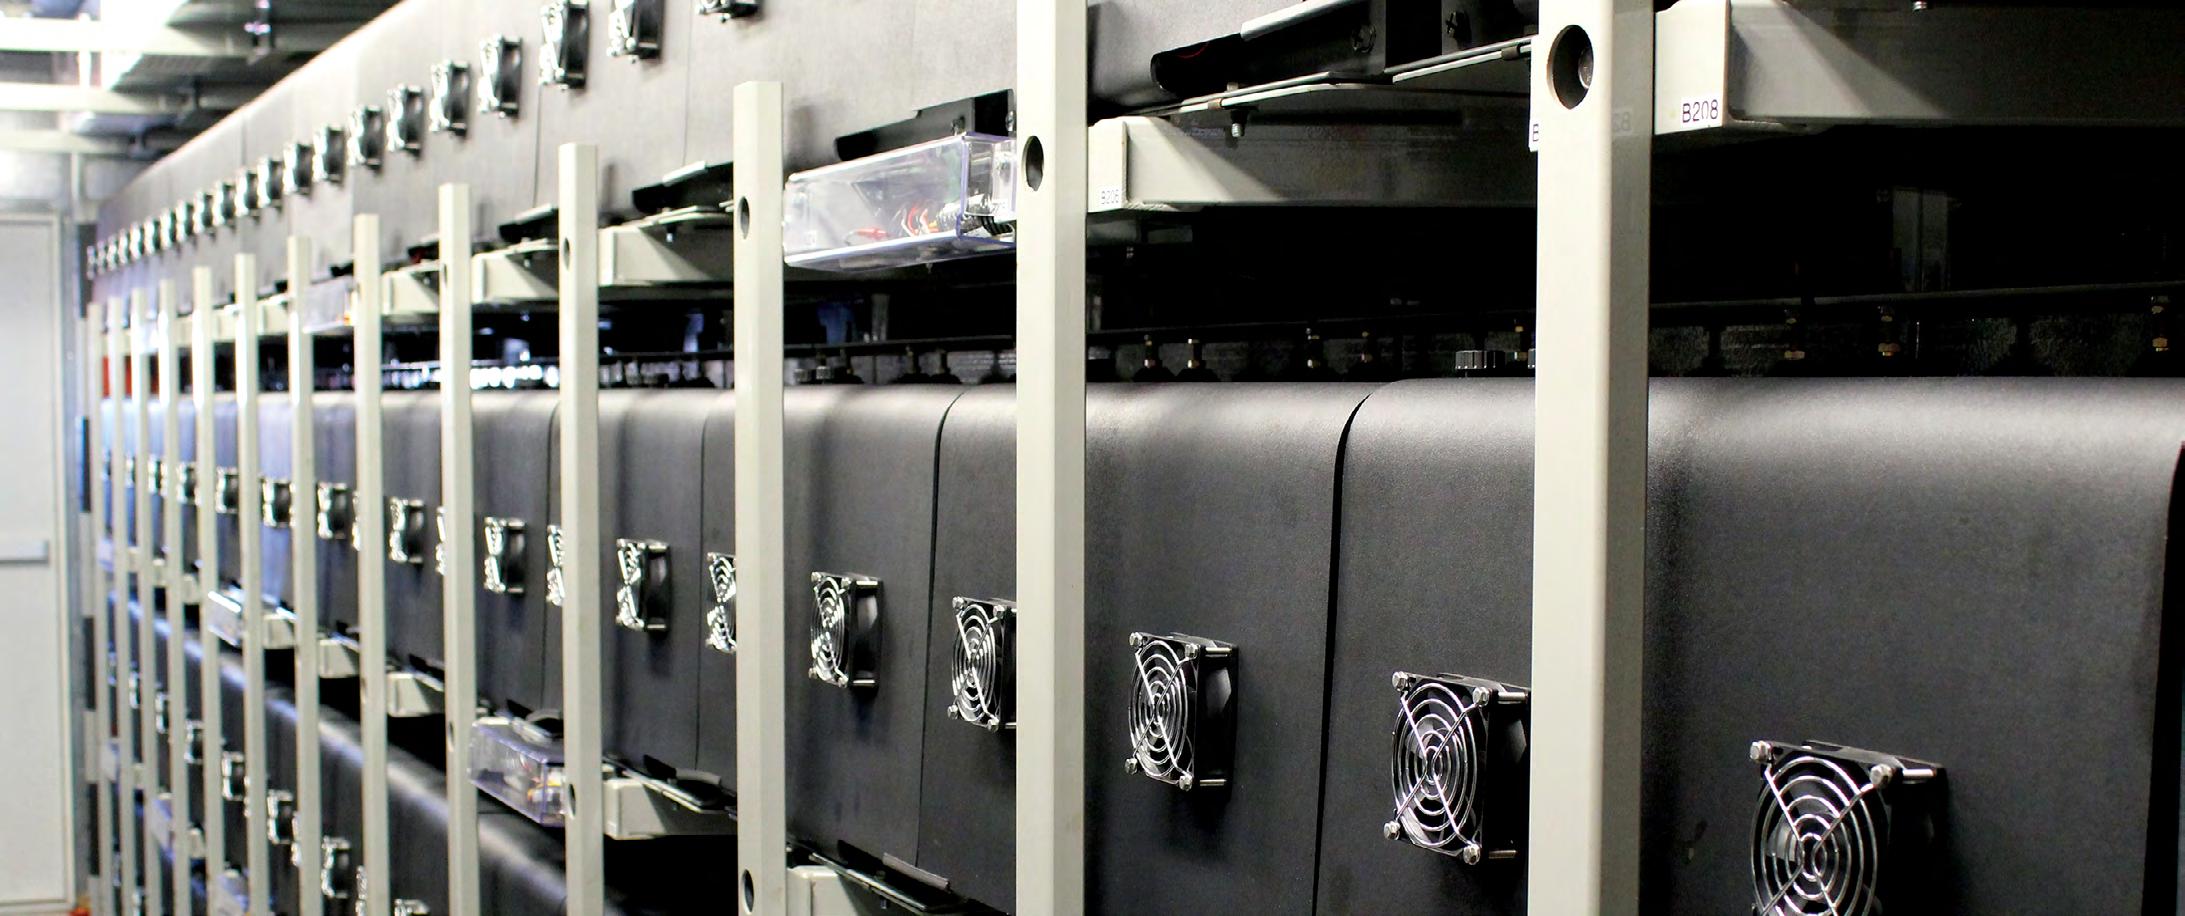
82 HAWAIIAN ELECTRIC AMERICAN SAVINGS BANK PACIFIC CURRENT QUANTITATIVE HEI < CONTENTS
2 5
alerts. Our interactive EV charger map allows customers to find detailed information on our EV fast charging stations.
To stay in touch with our customers and their needs, we conduct quarterly residential customer satisfaction surveys, which are benchmarked against 99 other utilities across the nation.
We have made significant strides in improving customer satisfaction. Our 2021 consolidated overall satisfaction score of 77 represents a 26% increase since the start of our 2015-2020 strategic plan. We take pride in this improvement as a reflection of our customer-centered strategies. Our customer satisfaction scores placed us in the top 30% of utilities nationwide for three out of four quarters in 2021.
End-Use Efficiency & Demand

Energy efficiency helps customers save money, reduces overall demand, may reduce the need for more generation facilities and helps preserve our environment.
In Hawai‘i, all electric utility customers pay a public benefits fee (PBF) that funds demand-side reduction and energy efficiency initiatives. Under current Hawai‘i law, a public utility cannot administer such programs or use PBF surcharge funds. The PUC contracts a third party known as Hawai‘i Energy to administer programs that support energy efficiency, clean energy technology, demand-side management (DSM) and energy conservation services and products.
We encourage the efficient use of energy through online customer education tools. In addition, where permitted, Hawaiian Electric and Hawai‘i Energy work in partnership on projects and customer education. In its PBR decision the PUC encouraged collaboration between the utility and Hawai‘i Energy with respect to increasing low- to moderate-income customer energy efficiency, establishing a financial incentive for the utility for such collaboration. Additionally, Hawaiian Electric provides energy efficiency and ENERGY STAR® information in our customer education resources and refers customers to Hawai‘i Energy for programs and services whenever possible.
At Hawaiian Electric we participate in a range of activities to educate customers on energy efficiency, energy conservation, demand response and technologies such as advanced meters and electric vehicles. These activities help customers manage their energy usage and make informed decisions that maximize their electric bill savings. These educational initiatives are implemented through workshops, community events and informational material available online, via social media and in printed versions in multiple languages. We also help educate students by providing educators free material on basic electricity, energy conservation and efficiency, renewable energy and electrical safety.
83 Decarbonization 1 Economic Health & Affordability 2 Reliability & Resilience 3 Secure Digitalization 4 Diversity, Equity & Inclusion 5 Employee Engagement 6 Climate-Related Risks & Opportunities 7 PRIORITY AREAS
1 2 5
Our 2021 consolidated overall satisfaction score of 77 represents a 26% increase since the start of our 2015-2020 strategic plan.”
Our Community
In the Hawaiian language, the word ‘ohana is used to describe family, close friends or a tightknit community. At Hawaiian Electric, we are an ‘ohana that cares for one another, for our communities and for Hawai‘i and its future. Our workforce reflects the diversity of the people and communities we serve.

Serving our customers and communities in a fair and non-discriminatory manner is not just a regulatory responsibility for Hawaiian Electric. It is pono, the moral, just and equitable way we strive to conduct our business. We have long supported nonprofits and organizations that advance the finances, well-being and health of vulnerable populations, including keiki (children), kūpuna (elderly) and Asset Limited, Income Constrained, Employed (ALICE®) individuals in underserved communities. As we move forward, a key objective will be to ensure equity and opportunity are foundational to everything we do, from advanced rate design to siting of projects.
As we work to achieve Hawai‘i’s clean energy goals, the Hawaiian concept of kākou is top of mind. While we play a key role in facilitating our community-wide clean energy and carbon neutral transition, it will take the actions of our whole community, kākou, to reach our renewable energy milestones and decarbonize our economy.
Community Engagement
Hawaiian Electric is committed to ensuring transparency and effective dialogue in every aspect of our work that affects our communities, from our core business of delivering electricity to our long-range, energy infrastructure projects. We know that engagement and collaboration can only be successful when we demonstrate a willingness to work with our communities through careful listening, thoughtful responsiveness and a commitment to embracing the environmental and cultural values of Hawai‘i. We strive to learn and adapt continually according to the needs of our communities. We work alongside community, grassroots and civic leaders, government and private sector businesses and organizations to foster our shared goal of strengthening communities to build a stronger Hawai‘i.
84 HAWAIIAN ELECTRIC AMERICAN SAVINGS BANK PACIFIC CURRENT QUANTITATIVE HEI < CONTENTS
It is pono, the moral, just and equitable way we strive to conduct our business.”
For nearly every significant project we conduct a risk assessment to identify relevant community, government and business stakeholders for engagement.
To build and sustain trusting relations with the communities we serve, we focus on early and meaningful communication on projects that impact our communities. Community outreach is performed at numerous stages. We have developed an adaptable engagement framework utilizing tools to enable our communities to envision the scope, goals, plans, benefits and outcomes of our projects and programs.
Promoting Early Engagement
In our recent renewable energy and storage RFPs, we required comprehensive community engagement and outreach plans by third-party developers that had to include hosting a public meeting and collecting public comments. The requirement arose from our own engagement efforts as residents told us they wanted more transparency and engagement earlier in the project development process.
As climate action and energy decarbonization programs expand rapidly, Hawaiian Electric recognizes that access to the benefits of this transition must be distributed equitably. In communities hosting utility-scale generation infrastructure, we listened to leaders who have expressed interest in gaining a better understanding of energy policy and process. This in turn empowers communities to provide informed input in energy policy making and process improvement that would better serve them. An informed community voice also helps energy planners and policy makers to shape policy and process in a way that is inclusive and equitable and improves our ability to collectively achieve our state’s clean energy goals.
As an example, in West O‘ahu, an area stretching from Kalaeloa to Wai‘anae, Hawaiian Electric worked with community leaders to share information about the renewable energy procurement process, listened to concerns and discussed ideas on how the request for proposals process can be improved. Suggestions included giving residents in host communities priority in subscribing to shared solar projects, strengthening the requirement to protect and preserve cultural resources, prioritizing projects that are not proposed on open land, incentivizing the use of local labor and requirements for improved communications between developers and neighboring residents. While not all of the community suggestions were incorporated by the PUC into the RFP, we believe the revisions that were approved to address concerns from already overburdened communities will help move Hawai‘i one step further toward a more equitable renewable energy future. We will continue to work with stakeholders to improve our energy procurement processes.
Cultural Sensitivity
The Hawaiian concept of sustainably caring for the land and natural resources is a top priority and responsibility for all areas of our company. This includes protecting Hawai‘i’s cultural and archaeological resources. We strive to respect the Native Hawaiian culture and reduce the risk of potential issues when working in culturally sensitive areas. We provide training to operations employees and contractors to ensure they are aware of the importance of cultural and historic site protection, can recognize potential archaeological sites and understand what to do upon encountering them.
Community Investment
We strive to strengthen the well-being of communities by supporting nonprofit partners and their programs. This is done through employee giving and civic projects, as well as through service projects where our employees can support community initiatives.
We work side by side with nonprofits, community and environmental groups and educational institutions to protect the environment, advocate for equity and societal issues (e.g., homelessness and hunger), promote sustainable, healthy lifestyles and advance economic and educational opportunities. Our executive leadership is involved on the boards of key service and business organizations.

85 Decarbonization 1 Economic Health & Affordability 2 Reliability & Resilience 3 Secure Digitalization 4 Diversity, Equity & Inclusion 5 Employee Engagement 6 Climate-Related Risks & Opportunities 7 PRIORITY AREAS
5
Strengthening Ko‘olaupoko: A Community Resilience Initiative
Ko‘olaupoko, a region on O‘ahu stretching along the southeast to northeast shores of the island, was identified as one of the most vulnerable communities and particularly prone to disruptions affecting electricity, communications, transportation and other life-sustaining services in the event of a major hurricane.
We convened a series of collaborative, dynamic and transparent exchanges with Ko‘olaupoko community and government leaders, emergency management agencies and critical infrastructure owners to raise awareness of and develop a holistic set of actions to build resilience throughout Ko‘olaupoko.
The initial forum and four subsequent workshops, held between October 2018 and October 2019, sought to stimulate community dialogue and involve participants in the process of identifying community strengths and vulnerabilities and identifying and prioritizing potential actions to increase resilience. The electric grid, emergency shelters, telecommunications network, drinking water, disaster response network, food distribution and the ahupua‘a (land division usually extending from the uplands to the sea) were identified as priority areas. Among the action items for the utility were educating the community about the electric system and the full array of generation and non-generation options for the region.
We continue to engage with the Ko‘olaupoko region through an Energy Working Group and are helping to serve as a connector between community and agencies in developing and implementing related resilience actions.

< CONTENTS HEI HAWAIIAN ELECTRIC AMERICAN SAVINGS BANK PACIFIC CURRENT QUANTITATIVE 86
3
We continue to engage with the Ko‘olaupoko region through an Energy Working Group and are helping to serve as a connector between community and agencies...”
1,556
VOLUNTEERS
Strengthening Communities Concept
3,555
VOLUNTEER HOURS
Volunteerism
1,000
UNITS OF BLOOD / APHERESIS DONATED
SPEAKERS BUREAU FOR SCHOOLS VIRTUAL PRESENTATIONS
Building Trust / Meaningful Relationships
Focused on strengthening our communities by investing in resilience and sustainability
Our connection to our communities and our commitment to build a better Hawai‘i are at the heart of our community service initiatives, many of which are led by employee volunteers. We identify opportunities for collaboration through community engagement and our employees. We convene a Community Advisory Group that reviews, approves and in some cases provides funding for service projects.
Among our volunteer service projects are environmental cleanups, including ‘āina (land) restoration to clear invasive vegetation and replant native Hawaiian species such as kalo (taro), clearing vegetation and reinforcing structures to protect rehabilitating wildlife, rebuilding traditional Hawaiian fishponds to improve food sustainability, constructing affordable homes for local families and preparing living quarters for the homeless.
Sustained Employee Giving
Among our long-standing traditions are the employee-led fundraising campaigns for United Way agencies to support Asset Limited, Income Constrained, Employed (ALICE®) residents — hardworking people with two or three jobs who struggle every month to pay for basic expenses like rent, food, child care, transportation and utilities. Funds raised through activities such as sales of cookbooks featuring employee-donated recipes, golf tournaments, online auctions, bake sales and other creative efforts support more than 300 health and human services agencies. In 2021, more than $600,000 was raised by our employees, including over $56,000 for the Hawai‘i Utility Bill Assistance Program which helps individuals financially affected by the COVID pandemic and who have fallen behind on their payments to electric, water, sewer and gas utilities.
3,000
60 STUDENTS REACHED
Our employees continued their support for our communities throughout the COVID pandemic, launching 46 service projects and donation drives including raising funds and gathering food for local foods banks, donating backpacks filled with school supplies to children in need, and collecting needed supplies for social service agencies. In 2019 prior to the pandemic, our employees served over 12,100 volunteer hours. In 2021 over 1,500 utility employees served over 3,500 volunteer hours even though community volunteer events were significantly reduced due to COVID safety protocols.
87 Decarbonization 1 Economic Health & Affordability 2 Reliability & Resilience 3 Secure Digitalization 4 Diversity, Equity & Inclusion 5 Employee Engagement 6 Climate-Related Risks & Opportunities 7 PRIORITY AREAS
2021 UTILITY HIGHLIGHTS
Communicate
Collaborate Connect
Our Employees
Our employees are our greatest asset in transitioning to a net zero economy and remaining competitive in a rapidly evolving business landscape.
Safety
Safety is among our top priorities at Hawaiian Electric. Our goal is to provide a safe and healthy work environment, where every employee makes safety a central part of his or her job.
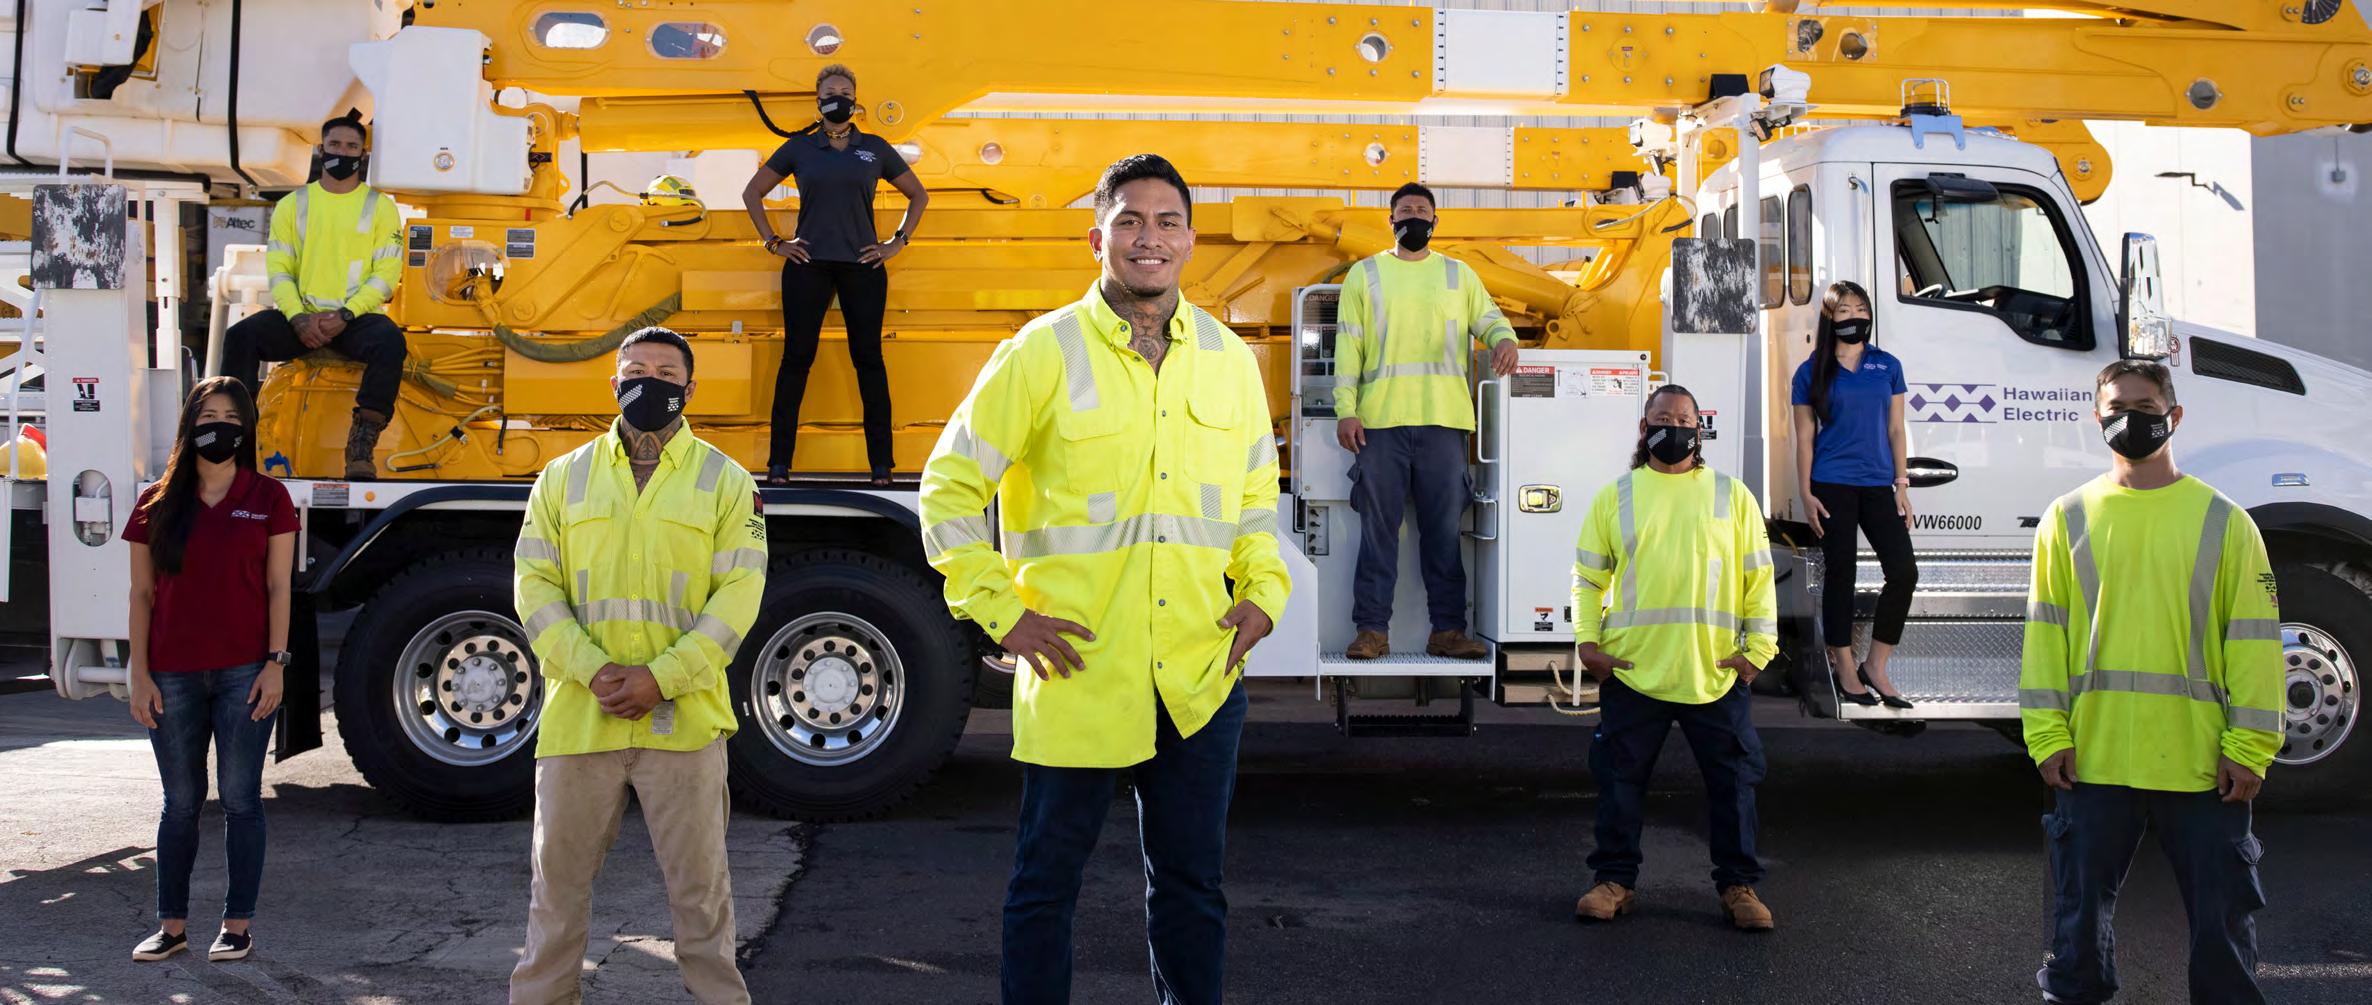
Our safety commitment is to provide and support:
Managerial responsibility for health and safety issues
Procedures for hazard identification and safety risk assessment
Operating health and safety guidelines, procedures and policies
Emergency planning and preparedness procedures
Safety performance monitoring, measurement and reporting
Internal and external health and safety audits
Oversight
Our entire senior management team is committed to maintaining a strong safety culture and is responsible for:
Providing visible leadership and strategic direction for the health and safety management system and programs in their area of responsibility, helping to build and maintain a strong safety culture and drive safety improvement
Allocating adequate resources to enable implementation of safety programs
Holding leaders accountable for the implementation of safety programs and health and safety performance
Operating Guidelines and Training
Our Safety and Health Manual provides detailed safety guidelines, including commitments to ensure employees receive training and are familiar with all safety-related work programs and procedures that pertain to their job. All new employees are required to attend new employee safety training.
Contractors must comply with our Safety and Health Manual, and compliance with safety guidelines is included in contractual agreements. We require all contractors to undertake contractor orientations, including safety training, at least every two years.
Our internal audit team conducts an audit focused on safety every year.
88 HAWAIIAN ELECTRIC AMERICAN SAVINGS BANK PACIFIC CURRENT QUANTITATIVE HEI < CONTENTS
5 6
Safety Initiatives
We seek to build a safety culture that aims for zero incidents by having all employees take ownership of safety for themselves, their co-workers, contractors and the public. Our efforts include:
Investment in training programs such as SafeStart®, which offers practical techniques to keep employees aware and alert to risk
Investment in on-site first aid services to provide early care and treatment
Implementation of procedures in the field to improve safety behaviors. The Safety Observation Program targets better safety communication to mitigate risks and improve safety engagement. Safety observations provide the opportunity for employees to identify and correct hazards and communicate the problems they can’t fix. Safety observations and associated corrective actions are captured and addressed using safety management software.
Our Safety Incidents Investigation Program and Executive Incident Review Board ensure consistent procedures for investigating safety incidents. We use root cause analysis to determine where processes need to be improved and identify solutions to address breakdowns and gaps.
Performance
We evaluate our safety performance by monitoring total case incident rate (TCIR) and lost time rate (LTR). For more information, see pages 133 and 155. TCIR measures the number of workrelated injuries and illnesses per 100 employees. LTR measures occupational injuries or illnesses per 100 employees that result in an employee being unable to perform a full assigned work shift.
Executive compensation is tied to achievement of quantified severity and TCIR targets. These targets reward improvements in workplace safety, promote employee well-being and reduce expenses.
Culture
We’re committed to building a strong culture to support the long-term success and sustainability of the utility and our workforce. In 2020, we adopted the following declaration as a means to not only inspire us at Hawaiian Electric, but also to hold ourselves accountable to be the best we can be for our customers, communities, and employees.
“Hawaiian Electric, by 2025, shall be one of the most progressive and highestperforming companies in the world, serving the energy needs of each person in Hawai‘i with purpose, compassion, empathy and aloha for our fellow humans and our natural environment. We commit to be the best in all we do. We turn our Hawai‘i spirit and our connectedness with others to our community’s advantage.
We act with boldness and urgency, without fear of failure. Our highest priority is to build a sustainable Hawai‘i in which our children and grandchildren, our communities, our customers, and employees will thrive, together. We succeed by providing exceptional service to our customers and integrating and aligning our actions with those of other businesses and organizations.
We drive ourselves and others to higher levels of achievement than ever before.”
Our “WeConnect” company culture seeks to instill five behavioral dimensions throughout the organization: 1) Customer-focused, 2) Adaptable, 3) Accountable, 4) Empowered and 5) Collaborative. Each year, WeConnect champions and their leaders prepare action plans to strengthen company culture based on these dimensions. This also helps nurture and develop an inclusive and change-ready workforce.
89 Decarbonization 1 Economic Health & Affordability 2 Reliability & Resilience 3 Secure Digitalization 4 Diversity, Equity & Inclusion 5 Employee Engagement 6 Climate-Related Risks & Opportunities 7 PRIORITY AREAS
6
Diversity, Equity and Inclusion (DEI)
At Hawaiian Electric, we see diversity — of people, backgrounds, experiences, thoughts and perspectives — as an advantage that helps us meet our customers’ needs and achieve our goals.
Hawaiian Electric’s workforce continues to be racially diverse, reflecting the unique demographics of Hawai‘i. As reflected in our 2021 EEO-1 data, 90.3% of our utility’s total workforce was nonwhite (listed as “racially diverse” in the chart to the right), as were 84.5% of our leaders and 66.7% of our executives. 28.7% of our total workforce was female, as were 28.3% of leaders and 40% of our executives.
Hiring and promoting individuals from diverse backgrounds is very important to us. We are committed to providing inclusivity and equal employment opportunity in all operations and all areas of employment. We strive to provide employment opportunities in a manner that does not discriminate on the basis of race, color, religion, sex/gender (including gender identity/expression), ancestry / national origin, disability, age, marital status, arrest and court record, sexual orientation, pregnancy, veteran status, genetic background, domestic or sexual violence victim status or any other grounds protected under applicable state and federal laws.
Hawaiian Electric aspires to further develop an environment in which all members of our communities feel respected and valued
for their differences and unique contributions. We recognize that words require action, so here are some concrete initiatives that we undertook in 2021:
We recognize that meaningful change needs to start from the top. As such, our leaders established a DEI goal for all employees and supported the creation of a DEI program to include raising awareness of DEI and unconscious bias with our employees by bringing in guest speakers, encouraging team discussions and offering training. 96% of our workforce met the company’s DEI goal, which we will again pursue in 2022.
The company increased the visibility of DEI topics within our workforce and developed more productive engagement with our employees around these topics. Through the company’s speakers bureau, employees met with students from Title 1 schools to provide education on energy conservation and efficiency, emergency preparedness and careers. In addition, the company hosted a series of lunch-and-learn seminars throughout 2021, placing DEI issues center-stage.
To ensure we are progressing towards our commitment of a more diverse, equitable and inclusive workplace, a DEI & EEO Program Manager position was created to spearhead these efforts and drive our overall company DEI strategy.
Our affirmative action efforts include initiatives relating to women, minorities, individuals with disabilities and veterans, and partnering with organizations that promote opportunity and inclusion. Examples of our outreach efforts in 2021 include:
Partnering with Kupu and a statewide Green Job Youth Corps (utilizing state CARES Act funds and federal funding) which employs and trains displaced workers and recent graduates in green collar jobs through internships and possible future employment with our company. This program increases our state’s ability to grow a green industry workforce in areas such as renewable energy and conservation.
Conducting outreach to agencies that serve veterans and individuals with disabilities, including American Job Center, Work for Warriors Hawaii, Alu Like, Inc. and the State of Hawai‘i Vocational Rehabilitation Division.
Pursuing partnerships with the University of Hawai‘i System and the Hawai‘i State Energy Office to develop training programs to meet employers’ skills gaps.
90 HAWAIIAN ELECTRIC AMERICAN SAVINGS BANK PACIFIC CURRENT QUANTITATIVE HEI < CONTENTS
5
Employee Engagement and Satisfaction
Employee engagement is key to strengthening our Company foundation and developing an engaged, high-performance workforce. Our CEO and executive team hold regular “talk story” sessions with employees to learn the pulse of our company, gain insights to our employees’ needs and encourage continuous dialogue.
We conduct employee engagement surveys to give our leaders visibility to the health of our company. Employee engagement surveys provide a “snapshot” of company culture and are conducted on a one- to two-year cycle. Results of the 2021 survey have been shared with business areas so they may develop plans toward increasing engagement. Transitioning our business to 100% renewable energy can create an environment of change for our employees, and we are committed to helping them successfully navigate and embrace the changes we face.
We continue to improve efficiencies through our One Company initiatives to standardize operational best practices processes across five islands. Results from the 2021 employee engagement survey indicate that employees have a clear understanding of the strategic direction of the company and believe there is a culture of cooperation throughout our company. Further One Company initiatives continue as we strive to increase efficiencies and refine standardization processes across the utilities.
Workforce Stability
Our people are our power. Our company owes its success to our hard working, dedicated and engaged employees. We believe in order for our employees to feel fulfilled and happy working here, we need to take care of our employees’ needs.
Physical well-being. Our health and welfare benefits include medical, dental, vision, prescription drug, group life insurance, accidental death & dismemberment insurance, long-term disability insurance, worker’s compensation, long-term care and flexible spending accounts. Wellness and preventive programs include sick leave, an employee assistance program and other wellness education programs.
Financial well-being. We offer pensions to employees hired prior to January 1, 2022, and a 10% non-elective employer contribution to new hires to help employees develop greater financial security. This includes the HEI Retirement Plan, HEI Retirement Savings Plan and other post-retirement benefit plans. We continue to assess the competitive landscape
Source: 2019 U.S. Census Bureau American Community Survey — Data Profile While 2020 experimental estimates (pandemic-related) were available at the time of analysis, 2019 data was used to maintain consistency with previous analyses. U.S. Census Bureau guidance recommends against comparing 2020 experimental estimates with standard estimates.
with respect to these programs so we can make appropriate adjustments to remain competitive. We also have agreements with vendors to offer our employees discounts for a variety of products and services, such as computers, computer products, business software, advanced electronics and cellular equipment.
91 Decarbonization 1 Economic Health & Affordability 2 Reliability & Resilience 3 Secure Digitalization 4 Diversity, Equity & Inclusion 5 Employee Engagement 6 Climate-Related Risks & Opportunities 7 PRIORITY AREAS RACIAL DIVERSITY — ALL WORKFORCE 52.8% Asian 9.7% White 10.6% Native Hawaiian or Other Pacific Islander 21.5% Two or More Races 4.6% Hispanic 0.5% Black 0.3% American Indian or Alaska Native
Representation Female Racially Diverse 18 Executives19 40.0% 66.7% Leaders20 28.3% 84.5% All Workforce21 28.7% 90.3% 5 6 RACIAL COMPOSITION OF HAWAI‘I
Diverse
Source:
Data 38.1% Asian 10.7% Hispanic 9.9% Native Hawaiian or Other Pacific Islander 17.8% Two or More Races 21.5% White 1.8% Black 0.2% American Indian or Alaska Native
EEO-1 Survey
Emotional well-being. We recognize the importance of achieving work-life balance for our employees and company. To help employees manage their needs, we offer opportunities for part-time (less than 20 hours/week) work schedules, flextime schedules, teleworking and various leave programs. We also provide other employee benefits such as vacation, bonus vacation for taking minimum sick leave, paid holidays, family and medical leave, adoption expense reimbursement, voluntary educational assistance program, bus pass reimbursement and bereavement leave. In addition, we offer an employee assistance program that provides free and confidential counseling and assistance on a range of topics.
Compensation. We seek to provide compensation that is comprehensive, market-competitive, and internally equitable. This helps us to attract, engage and retain highly skilled employees to advance our commitment to provide customers and communities with affordable, reliable and clean energy. In that effort, we continue to assess total rewards compared to the market and make appropriate adjustments to be competitive.
Labor Relations

Approximately 48% of our workforce is represented by the International Brotherhood of Electrical Workers (IBEW) Local 1260. Our renewed collective bargaining agreement with IBEW Local 1260 took effect on November 1, 2021, and is in effect through October 31, 2024. In 2019, IBEW Local 1260 and Hawaiian Electric together developed a joint Code of Excellence (COE), which aims to create a collaborative partnership between the utility and union. Follow-up COE training for leaders will take place in 2022.
Workforce Development Recruitment
We are committed to creating an environment of diversity, seeking the best candidates while giving all applicants equal opportunity. Finding and attracting diverse and talented candidates requires thoughtful planning and partnering with the community. Our efforts include working with organizations with a focus on women, veterans and those with disabilities, partnering with eductaional institutions and expanding our reach through multiple social media platforms. We also provide opportunities for internships and externships, and support science, technology, engineering & math (STEM) and mentoring programs, and are one of the largest employers of skilled tradespeople in the state with many coming through our own apprenticeship programs. Our employees have been longstanding mentors for high school students participating in robotics programs on O‘ahu and Hawai‘i Island. Today, several former robotics students are employed at Hawaiian Electric as engineers.
High-Performance Workforce
To build a high-performance workforce, we offer courses in required safety training, leadership development, employee development, technical training, apprenticeship programs and operational and environmental compliance. Courses are offered primarily through remote learning via our automated Learning Management System (LMS). We also offer leader and employee assessments geared to improve job effectiveness and productivity. A new Leadership Development Cohort Program (LDCP) was implemented in 2021. The program’s purpose is to strengthen our leadership pipeline and develop high-potential leaders through a series of events and projects.
Our annual performance review process includes assessment of performance-based goals as well as assessment on culture dimensions and individual achievements. Our Human Capital Management (HCM) Strategy, implemented in 2021, focuses on integrating programs to enable our workforce to achieve current and future business strategies. HCM areas include Strategic Workforce Planning, Strategic Business Partnering, Employee & Leadership Development, Labor Relations, Employee Development and Pay & Benefits (Total Rewards). Within each of these areas, specific initiatives include culture renovation, succession, partnerships with schools and community organizations to upskill, reskill and provide talent pipelines, a new incentive program and 401k program to support retention, DEI programs, workforce planning action plans, labor-management Code of Excellence and workforce data analysis. Collectively, these programs and initiatives build
92 HAWAIIAN ELECTRIC AMERICAN SAVINGS BANK PACIFIC CURRENT QUANTITATIVE HEI < CONTENTS
5 6
and strengthen our workforce. Annual succession planning ensures the identification and development of successors and high potentials and nurtures a leadership pipeline.
Succession Planning
Our succession planning strategy is designed to ensure we have the right talent and leadership to fill critical positions. This includes leadership assessments that result in individual
STEM Education
In the area of community giving, Hawaiian Electric also supports numerous nonprofits and youth organizations that provide STEM curriculum, programs and initiatives for students from diverse backgrounds to gain the skills and confidence to succeed in STEM careers. The need for highly-trained STEM employees that can effectively compete in the global science and technology industries is essential and we are committed to igniting student interest in STEM and developing the next generation workforce:
For more than two decades, our annual grant to the Hawai‘i Society of Professional Engineers Educational Foundation ensures the O‘ahu and Hawai‘i State MATHCOUNTS® middle school math competitions are held. Our employees also serve as volunteer proctors.
We are a sustained supporter of the McKinley High School robotics team, one of the first robotics teams in Hawai‘i, through financial grants and mentorship. Students here represent diverse ethnic groups including Filipino (24%), Chinese (16%), Micronesian (13%), Indo-China (11%), Native Hawaiian and Japanese (8%), Caucasian and Samoan (5%), Korean (3%), Black and Hispanic (2%). Ten other ethnic groups make up 4% of the total school enrollment.
Hawaiian Electric is the sustaining sponsor of the Hawai‘i FIRST® Lego League State Tournaments founded in 2006. The robotics competition is based on a real-world issue that students are challenged to solve through collaboration and professionalism.
comprehensive development plans. Part of the strategy is a 360-degree feedback assessment program based on defined leadership competencies. To date, all executives, directors and approximately one-third of managers have completed 360-degree feedback assessments, which have included individual coaching sessions on results and development of individual development plans. We also encourage and support developing leaders in applying to community leadership programs such as Omidyar Fellows, Patsy T. Mink Leadership Alliance and Pacific Century Fellows
We are the founding and title sponsor of the Hawai‘i VEX® Robotics Competitions since 2013, and our annual support ensures Hawai‘i students in elementary, middle and high school have an opportunity to advance to the highest level alongside national and international students in the VEX World Competition.
We also are the sustained sponsor of the Astronaut Lacy Veach Day of Discovery organized by the Hawai‘i Space Grant Consortium for more than 20 years. This free science-based event honors the life and legacy of Hawai‘i’s second astronaut.
In 2021, we provided a total of $148,000 in STEM contributions. This includes support of the above programs and those offered through the Aloha Council - Boy Scouts of America (Ellison Onizuka Day of Exploration), Girl Scout Council of Hawai‘i (STEM Center of Excellence at Camp Paumalu) as well as school robotics programs (Pearl City High, Waialua High & Intermediate, Nānākuli High) across a range of communities. Our support also extended to the nonprofit HawaiiKidsCAN for its Wi-Fi on Wheels program to ensure students in underserved communities have equitable access to digital technology.
Hawaiian Electric employees also serve as volunteer mentors for robotics teams as well as for the nonprofit Center for Tomorrow’s Leaders, a local nonprofit developing the next generation of visionary leaders for Hawai‘i through their work with junior and senior high school students from diverse backgrounds and communities.
93 Decarbonization 1 Economic Health & Affordability 2 Reliability & Resilience 3 Secure Digitalization 4 Diversity, Equity & Inclusion 5 Employee Engagement 6 Climate-Related Risks & Opportunities 7 PRIORITY AREAS


< CONTENTS HEI HAWAIIAN ELECTRIC AMERICAN SAVINGS BANK PACIFIC CURRENT QUANTITATIVE
American Savings Bank

American Savings Bank is focused on making banking easy for our customers, delivering high performance, creating a great place to work and bringing real impact to our community.
Our team cares deeply about the economic, environmental and social future of Hawai‘i. As a bank, we know that our success is closely tied to the financial health of our customers, local businesses and our island economy, so our business strategies have sought to support our community as a whole.

The pandemic brought to light the importance of building a resilient economy — one that recognizes small businesses as the lifeblood of our state, prioritizes innovation and selfsufficiency and promotes sustainable environmental and business practices.
We continue to do our part to contribute to Hawai‘i’s economic recovery. We are steadily expanding solutions for Hawai‘i businesses and increasing the amount of financing for commercial and real estate projects. These loans have higher risk profiles than residential loans, but we believe that supporting local businesses is an important driver for rebuilding. For years, fostering innovation and entrepreneurship has been one of ASB’s key impact areas. We continue to support our state’s Startup Paradise community and the entrepreneurial endeavors of Hawai‘i’s people.
As one of the largest financial institutions in Hawai‘i, ASB has long recognized that when more people have the financial security to save portions of their income, make investments and borrow money to make their dreams possible, the local economy thrives. We continue to invest in social and environmental sustainability measures to ensure our recovery efforts meet the needs of all residents, promote greater financial equity and result in strong economic growth.
Our Community
Financial Inclusion and Capacity Building
ASB is committed to strengthening communities. Some of the ways we help Hawai‘i residents include community development loans, affordable housing investments, small business development programs, charitable contributions, community service projects, financial education initiatives and pro bono services.
As a way to help customers impacted by the COVID-19 pandemic, ASB created a financial hardship program with a number of solutions to help customers, including loan forbearance, deferment or extension. In addition to dedicated phone lines, we set up web pages for both personal and business customers to submit requests for assistance.
Investing in Affordable Housing
With the skyrocketing price of homes, we know that it’s getting harder for families to live in Hawai‘i. In February 2022, the median price of a home on O‘ahu was a record $1.125 million – that’s 22.6% higher than the year before.
96 AMERICAN SAVINGS BANK PACIFIC CURRENT QUANTITATIVE HEI HAWAIIAN ELECTRIC < CONTENTS
2 5
Read our Corporate Social Responsibility Report
2 5
We believe it is more important than ever to encourage, support and invest in affordable housing in Hawai‘i. Currently, we have investments in more than 20 low-income housing projects in Hawai‘i, including:
$7.6 million in Koa‘e Makana, a new construction development in Koloa, Kaua‘i, with 134 rental units
$10.9 million in Pua Loke, a new construction development in Lihue, Kaua‘i, with 15 one-bedroom units, 24 two-bedroom units and 15 three-bedroom units
$21.4 million in Halewai‘olu Senior Residences, a new construction development with 150 units in the heart of downtown Honolulu
We are also a major supporter of the Hawai‘i Community Foundation’s House Maui Initiative, a program designed to help 3,000 families designated as Asset Limited, Income Constrained, Employed (ALICE®) in Maui County obtain affordable housing.
In 2019 ASB’s primary regulator, the Office of the Comptroller of the Currency (OCC), recognized ASB’s “excellent level of qualified community development (CD) investments” on O‘ahu, Kaua‘i and Hawai‘i Island.
Supporting Small Businesses
According to the U.S. Small Business Administration, 99.3% of Hawai‘i companies are considered small businesses. These small businesses employ roughly half of the Hawai‘i workforce.
Our knowledgeable Business Relationship Managers viewed the challenges created by the pandemic as an opportunity to work closely with small businesses to understand their immediate needs, challenges and future plans. Our bankers recognize that there is no one-size-fits-all approach and have continued making regular “mālama (to care for) calls” to check in with customers and offer support and personalized solutions.
ASB Cares
One of the most significant and rewarding ways our ASB teammates contributed during the pandemic was by helping thousands of local companies struggling to pay their employees and make ends meet. In March 2020, we established a loan payment deferment program for our commercial borrowers, which continued through 2021. Business customers were able to request up to two 90-day deferments, which provided some breathing room as they took care of their own customers and workers and purchased protective equipment.
When Congress established the Paycheck Protection Program (PPP) in March 2020 through the CARES Act, ASB teammates from all across the bank rallied and created a 24-hour operation to secure as many federal dollars as possible for Hawai‘i companies before funding ran out. From setting up loan application processes to verifying documents, our team members went above and beyond to support local companies during a very difficult time. In total from 2020 to 2021, ASB originated $551 million in PPP loans, supporting more than 4,000 small businesses employing more than 40,000 people.
97 Decarbonization 1 Economic Health & Affordability 2 Reliability & Resilience 3 Secure Digitalization 4 Diversity, Equity & Inclusion 5 Employee Engagement 6 Climate-Related Risks & Opportunities 7 PRIORITY AREAS
We believe it is more important than ever to encourage, support and invest in affordable housing in Hawai‘i.”
2 5
We are currently helping our PPP customers navigate the loan forgiveness process. As long as the loan proceeds are used on payroll costs, mortgage interest payments, rent payments, utilities, operations expenditures, property damage costs, supplier costs and worker protection expenditures, and the borrower meets all program requirements, the loan may be forgiven by the U.S. Small Business Administration. As loans are forgiven the bank recognizes fees related to these loans. In 2021, PPP fees contributed more than $14 million in revenue for ASB.
Helping Low- and Moderate-Income Families
ASB fully embraces the Community Reinvestment Act (CRA). The CRA is a federal law that encourages financial institutions to help meet the credit needs of the communities in which we operate, including low- and moderate-income neighborhoods, consistent with safe and sound operations. The law also prohibits “redlining,” which is the practice of denying or increasing the cost of banking to residents of racially defined neighborhoods.
ASB offers solutions that benefit low- and moderate-income families. For instance, we participate in the Fannie Mae HomeReady and Freddie Mac Home Possible programs, which help make homeownership a possibility for credit-qualified lowand moderate-income families. Low-income families seeking to live in rural communities, which include West O‘ahu and most areas on the neighbor islands, may qualify for a USDA Rural Development loan.
ASB is also a participating lender in the Mortgage Credit Certificate Program, which reduces the amount of federal taxes that low- and moderate-income borrowers pay, thereby freeing up their income for mortgage qualification purposes. Additionally, we participate in programs that help provide down payment or closing cost assistance to qualified firsttime homebuyers (Federal Home Loan Bank of Des Moines’s Home$tart program) and teachers (Landed).
In 2019, ASB received a “Satisfactory” CRA rating from the OCC. The OCC recognized ASB’s “excellent responsiveness to the credit needs” of Hawai‘i residents and commented that the bank’s service delivery systems were “readily” or “reasonably accessible” to people of “different income levels.”

For families that want to save their hard earned money, we offer a Kalo Essentials checking account, which does not have a monthly service fee or minimum balance requirement. For keiki (children), we also offer a free Moneyhune Savings account with no minimum monthly balance.
ASB also offers Individual Development Accounts (IDA) through nonprofit partners. With IDAs, account holders deposit money into their accounts, and the nonprofit partner matches the funds. This wealth-building tool helps low- and moderateincome people achieve their goals by providing funds for things such as a college education, starting a small business or saving toward homeownership.
98 AMERICAN SAVINGS BANK PACIFIC CURRENT QUANTITATIVE HEI HAWAIIAN ELECTRIC < CONTENTS
2 5
Empowering the Community with Financial Literacy
We’re committed to helping our customers and the community improve their financial literacy.
At ASB, everyone has a banker – no matter how big or small their dreams are. New and existing customers can schedule a one-on-one meeting with a banker through our website, branch or Customer Banking Center. Our bankers are here to help customers make the best financial decisions possible to reach their goals.
Additionally, we offer a free, online Financial Checkup, which provides users a real-time assessment of their financial wellness and recommendations that will help them learn more about improving their situation. We recently revamped our Financial Checkup to provide more insight on topics such as moving out on your own, buying a home, having a baby, paying for keiki’s education and saving for retirement. People can also access our free financial calculators, budgeting tools and helpful articles with financial tips and information.
In 2021, we launched the ASB Financial Education program – a free, comprehensive online resource center available on asbhawaii.com. Users can select from several different playlists, featuring a series of five-minute trainings designed to provide practical tips and information on topics such as debt management, budgeting, credit scores and much more.
Since program launch, 10,000 users have engaged with the educational course content. After completing the course, customers learn about potential next steps and can make an appointment to meet with one of our knowledgeable bankers.

In addition to the online self-service tools and content, our teammates regularly hold seminars on financial topics, such as purchasing a home, saving and investing, managing credit, planning for retirement, insuring against losses and preventing fraud. Our teammates also speak about personal financial responsibility and entrepreneurship in schools and youth organizations, such as Junior Achievement, Girl Scouts of Hawai‘i and Kupu. These efforts continued throughout the pandemic, with our teammates leveraging video conferencing technology to expand our financial literacy reach.
We partner with 41 public and private schools across the state through our Bank for Education program. The schools within our Bank for Education ‘Ohana have special access to financial literacy education, grant awards and volunteer projects. Half of the schools have signed up for free training on topics such as Understanding Money, Entrepreneurship and Smart Money Skills for Teens.
Through our participation in the Internal Revenue Service’s Volunteer Income Tax Assistance program and partnership with Goodwill Hawaii, we assist low- and moderate-income individuals and families to complete their income tax returns free of charge.
99 Decarbonization 1 Economic Health & Affordability 2 Reliability & Resilience 3 Secure Digitalization 4 Diversity, Equity & Inclusion 5 Employee Engagement 6 Climate-Related Risks & Opportunities 7 PRIORITY AREAS
2 5
Fostering Entrepreneurship
We are passionate about supporting our local entrepreneurs and the innovation and accelerator community in Hawai‘i. We are proud supporters of Mana Up, a 12-week accelerator program for consumer packaged goods companies with a Hawai‘i influence, and Elemental Excelerator, a nonprofit accelerator for climate tech deployment. We have also been longtime supporters of the Pacific Asian Center for Entrepreneurship at the University of Hawai‘i at Mānoa, Shidler College of Business and the Hogan Entrepreneurial Program at Chaminade University of Honolulu.
We recognize that innovation and entrepreneurship begin from the earliest days in the classroom. In 2015, ASB created its own business plan competition for youth called the KeikiCo Contest. KeikiCo challenges students in grades 3 to 12 to come up with their brightest business ideas for a chance to win substantial monetary awards for their school. Students submit a written business plan and a two-minute video pitch. To guide students through the process, ASB developed a written curriculum and a series of “how-to” videos. Branch teammates are paired with schools to provide support throughout the 10-week program.
Ingredients for a Better Future

In partnership with Kupu, a leading conservation and youth education nonprofit in Hawai‘i, a new 24-foot food truck was launched at the ASB Campus in February 2022.

“American Savings Bank has proudly supported Kupu since 2015 through year-round volunteer support, inkind donations and sponsorships for sustainability and educational programs,” says Beth Whitehead, executive vice president and chief administrative officer. “This food truck collaboration is a terrific opportunity for ASB to further invest in preparing our future workforce for successful careers while providing healthy and delicious meals to our community.”
Purchased by ASB to bring economic opportunities to children in the neighborhood and share healthy and locally sourced food, the truck also provides invaluable experience for members of Kupu’s culinary program.
“The Kupu culinary team will receive hands-on training in the food service industry, grow their customer service skills, and learn about operating a small business,”
Schools that earn first or second place in KeikiCo receive substantial cash prizes, in addition to priority consideration for grants, scholarships, ASB Seeds of Service projects and other opportunities.
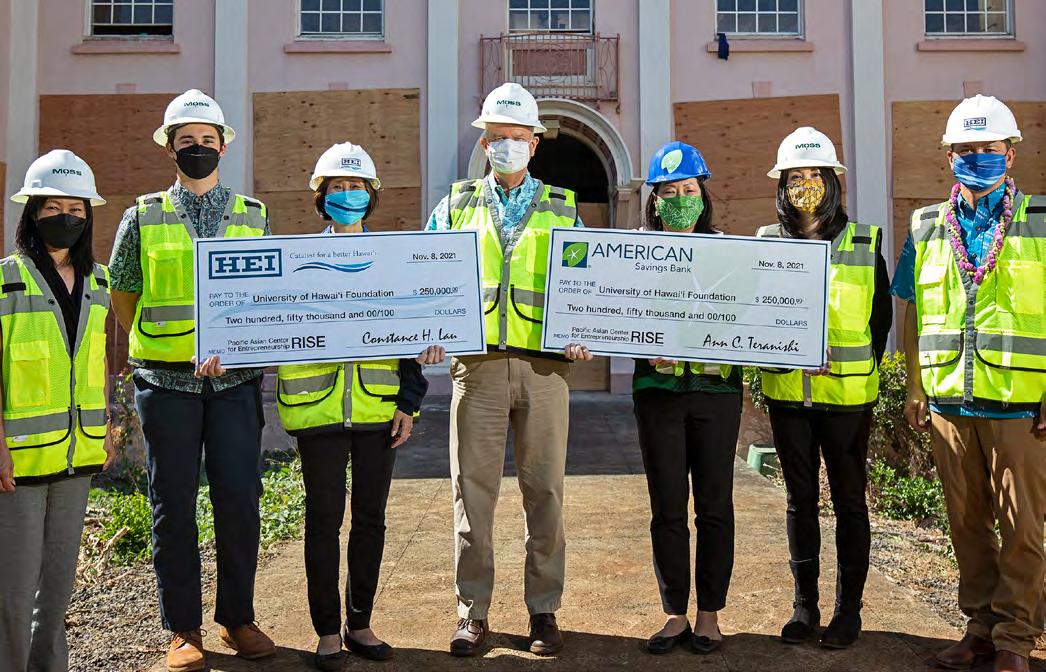
In addition to KeikiCo, ASB supports other K-12 entrepreneurship efforts, such as Lemonade Alley, the Hawai‘i Agricultural Foundation’s Young Entrepreneurship Program and Kupu’s Hawai‘i Youth Sustainability Challenge, programs that teach children about entrepreneurship.
explains John Leong,
chief executive officer
at Kupu. “We are so grateful for ASB’s support.”
The culinary program prepares youth to enter Hawai‘i’s workforce through paid training and work opportunities in the culinary industry, with an added focus on food sourcing and sustainable economy. Most program youth are ages 16-19 and are working toward their GED, while also getting paid work experiences that support their employment readiness.
One hundred percent of the food truck’s profits will go toward furthering Kupu’s mission to empower youth to serve their communities through character-building, service-learning and environmental stewardship opportunities.
100 AMERICAN SAVINGS BANK PACIFIC CURRENT QUANTITATIVE HEI HAWAIIAN ELECTRIC < CONTENTS
2
Our Environment
Financing Green Causes

We see the direct and societal benefits of having our own clean energy system and we think it’s important for our customers to have the same opportunity to save money on energy costs and reduce their impact on the environment.
In 2021, we originated more than $8.6 million in residential clean energy loans. These loans allowed homeowners to purchase and install their own photovoltaic systems, solar water heaters, solar air conditioning, and battery backup and storage. We work closely with local contractors to make financing easy for consumers. We offer financing for green purposes such as electric transport, solar energy and storage and large-scale renewable energy systems.
We also financed over $65 million in commercial clean energy projects from 2010 to 2021, supporting a total of 21.30 MW in renewable energy capacity. From non-profits to large commercial real estate and apartment buildings, we are equipped to help customers finance medium and large-scale clean energy improvements. The following are just a few examples:
GEMS. By partnering with the Hawaii Green Energy Market Securitization Program, ASB is able to provide customized financing options for commercial clients interested in clean energy improvements. Our tailored loan structures allow customers the time and flexibility they need to repay their outstanding loan balance, which means more local businesses can take advantage of energy efficiency opportunities.
Apartment and Multi-Family Owners’ Associations. We work with apartment associations and owners of multi-family dwellings to help bring energy efficiencies to buildings across the islands. While most of our projects have centered around solar installations, we help condo associations finance other improvements such as energy efficient lighting, HVAC, building envelope and water heating projects.
Other. Recent commercial financing includes clean energy loans for non-profit customers, schools and both leased and owned commercial properties where our customers operate their businesses.
101 Decarbonization 1 Economic Health & Affordability 2 Reliability & Resilience 3 Secure Digitalization 4 Diversity, Equity & Inclusion 5 Employee Engagement 6 Climate-Related Risks & Opportunities 7 PRIORITY AREAS
We also financed over $65 million in commercial clean energy projects from 2010 to 2021...”
1
We also have opportunities to participate in tax credit programs, such as New Markets Tax Credits (NMTC), to help fund renewable energy and other projects in disadvantaged communities. Through a Hawai‘i-based community development entity formed in partnership with the Oahu Economic Development Board, we helped deploy over $100 million in NMTCs and plan to apply for future allocations. These allocations help bring new investments, services and job creation to some of the most underserved, lowincome communities in our state and include direct investment in renewable energy projects in support of our state’s clean energy transition.
Addressing Potential Risk from Severe Weather and Climate Change
Operating on an island chain, we know that we must plan for extreme weather and sea level change and prudently mitigate related risks. One of the key potential risks from climate change is the potential for sea-level risk to affect properties that secure our loans.
We regularly monitor our credit risk exposure in areas at risk of future sea-level rise. All new residential and commercial real estate loans must undergo an environmental due diligence review as part of the underwriting process, which analyzes whether the property is located in a floodplain, sensitive ecological area or on contaminated land. Owners of commercial and residential properties located within the Special Flood Hazard Area, as designated by the Federal Emergency Management Agency, must obtain flood insurance through the National Flood Insurance Program as a condition of obtaining a property loan. We also require mortgagors to obtain hazard and hurricane insurance on their residential properties.
Sustainable Buildings Operating a Sustainable Headquarters
Our campus enabled us to bring employees once spread out across five different office locations together in one building. This consolidation enhances operational efficiency and reduces emissions by significantly cutting down on the amount of time and energy commuting to meetings across town during the day.
In designing the new campus, we wanted a building that was reflective of our commitment to our customers, our teammates and the community. We saw the construction of our new headquarters as an opportunity to analyze how we do business and what efforts we could implement to reduce our impact on the environment. Our campus features some of the latest green technologies, including solar panels, electric vehicle charging stations, self-tinting windows, responsive LED lighting, water bottle filling stations and reclaimed wood furniture. We also used this opportunity to evaluate our work habits and made the decision to operate as paperless as possible. During the pandemic, we successfully adjusted our campus operations, ensuring the safety of our employees and customers while still affording efficiency and teamwork benefits.
Reducing Emissions from Commuting
We encourage our teammates to commute to work by carpool, mass transit, bike or other means — and reward those who do for their commitment to the environment. Teammates who participate in a carpool receive one free parking stall per group, plus a monthly carpool stipend. Teammates who find other means of getting to work receive a larger green stipend, which can be used to cover expenses for alternate transportation or whatever else they choose.
Increasing Energy and Water Efficiency of Our Branches
At our new branches we have incorporated LED light fixtures and signage, self-tinting windows and low-flow water fixtures. For our existing branches, we have rolled out green initiatives and are retrofitting the facilities with sustainable features. These include installing LED light fixtures and low-flow water fixtures and implementing recycling programs. In addition to having a positive impact on the environment, these features reduce our energy and water use and positively impact our bottom line.
102 AMERICAN SAVINGS BANK PACIFIC CURRENT QUANTITATIVE HEI HAWAIIAN ELECTRIC < CONTENTS
7 1 1 1 6
Our Customers
Our customers are primarily residents and businesses in the state of Hawai‘i. We have branches on five islands — O‘ahu, Maui, Hawai‘i Island, Kaua‘i and Moloka‘i. Additionally, our online banking platforms and Customer Banking Center (telephone banking center) enable us to serve customers throughout the state.
Some of our customers are former Hawai‘i residents who have moved away or have property or projects in Hawai‘i. We are proud to retain their trust and business, and we strive to continually provide the same high-quality customer service.
Making Banking Easy
At ASB, we are committed to making banking easy for our customers. All of our locations, communications and our many different banking solutions and options are designed to provide ease, convenience and the best possible experience for our individual and business customers.
While our customers generally believe it’s easy to interact with ASB and to do their banking with us, we know there is always room for improvement. We continue to assess our branch locations, maintain our Customer Banking Center and empower customers with access to online tools. We also recognize that improving access requires us to continuously scrutinize our efforts to ensure that no population is denied access to financial services.
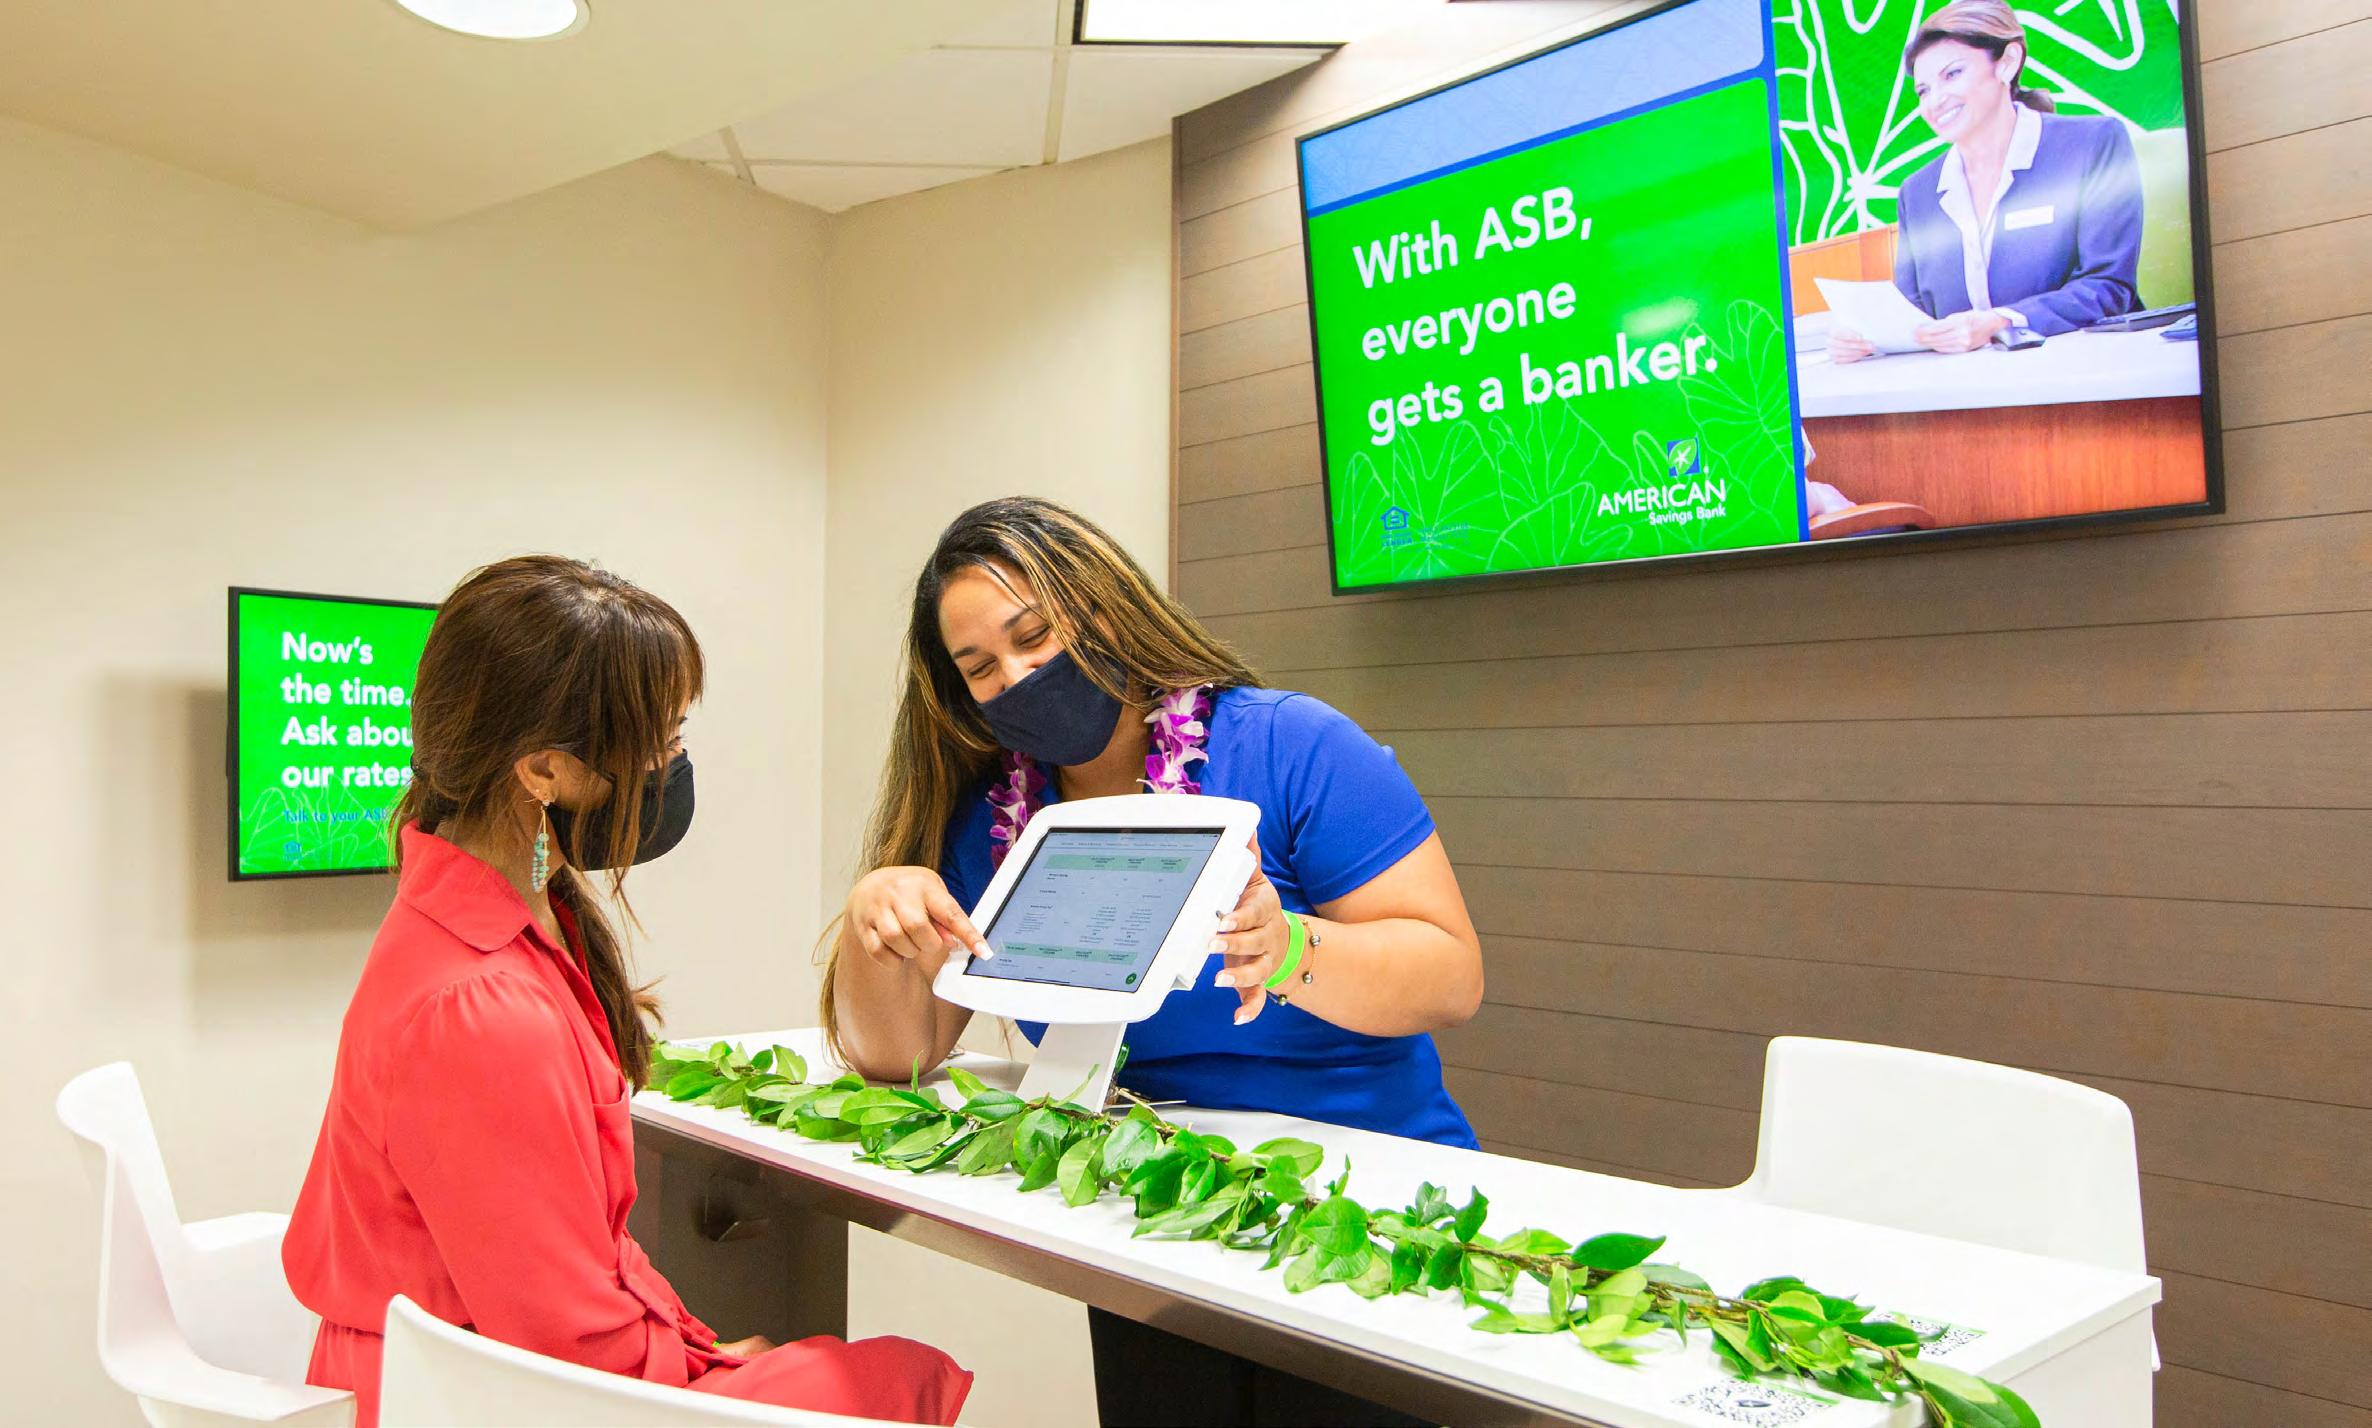
103 Decarbonization 1 Economic Health & Affordability 2 Reliability & Resilience 3 Secure Digitalization 4 Diversity, Equity & Inclusion 5 Employee Engagement 6 Climate-Related Risks & Opportunities 7 PRIORITY AREAS
BRANCHES ON FIVE ISLANDS O‘AHU MAUI HAWAI‘I ISLAND KAUA‘I MOLOKA‘I
Anytime, Anywhere Banking
The pandemic has certainly shifted the way our customers prefer to manage their finances and make banking transactions. Even before the pandemic we saw an increasing number of customers using our online and mobile banking tools. Today, more than 50% of our customers’ deposit transactions occur over one of our digital platforms.
We are committed to providing our customers the ability to bank with us anytime, anywhere. This means not only investing more in our technology and expanding our online services, but also changing the way we work. We’re focused on training all of our teammates, even those who’ve traditionally been behind the scenes servicing accounts and supporting our operations, to deliver excellent experiences to our customers.
Digital Centers. In addition to our branches, we opened four ASB Digital Centers (three on O‘ahu and one on Kaua‘i) in 2021, introducing customers to an innovative and convenient way to bank. In our Digital Centers, customers are assisted in-person and virtually as they learn about digital banking solutions, while continuing to receive the warm service they expect from ASB. At the digital centers, customers can perform a range of transactions at our full-service ATMs, talk in-person to an experienced banker for assistance with their unique financial needs and goals, visit the Digital Bar for guided demonstrations of ASB’s robust online and mobile banking solutions, or connect virtually to other bankers via an on-site conference room for additional support and services.
ATMs. We recently updated our entire ATM fleet. Our new ATMs allow customers to complete their cash transactions, including deposits, withdrawals, balance inquiries and more at their convenience, without having to visit a branch during bank hours.
Online Banking. With our online banking options and ASB Mobile App, customers can do their banking anytime, anywhere – whether at home, work or on the go. Customers can use our online banking platform to manage their accounts, make transfers, deposit checks, pay bills, get account alerts and make appointments.
As more customers shift to online and mobile banking, our focus remains on making banking easy for them no matter how or when they choose to interact with us. That means we are constantly seeking ways to improve our processes, technology and digital offerings.
Engaging Our Customers
During the pandemic, as more customers began conducting their banking transactions online or using our mobile app, we wanted to ensure that customers were receiving the same personalized guidance and support they’d get if they were meeting with one of our bankers in-person. Teammates made thousands of Mālama (care for) calls to customers, just to check-in and offer support. It was a great way for us to connect with customers, get to know more about their financial situation and educate them on banking options that suit their needs.
We regularly seek customer feedback through surveys, comment forms and focus groups to ensure that we are best serving our customers and making banking easy for them.
Resolving Customer Complaints
In addition to surveys and focus groups, we invite customers to provide their feedback directly to branch or Customer Banking Center teammates. Teammates who receive complaints notify our Customer Experience team, which works to quickly address and resolve issues.

We also monitor ASB’s social media web pages and other online comment boards, such as Yelp and Google Reviews, for customer feedback. Our Customer Experience and Communications teams frequently reach out directly to customers to better understand any negative experiences and address concerns.
On a quarterly basis, our leadership team and Customer Experience, Legal and Compliance teams review trends in customer feedback to identify any accessibility issues and to assess whether we should make any changes to our policies or procedures.
104 AMERICAN SAVINGS BANK PACIFIC CURRENT QUANTITATIVE HEI HAWAIIAN ELECTRIC < CONTENTS 4
Our Teammates
Each of our 1,100 teammates is a valuable member of what we call the ASB Dream Team. They work hard each day, helping customers at every major stage in their lives, from going to college, buying their first home, launching and growing their small business to planning for retirement. We’re all here to serve our customers and the community.
Award-Winning Culture and Workplace
Our teammates are committed to making our customers’ dreams possible and we’re committed to doing the same for them. In addition to offering some of the best health and wellness benefits in the state, we provide growth and development opportunities and go above and beyond to create an excellent experience for our team members.

ASB has garnered numerous local and national awards for its teammate-focused culture. In 2021, we were named one of the “Best Places to Work” in Hawai‘i by Hawaii Business magazine for the 13th year in a row and were certified by Great Place to Work®, a global authority on workplace culture, employee experience and leadership. ASB was also honored as one of the 2020 and 2021 “Best Banks to Work For” by American Banker magazine.
In our Great Place to Work survey, we received some of the following feedback from teammates:
90% of teammates say ASB is a great place to work (compared to 57% at a typical U.S.based company)
94% of teammates say that when you join ASB, you are made to feel welcome
94% of teammates feel they are treated fairly, regardless of their gender
95% of teammates feel good about the ways ASB contributes to the community
105 Decarbonization 1 Economic Health & Affordability 2 Reliability & Resilience 3 Secure Digitalization 4 Diversity, Equity & Inclusion 5 Employee Engagement 6 Climate-Related Risks & Opportunities 7 PRIORITY AREAS
5 6
In 2021, we were named one of the “Best Places to Work” in Hawai‘i by Hawaii Business magazine for the 13th year in a row...”
Feedback and Collaboration in the Workplace
Our teammates say that one of the best things about working at ASB is our open and transparent communication. At ASB, communication is a two-way street, and we expect and encourage everyone, from our leaders to new hires, to provide feedback, ask questions and take an active role in making us the best bank we can be.
Every quarter, our Management Committee hosts a series of “talk stories” (town hall-style meetings) to share ASB’s financial performance and operational priorities and challenges. Teammates are encouraged to ask questions and share key information from their respective areas. During the COVID-19 pandemic, we held these talk stories virtually so we could continue to stay connected.
Teammates who are uncomfortable proposing ideas or vocalizing their concerns in a group setting have many other opportunities to speak up. We invite team members to call, email, have one-on-one discussions with their manager or post suggestions to our Idea Bank on our intranet. We value all feedback and appreciate it when our teammates care enough to inform us of our potential blind spots and contribute ideas on how we can improve our customer and teammate experience.
Feedback is so important to us that we run five surveys each year. In our “Your Voice Matters” survey, we measure employee engagement and ask about ways we can improve our company. Our teammates’ responses serve as our road map for how to enhance the employee experience. From there, our Human Resources team meets individually with team managers to discuss their individual results and create an action plan to improve in specific areas. These goals are entered into our survey action planning system and revisited throughout the year. To keep engagement top of mind, managers hold team meetings to share team survey results and plans.
Hiring and Recruiting
We are proactive in our efforts to identify and connect with talented individuals. Through our partnerships with Hawai‘i high schools, colleges, professional networks and community organizations, we have recruited hundreds of new teammates — many of whom are residents of the communities we serve.
We make extra effort to recruit veterans and individuals with disabilities. In the past, our recruitment team has attended job fairs hosted on military bases, posted open positions on veteran-focused job boards, and worked with agencies such as Goodwill, Job Corps and Hawai‘i Workforce Development Division to attract veteran and disabled candidates.
With the COVID-19 pandemic resulting in the loss of employment for many in our community, it is important to us to support the return of local jobseekers to the workforce. ASB is a proud sponsor of Hawai‘i is Hiring, a one-stop resource from the Chamber of Commerce Hawai‘i that connects Hawai‘i residents to job opportunities, training programs and career navigation. We’ve also worked with the Economic Development Alliance of Hawai‘i to support the Aloha Connects Innovation program, which provides unemployed workers with new job opportunities to help set a course for a more sustainable, resilient Hawai‘i. Not only has this program helped many of the state’s displaced workers, it has also helped to diversify and strengthen our economy.
106 AMERICAN SAVINGS BANK PACIFIC CURRENT QUANTITATIVE HEI HAWAIIAN ELECTRIC < CONTENTS
We offer a variety of training courses to teach team members how to effectively give and receive feedback.”
Compensation, Benefits and Wellness
We offer a comprehensive set of benefits to those joining our team. This includes great health care coverage, a parental paid time off (PTO) benefit (16 weeks of PTO for teammates on leave for the birth, adoption or foster of a child), ‘Ohana PTO (four additional weeks of PTO to care for self or a family member), life and AD&D insurance, fully paid long-term disability and long-term care insurance, business travel accident insurance with identity theft assistance, a 529 college savings plan and discounted pet insurance. We also offer coverage for alternative care (acupuncture, chiropractic and massage therapy), a casual dress code, a wellness holiday and a birthday holiday.
Our LifeBalance wellness program takes a holistic approach to improving employee health and well-being by focusing on all aspects of wellness, including nutrition, fitness, mindfulness and finances.
We encourage participation in annual, bank-wide step and weight loss challenges and community charity walks.
We offer fitness classes – outdoors and virtually during the pandemic – including high-intensity interval training and yoga.
Our teammates can participate in a program enabling employees to use national fitness center chains or work out in their homes at a reduced price.
For employees and their families who need support through life’s challenges, we offer an employee assistance program that provides free and confidential counseling for relationship, family or financial challenges, as well as assistance for issues such as substance abuse, smoking or gambling.
We pride ourselves on offering competitive pay. To ensure that our teammates are fairly compensated, we annually review wages and conduct market comparisons to ensure our compensation is in line with – if not better than – what other employers in the financial services industry are offering. Our starting wage at ASB is significantly higher than Hawai‘i’s minimum wage of $10.10/hour.
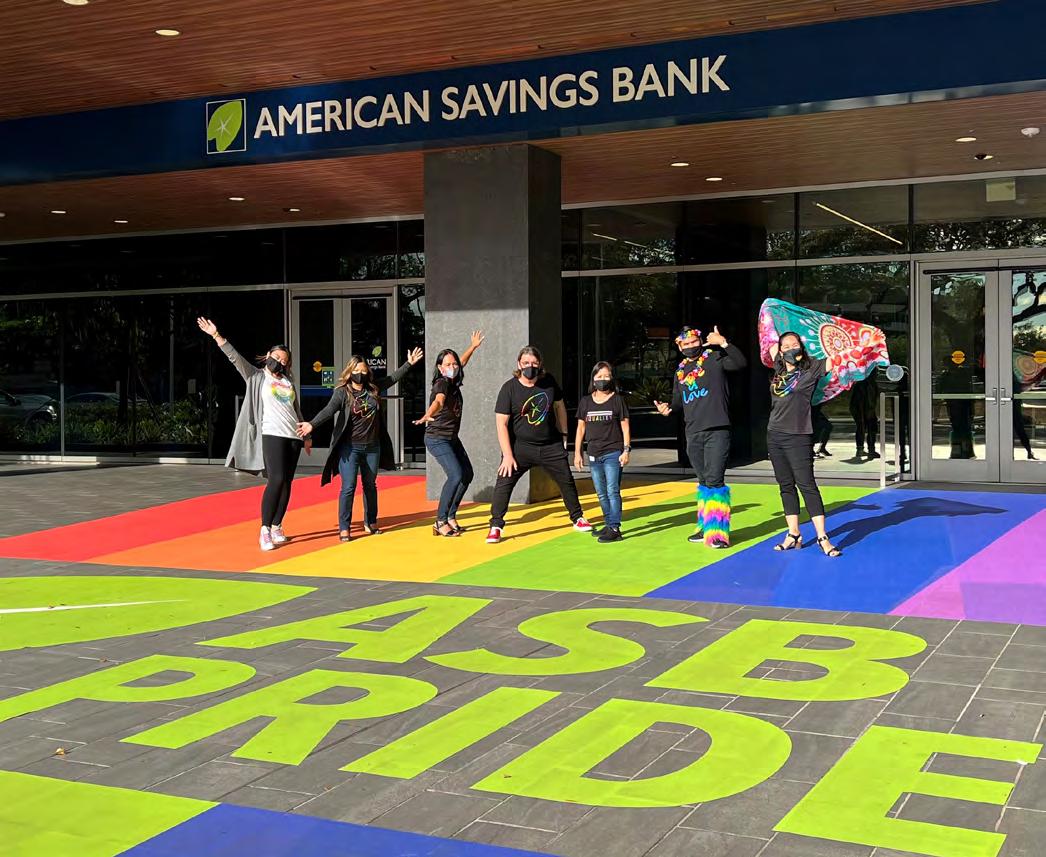
In light of economic challenges many in our community experienced during the pandemic, including many of our teammates, we offered our interest-free ASB Malama Loan to teammates facing financial hardship as a result of the pandemic. From 2020 to year-end 2021, more than 250 teammates were assisted with these loans, totaling nearly $1.5 million.
Diversity and Inclusion
Our company is comprised of teammates from all walks of life. This diversity provides a wealth of experiences and perspectives that inform our decision-making. It also allows us to connect better with our diverse customer base. We welcome and celebrate diversity in ideas, experiences, race, ethnicity, gender, age, disability, religion and sexual orientation and do not tolerate racism, discrimination or harassment of any kind. In 2021, ASB was recognized by Hawaii Business magazine as a Best Company for LGBTQ-Equality.
ASB’s teammates are highly diverse, both in terms of racial and gender diversity. As reflected in our EEO-1 data, in 2021, 89% of all teammates were racially diverse, as were 82% of our leaders and 80% of our executives. 66% of all teammates were female, as were 64% of leaders and 40% of our executives.
We work hard to ensure our hiring and training practices support our commitment to fostering a diverse and collaborative organization. We require all teammates to participate in our “Finding the I” in Diversity and Inclusion training. See charts on next page
Women’s Network
Our Women’s Network brings ASB’s female teammates together quarterly to discuss issues unique to women in the workplace. Recently, 70 ASB women got together over lunch to discuss how to be appropriately assertive and how to better support each other – two topics that were proposed by the group at a previous meeting. The Women’s Network also provides networking opportunities, skills and leadership training and executive-level support for women leaders.
107 Decarbonization 1 Economic Health & Affordability 2 Reliability & Resilience 3 Secure Digitalization 4 Diversity, Equity & Inclusion 5 Employee Engagement 6 Climate-Related Risks & Opportunities 7 PRIORITY AREAS
5 6
Committed to Diversity and Inclusion

American Savings Bank is committed to creating a diverse, respectful and inclusive company for all teammates, customers and community members.
Devoted to celebrating diverse groups and driving positive change, teammates at ASB created the IDEAS (Inclusion, Diversity, Equity, Allyship, Safety) council. Members of the IDEAS council meet regularly to discuss new ideas and ensure that ASB remains a diverse, inclusive and respectful workplace. Recently, we added Juneteenth to our holiday schedule, a recommendation that came from the council.
“Embracing diversity and inclusion isn’t just something that should be on our list of priorities,” said Beth Whitehead, executive vice president and chief administrative officer. “It’s simply put, the right thing to do both in our businesses and in our communities. I’ve seen firsthand the impacts of having a diverse workforce, which includes more innovation, higher engagement and stronger results.”
The collaborative council also spearheads ASB’s participation in Honolulu Pride Month, which advocates for the LGBTQ+ community. In previous years, nearly 100 teammates walked in the Honolulu Pride Parade. In 2021, ASB showed its support for LGBTQ+ team members and the community by rainbow-ing out the ASB Campus – from windows to floors to lights, releasing a four-part ASB Pride video series showcasing stories from teammates and community members, creating a Tiny Float for the Honolulu Pride tiny float competition, hosting an ASB Pride Day where teammates sported their most creative Pride outfit, and launched a mandatory 90-minute interactive course called “Finding the ‘I’ in Diversity & Inclusion.”
Diversity in ideas, experiences, race, ethnicity, gender, age, disability, religion and sexual orientation are always celebrated at ASB and are important in maintaining a great place to work.
108 AMERICAN SAVINGS BANK PACIFIC CURRENT QUANTITATIVE HEI HAWAIIAN ELECTRIC < CONTENTS Diverse Representation Female Racially Diverse 22 Executives23 40.0% 80.0% Leaders24 64.3% 82.2% All Workforce25 66.0% 89.0% RACIAL COMPOSITION OF HAWAI‘I Source: EEO-1 Survey Data RACIAL DIVERSITY — ALL WORKFORCE 58.9% Asian 14.2% Native Hawaiian or Other Pacifc Islander 11.0% White 9.8% Two or More Races 4.7% Hispanic 1.1% Black 0.3% American Indian or Alaska Native 38.1% Asian 10.7% Hispanic 9.9% Native Hawaiian or Other Pacific Islander 17.8% Two or More Races 21.5% White 1.8% Black 0.2% American Indian or Alaska Native
Source: 2019 U.S. Census Bureau American Community Survey — Data Profile While 2020 experimental estimates (pandemic-related) were available at the time of analysis, 2019 data was used to maintain consistency with previous analyses. U.S. Census Bureau guidance recommends against comparing 2020 experimental estimates with standard estimates.
Training and Development
We invest in continuous training and development of our teammates. Curriculum includes technical banker training programs that cover all aspects of banking laws, banking operations, new product and service offerings, legal and regulatory compliance and procedures and ethics. We also deliver company-wide financial education, empowering teammates to make wise personal decisions to help meet their financial goals and provide valuable customer guidance.
We offer opportunities for all employees to grow and build their careers through comprehensive soft skills training and leadership programs:

We provide a range of soft skills training, including emotional intelligence, change resilience, giving feedback, diversity and inclusion, and respect in the workplace.
To be a leader at ASB, teammates must complete our Leading the ASB Way course, which covers expectations for all leaders, and a biennial leadership certification refresher course. We provide monthly leadership training sessions open to all managers to help them keep their skills sharp and be prepared for leading their teams.
We lead semi-annual leadership forums, gatherings of 200+ ASB managers for a full day of leadership training workshops and updates on business objectives and goals.
We further invest in leadership development through leadership cohort programs, designed to help employees grow professionally and personally, enhance their leadership skills and broaden their understanding of the banking industry. These include Rise, a 6-month development experience for mid-level managers, and Leadership Academy, a robust 12-15 month cohort-based program to help leaders grow professionally and personally, enhance their leadership skills and broaden their understanding of the banking industry.
Our focus on meaningful growth and development opportunities positions us to recruit and retain top talent.
109 Decarbonization 1 Economic Health & Affordability 2 Reliability & Resilience 3 Secure Digitalization 4 Diversity, Equity & Inclusion 5 Employee Engagement 6 Climate-Related Risks & Opportunities 7 PRIORITY AREAS
6
We provide monthly leadership training sessions open to all managers to help them keep their skills sharp and be prepared for leading their teams.”
Ethical Banking Practices
All teammates are expected to comply with all laws and regulations, including fair dealing, antitrust and anti-tying laws intended to provide customers with a variety of products and services at competitive prices. In addition, ASB demands ethical business practices, including not engaging in agreements that restrict trade or competition, such as price fixing, bid rigging and similar unfair practices, bribery or corruption.
A number of departments are responsible for ensuring the bank complies with all laws and regulations. These include the legal, regulatory compliance, enterprise risk and internal audit departments. In addition, the audit committee of the ASB Board assists with overseeing ASB’s compliance with legal and regulatory requirements.
We do not tolerate retaliation against teammates who report suspected violations of the law or our code of conduct. Teammates who engage in retaliation are subject to discipline up to and including termination of employment.
Our Commitment to Human Rights Preventing Discrimination and Harassment
At ASB, we do not tolerate discrimination or harassment against our teammates by anyone, including fellow teammates, customers or suppliers. We expect our teammates and suppliers to comply with federal and state anti-discrimination laws and our code of conduct. We encourage any teammate who believes he or she is being subjected to discrimination or harassment to report the conduct to a supervisor, or anyone in the legal or human resources departments, or through EthicsPoint. We take all reports of discrimination or harassment seriously. Incidents are promptly investigated and action is taken as appropriate.
Protecting Our Teammates Against Domestic Violence
We do our best to help teammates who are victims of domestic violence. When we suspect that a teammate may be subject to domestic violence or threats of violence, we make reasonable accommodations to remove the teammate from harm’s way by relocating the teammate, changing the teammate’s contact information, or other means.
Stopping Child Labor
We will not engage with any suppliers who are known to violate child labor laws.
Thwarting Terrorism, Organized Crime, and Human Trafficking
As a financial institution, we must comply with the Bank Secrecy Act, which requires us to identify and report suspicious transactions and potential money laundering to law enforcement authorities. We have developed a program to screen new customers, monitor transactions, and prevent unlawful activity.
We also must comply with U.S. economic and trade sanctions against foreign countries, terrorists, and other individuals and entities. Our policies and practices are designed to comply with the Office of Foreign Assets Control’s regulations against engaging in transactions with governments, individuals or entities on the Specially Designated Nationals and Blocked Persons List.
Risk Management
On an ongoing basis, we evaluate business activities and potential risks to ASB, our teammates, customers, stakeholders and the community at large. This includes identifying, assessing, reporting, mitigating and monitoring risks across the company.
The risk committee of ASB’s Board assists with governance of ASB’s enterprise risk management program and provides a forum for detailed discussion and analysis of key issues and decisions designed to identify and manage potential significant risks. The enterprise risk management program focuses on various risk categories, including:
Credit (for loan, including related risk from sea level rise, and investment portfolios)
Market (particularly interest rate sensitivity and capital adequacy)
Liquidity
Operations (including, but not limited to, environmental, social, and governance)
Strategic
Reputational
110 AMERICAN SAVINGS BANK PACIFIC CURRENT QUANTITATIVE HEI HAWAIIAN ELECTRIC < CONTENTS
Secure Digitalization

We recognize the trust that our customers place in us when they deposit their hard-earned money, store their prized valuables, or take out a loan with us.
Protecting our customers begins with ASB providing the information customers need to make informed decisions about opening an account, taking out a loan or making an investment. We believe it’s important to be open and honest with the solutions we provide to customers. We provide customers with disclosures as required of financial institutions.
Customers who open accounts should know that we have their best interests in mind. We train our tellers, personal bankers and operations staff to recognize counterfeit, forged or altered checks, as well as signs of identity theft and elder abuse.
Our Enterprise Risk and Fraud departments monitor transactions to identify potential fraud and other unlawful activity. If we detect suspicious activity, our experienced fraud investigators will conduct a prompt investigation and provide any appropriate redress to the customer. If customers detect any fraudulent or suspicious activity on their ASB accounts, they are encouraged to immediately contact our Customer Banking Center.
Safeguarding Customer Information
Safeguarding our customers’ confidential information is one of our top priorities. We devote significant resources to regularly maintain and update our systems and processes to protect the security of our computer systems, software, networks and other technology assets that store and access our customers’ information.
ASB is keenly aware of the constant security threats that affect financial institutions. As we continue to expand online access and tools for customers, we will face increased threats of data loss due to cyber-attack.
To safeguard ASB’s assets and customer accounts, ASB has adopted a robust information security program to monitor, detect and mitigate cyber-attacks. ASB has implemented administrative, physical and technical controls, including layers of firewalls and data security software, regular risk and security assessments, access control, monitoring, penetration testing, vendor engagement reviews and training.

The ASB Information Security Program is based, in part, on section 501(b) of the Gramm-LeachBliley Act, the associated Interagency Guidelines Establishing Standards for Safeguarding Customer Information and guidance provided by the Federal Financial Institutions Examination Council, National Institute of Standards and Technology’s Framework for Improving Critical Infrastructure Cyber Security (version 1.1), and the Center for Internet Security’s 20 Critical Security Controls.
Phishing continues to be a primary method of attack for unauthorized access to systems and information. Our teammates receive regular training on how to protect information and avoid social engineering attacks. Our information security team routinely tests our teammates’ knowledge by sending out fake emails and attempts at phone-based social engineering.
111 Decarbonization 1 Economic Health & Affordability 2 Reliability & Resilience 3 Secure Digitalization 4 Diversity, Equity & Inclusion 5 Employee Engagement 6 Climate-Related Risks & Opportunities 7 PRIORITY AREAS
4

PACIFIC CURRENT QUANTITATIVE HEI HAWAIIAN ELECTRIC AMERICAN SAVINGS BANK < CONTENTS
Pacific Current
Pacific Current was founded in 2017 to further advance HEI’s mission to be a catalyst for a better Hawai‘i.
We invest in infrastructure solutions to accelerate Hawai‘i’s sustainability goals in a socially, economically and environmentally friendly way. We believe sustainable infrastructure is key to tackling three central challenges facing Hawai‘i: dependence on imported oil, inequitable access to clean technology solutions and the effects of climate change.
Pacific Current is uniquely positioned to help Hawai‘i meet its sustainability goals in the competitive markets. We apply new business models, technology and innovation to create positive impact. And we have the access to capital and local relationships needed to help Hawai‘i achieve a more sustainable future.

Decarbonization (and beyond)
Pacific Current centers its decarbonization and environment-related strategies in the following areas:
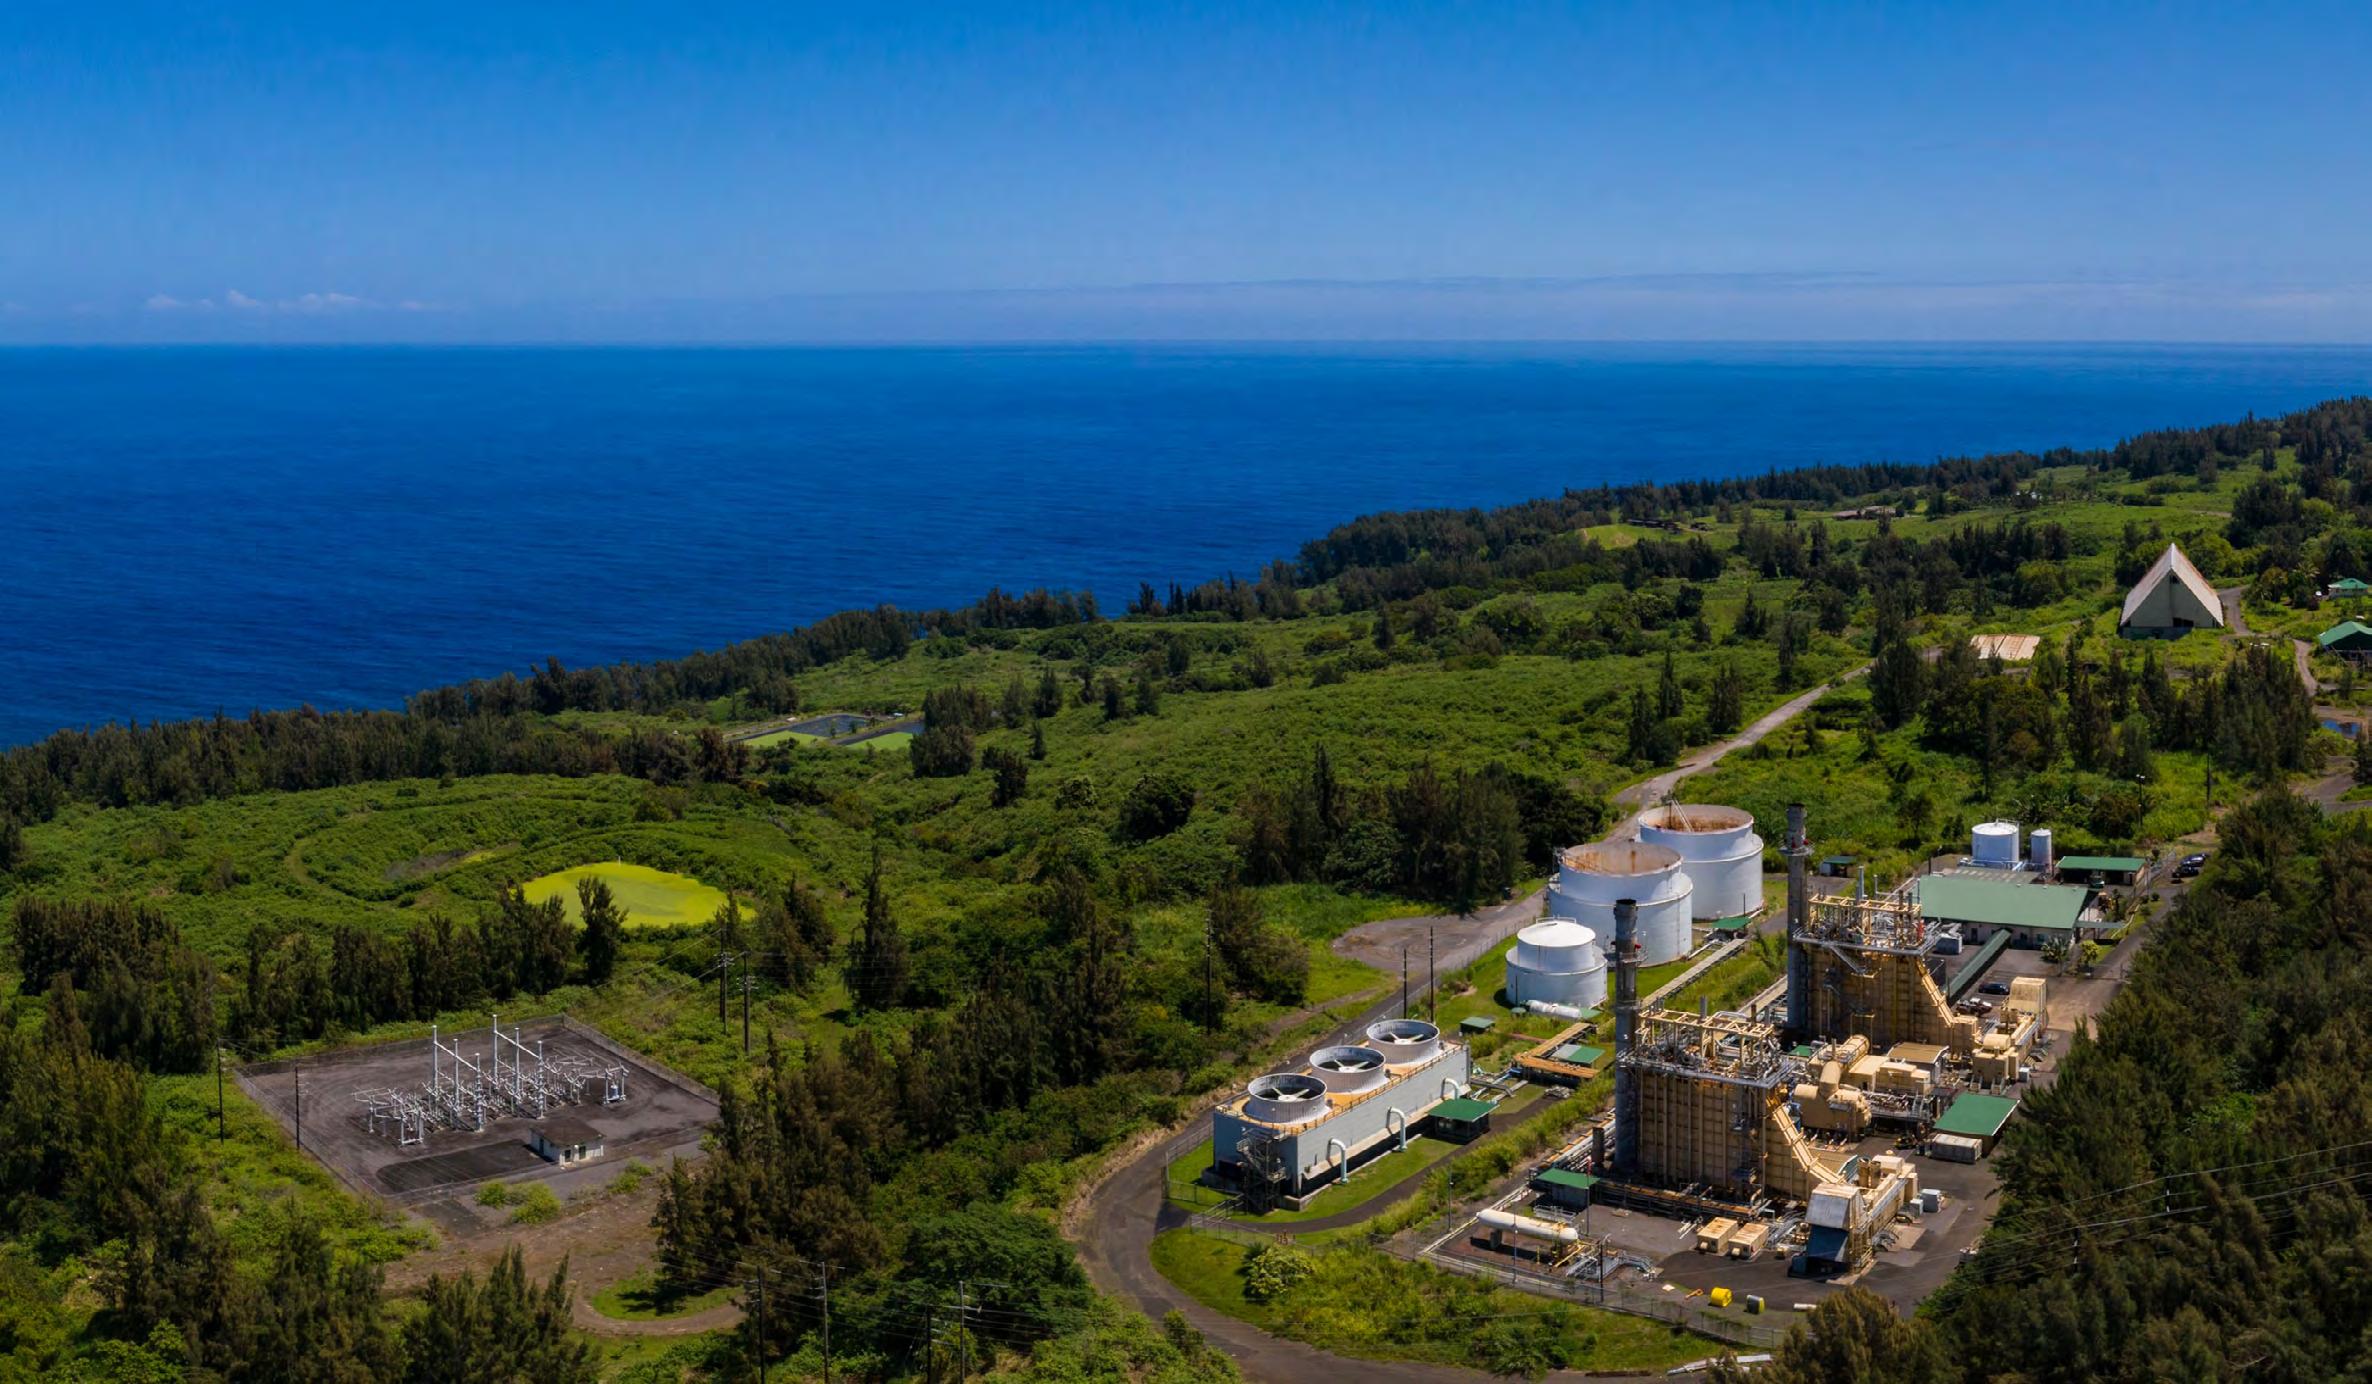
Clean Energy. Customer-sited renewable resources will play a critical role in reaching Hawai‘i’s 2045 clean energy goals as a complement to utility-scale solar projects. Pacific Current pursues development of and investment in customer-sited renewable energy systems. We install, own and maintain power generation systems and make clean energy available under PPAs without the customer needing to bear the upfront capital improvement costs. We also invest in utility-scale clean energy projects where permitted consistent with state law and regulatory guidance.
Zero-Emission Transportation. With over half of Hawai‘i’s energy sector GHG emissions stemming from transportation, and ground transportation accounting for the largest portion of transportation emissions,26 the transition to zero-emission vehicles is a key part of our decarbonization agenda. Through our joint venture with EverCharge Inc., we’re bringing affordable power-optimized EV charging solutions to Hawai‘i to encourage Hawai‘i drivers to choose zero-emission vehicles in lieu of petroleum-fueled cars, trucks and buses.
Sustainable Agriculture. Pacific Current is exploring partnerships and opportunities to introduce new technologies and solutions to build out the food value chain and increase local food production in ways that consider Hawai‘i’s limited land resources and make agriculture production more economically compelling and sustainable.
114 PACIFIC CURRENT QUANTITATIVE HEI HAWAIIAN ELECTRIC AMERICAN SAVINGS BANK < CONTENTS
1
Pacific Current pursues development of and investment in customer-sited renewable energy systems.”
Carbon Sequestration. By 2045, Hawai‘i seeks to sequester more atmospheric carbon and greenhouse gases than emitted within the state. Pacific Current wholeheartedly supports this goal and is exploring market-based business models to scale-up reforestation, conservation and carbon sequestration. We believe that improvements in agriculture, aquaculture, and land use practices that would promote increased greenhouse gas sequestration can go hand in hand with successful business ventures and solid economic returns for our shareholders.

Water Stewardship & Waste Diversion. Pacific Current recognizes water as a precious resource that must be responsibly managed. Via our partnership with Wastewater Alternatives and Innovation (WAI) and Cambrian Innovation, we are evaluating opportunities to deploy distributed wastewater treatment solutions that enable water reuse and production of renewable natural gas. We believe that we must take advantage of technological advancement in water stewardship to provide cost-effective and efficient results.
The Circular Economy. Hawai‘i is dealing with challenging waste management issues as many landfills face impending closure. Pacific Current is exploring ways to increase recycling, reuse, resource-saving product development and other sharing models.
Economic Health & Affordability
Across industries, new technologies are shifting the nature of work. The emergence of cost-effective renewables is playing a major role in this disruption, creating new demand for workers in “clean energy” – which includes renewable energy, energy efficiency, grid modernization, storage, clean fuels and zero-emission vehicles. On average, workers in the “clean energy” sector earn 25% more than the national median wage.27 Pacific Current’s projects and asset portfolio drive employment of these types of skilled jobs, which can help drive economic growth and prosperity. In doing so, we strive to encourage people who call Hawai‘i home to remain in Hawai‘i, and also entice people who left Hawai‘i for other opportunities to consider returning to the state.
Our projects often involve no upfront cost and result in reduced operating expenses for our customers. Examples of affordable customer solutions we deploy include solar+storage, onsite wastewater treatment, anaerobic digestion and renewable natural gas combined heat and power. Moreover, we seek to provide these solutions to segments of the community that have been traditionally underrepresented or hard to reach. One example of this is our Koa‘e Workforce Housing solar plus battery energy storage project on Kaua‘i Island.
115 Decarbonization 1 Economic Health & Affordability 2 Reliability & Resilience 3 Secure Digitalization 4 Diversity, Equity & Inclusion 5 Employee Engagement 6 Climate-Related Risks & Opportunities 7 PRIORITY AREAS
2
Our projects often involve no upfront cost and result in reduced operating expenses for our customers.”
Reliability & Resilience
Reliability and resilience are critical given the increased frequency and severity of weather events and risk of sea-level rise. A number of Pacific Current’s “behind the meter” projects incorporate battery energy storage systems. These systems provide our customers additional resiliency and the ability to optimize their energy usage.
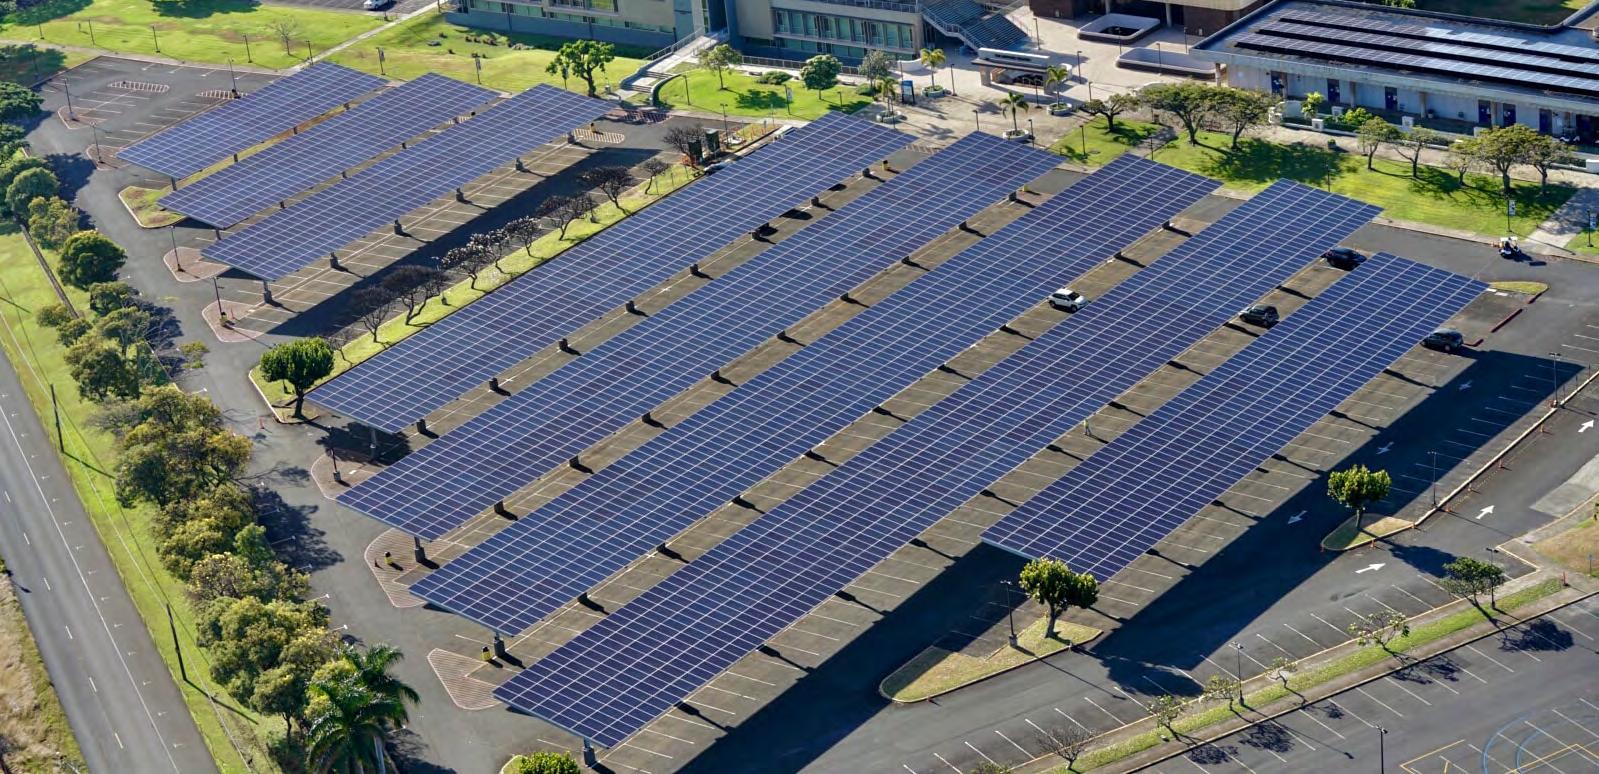
Secure Digitalization
The proliferation of digital technologies and real-time data provide a foundation for optimizing the performance of our projects, many of which are digitally monitored 24x7. This enables our team to proactively address operational issues and optimize our ongoing maintenance efforts.
Diversity, Equity & Inclusion
Within our core team, Pacific Current supports employment policies that ensure fair labor practices and a culture of openness and diversity. We believe that our differences not only make us each uniquely special, but also make us collectively stronger, more collaborative and able to make better long-term decisions. Several examples of this in practice are Pacific Current’s policies to help its employees achieve work-life balance and pursue personal family goals (e.g., paid maternity and family leave and generous rollover of PTO).
More broadly with our communities and partners, our experience has taught us that increasing the adoption of innovative infrastructure solutions is best received in an atmosphere of mutual respect and understanding of the differences between all stakeholders. Given Hawai‘i’s rich and diverse history, we believe that our projects can be most effective when proactively incorporating a broad array of viewpoints and cultural and community perspectives.
116 PACIFIC CURRENT QUANTITATIVE HEI HAWAIIAN ELECTRIC AMERICAN SAVINGS BANK < CONTENTS
3 4 5
Employee Engagement
Employee engagement is a critical factor for Pacific Current. We operate with a small, tight-knit team and strive to have our employees be passionate, energetic and committed to our work and our mission. We accomplish that by maintaining a culture of openness and diversity, and by supporting employees’ ability to achieve work-life balance and pursue both personal and professional goals by offering flexible work schedules and competitive compensation and benefits.
Climate-Related Risks & Opportunities
The impacts of climate change — particularly sea-level rise and increased frequency of weather-related disasters — present significant risk to Hawai‘i’s economy and people.
In 2020 the Pacific International Center for High Technology Research (PICHTR) and the Hawai‘i Philanthropy Forum developed a sea-level rise adaptation survey to gather relevant information and to learn about the barriers pertaining to Hawai‘i sea-level rise adaptation amid COVID-19. A major gap in implementing climate-related solutions — as pointed out by the survey — is access to long-term climate adaptation funding. As a long-term owner and operator of sustainable infrastructure, Pacific Current seeks to help close this gap from a local perspective.
Stakeholder Engagement
As an investor, owner and manager of long-term infrastructure assets, Pacific Current is committed to the communities we serve. To build a relationship of trust with community stakeholders, we proactively provide information on our projects and ensure open, continuous communication. In support of our community, we have proudly contributed to vital initiatives that provide access to education, workforce training and food to populations in need. Pacific Current team members also serve on several local non-profit boards, where we are helping our communities become more resilient and prosperous.
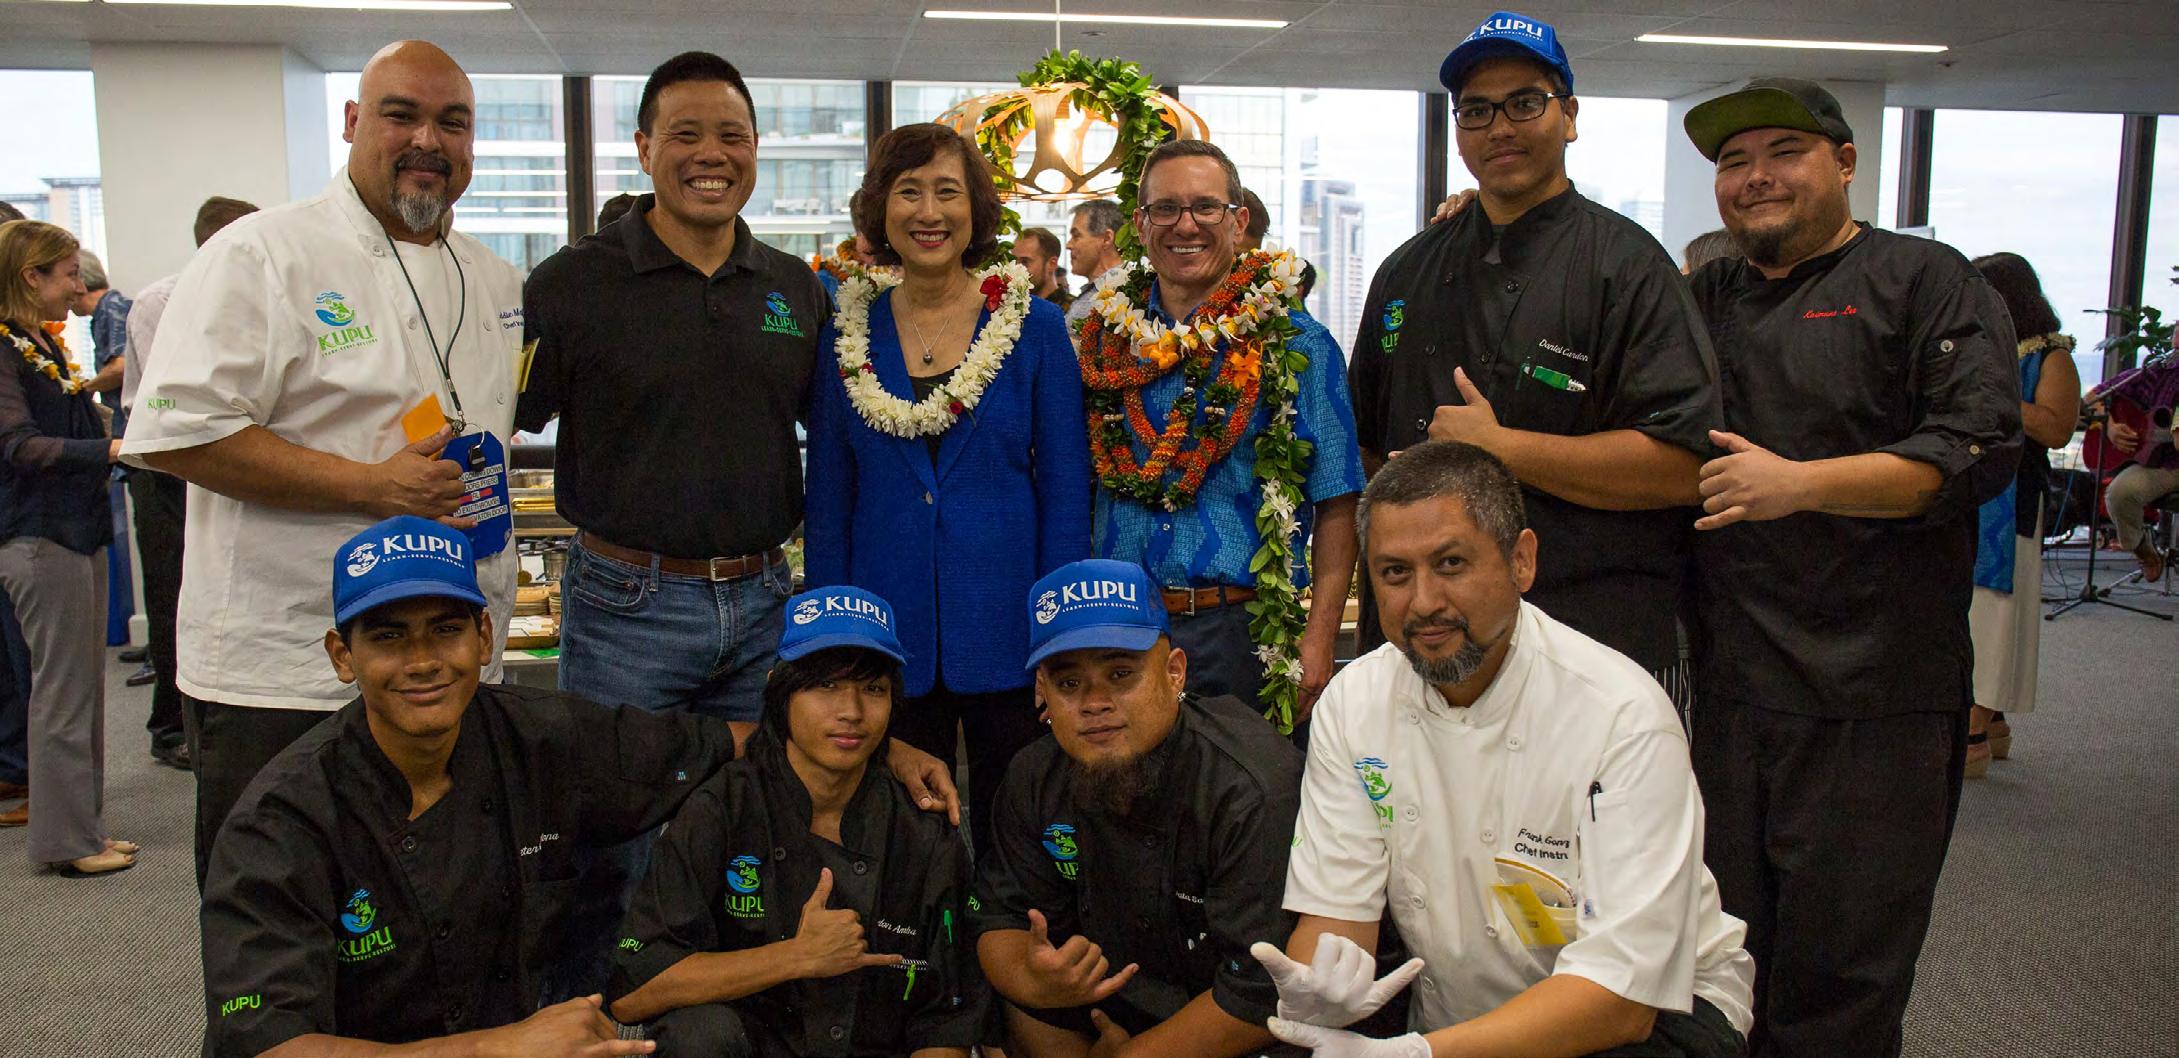
117 Decarbonization 1 Economic Health & Affordability 2 Reliability & Resilience 3 Secure Digitalization 4 Diversity, Equity & Inclusion 5 Employee Engagement 6 Climate-Related Risks & Opportunities 7 PRIORITY AREAS
6 7
As an investor, owner and manager of long-term infrastructure assets, Pacific Current is committed to the communities we serve.”
Appendix
GHG Inventory Methodology
Utility Categories
Stationary Combustion
Mobile Combustion
For all power plant fuel combustion, associated emissions were estimated using factors including fuel carbon content, measured/default heating values, and default emissions factors.
Fuel consumption data was used to estimate CO2 emissions, vehicle mileage data was used to estimate CH4 and N2O emissions.
SF 6 Fugitives
O‘ahu: As reported in accordance with 40 Code of Federal Regulations (CFR) Part 98 Mandatory Greenhouse Gas Reporting, Subpart DD Electrical Transmission and Distribution Equipment Use Report and Global Warming Potential from the UN IPCC AR5. Maui County and Hawai‘i Island: Excluded from this analysis, expected to be included in future reports.
Purchased Electricity for Resale
Stationary Fuel
Mobile Fuel
Employee Commuting
Business Travel
Supplier-specific approach using site-specific data and Environmental Protection Agency (EPA) Facility Level Information on GreenHouse gases Tool (FLIGHT) database. Assumes all purchased electricity was re-sold.
Supplier-specific method; includes upstream, midstream & transportation emissions for all fuel types w/ exception of propane.
Supplier-specific method; includes upstream & midstream emissions for biodiesel and clear diesel.
Based on average (e.g., national) data on commuting patterns, adjusting for remote work percentages in 2020 and 2021.
Spend-based method in which business travel spend is used to estimate emissions.
American Savings Bank / Pacific Current / HEI Categories
Mobile Combustion
Fugitives
Purchased Electricity
Fuel consumption data was used to estimate CO2 emissions, vehicle mileage data was used to estimate CH4 and N2O emissions.
Associated emissions were calculated per Greenhouse Gas Protocol guidance, estimating an upper bound refrigerant leakage rate that is 10% of the total HVAC unit capacity. Office square footage was also used to estimate HVAC capacity.
Associated emissions were calculated per EPA guidance using office space electricity consumption and EPA region-specific emissions factors.
CO2e figures have been calculated using global warming potentials from the UN IPCC 5th Assessment Report (AR5).
Sources of emissions factors used in analysis include:
UN IPCC AR5
EPA Center for Corporate Climate Leadership
EPA eGRID
EPA Inventory of US Greenhouse Gas Emissions
EPA US Environmentally-Extended Input-Output Models
The Climate Registry
Analysis from Par Refinery, Pacific Biodiesel, and ecoinvent
118
Endnotes
1 Referred to in "Hawaii Clean Energy Initiative", January 2018, NREL, as “the most aggressive clean energy goals in the nation.”
2 U.S. Energy Information Administration (EIA), EIA Form 861 (2020).
3 City and County of Honolulu Climate Change Commission, Sea Level Rise Guidance (2018).
4 E.g., GHG Protocol World Resources Institute (WRI)/World Business Council for Sustainable Development (WBCSD) Greenhouse Gas Protocol Corporate Accounting and Reporting Standard, ISO 14064 – Greenhouse Gases-Part 1, The Climate Registry Electric Power Sector Protocol, Version 1.0, and Edison Electric Institute and Electric Power Research Institute guidance.
5 A significant portion of our utility GHG emissions were disclosed in our prior two ESG reports. This year’s GHG inventory includes additional Scope 1 and 3 categories for the utility and includes Scope 1 and 2 categories for our non-utility entities. This inventory has been developed alongside a team of experienced third-party advisors. For purposes of this inventory, calculations of previously disclosed utility emissions have been updated to reflect more recent global warming potentials and expanded to include small generation sources.
6 Based on EPA eGRID gross loss factor of 5.6%.
7 Includes whole system (company-owned and independent power producers) generation stack emissions.
8 Some differences may exist between GHG data in this report and GHG data previously disclosed elsewhere (e.g., GHG emissions scorecard), as the utility is in the process of updating its historical data to align with more recent UN IPCC global warming potentials.
9 Biomass combustion emissions of CH4 and N2O are reported and included alongside fossil fuel emissions.
10 National Institute of Building Sciences, Natural Hazard Mitigation Saves (2019).
11 “Transportation emissions have two major sources, ground transportation (cars and trucks) and aviation, with marine transportation contributing minimally to overall emissions. Contributing to more than half of statewide emissions in 2017, transportation emissions are projected to remain relatively stable through 2030,” The Economic Research Organization at the University of Hawai‘i (UHERO), 2021.
12 RPS goals established in 2015 were referred to by the US Dept of Energy as "the most ambitious clean energy target in the country" at the time
13 Hawaii Greenhouse Gas Emissions Report for 2017: Final Report.
14 As of January 2022.
15 Integrated Grid Planning Forecast.
16 Hawai‘i Wildfire Management Organization.
17 However, Hawai‘i’s average residential electricity bills are helped by lower-than-average electricity usage. Based on 2020 average annual residential customer kWh sales data from the U.S. Energy Information Administration, the average Hawai‘i home used 40% less electricity than the national average.
18 Racially diverse defined as all races/ethnicities that are not ‘White.’
19 Executives includes EEO-1 category 1.1 - Executive/Sr. Level Officials
20 Leaders includes EEO-1 category 1.2 - First/Mid-Level Officials
21 All Workforce includes EEO-1 categories 1.1 - Executive/Sr. Level Officials, 1.2 - First/Mid-Level Officials, 2 - Professionals,
3 - Technicians, 4 - Sales Workers, 5 - Administrative Support Workers, 6 - Craft Workers, 7 - Operatives, 8 - Laborers and Helpers, 9 - Service Workers
22 Racially diverse defined as all races/ethnicities that are not ‘White.’
23 Executives includes EEO-1 category 1.1 - Executive/Sr. Level Officials
24 Leaders includes EEO-1 category 1.2 - First/Mid-Level Officials
25 All Workforce includes EEO-1 categories 1.1 - Executive/Sr. Level Officials, 1.2 - First/Mid-Level Officials, 2 - Professionals, 3 - Technicians, 4 - Sales Workers, 5 - Administrative Support Workers, 6 - Craft Workers, 7 - Operatives, 8 - Laborers and Helpers, 9 - Service Workers
26 Hawaii Greenhouse Gas Emissions Report for 2017: Final Report.
27 Greentech Media: Clean Energy Can Power America’s Economic Recovery.
119

< CONTENTS HEI HAWAIIAN ELECTRIC AMERICAN SAVINGS BANK PACIFIC CURRENT QUANTITATIVE <

Electric
Savings Bank
Electric
SASB Index Hawaiian
American
EEI ESG Metrics Hawaiian
Hawaiian Electric
SASB Index: Electric Utilities and Power Generators Standard
Activity Metrics
Number of: (1) residential, (2) commercial, and (3) industrial customers served
OF ACCOUNTS AT YEAR END
Total electricity delivered to: (1) residential, (2) commercial, (3) industrial, (4) all other retail customers, and (5) wholesale cus tomers 1
ANNUAL NET ENERGY PROVIDED (MW h )
122 QUANTITATIVE HEI HAWAIIAN ELECTRIC AMERICAN SAVINGS BANK PACIFIC CURRENT < CONTENTS
IF-EU-000.A NUMBER
Accounts 2017 2018 2019 2020 2021 Residential 406,241 407,505 409,689 412,484 414,713 Commercial 55,328 54,888 55,077 54,861 55,201 Industrial 656 696 700 694 698 Total 462,225 463,089 465,466 468,039 470,612
IF-EU-000.B
Accounts 2017 2018 2019 2020 2021 Residential 2,334,500 2,410,800 2,439,300 2,525,400 2,491,600 Commercial 2,912,600 2,852,900 2,833,500 2,476,800 2,595,200 Industrial 3,443,300 3,425,100 3,467,200 3,118,000 3,174,300 Total 8,690,400 8,688,800 8,740,000 8,120,200 8,261,100 1 All customer categories are covered by (1), (2) and (3). 2 T&D line lengths for O‘ahu have been updated as of 2021. T&D line lengths for Maui County and Hawai‘i Island are as of 2020.
Length of transmission and distribution lines 2 IF-EU-000.C Service Territory Line Classification Total (miles) Total (kilometers) O‘ahu Transmission 781 1,257 Distribution 2,510 4,039 Maui County Transmission 243 391 Distribution 1,157 1,862 Hawai‘i Island Transmission 591 951 Distribution 1,765 2,840 Total Transmission 1,615 2,599 Distribution 5,432 8,742
Total electricity generated, percentage by major energy source, percentage in regulated markets
All of the electricity generation listed above is in a regulated market
This metric is not applicable to Hawai‘i, as Hawai‘i does not have a wholesale electricity market. Hawaiian Electric purchases energy directly from independent power producers (IPPs). The information regarding the amount of MWh purchased from IPPs can be found in footnote 2 to table IF-EU-000.D (see below).
1 Minor methodology differences regarding renewable components of certain generators and timing of underlying reporting account for differences between the SASB and EEI ESG reported metrics and the Form 10-K.
MWh GENERATED BY SOURCE AND OWNER
3 2019 and 2020 generation amounts reflect the fact that the Puna Geothermal Venture (PGV) plant was out of service from May 2018 until late 2020. The loss of firm power from PGV generation was offset by firm generation from petroleum. PGV returned to service with firm capacity of 13 MW in the first quarter of 2021 and ramped up to 23.9 MW in the second quarter and continued to provide 23.9 MW for the remainder of 2021.
123
IF-EU-000.D TOTAL SYSTEM GENERATION – BY SOURCE 1, 2 2019 2020 2021 MWh % MWh % MWh % CONVENTIONAL Coal 1,316,032 12.7% 1,183,187 12.0% 1,105,070 11.0% Natural Gas 0 0.0% 0 0.0% 0 0.0% Nuclear 0 0.0% 0 0.0% 0 0.0% Petroleum 3 6,569,453 63.4% 5,867,139 59.6% 5,793,779 57.5% Total Conventional 7,885,485 76.1% 7,050,327 71.6% 6,898,849 68.5% RENEWABLE Biomass / Biogas Biodiesel 59,996 0.6% 74,507 0.8% 71,780 0.7% Waste-to-energy (biomass) 414,357 4.0% 369,239 3.8% 366,365 3.6% Geothermal 3 - 0.0% 9,640 0.1% 183,391 1.8% Hydroelectric 35,414 0.3% 28,594 0.3% 43,050 0.4% Solar Utility-Scale 218,058 2.1% 398,376 4.0% 390,353 3.9% Customer-sited 1,224,579 11.8% 1,325,750 13.5% 1,418,036 14.1% Wind 527,887 5.1% 594,569 6.0% 701,124 7.0% Other 0 0.0% 0 0.0% 0 0.0% Total Renewable 2,480,290 23.9% 2,800,675 28.4% 3,174,100 31.5% Total MWh generated 10,365,775 9,851,001 10,072,948
2
Total wholesale electricity purchased IF-EU-000.E
Utility-Owned IPP-Owned Customer-Sited Oil 4,429,234 1,364,545 Coal - 1,105,070 Biomass - 366,365 Geothermal - 183,391 PV and Solar Thermal 37,462 352,891 Hydro 9,046 34,004 Wind - 701,124 Biofuels 25,296 46,485 Customer-Sited Grid-Connected 1,418,036
2021
Greenhouse Gas Emissions & Energy Resource Planning
Key:
AES = AES Hawai‘i
CIP = Campbell Industrial Park Generating Station
DOH = State of Hawai‘i Department of Health
Hamakua Energy = owned by Pacific Current
HAR = Hawai‘i Administrative Rules
KPLP = Kalaeloa Partners
PGV = Puna Geothermal Venture
Gross global Scope 1 emissions
IF-EU-110a.1
Hawaiian Electric’s greenhouse gas (GHG) emissions from power generation (stationary combustion) are calculated using fuel consumption data (collected by fuel meters, fuel purchase receipts, tank gauging), carbon content in fuel (determined by laboratory analysis), default emission factors from 40 CFR Part 98 Subpart C, and Global Warming Potentials (GWPs) from the Intergovernmental Panel on Climate Change (IPCC) Fifth Assessment Report (AR5). Hawaiian Electric’s GHG emissions from its mobile fleet (mobile combustion) are calculated using fuel consumption data, vehicle mileage, and emission factors from the EPA Center for Corporate Climate Leadership. Three (HFCs, PFCs and NF3) of seven GHGs under the Kyoto Protocol are not generated by Hawaiian Electric. The GHG emissions presented below exclude biodiesel CO2 emissions and include biodiesel CH4 and N2O, which is consistent with the State of Hawai‘i’s GHG Emissions regulations (HAR, Title 11, Chapter 60.1, Subchapter 11), in which biodiesel is assumed to be 100% plant-based and to not include any fossil fuels. Disclosures are aligned with regulatory reporting and exclude emissions from units and emergency generators not under covered source permits, which represent 0.04% of total GHGs.
SCOPE 1 GREENHOUSE GAS EMISSIONS (IN METRIC TONS CO 2e ) AND INTENSITY
The figures in this chart differ from those published in this chart in our prior ESG reports. In our prior ESG reports, GHG emissions from IPP-owned generation were included in scope 1. Beginning in this report, emissions from IPP-owned generation are excluded from this chart, as they are now categorized as scope 3 emissions for the utility. See pages 32-35 for details of our GHG emissions inventory by emissions scope.
1 Includes CO²e emissions from Hawaiian Electric power generation facilities and mobile fleet (mobile combustion) on O‘ahu, Maui County and Hawai‘i Island and its O‘ahu transmission and distribution (T&D) sulfur hexafluoride (SF6) emissions from gas insulated equipment. Excludes biogenic CO² emissions. Maui County and Hawai‘i T&D SF6 emissions will be included in future HEI ESG reports.
2 Intensities in g/kWh are calculated by dividing Scope 1 emissions by total Hawaiian Electric owned generation.
124 QUANTITATIVE HEI HAWAIIAN ELECTRIC AMERICAN SAVINGS BANK PACIFIC CURRENT < CONTENTS
Entity 2015 Baseline 2019 2020 2021 Preliminary Total Scope 1 (metric tons CO2e)1 4,097,705 4,056,115 3,740,976 3,689,982 Intensity (g/kWh)2 800 816 808 820
Under the State of Hawai‘i Act 234 and HAR Title 11 Chapter 60.1, Subchapter 11 — Greenhouse gas (GHG) emission regulations, Hawaiian Electric and GHG Emission Reduction Plan (ERP) partners (AES, KPLP, and Hamakua Energy) were required to reduce GHG emissions by 16% below partnership’s cumulative 2010 emission levels by 2020, achieved a 23% reduction in 2020, and continued to meet this reduction requirement in 2021.
Under the covered source permit for the Schofield Generating Station, emissions of CO2 generated from the facility are limited to 1,700 Ib/MWhe, gross, on a 12-month rolling average basis. In 2021, Hawaiian Electric reported 1,336 lb/MWhe of CO2 emissions on a 12-month rolling average basis, or equivalent to 79% of the permit limit. The covered source permit allows use of diesel, biodiesel and natural gas as fuels. The CO2 limit applies to emissions from burning any of these fuels, including biogenic and non-biogenic emissions.
Percentages in the table below represent the GHG emissions affected by emissions limitations divided by total gross global Scope 1 emissions.
125
of gross global Scope 1 emissions covered under emissions-limiting regulations IF-EU-110a.1
Percentage
PERCENTAGE OF SCOPE 1 EMISSIONS COVERED UNDER EMISSIONS-LIMITING REGULATIONS 2015, 2019 THROUGH 2021 2015 Baseline 2019 2020 2021 Percentage of Scope 1 emissions covered under emissions-limiting regulations(%)1 99.3% 99.2% 99.2% 91.1%
1 Calculated as the total amount of gross global Scope 1 GHG emissions (CO²e) that are covered under emissions limiting-based regulations divided by the total amount of gross global Scope 1 GHG emissions (CO²e) Differences from percentages disclosed in this chart in prior year ESG reports are due to updated methodology for determining Scope 1 emissions described on page 124
Percentage of gross global Scope 1 emissions covered under emissions-reporting regulations IF-EU-110a.1
Under the EPA GHG Mandatory Reporting Program, an emissions-reporting based regulation that requires disclosure of GHG emissions data, Hawaiian Electric has provided its data annually since 2011, starting with reporting year 2010 data, for facilities that emit 25,000 metric tons or more of CO2e, not including biogenic CO2
The State of Hawai‘i DOH requires all covered source facilities to report GHG emissions annually for the purpose of emissions fees in accordance with HAR, Title 11, Chapter 60.1, Subchapter 6. The emissions fees are assessed following the fee schedule set forth by the DOH.
Percentages in the table below represent the GHG emissions reported under the EPA GHG Mandatory Reporting Program divided by the total gross global Scope 1 emissions.
PERCENTAGE OF SCOPE 1 EMISSIONS COVERED UNDER EMISSIONS-REPORTING REGULATIONS 2015, 2019 THROUGH 2021
1 Calculated as the total amount of gross global Scope 1 GHG emissions (CO²e) that are covered under emissions reporting-based regulations divided by the total amount of gross global Scope 1 GHG emissions (CO²e). Differences from percentages disclosed in this chart in prior year ESG reports are due to updated methodology for determining Scope 1 emissions described on page 124
126 QUANTITATIVE HEI HAWAIIAN ELECTRIC AMERICAN SAVINGS BANK PACIFIC CURRENT < CONTENTS
2015 Baseline 2019 2020 2021 Percentage of Scope 1 emissions covered under emissions-reporting regulations (%)1 99.5% 99.4% 99.3% 99.2%
Greenhouse gas (GHG) emissions associated with power deliveries
IF-EU-110a.2
The GHG emissions presented below are total GHG emissions reported from Hawaiian Electric generation, transmission, distribution, and IPPs. Hawaiian Electric transmission and distribution operations do not generate HFC, PFC and NF3 emissions, three of the seven GHGs under the Kyoto Protocol. Disclosures are aligned with regulatory reporting.
GHG EMISSIONS ASSOCIATED WITH POWER DELIVERIES IN METRIC
Discussion of long-term and short-term strategy or plan to manage Scope 1 emissions, emissions reduction targets, and an analysis of performance against those targets IF-EU-110a.3
Please see discussion on pages 58-69 of this report.
(1) Number of customers served in markets subject to renewable portfolio standards (RPS) and (2) percentage fulfillment of RPS target by market
Hawaiian Electric provides electricity to 95% of the population of the State of Hawai‘i. Our service territory includes the islands of O‘ahu, Maui, Moloka‘i, Lāna‘i and Hawai‘i Island. Across our service territory, we had a total of 470,612 customers as of 12/31/21. As our entire service territory is in Hawai‘i, 100% of our customers are served in markets subject to our state’s renewable portfolio standard (RPS) law. (Note: Kaua‘i is served by the Kaua‘i Island Utility Cooperative.)
The State of Hawai‘i’s RPS law is one of the most aggressive in the nation, targeting 100% RPS by 2045, with interim goals of 30% by 2020, 40% by 2030 and 70% by 2040. In 2021 we achieved a consolidated RPS of 38%.
For more discussion on RPS, please refer to pages 58 and 63 of this report.
127
IF-EU-110a.4
TONS CO 2e 1 Emissions Source 2015 Baseline 2019 2020 2021 Preliminary Hawaiian Electric Generation (metric tons) 4,085,494 4,042,889 3,732,129 3,679,601 Hawaiian Electric Transmission and Distribution (metric tons) 6,204 7,283 3,710 5,762 IPP (metric tons) 3,012,754 2,720,829 2,376,162 2,337,351 Total GHG Emissions in metric tons 7,104,453 6,771,000 6,112,001 6,022,715
1 Final data for 2021 for IPPs are not yet available at EPA FLIGHT. 2021 emissions data for IPPs are estimated using 2020 emissions intensity from emissions data published in EPA FLIGHT and the generation supplied to Hawaiian Electric. 2020 IPP data has been updated to reflect final data at EPA FLIGHT. Difference in 2019 data reported previously is driven by refinements in methodology to more accurately calculate this year’s GHG inventory.
Air Quality
The Environmental Division monitors and reports emissions in accordance with applicable environmental regulations, which include certain emissions from stationary sources covered under Hawaiian Electric’s Covered Source Permits. Environmental regulations do not currently require monitoring or recording of emissions data for mobile sources, office buildings and transportation fleets. The following air quality data does not include emissions from IPPs.
The emissions of SOX from conventional combustion systems are predominantly in the form of sulfur dioxide (SO2). According to the EPA, SO2 is the component of greatest concern and is used as the indicator for the larger group of gaseous sulfur oxides (SOX).
Rather than monitoring SOX, Hawaiian Electric monitors and reports SO2 as required by the company’s covered source permits and applicable regulations. We conservatively calculate SO2 emissions with the assumption that 100% of sulfur in fuel converts into SO2 using mass balance. Consistent with EPA’s statement, SO2 emissions alone are sufficient to demonstrate the level of SOX emissions from company-wide facilities.
SO2 emissions are calculated based on fuel consumption and sulfur content in fuel. SO2 emissions generated from the company’s covered source facilities are calculated and reported to the DOH to meet the annual emissions fees requirement.
emissions from Particulate Matter (PM 10)
TOTAL PM 10 EMISSIONS FROM HAWAIIAN ELECTRIC GENERATING FACILITIES FOR 2015, 2019
THROUGH 2021
The PM10 emissions presented above are consolidated PM10 emissions for all of the company’s covered source facilities. Historically, more than half of the company’s PM10 emissions come from Kahe and Waiau generating stations on O‘ahu. Emissions from Kahe and Waiau are measured using a combination of source testing and PM Continuous Emissions Monitoring System (“CEMS”). In 2019-2021, the PM10 emission rates recorded from Kahe and Waiau boilers were generally lower than 2015 due to better quality fuel, containing lower carbon residue. The boilers at the two plants are the only generating units subject to a PM limit (MATS) and the company has been demonstrating compliance with the MATS PM limit. PM10 emissions generated from other facilities are calculated and reported to the DOH to comply with the annual emissions fees requirement.
128 QUANTITATIVE HEI HAWAIIAN ELECTRIC AMERICAN SAVINGS BANK PACIFIC CURRENT < CONTENTS
Air emissions from NO X, excluding N 2O IF-EU-120a.1 TOTAL NO X EMISSIONS FOR HAWAIIAN ELECTRIC GENERATING FACILITIES FOR 2015, 2019 THROUGH 2021 NO X 2015 Baseline 2019 2020 2021 Metric tons 13,780 12,808 11,359 10,712 Short tons 15,190 14,118 12,521 11,808 Air emissions from SO X IF-EU-120a.1
TOTAL SO 2 EMISSIONS FROM HAWAIIAN ELECTRIC GENERATING FACILITIES FOR 2015, 2019
2021 SO 2 2015 Baseline 2019 2020 2021 Metric tons 12,149 12,739 11,663 11,368 Short tons 13,392 14,042 12,856 12,531 Air
IF-EU 120a.1
THROUGH
PM 10 2015 Baseline 2019 2020 2021 Metric tons 1,005 717 672 672 Short tons 1,108 790 741 741
The lead emissions presented above are consolidated for all the company’s covered source facilities. Lead emissions trend in proportion to fuel consumption and electric generation. Lead emissions are calculated and reported to the DOH to comply with the annual emissions fees requirement.
Percentage of each pollutant (NO X, SO X , PM 10, Pb, Hg)
in or near areas of dense population
IF-EU-120a.1
SASB defines an "area of dense population” as “an area with a densely settled core and contiguous territory that together have a minimum population of 50,000.” It considers a facility to be "near” such an area if it is within 49 km of the area of dense population. Hawaiian Electric’s facilities on O‘ahu, Maui, and Lāna‘i meet the criteria of facilities that are within 49 km of an area with a minimum population of 50,000 persons. The assessment of population follows the list of urbanized areas based on U.S. Census results from 2010, available in Federal Register, Vol. 77, No. 59, Part IV.
The data in the table below represents the percentage of pollutants generated from Hawaiian Electric facilities on O‘ahu, Maui County and Hawai‘i Island that were released in or near densely populated areas.
Hawaiian Electric operates in compliance with the requirements of multiple federal and state environmental regulations, including numerous rules under the Clean Air Act.
1 As reported to the EPA in the Toxics Release Inventory (TRI) report, and only includes facilities that exceed the TRI reporting threshold. Since 2014, only Kahe triggered the reporting threshold. 2021 data is not yet available.
2 As reported in the annual emission fees report to the DOH Clean Air Branch (CAB) for the purpose of assessing emission fees. Mercury is not used in the fees assessment, but the mercury emissions are reported to the DOH as part of the emissions fees report.
3 The mercury emissions presented above are consolidated for all of the company’s covered source facilities. Mercury emissions are proportional to fuel consumption and electric generation. Mercury emissions are calculated and reported to the DOH annually as required to meet the emissions reporting requirement.
129
Lead (Pb) IF-EU-120a.1 TOTAL LEAD EMISSIONS FROM HAWAIIAN ELECTRIC GENERATING FACILITIES Lead 2015 Baseline 2019 2020 2021 Metric tons 0.29 0.31 0.32 0.32 Short tons 0.32 0.34 0.35 0.36
Air emissions from
Mercury (Hg) IF-EU-120a.1 TOTAL MERCURY EMISSIONS FROM HAWAIIAN ELECTRIC GENERATING FACILITIES Measure 2015 Baseline 2019 2020 2021 TRI (lbs)1 15.7 14.3 14.5 Data available June 2022 DOH CAB (lbs)2 45.04 46.14 42.57 42.27 DOH CAB (Metric tons)3 0.0204 0.0209 0.0193 0.01917
Air emissions from
PERCENTAGE OF POLLUTANTS IN OR NEAR DENSE POPULATION Pollutant 2015 Baseline 2019 2020 2021 NOX 93 92 91 91 SO2 83 79 78 80 PM10 91 83 82 83 Pb (Lead) 87 85 75 75 Hg (Mercury) 87 86 83 85
Water Management
Total water withdrawn from all sources
water consumed in regions with high or extremely high baseline water stress
Degree of water stress is defined using the World Resources Institute’s Aqueduct Water Risk Atlas
Hawaiian Electric does not operate any facilities in regions with high or extremely high baseline water risk according to the “World Resources Institute Water Risk Atlas Tool, Aqueduct.” Thus, the percentage of water withdrawn and water consumed in regions with high or extremely high baseline water stress is zero.
Number of incidents of non-compliance associated with water quantity and/or quality permits, standards and regulations
In 2021 the company did not have any incidents of non-compliance that resulted in a formal enforcement action by the Hawai‘i Department of Health, the U.S. EPA, or other regulatory agency.
The company operates five facilities with Clean Water Act, National Pollutant Discharge Elimination System (NPDES) permits (Kahe, Waiau, Honolulu, Kahului and Mā‘alaea).
The company operates five facilities with Safe Drinking Water Act, Underground Injection Control (UIC) Permits for industrial discharges (CIP, Mā‘alaea, Keāhole, Hill and Puna).
The company maintains a Compliance Task Manager (CTM) to manage and track compliance with permit requirements and associated compliance activities.
1 2015 Brackish Water Use does not include Mā‘alaea Generating Station; information was not recorded until mid 2016.
2 Reclaimed water is used for NOX emissions control and make-up water for the Kahe and CIP generating units. Reclaimed water used for emissions control is lost through evaporation and the majority of the reclaimed water withdrawn is returned to the ocean or groundwater.
3 2015 Brackish Water Consumption does not include Keahole Generating Station; information was not recorded until mid 2016.
130 QUANTITATIVE HEI HAWAIIAN ELECTRIC AMERICAN SAVINGS BANK PACIFIC CURRENT < CONTENTS
IF-EU-140a.1 HAWAIIAN
THOUSAND
METERS (M ³ X 10
) 2015 Baseline 2019 2020 2021 Fresh Water 155,252 109,878 88,914 100,044 Brackish Water1 37,530 62,586 64,853 68,181 Sea Water 1,372,688 1,886,275 1,255,860 1,238,253 Reclaimed Water2 230 328 309 308
ELECTRIC WATER WITHDRAWAL IN
CUBIC
³
Total water consumed IF-EU-140a.1 HAWAIIAN ELECTRIC WATER CONSUMPTION IN THOUSAND CUBIC METERS (M ³ X 10 ³ ) 2015 Baseline 2019 2020 2021 Brackish Water Consumption³ 106 160 153 151 Fresh Water Consumption 0 0 0 0 Sea Water Consumption 0 0 0 0 Reclaimed Water2 230 328 309 308
(ii)
IF-EU-140a.1
Percentage of (i) water withdrawn and
IF-EU-140a.2
Description of water management risks and discussion of strategies and practices to mitigate those risks
For Hawaiian Electric, we use mainly non-potable water sources in our generation operations and comply with regulations to manage water withdrawals and discharges through applicable permits, such as the National Pollutant Discharge Elimination System (NPDES) and Underground Injection Controls (UIC).
In 2021, approximately 93% of the water we used came from non-potable sources such as the ocean and brackish water wells. At our Kahe and CIP facilities in West O‘ahu, we use reclaimed water from sewage treatment plants. The use of these non-potable water sources offsets the demand for higher-quality water and reduces water supply risk.
Over 99% of the water we use at our facilities (in our once through cooling systems) is later returned to groundwater or surface water. The less than 1% of the water consumed during power generation is primarily used in air emissions control systems and is not from fresh water or sea water sources.
One way we are mitigating water management risk while also replacing fossil fuel generation is by seeking renewable energy projects, such as solar-plus-storage and stand-alone storage, that do not need water resources to operate.
Coal Ash Management
Hawaiian Electric does not operate any coal-fired power plants and therefore we do not generate any hazardous coal ash. The only generation facility in our service territory that uses coal is owned and operated by a third-party independent power producer (IPP) that generates and sells power to Hawaiian Electric under a power purchase agreement (PPA). The PPA for that plant is scheduled to expire in September 2022, at which time there will be no more coal generation on our system. In 2021, the IPP’s coal plant provided 11% of our total electricity generated.
Energy Affordability
Average electric rate for residential, (i) commercial and (ii) industrial customers
131
IF-EU-140a.3
Amount of coal combustion residuals (CCR) generated, percentage recycled IF-EU-150a.1
IF-EU-240a.1 2021
INDUSTRIAL CUSTOMERS Customer O‘ahu Hawai‘i Island Maui Moloka‘i Lāna‘i Residential 32.47 37.92 34.85 38.84 41.75 Commercial "Small Power Use" Business 34.04 43.82 39.57 47.75 47.39 "Medium Power Use" Business 28.60 34.96 33.76 37.98 43.26 Industrial 27.12 31.11 31.70 30.95 40.61
AVERAGE RATES IN CENTS / PER KWH FOR RESIDENTIAL, COMMERCIAL AND
Typical monthly electric bill for residential customers for the first 500 kWh of electricity delivered / month
2019, 2020, AND 2021 SCHEDULE R, 500 k W h
Typical monthly electric bill for residential customers for the first 1000 kWh of electricity delivered / month
2019, 2020, AND 2021 SCHEDULE R, 1000 k W h
Number of residential customer electric disconnections for non-payment and percentage reconnected within 30 days
For more discussion on the company’s nonpayment programs and bill relief, please refer to “Helping Customers Manage Their Usage and Bills” on page 81 of this report.
Discussion of impact of external factors on customer affordability of electricity, including the economic conditions of the service territory
The affordability of energy is critical to Hawai‘i’s sustainable, clean energy future. We’re committed to providing affordable electricity for all of our customers. See discussion beginning on page 79 regarding factors that impact cost of electricity in Hawai‘i and ways that we are working to reduce costs.
132 QUANTITATIVE HEI HAWAIIAN ELECTRIC AMERICAN SAVINGS BANK PACIFIC CURRENT < CONTENTS
IF-EU-240a.2
Avg. 500 kWh O‘ahu Hawai‘i Island Maui Moloka‘i Lāna‘i 2019 $161.16 $185.66 $176.69 $202.30 $209.40 2020 $146.91 $170.03 $161.67 $168.60 $191.15 2021 $152.63 $175.73 $169.75 $178.23 $197.47
IF-EU-240a.2
Avg. 1000 kWh O‘ahu Hawai‘i Island Maui Moloka‘i Lāna‘i 2019 $313.58 $368.62 $349.99 $402.89 $415.53 2020 $285.14 $337.30 $318.52 $333.98 $377.57 2021 $296.58 $348.77 $334.68 $353.24 $390.22
IF-EU-240a.3 2021 RESIDENTIAL NON-PAY RECONNECTS Days To Reconnect O‘ahu % of Total Hawai‘i Island % of Total Maui County % of Total Grand Total % of Total by Days to Reconnect Less Than 30 Days 20 54% 7 41% 2 100% 29 52% More Than 30 Days 3 8% 1 6% 0 0% 4 7% Not Reconnected 14 38% 9 53% 0 0% 23 41% Grand Total 37 100% 17 100% 2 100% 56 100%
IF-EU-240a.4
Workforce Health & Safety
133 (1)
(3)
IF-EU-320a.1 2019 2020 2021 Total Case Incident Rate 2.17 1.34 1.52 Fatalities 0 0 0 Near miss frequency rate1 N/A N/A N/A 1
not currently track “near miss” data.
Total recordable incident rate (TRIR), (2) fatality rate and
near miss frequency rate (NMFR)
Hawaiian Electric does
End-Use Efficiency & Demand
Percentage of electric utility revenues from rate structures that are decoupled
Total Electric Utility Revenues include revenue items that are not included in Target Revenues and are collected through other recovery mechanisms, such as fuel and purchased power expenses (recovered through the Energy Cost Recovery Clause and the Purchased Power Adjustment Clause), demand side management and demand response programs (recovered through the IRP Cost Recovery and Renewable Energy Infrastructure Program surcharges) and revenue taxes. A small portion of Total Electric Utility Revenues consists of “other operating revenues” that are not directly from electricity sales and that represent Customer Service establishment fees, field collection charges, returned payment charges, late payment charges, rental income from utility property, including land, pole attachments and parking fees. On a consolidated basis for Hawaiian Electric, Hawai‘i Electric Light and Maui Electric, such “other operating revenues” were $26.4 million in 2020 and $32.1 million in 2021.
The company technically does not have a lost revenue adjustment mechanism. However, revenue losses that result from customer participation in the company’s distributed generation rate tariffs (net energy metering, customer grid supply, customer self-supply, smart export) are recovered through the decoupling mechanism (because participation in these tariffs can lower actual revenues versus the target revenue).
Percentage of electric load served by smart grid technology
In 2019, we launched Phase 1 of our grid modernization effort, which included a critical implementation piece — the installation of advanced meters at homes and businesses. Through the end of 2021, Hawaiian Electric has deployed 48,265 advanced meters across O‘ahu, Maui, and Hawai‘i Island, representing 10.3% of all customers. Advanced meters will aid in allowing more renewables to be added to the grid and enable customers to participate in energy programs such as private rooftop solar, demand response, and time-of-use rates. Additional technical upgrades will help build a more reliable and resilient grid.
See page 68 for additional discussion on grid modernization.
Customer electricity savings from efficiency measures, by market
IF-EU-420a.3
By Hawai‘i law, since 2009, the energy efficiency programs for the state are managed by a third-party administrator known as Hawai‘i Energy and selected by the Hawai‘i Public Utilities Commission. In its 2020 Annual Report, Hawai‘i Energy reported that for the 2020 program year (July 1, 2020 to June 30, 2021), its programs helped reduce customer energy consumption by roughly 116,000 Megawatt hours across O‘ahu, Hawai‘i Island, Maui, Moloka‘i and Lāna‘i. 1 For more information about Hawai‘i Energy, visit www.hawaiienergy.com .
1 Source: Hawai‘i Energy 2020 Annual Report
134 QUANTITATIVE HEI HAWAIIAN ELECTRIC AMERICAN SAVINGS BANK PACIFIC CURRENT < CONTENTS
IF-EU-420a.1
2019 2020 2021 O‘ahu Hawai‘i Island Maui County O‘ahu Hawai‘i Island Maui County O‘ahu Hawai‘i Island Maui County Total Annual Target Revenues ($ in thousands) 633,917 152,490 148,030 650,527 155,898 152,894 661,892 156,403 153,770 Total Electric Utility Revenues ($ in thousands) 1,803,698 364,590 378,202 1,608,305 334,221 323,430 1,793,372 381,033 365,256 % 35% 42% 39% 40% 47% 47% 37% 41% 42% Percentage of electric utility revenues from rate structures that contain a lost revenue adjustment mechanism (LRAM) IF-EU-420a.1
IF-EU-420a.2
Nuclear Safety and Emergency Management
Hawaiian Electric does not have any nuclear facilities.
Grid Resilience
Number of incidents of non-compliance with physical and/or cybersecurity standards or regulations
To date, there have been no material incidents, violations, or fines due to non-compliance with cybersecurity and privacy standards or regulations. See page 78 for additional discussion on cybersecurity.
See pages 75-77 for additional discussion on grid reliability and resilience.
See pages 75-77 for additional discussion on grid reliability and resilience.
See pages 75-77 for additional discussion on grid reliability and resilience.
135
System Average Interruption Frequency Index (SAIFI) IF-EU-550a.2 SAIFI – GENERATION, TRANSMISSION, AND DISTRIBUTION OUTAGES (INTERRUPTIONS) Operating Area Normalized/Non-Normalized 2019 2020 2021 O‘ahu Normalized 1.105 0.914 1.233 Unnormalized 1.470 1.178 1.613 Hawai‘i Island Normalized 1.864 1.819 2.299 Unnormalized 3.060 1.819 3.171 Maui County Normalized 2.051 1.725 1.346 Unnormalized 2.706 1.901 1.994
Customer Average Interruption Duration Index (CAIDI) IF-EU-550a.2
– GENERATION, TRANSMISSION, AND DISTRIBUTION OUTAGES (MINUTES) Operating Area Normalized/Non-Normalized 2019 2020 2021 O‘ahu Normalized 94.21 89.33 86.64 Unnormalized 118.96 101.90 96.32 Hawai‘i Island Normalized 88.42 70.78 70.28 Unnormalized 82.51 70.78 150.74 Maui County Normalized 77.25 96.49 116.45 Unnormalized 106.82 124.42 248.76
CAIDI
IF-EU-550a.1
System Average Interruption Duration Index (SAIDI) IF-EU-550a.2
– GENERATION, TRANSMISSION, AND DISTRIBUTION OUTAGES (MINUTES) Operating Area Normalized/Non-Normalized 2019 2020 2021 O‘ahu Normalized 104.13 81.62 106.79 Unnormalized 174.90 120.08 155.35 Hawai‘i Island Normalized 164.86 128.76 161.56 Unnormalized 252.52 128.76 478.03 Maui County Normalized 158.42 166.43 156.71 Unnormalized 289.08 236.57 495.94
SAIDI
Discuss notable service interruptions such as those that affected a significant number of customers or disruptions of extended duration
Below is a summary of major event days (MEDs) in 2021 and events that significantly impacted normalized 2021 SAIDI or SAIFI results for each of O‘ahu, Hawai‘i Island and Maui County. Contributions from MEDs are excluded from normalized results.
The following were determined to be MEDs on O‘ahu in 2021:
1. February 3 — Weather-related outages affecting various parts of O‘ahu.
2. March 10 — Weather-related outages affecting various parts of O‘ahu.
3. August 21 — Bird in conductors and faulty equipment operation.
4. December 5 — Weather-related outages affecting various parts of O‘ahu.
4. December 6 — Weather-related outages affecting various parts of O‘ahu.
Events that significantly impacted normalized 2021 SAIDI or SAIFI results for O‘ahu:
1. January 18 — Weather-related outages affecting various parts of O‘ahu. Sustained interruption to 13,216 customers for up to 25 hours and 14 minutes. Contributed 3.76 minutes to the annual SAIDI.
2. March 31 — A new substation transformer failed upon energizing. Sustained interruption to 24,799 customers for up to 11 minutes. Contributed 0.081 interruptions to the annual SAIFI.
3. April 16 — The control rod for a switch broke during operation and fell onto substation equipment. Sustained interruption to 22,896 customers for up to 37 minutes. Contributed 2.70 minutes to the annual SAIDI and 0.074 interruptions to the annual SAIFI.
4. September 24 — Underfrequency load shed due to an Independent Power Producer’s (IPP) generating equipment tripping offline. Sustained interruption to 26,031 customers for up to 5 hours and 5 minutes. Contributed 0.085 interruptions to the annual SAIFI.
5. December 14 — A switch vault flashed over. Sustained interruption to 5,084 customers for up to 3 hours and 52 minutes. Contributed 3.06 minutes to the annual SAIDI.
The following were determined to be MEDs on Hawai‘i Island in 2021:
1. July 29 — Scheduled interruption to replace multiple poles on a transmission circuit.
2. December 5 — Tree-related outages affecting various parts of Hawai‘i Island during high winds.
3. December 6 — Tree-related outages affecting various parts of Hawai‘i Island during high winds.
4. December 16 — Tree fell on transmission circuit conductors.
Events that significantly impacted normalized 2021 SAIDI or SAIFI results for Hawai‘i Island:
1. February 2 — A tree fell on distribution conductors. Sustained interruption to 1,578 customers for up to 5 hours and 56 minutes. Contributed 6.05 minutes to the annual SAIDI.
2. February 28 — A tree leaned on transmission conductors. Sustained interruption to 2,923 customers for up to 4 hours and 13 minutes. Contributed 7.18 minutes to the annual SAIDI.
3. June 21 — Underfrequency load shed due to an IPP’s generating equipment tripping offline. Sustained interruption to 11,971 customers for up to 27 minutes. Contributed 0.137 interruptions to the annual SAIFI.
4. June 24 — Underfrequency load shed due to an IPP’s generating equipment tripping offline. Sustained interruption to 13,984 customers for up to 13 minutes. Contributed 0.192 interruptions to the annual SAIFI.
5. July 4 — Underfrequency load shed due to an IPP’s output dropping to minimum generation. Sustained interruption to 11,635 customers for up to 11 minutes. Contributed 0.133 interruptions to the annual SAIFI.
6. October 22 — A tree fell on transmission conductors. Sustained interruption to 2,923 customers for up to 11 hours and 22 minutes. Contributed 8.99 minutes to the annual SAIDI. service int
136 QUANTITATIVE HEI HAWAIIAN ELECTRIC AMERICAN SAVINGS BANK PACIFIC CURRENT < CONTENTS
IF-EU-550a.2
The following were determined to be MEDs in Maui County in 2021:
1. April 24 — Mylar balloon in conductors on Lāna‘i.
2. May 29 — Underfrequency load shed when a generator tripped offline on Lāna‘i.
3. November 29 — Transmission & Distribution (T&D) equipment failure on Maui.
4. December 5 — Weather-related outages affecting various parts of Maui.
5. December 7 — T&D equipment failure on Maui.
Events that significantly impacted normalized 2021 SAIDI or SAIFI results for Maui County:
1. September 6 — T&D equipment failure on Maui. Sustained interruption to 7,169 customers for up to 7 hours and 23 minutes. Contributed 10.25 minutes to the annual SAIDI and 0.097 interruptions to the annual SAIFI.
2. November 1 — A switch flashed over on Maui. Sustained interruption to 4,000 customers for up to 9 hours and 47 minutes. Contributed 9.07 minutes to the annual SAIDI.
3. December 6 — Weather-related outages affecting various parts of Maui. Sustained interruption to 1,516 customers for up to 23 hours and 44 minutes. Contributed 9.48 minutes to the annual SAIDI.
4. December 6 — Faulty equipment operation during rain on Maui. Sustained interruption to 6,917 customers for up to 1 hour and 23 minutes. Contributed 0.094 interruptions to the annual SAIFI.
5. December 8 — T&D equipment failure on Maui. Sustained interruption to 6,347 customers for up to 5 hours and 16 minutes. Contributed 0.086 interruptions to the annual SAIFI.
For the Hawaiian Electric utiltiies, the most recent four main causes of outages are:
• Vegetation — Includes downed trees and tree branches in power lines and overgrown vegetation, some of which falls outside of the Companies’ scope of clearance
• Equipment deterioration — Equipment breakdown from natural causes
• Cable faults — Failure of underground cable system equipment
• Automatic underfrequency load shed — Controlled automatic load shed to recover from underfrequency conditions
137
American Savings Bank

< CONTENTS HEI HAWAIIAN ELECTRIC AMERICAN SAVINGS BANK PACIFIC CURRENT QUANTITATIVE
SASB Index
American Savings Bank
SASB Index: Commercial Banks, Mortgage Finance and Consumer Finance Standards
For ASB we have selected the Commercial Banks, Mortgage Finance and Consumer Finance Standards based on the products ASB offers and its loan portfolio.
*While we have endeavored to provide fulsome responses to the SASB metrics, there are certain metrics for which we are not providing information due to the confidential nature of such information.
Commercial Banks Standard
Activity Metrics
In the two charts that follow, “Consumer” refers to deposits and loans “primarily for personal, family or household purposes.” Within its general population of deposit accounts and loans, ASB does not currently separately categorize accounts as “small business” accounts. However, according to the U.S. Small Business Administration, 99.3% of Hawai‘i companies are considered small businesses. As such, we believe a significant proportion of companies that are our customers would be considered “small businesses.”
(1) Number and (2) value of checking and savings accounts by segment: (a) personal and (b) small business
CORE DEPOSIT ACCOUNTS BY SEGMENT
Non-consumer lines, previously reported as separate categories, have been combined under the commercial category. Amounts differ slightly from data reported previously because of differences in defining deposit accounts.
(1) Number and (2) value of loans by segment: (a) personal, (b) small business, and (c) corporate
NON-REAL ESTATE LOANS*
*Lines of credit that are not secured by real estate are included.
139
FN-CB-000.A
December 31 2019 2020 2021 (Dollars in thousands) Qty. Total ($) Qty. Total ($) Qty. Total ($) Consumer 400,660 4,133,804 394,140 5,093,947 396,029 5,729,921 Commercial 32,346 1,357,213 33,368 1,729,498 34,895 2,008,284 Total 433,006 $5,491,017 427,508 $6,823,445 430,924 $7,738,205
FN-CB-000.B
December 31 2019 2020 2021 (Dollars in thousands) Qty. Total ($) Qty. Total ($) Qty. Total ($) Consumer 62,379 257,921 52,735 168,733 53,182 113,966 Commercial 3,810 670,674 7,184 936,748 4,862 793,304 Total 66,189 $928,595 59,919 $1,105,481 58,044 $907,270
Data Security
(1) Number of data breaches, (2) percentage involving personally identifiable information (PII), (3) number of account holders affected
*See comment on page 139. ASB is in compliance with applicable requirements.
Two of the most significant cyberattack risks that ASB faces are e-fraud and loss of sensitive customer data. Please see pages 23-25 of HEI’s 2021 Annual Report (10-K)
Financial Inclusion & Capacity Building
(1) Number and (2) amount of loans outstanding qualified to programs designed to promote small business and community development
Adjusted data reported previously, which reflected annual amounts originated and not portfolio balances. “Small farm” category previously reported separately has been included in “small business” this year.
(1) Number and (2) amount of past due and nonaccrual loans qualified to programs designed to promote small business and community development
Number of no-cost retail checking accounts provided to previously unbanked or underbanked customers
ASB does not collect data on customers’ unbanked or underbanked status.
140 QUANTITATIVE HEI HAWAIIAN ELECTRIC AMERICAN SAVINGS BANK PACIFIC CURRENT < CONTENTS
FN-CB-240a.1 SMALL BUSINESS AND COMMUNITY
LOANS December 31 2019 2020 2021 (Dollars in thousands) Qty. Balance ($) Qty. Balance ($) Qty. Balance ($) Small business 2,019 113,893 5,389 300,090 1,911 132,523 Community development 52 269,101 59 307,078 60 314,978
DEVELOPMENT
FN-CB-240a.2 DELINQUENT AND NONACCRUAL SMALL BUSINESS AND COMMUNITY DEVELOPMENT LOANS December 31 2019 2020 2021 (Dollars in thousands) Qty. Balance ($) Qty. Balance ($) Qty. Balance ($) Small business Delinquent 39 1,148 46 1,528 38 1,060 Nonaccrual 10 569 35 2,217 30 1,091 Community development Delinquent 0 0 0 0 0 0 Nonaccrual 1 106 0 0 0 0 Total 50 $1,823 81 $3,745 68 $2,151
FN-CB-240a.3
FN-CB-230a.1
Description of approach to identifying and addressing data security risks FN-CB-230a.2
Number of participants in financial literacy initiatives for unbanked, underbanked, or underserved customers
In early 2019, we launched an online financial checkup where individuals can answer a series of questions and get a basic financial health score. Based on their results, we make a recommendation on what area they could further explore. We also connect these individuals to bankers using an online appointment tool. From January 28, 2021 to December 31, 2021, there were 3,236 completed checkups. Additionally, in 2021, 8,979 online appointments were fulfilled.
On February 22, 2021, we launched an online financial education resource center. There, visitors can learn about Debt Management, Budgeting for Families, Credit Scores, Finance for Senior Caregivers and more. From its inception through December 31, 2021, 10,952 people accessed the center, with an average view time of 12 minutes 45 seconds and a 35% conversion rate (measuring how many program users clicked through to a “custom moment”).
Customers also have the opportunity for financial education through our online financial calculators. From January 1, 2021 to December 31, 2021 the calculators were viewed over 27,000 times. The most popular calculator was “Calculate a Mortgage Payment” with 3,881 page views.
Incorporation of Environmental, Social, and Governance Factors in Credit Analysis
*The industry code is based on the North American Industry Classification System (NAICS) code that the customer provided. We have not reviewed the NAICS code for accuracy.
Description of approach to incorporation of environmental, social, and governance (ESG) factors in credit analysis
While we seek to increase access to financial services and support those businesses that make a positive impact in the community, we primarily evaluate our borrowers’ creditworthiness based on the business’s commitment to honor the obligations to ASB. During our due diligence process, if we learn of any negative ESG factors that do not align with our values, we may decline financing the business.
Our Commercial Credit Policy team analyzes the potential impacts that sea level rise and natural disasters can have on properties that secure our loans. Additionally, we monitor other known ESG risks that can affect the quality of collateral or our customers’ ability to pay. These credit risks are regularly reported to senior leadership and the board.
Based on these potential environmental impacts, we continuously analyze our underwriting policies, credit policy and risk mitigation efforts.
141
FN-CB-240a.4
Commercial and industrial credit by industry FN-CB-410a.1 # Industry* Percentage of Total Exposure 1 Real Estate Rental and Leasing 44.9% 2 Construction 7.5% 3 Health Care and Social Assistance 5.4% 4 Accommodation and Food Service 7.1% 5 Other Services (except Public Administration) 6.2% 6 Other 28.9%
FN-CB-410a.2
Total amount of monetary losses as a result of legal proceedings associated with fraud, insider trading, anti-trust, anti-competitive behavior, market manipulation, malpractice, or other related financial industry laws or regulations
Please see page 34 of HEI’s 2021 Annual Report (10-K)
Description of whistleblower policies and procedures
FN-CB-510a.1
FN-CB-510a.2
The Code of Conduct is a statement of the fundamental principles and key policies that govern our conduct; it is not intended to cover every applicable law or provide answers to every question that might arise. In many instances, the policies referenced in the Code of Conduct go beyond the requirements of the law.
Teammates who wish to report violations of ASB’s Code of Conduct may notify their managers, Human Resources, or anyone in the Legal Department. Teammates may also submit their concerns to EthicsPoint, a third-party reporting administrator. EthicsPoint permits teammates to make reports anonymously, through its website or hotline, and provides the content of the report to the appropriate individuals within the company to investigate. Teammates who make EthicsPoint reports also have the opportunity to answer questions anonymously and track the progress of their report through EthicsPoint’s website.
Speaking up can be extremely difficult for a number of reasons — one of which is a fear of retaliation. We believe that our teammates should feel comfortable raising their concerns. We do not tolerate retaliation against people who report suspected illegal conduct or violations of the Code of Conduct. Teammates who engage in retaliation are subject to discipline up to and including termination of employment.
All teammates receive regular in-person and computer-based training and certification relating to identifying and reporting Code of Conduct violations and inappropriate conduct. Additionally, teammates must undergo annual training on compliance issues relevant to their job duties.
Systemic Risk Management
Global Systemically Important Bank (G-SIB) score, by category
ASB is not on the Financial Stability Board’s 2021 list of Global Systemically Important Banks, so it does not have a G-SIB score.
Description of approach to incorporation of results of mandatory and voluntary stress tests into capital adequacy planning, long-term corporate strategy, and other business activities
On an ongoing basis, we evaluate and address issues and activities that may pose potential risks to ASB, our teammates, customers, stakeholders and the community at large. This includes taking precautionary actions to anticipate, identify and manage risks related to our services and conducting regular stress tests.
With regard to stress testing, we analyze the impact of liquidity risk, interest rate risk, and credit risk on our financial position based on multiple adverse endemic and systemic scenarios. Our enterprise risk, finance and credit teams work in collaboration to perform this analysis at least on an annual basis. Additionally, we monitor risk indicators on a daily basis.
The Risk Committee of ASB’s Board of Directors assists with governance of ASB’s enterprise risk management program and provides a forum for detailed discussion and analysis of key issues and decisions designed to identify the significant risks potentially affecting ASB and to manage these risks. The enterprise risk management program focuses on various risk categories, including Credit (for loan, including related risk from sea level rise, and investment portfolios), Market (particularly interest rate sensitivity), Liquidity, Operations (including, but not limited to, environmental, social, and governance), Strategic and Reputational.
142 QUANTITATIVE HEI HAWAIIAN ELECTRIC AMERICAN SAVINGS BANK PACIFIC CURRENT < CONTENTS
FN-CB-550a.1
FN-CB-550a.2
Business Ethics
Mortgage Finance Standard Activity Metrics
(1) Number and (2) value of mortgages originated by category:
(a) residential and (b) commercial
ORIGINATED REAL ESTATE LOANS, BY YEAR
data reported previously, which reflected portfolio balances and not new originations.
(1) Number and (2) value of mortgages purchased by category:
We did not purchase any new real estate loans in 2019, 2020, or 2021.
Adjusted data reported previously, which reflected portfolio balances and not new purchased loans.
143
FN-MF-000.B
(a) residential and (b) commercial
FN-MF-000.A
December 31 2019 2020 2021 (Dollars in thousands) Qty. Balance ($) Qty. Balance ($) Qty. Balance ($) Residential mortgages 1,269 621,893 2,526 1,179,021 2,461 1,200,233 Home equity lines 2,301 478,376 1,428 288,225 1,921 398,998 Commercial real estate 45 223,852 73 426,981 66 359,971 Total mortgage originations 3,615 $1,324,121 4,027 $1,894,227 4,448 $1,959,202 Adjusted
Lending Practices
(1) Number and (2) value of residential mortgages of the following types: (a) Hybrid or Option Adjustable-rate Mortgages (ARM), (b) Prepayment Penalty, (c) Higher Rate, (d) Total, by FICO scores above or below 660
*The loans are classified based on the borrowers’ FICO score at the time of origination. Includes loans in ASB’s portfolio, excluding those that ASB services but does not own. Amounts differ from previous reports because categories have been adjust to reflect borrowers’ FICO scores at time of origination, rather than at the time the data was collected.
144 QUANTITATIVE HEI HAWAIIAN ELECTRIC AMERICAN SAVINGS BANK PACIFIC CURRENT < CONTENTS
FN-MF-270a.1
2019 2020 ≤ 660 > 660 ≤ 660 > 660 (Dollars in thousands) Qty. Balance ($) Qty. Balance ($) Qty. Balance ($) Qty. Balance ($) Adjustable Rate Mortgages (ARM) 3 799 464 139,074 2 691 410 139,575 Higher rate - - - - - - -Prepayment penalty - - - - - - -Total residential mortgages 247 $46,928 7,053 $2,127,023 224 $40,230 6,662 $2,102,791 Total home equity lines of credit 183 $12,637 19,062 $1,079,488 172 $12,428 17,105 $951,149 2021 ≤ 660 > 660 (Dollars in thousands) Qty. Balance ($) Qty. Balance ($) Adjustable Rate Mortgages (ARM) 2 673 307 110,806 Higher rate - - -Prepayment penalty - - -Total residential mortgages 198 $35,958 6,506 $2,262,391 Total home equity lines of credit 168 $11,031 16,201 $824,632
RESIDENTIAL LOANS BY FEATURES AND FICO SCORE*
(1) Number and (2) value of (a) residential mortgage modifications, (b) foreclosures, and (c) short sales or deeds in lieu of foreclosure, by FICO scores above and below 660 FN-MF-270a.2
RESIDENTIAL MORTGAGE MODIFICATIONS, FORECLOSURES, AND SHORT SALES OR DEEDS IN LIEU OF FORECLOSURE, BY FICO SCORES*
*The loans are classified based on the borrowers’ FICO score at the time of origination. **Loan modifications are limited to those requested by customers facing financial hardship. *** Foreclosures are limited to those where the borrower defaulted and a sale of the underlying property was forced.
Previous reports covered all loan modifications; this year’s reporting has been limited to customers undergoing financial hardship to more specifically reflect efforts on loss mitigation.
145
2019 2020 ≤ 660 > 660 ≤ 660 > 660 (Dollars in thousands) Qty. Balance ($) Qty. Balance ($) Qty. Balance ($) Qty. Balance ($) MODIFICATIONS** Residential mortgages 6 517 8 2,339 1 144 4 668 Home equity lines of credit - - 3 442 - - 3 85 Total 6 $517 11 $2,781 1 $144 7 $753 FORECLOSURES*** Residential mortgages - - - - 3 185 -Home equity lines of credit - - 1 35 - - -Total - - 1 $35 3 $185 -SHORT SALES OR DEEDS IN LIEU OF FORECLOSURE Residential mortgages - - - - - - -Home equity lines of credit - - - - - - -Total - - - - - - -2021 ≤ 660 > 660 (Dollars in thousands) Qty. Balance ($) Qty. Balance ($) MODIFICATIONS** Residential mortgages 1 84 16 9,094 Home equity lines of credit - - -Total 1 $84 16 $9,094 FORECLOSURES*** Residential mortgages - - 1 353 Home equity lines of credit - - -Total - - 1 $353 SHORT SALES OR DEEDS IN LIEU OF FORECLOSURE Residential mortgages 0 - 1 187 Home equity lines of credit 0 - 1 45 Total 0 - 2 $232
Total amount of monetary losses as a result of legal proceedings associated with communications to customers or remuneration of loan originators
Please see page 34 of HEI’s 2021 Annual Report (10-K).
FN-MF-270a.3
Description of remuneration structure of loan originators FN-MF-270a.4
Our residential loan officers receive a base wage, plus commissions of 40-90 basis points on originated residential mortgages. The actual rate of incentive compensation depends on whether the mortgages were externally sourced and the total monthly production of the loan officer.
Residential loan officers must comply with all regulations and ethical rules to be eligible for incentive compensation. We may refuse to pay back commissions to loan officers who violate the law or ASB’s policies.
Discriminatory Lending
(1) Number, (2) value, and (3) weighted average Loan-to-Value (LTV) ratio of mortgages issued to (a) minority and (b) all other borrowers, by FICO scores above and below 660
TOTAL ORIGINATED RESIDENTIAL LOANS* AND HOME EQUITY LINES OF CREDIT BY MINORITY AND CREDIT SCORE
* Land loans are excluded.
Total amount of monetary losses as a result of legal proceedings associated with discriminatory mortgage lending
Please see page 34 of HEI’s 2021 Annual Report (10-K)
Description of policies and procedures for ensuring nondiscriminatory mortgage origination
As a covered financial institution, we comply with the Fair Housing Act and Equal Credit Opportunity Act, which prohibit discrimination in residential real estate credit-related transactions based on certain protected classes, such as race, color, national origin, religion, sex and marital or familial status. To prevent discriminatory lending practices, we regularly review our application processes and requirements, sales practices, policies and marketing material to ensure that all protected classes are fairly and equally treated. We also periodically review lending data to identify any policies or practices that may potentially affect protected consumers unfairly and unequally.
146 QUANTITATIVE HEI HAWAIIAN ELECTRIC AMERICAN SAVINGS BANK PACIFIC CURRENT < CONTENTS
FN-MF-270b.1
2020 2021 (Dollars in thousands) Qty. Total ($) LTV Qty. Total ($) LTV Minority Credit score ≤ 660 32 8,281 56.12 31 9,911 62.26 Credit score > 660 2,614 933,413 58.43 3,128 1,068,439 56.64 Non-minority Credit score ≤ 660 3 225 51.90 7 2,341 54.85 Credit score > 660 556 216,794 58.69 1,169 503,434 59.66 Total 3,205 $1,158,713 58.45 4,335 $1,584,125 57.49
FN-MF-270b.2
FN-MF-270b.3
Environmental Risk to Mortgaged Properties
RESIDENTIAL
*Residential Portfolio includes six (6) loans held for sale (total unpaid principal balance of $2.14 million).
The data is not available specific to weather-related natural catastrophes. ASB intends to expand its environmental risk analysis in the future.
Description of how climate change and other environmental risks are incorporated into mortgage origination and underwriting
Operating on an island chain, we know that we must prepare to adapt to the impacts of climate change and take steps to prudently mitigate related risks. Climate change may cause more frequent and intense weather-related natural catastrophes, such as hurricanes, storms, and flooding, and may result in sea level rise. We require all homeowners who live in a Special Flood Hazard Area, as defined by FEMA, to maintain sufficient flood insurance throughout the life of the loan. We also require all mortgages, with the exception of some home equity lines of credit, to secure hurricane and hazard insurance.
We regularly monitor our credit exposure in areas at risk of future sea-level rise. We perform property research to confirm flood zones, and our underwriting decisions consider factors such as the property location, topography and elevation.
147
(1) Number and (2) value of mortgage loans in 100-year flood zones FN-MF-450a.1
(Dollars in thousands) Qty. Unpaid Principal Balance ($) Investor 232 62,067 Residential Portfolio* 708 257,199 Home equity lines of credit 556 30,734 Total 1,496 $350,000
MORTGAGE LOANS IN 100-YEAR FLOOD ZONES 1
1 As of December 31, 2021.
(1) Total expected loss (EL) and (2) Loss Given Default (LGD) attributable to mortgage loan default and delinquency due to weather related natural catastrophes, by geographic region
FN-MF-450a.2
FN-MF-450a.3
Consumer Finance Standard Activity
Metrics
Number of unique consumers with an active (1) credit card account and (2) pre-paid debit card account
Number of (1) credit card accounts and (2) pre-paid debit card accounts
ASB does not issue any credit cards and does not offer any pre-paid debit cards. ASB’s branded credit cards are issued by Elan Financial Services, pursuant to a license from Visa U.S.A.
Customer Privacy
Number of account holders whose information is used for secondary purposes
Similar to other financial institutions, we collect and maintain data, primarily to allow us to originate and maintain deposit accounts, loans, investment accounts and other products and services that we provide. We may also use our customers’ data to provide us insight into products and services that would be beneficial for our customers, protect against fraud, security breaches and other wrongful conduct, and support the general operation of our business. We do not sell our customers’ data, nor do we plan to do so.
As a financial institution, we comply with the Gramm-Leach-Bliley Act, as implemented by Regulation P, and other federal, state and local laws and regulations. Our Privacy Notice can be found on our website at www.asbhawaii.com/security-fraud-privacy
Total amount of monetary losses as a result of legal proceedings associated with customer privacy
Please see page 34 of HEI’s 2021 Annual Report (10-K).
Data Security (see also FN-CB-230a.1 and FN-CB-230a.3 on page 138)
Card-related fraud losses from (1) card-not-present fraud and (2) card-present and other fraud
Please see page 34 of HEI’s 2021 Annual Report (10-K)
148 QUANTITATIVE HEI HAWAIIAN ELECTRIC AMERICAN SAVINGS BANK PACIFIC CURRENT < CONTENTS
FN-CF-220a.1
FN-CF-230a.2
FN-CF-220a.2
Category of Credit Cards Credit Cards Cardholders Personal 27,608 26,224 Business 2,951 2,783 Overlap (less) - 248 Total 30,559 28,759
FN-CF-000.A
FN-CF-000.B
Selling Practices
Percentage of total remuneration for covered teammates that is variable and linked to the amount of products and services sold
Eligible Branch Managers, Assistant Branch Managers and Personal Bankers who sell consumer loan products may receive incentive compensation of 5-15 basis points on their production of consumer loans, provided they meet both individual and branch goals. These bankers must comply with all regulations and ethical rules to be eligible for incentive compensation. We may refuse to pay back commissions to loan officers who violate the law or ASB’s policies.
In 2021, only 5% of these teammates’ total compensation was variable and linked to the amount of products and services sold (e.g., referral fees, commissions, and bonuses).
Approval rate for (1) credit and (2) pre-paid products for applicants with FICO scores above and below 660
does not sell pre-paid products.
(1) Average fees from add-on products, (2) average APR, (3) average age of accounts, (4) average number of trade lines, and (5) average annual fees for pre-paid products, for customers with FICO scores above and below 660
We offer various consumer loan products with a range of interest rates. As of December 31, 2021, the average interest rate for all or our consumer loan accounts was 11.89% and the average age was 2.7 years.
(1) Number of complaints filed with the Consumer Financial Protection Bureau (CFPB), (2) percentage with monetary or nonmonetary relief, (3) percentage disputed by consumer, (4) percentage that resulted in investigation by the CFPB
*See comment on page 139. ASB is in compliance with applicable requirements.
Total amount of monetary losses as a result of legal proceedings associated with selling and servicing of products
Please see page 34 of HEI’s 2021 Annual Report (10-K)
149
FN-CF-270a.2
RATE FOR CONSUMER
BY CREDIT SCORE 2019 2020 2021 < 660 ≥ 660 < 660 ≥ 660 < 660 ≥ 660 Approved applications 441 8,166 51 2,298 3 1,277 Total applications received 6,145 11,069 2,420 5,166 1,772 4,075 Approval rate 7.18% 73.77% 2.11% 44.48% 0.17% 31.34%
APPROVAL
LOANS
ASB
FN-CF-270a.5
FN-CF-270a.3
FN-CF-270a.4
FN-CF-270a.1
Hawaiian Electric

< CONTENTS HEI HAWAIIAN ELECTRIC AMERICAN SAVINGS BANK PACIFIC CURRENT QUANTITATIVE
EEI ESG Metrics
Hawaiian Electric EEI
ESG Metrics
The Hawaiian Electric data in this section is reported in alignment with the Edison Electric Institute (EEI) Environmental, Social, Governance / Sustainability (ESG) reporting template. The charts in this section have been modified as appropriate to reflect the specific activities of Hawaiian Electric.
Portfolio
1 For total system generation reported by source, customer-sited generation is included as part of SASB and EEI ESG metrics in this report but was not included in HEI’s Annual Report on Form 10-K for year ended 2021. Minor methodology differences regarding renewable components of certain generators and timing of underlying reporting account for additional differences between the SASB and EEI ESG reported metrics and the Form 10-K.
2 2019 and 2020 generation amounts reflect the fact that the Puna Geothermal Venture (PGV) plant was out of service from May 2018 until late 2020. The loss of firm power from PGV generation was offset by firm generation from petroleum. PGV returned to service with firm capacity of 13 MW in the first quarter of 2021 and ramped up to 23.9 MW in the second quarter and continued to provide 23.9 MW for the remainder of 2021.
3 Lower wind generation in 2019 primarily reflects a year to year wind variation, along with self-curtailments by the IPPs for maintenance and compliance with habitat conservation plans, and company curtailment for system maintenance and upgrades.
151
Total electricity generated for the data year (MWh) 1 TOTAL SYSTEM GENERATION – BY SOURCE 2010 BASELINE 2017 2018 2019 2020 2021 CONVENTIONAL Coal 1,523,218 1,390,942 1,324,912 1,316,032 1,183,187 1,105,070 Natural Gas 0 0 0 0 0 0 Nuclear 0 0 0 0 0 0 Petroleum 2 7,732,294 6,279,471 6,405,779 6,569,453 5,867,139 5,793,779 Total Conventional 9,255,512 7,670,413 7,730,691 7,885,485 7,050,326 6,898,849 RENEWABLE Biomass/Biogas Biodiesel 3,160 55,982 62,034 59,996 74,507 71,780 Waste-to-Energy (Biomass) 358,852 381,138 389,730 414,357 369,239 366,365 Geothermal 2 201,587 322,609 110,089 0 9,640 183,391 Hydroelectric 35,890 30,284 62,734 35,414 28,594 43,050 Solar Utility-Scale 1,787 142,868 149,148 218,058 398,376 390,353 Customer-Sited 48,508 862,638 948,484 1,224,579 1,325,750 1,418,036 Wind 3 261,206 532,875 602,007 527,887 594,569 701,124 Other 0 0 0 0 0 0 Total Renewable 910,990 2,328,394 2,324,226 2,480,290 2,800,675 3,174,100 Total MWh Generated 10,166,502 9,998,807 10,054,917 10,365,776 9,851,001 10,072,948
Investing in the future: capital expenditures, energy efficiency (EE), and smart meters
Hawai‘i Energy, a third-party adminstrator, is responsible for the state's energy efficiency programs2
Retail electric customer count (at end of year)
1 Capital expenditures shown on an accrual basis and are net of contributions in aid of construction.
2 Source: Hawai‘i Energy 2020 Annual Report
152 QUANTITATIVE HEI HAWAIIAN ELECTRIC AMERICAN SAVINGS BANK PACIFIC CURRENT < CONTENTS
Portfolio continued
2017 2018 2019 2020 2021 Total Annual Capital Expenditures 1 (nominal dollars) $401M $411M $450M $335M $302M Incremental Annual Electricity Savings from EE Measures (MWh)
Incremental Annual Investment in Electric EE Programs (nominal dollars) Percent of Total Electric Customers with Smart Meters (at end of year) 0.0 0.0 1.1 1.5 10.3
2017 2018 2019 2020 2021 Residential 406,241 407,505 409,689 412,484 414,713 Commercial 55,328 54,888 55,077 54,861 55,201 Industrial 656 696 700 694 698 Total 462,225 463,089 465,466 468,039 470,612
Emissions
GHG emissions: carbon dioxide (CO 2) and carbon dioxide equivalent (CO 2e)
)
1 Equal to Scope 1 Owned Generation + Scope 3 Purchased Power + non-generation (T&D SF6 emissions). No CO2 emissions from customer-sited solar. Intensities in MT/Net MWh are calculated by dividing emissions by net generation from owned generation, purchased power and customer-sited solar.
2 Equal to Scope 1 Owned Generation + Scope 3 Purchased Power. Intensities in MT/Net MWh are calculated by dividing emissions by net generation from owned generation and purchased power.
3 Equal to Scope 1 Owned Generation. Intensities in MT/Net MWh are calculated by dividing emissions by net generation from owned generation.
4 Equal to Scope 3 Purchased Power. Intensities in MT/Net MWh are calculated by dividing emissions by net generation from purchased power.
153
2015 BASELINE 2019 2020 2021 Owned Generation + Purchased Power + Customer-Sited Solar + Non-Generation 1 Carbon Dioxide ( CO 2) CO2 Emissions (MT) 7,057,212 6,721,656 6,070,284 5,979,756 CO2 Emissions Intensity (MT/Net MWh) 0.700 0.648 0.616 0.594 Carbon Dioxide Equivalent ( CO 2e ) CO2e Emissions (MT) 7,104,453 6,771,000 6,112,001 6,022,715 CO2e Emissions Intensity (MT/Net MWh) 0.705 0.653 0.620 0.598 Carbon Dioxide Equivalent ( CO 2e ) Intensity by Island Hawai‘i Island CO2e Emissions Intensity (MT/Net MWh) 0.439 0.531 0.511 0.423 O‘ahu CO2e Emissions Intensity (MT/Net MWh) 0.782 0.698 0.663 0.651 Maui County CO2e Emissions Intensity (MT/Net MWh) 0.509 0.519 0.475 0.474 Owned Generation + Purchased Power 2 Carbon Dioxide ( CO 2) CO2 Emissions (MT) 7,057,212 6,721,656 6,070,284 5,979,756 CO2 Emissions Intensity (MT/Net MWh) 0.748 0.735 0.712 0.691 Carbon Dioxide Equivalent ( CO 2e ) CO2e Emissions (MT) 7,098,249 6,763,717 6,108,291 6,016,953 CO2e Emissions Intensity (MT/Net MWh) 0.753 0.740 0.716 0.695 Owned Generation 3 Carbon Dioxide ( CO 2) CO2 Emissions (MT) 4,072,497 4,029,773 3,719,974 3,667,594 CO2 Emissions Intensity (MT/Net MWh) 0.795 0.811 0.804 0.815 Carbon Dioxide Equivalent ( CO 2e ) CO2e Emissions (MT) 4,085,494 4,042,889 3,732,129 3,679,601 CO2e Emissions Intensity (MT/Net MWh) 0.797 0.813 0.806 0.818 Purchased Power 4 Carbon Dioxide ( CO 2) CO2 Emissions (MT) 2,984,715 2,691,883 2,350,310 2,312,162 CO2 Emissions Intensity (MT/Net MWh) 0.693 0.645 0.603 0.557 Carbon Dioxide Equivalent ( CO 2e
CO2e Emissions (MT) 3,012,754 2,720,829 2,376,162 2,337,351 CO2e Emissions Intensity (MT/Net MWh) 0.699 0.652 0.610 0.563
GHG emissions: carbon dioxide (CO 2) and carbon dioxide equivalent (CO
154 QUANTITATIVE HEI HAWAIIAN ELECTRIC AMERICAN SAVINGS BANK PACIFIC CURRENT < CONTENTS
2e) 2015 BASELINE 2019 2020 2021 Non-Generation CO 2e Emissions Fugitive CO 2e emissions of sulfur hexafluoride (MT) 6,204 7,283 3,710 5,762 Fugitive CO 2e emissions from natural gas distribution (MT) 0 0 0 0 Nitrogen oxide (NO x), sulfur dioxide (SO 2), mercury (Hg) 1 2015 BASELINE 2019 2020 2021 Generation basis for calculation Fossil Nitrogen Oxide (NO x) Total NO X Emissions (MT) 13,780 12,808 11,359 10,712 Total NO X Emissions Intensity (MT/Net MWh) 2 2.73E-03 2.61E-03 2.49E-03 2.42E-03 Sulfur Dioxide ( SO 2) Total SO 2 Emissions (MT) 12,149 12,739 11,663 11,368 Total SO 2 Emissions Intensity (MT/Net MWh) 2 2.41E-03 2.60E-03 2.56E-03 2.57E-03 Mercury (Hg) Total Hg Emissions (kg) 20 21 19 19 Total Hg Emissions Intensity (kg/Net MWh) 2 4.05E-06 4.27E-06 4.24E-06 4.33E-06
2019
Emissions continued
1 The air quality data does not include emissions from IPPs. 2 Intensities for
and 2020 have been updated to reflect revision to company-owned fossil fuel generation.
155 Human resources 2019 2020 2021 Total Number of Employees 1 2,720 2,636 2,504 Total Number on Board of Directors/Trustees 2 11 10 9 Total of Women on Board of Directors/Trustees 2 5 5 3 Total of Racially Diverse Members of Board of Directors/Trustees 2, 6 3 2 3 Women Executives 3 42.9% 44.4% 40.0% Women Leaders 4 26.0% 27.7% 28.3% Women All Workforce 5 29.0% 29.3% 28.7% Racially Diverse Executives 3, 6 71.4% 66.7% 66.7% Racially Diverse Leaders 4, 6 84.6% 83.6% 84.5% Racially Diverse All Workforce 5, 6 89.3% 89.5% 90.3% Employee Safety Metrics Recordable Incident Rate 2.17 1.34 1.52 Lost-time Case Rate 24.19 26.55 24.83 Days Away, Restricted, and Transfer (DART) Rate 1.68 1.15 1.32 Work-related Fatalities 0 0 0
Workforce
EEO-1
1.1 - Executive/Sr. Level Officials, 1.2 - First/Mid-Level Officials, 2 - Professionals, 3 - Technicians, 4 - Sales Workers, 5 - Administrative Support Workers, 6 - Craft Workers, 7 - Operatives, 8 - Laborers and Helpers, 9 - Service Workers.
diverse
as all races/ethnicities that are not ‘White.’ Resources
1 Total number of employees as of December 31. 2 Refers to board members of HEI, the parent company of Hawaiian Electric. 3 Executives includes EEO-1 category 1.1 - Executive/Sr. Level Officials. 4 Leaders includes EEO-1 category 1.2 - First/Mid-Level Officials. 5 All
includes
categories
6 Racially
defined
Resources continued Emissions
Additional information on the emissions goals listed above can be found on pages 58-69
70% reduction in GHG emissions from power generation. Emissions covered by this goal include stack emissions from generation owned by Hawaiian Electric (Scope 1) and independent power producers who sell electricity to the utility (Scope 3).
Net zero GHG emissions from power generation. Emissions covered by this goal include stack emissions from generation owned by Hawaiian Electric (Scope 1) and independent power producers who sell electricity to the utility (Scope 3).
1 Fresh water resource uses are for company-owned thermal and hydroelectric generation.
2 Hawaiian Electric does not operate any coal-fired power plants and therefore does not generate any coal combustion products. The only generation facility that uses coal in our service territory is owned and operated by a third-party IPP that sells power to Hawaiian Electric under a purchase power agreement (PPA). The PPA for that plant is scheduled to expire in September 2022, at which time there will be no more coal generation on our system.
156 QUANTITATIVE HEI HAWAIIAN ELECTRIC AMERICAN SAVINGS BANK PACIFIC CURRENT < CONTENTS Fresh water resources 1 2015 BASELINE 2019 2020 2021 Water Withdrawals - Consumptive (Millions of Gallons/Net MWh) 0.00 0.00 0.00 0.00 Water Withdrawals - Non-Consumptive (Millions of Gallons/Net MWh) 8.00E-03 5.84E-03 5.08E-03 3.21E-03 Waste products 2015 BASELINE 2019 2020 2021 Amount of Hazardous Waste Manifested for Disposal (MT) 9 10 6 3 Percent of Coal Combustion Products Beneficially Used 2 0% 0% 0% 0%
BASELINE YEAR TARGET YEAR REDUCTION GOAL DESCRIPTION (SHORT) Electric generation 2005 2030
Utility Emissions Reduction Goals (Climate Change Action Plan)
Electric generation 2005 2045
Reduction Goals

Forward-Looking Statements
Certain statements contained in this report are forward-looking statements, including statements regarding our ESG targets, goals, commitments and programs and other business plans, initiatives and objectives, and other statements that are not purely historical. These statements are typically accompanied by words such as “aim,” “anticipate,” “hope,” “believe,” “could,” “expect,” “estimate,” “plan,” “will,” “would,” or similar expressions. All such statements are intended to be protected by the safe harbor for forward-looking statements within the meaning of Section 21E of the Securities Exchange Act of 1934, as amended. Forward-looking statements are based on current expectations and projections about future events and are subject to risks, uncertainties and the accuracy of assumptions concerning HEI and its subsidiaries, the performance of the industries in which they do business and economic, political and market factors, among other things. These forward-looking statements are not guarantees of future performance. Our actual future results, including the achievement of our targets, goals or commitments, could differ materially from those reflected or implied in the forward-looking statements, which involve risks, uncertainties and other important factors. Such risks, uncertainties and factors include the risk factors discussed in our most recent Annual Report on Form 10-K and subsequent quarterly reports on Form 10-Q and other reports filed with the SEC. With respect to our ESG targets, goals, and commitments outlined in this report or elsewhere, certain challenges, assumptions, risks, uncertainties and factors are identified in this report. We urge you to carefully consider all of the risks, uncertainties and factors discussed in such reports in evaluating the forwardlooking statements in this report. We cannot assure you that the results reflected or implied by any forward-looking statement will be realized or, even if substantially realized, that those results will have the forecasted or expected consequences and effects. The forward-looking statements in this report are made as of the date of this report, unless otherwise indicated, and we undertake no obligation to update these forward-looking statements to reflect subsequent events or circumstances.


©2022 Hawaiian Electric Industries, Inc.
