CATALYZING OUR FUTURE TOGETHER

ENVIRONMENTAL, SOCIAL & GOVERNANCE REPORT 2022

This is HEI’s fourth consolidated Environmental, Social and Governance (ESG) Report. This report is designed to help investors, customers, employees and other stakeholders understand how our strategies and operations advance our ESG objectives and long-term value creation.
This report was prepared in accordance with Sustainability Accounting Standards Board (SASB) guidance, using the electric utilities standard for Hawaiian Electric, and the commercial banks, commercial finance and mortgage finance standards for American Savings Bank. This report includes disclosures aligned with Task Force on Climate-related Financial Disclosures (TCFD) recommendations as well as our utility data in the Edison Electric Institute (EEI) template format.
This report should be read in conjunction with our Securities and Exchange Commission (SEC) filings (including our 2022 Annual Report on Form 10-K), as well as certain presentations, documents and other information that may be of interest to investors, all of which are available at www.hei.com.
Note: This report covers information we have determined to be important from an ESG reporting perspective, which is distinct from the materiality standard used for purposes of our financial disclosures. For additional information regarding HEI, please see our filings with the SEC.
In early Hawai‘i, the practice of laulima — many hands working together — was a core principle in which work was performed for the common good as part of a sustainable society. It remains as relevant today as then, as we strive together to sustain our islands for generations to come.

Introduction
Message from Our CEO & Chair
Our Common Purpose
Our Companies at a Glance
Hawai‘i’s Climate Leadership
HEI
Aloha kākou, greetings everyone.
Hawaiian Electric American Savings Bank
Pacific Current Appendix
Quantitative
The practice we call laulima — literally, many hands working together — has long been central to the way of doing business in Hawai‘i.
As people living and working on islands, we’re acutely aware that our resources are finite, that important decisions involve tradeoffs and that we are part of an intricately interdependent community whose future depends on our ability to meet the needs of today while providing for those of future generations.
Laulima begins with recognizing that we are part of something bigger than ourselves, and that if we reach out to help and lift each other up, then collectively we will thrive. The longterm success of any worthwhile undertaking requires us to team with others — people whose experiences and ideas, whose struggles and triumphs can expand and deepen our understanding of the challenges we all face and inform the actions we take. The more that
we commit ourselves to serving the greater good, the more likely we are to act in ways that allow us not simply to advance, but to leap forward into a future that’s brighter for us all.
At HEI, we recognize that all businesses impact, are affected by and share responsibility for systemic challenges like climate change and social inequities. We also know that the effectiveness of our own environmental, social and governance (ESG) initiatives depends on how well we listen to, understand and empower the communities around us — our employees, associates, partners and customers.
As providers of critical infrastructure and services, the HEI family of companies plays an essential role in addressing climate change, which includes reducing greenhouse gas emissions and increasing resilience; economic health and affordability, which includes affordable housing and an equitable energy transition; and the diversity, equity and inclusion of employees across our businesses. Our board of directors, our customers, partners and suppliers, and all of our employees are vital players in our collective efforts to address these challenges.
Our utility, Hawaiian Electric, contributes to this effort by working to directly decarbonize Hawai‘i’s electricity and ground transportation sectors while enhancing the resilience of our electricity system and protecting our communities from the impacts of climate change.
In 2022 Hawaiian Electric achieved a consolidated renewable portfolio standard (RPS) of 32% that puts the company on track in relation to Hawai‘i’s statutory goal of 40% RPS
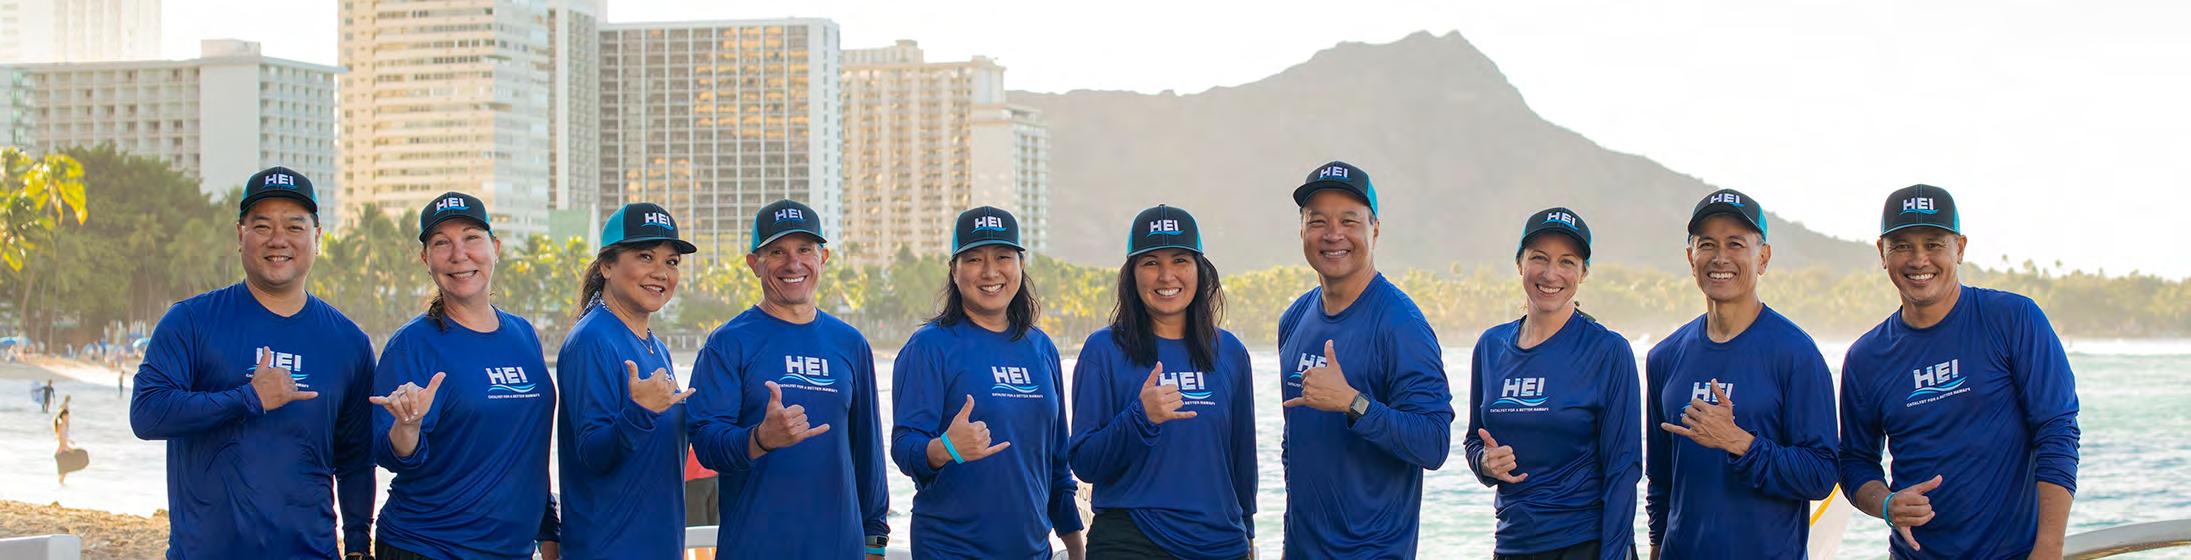
“The more that we commit ourselves to serving the greater good, the more likely we are to act in ways that allow us not simply to advance, but to leap forward into a future that’s brighter for us all.”Above: The HEI leadership team paddled in outrigger canoes as part of a team-building exercise. From left to right: Kurt Murao, EVP, General Counsel; Christine Ohashi, VP, Internal Audit; Darcy Endo-Omoto, VP, Executive Advisor to the President; Scott Valentino, Pacific Current President; Ann Teranishi, American Savings Bank President and CEO; Shelee Kimura, Hawaiian Electric President and CEO; Scott Seu, HEI President and CEO; Julie Smolinski, VP, Strategy and Corporate Sustainability; Paul Ito, EVP, Chief Financial Officer; AJ Halagao, VP, Corporate and Community Advancement.
Introduction
Message from Our CEO & Chair
Our Common Purpose
Our Companies at a Glance
Hawai‘i’s Climate Leadership

HEI
Hawaiian Electric American Savings Bank
Pacific Current
Appendix
Quantitative
by 2030.1 Hawaiian Electric also achieved major milestones in its Climate Change Action Plan, including ending the use of coal-fired generation in Hawai‘i and bringing online the largest solar-plus-storage plant in the state. Over time, these and many other projects that are currently underway will help stabilize the cost of energy for customers while bringing our state closer to its ambitious climate change goals.
As it seeks to advance economic development, affordability and environmentally sustainable operations, American Savings Bank continues its robust investment in Hawai‘i’s economy, lending $2 billion in 2022 to help Hawai‘i businesses and families achieve their goals. ASB supports and invests in affordable housing in Hawai‘i to provide more quality living spaces for families, keiki (children) and kūpuna (senior citizens), with current investments in more than 25 low-income housing projects in Hawai‘i and philanthropic support for ALICE (asset limited, income constrained, employed) families in Maui County. In 2022, ASB also teamed up with nearly 30 local merchants on four islands to offer special discounts when customers use their ASB personal Visa® debit card, giving participating retailers a welcome, post-pandemic boost in business. Finally, ASB helped address climate change in part by originating 270 new clean energy loans totaling $12 million, allowing homeowners to purchase and install their own photovoltaic systems, solar water heaters, solar air conditioning and battery backup and storage systems.
Our infrastructure investment platform, Pacific Current, acquired a ~7 MW closed loop biomass plant on Kaua‘i and completed construction on the University of Hawai‘i’s fifth solar + storage project at Honolulu Community College, bringing its portfolio to more than 80 MW of operating assets across Hawai‘i. The company continued to deploy electric vehicle charging systems, expanding charging options for electric vehicle owners and supporting the state’s transportation decarbonization goals.
As you read through the details of these and other initiatives in this year’s ESG report, we invite you to join with us and think and act as islanders do. The finitude of resources, our collective interdependence and our responsibility to future generations are conditions we all share regardless of where we live. Working together, our community thrives and when that happens, so too will HEI. To leap forward, we will listen, join our hands and work for the greater good with common purpose.
Me ke aloha pumehana — with warm regards,

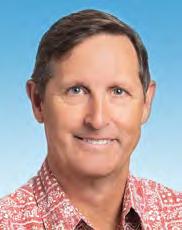
 Scott Seu President and Chief Executive Officer

 Adm. Thomas Fargo Chair, Board of Directors
Above: In 2022, Hawaiian Electric president and CEO Shelee Kimura, HEI president and CEO Scott Seu and American Savings Bank president and CEO Ann Teranishi completed their first year together as HEI’s leadership team. We rededicated ourselves to working together across our family of companies and with partners throughout the state to serve our communities and create a better Hawai‘i.

We dedicate ourselves to a better Hawai‘i — one that is thriving economically, environmentally, culturally and socially — where all in our community enjoy an abundance of resources and opportunities that enable them to achieve their hopes and dreams.

Our collective impact is amplified by the talent, innovation and commitment of employees working together across our family of companies and with partners throughout Hawai‘i.
We will navigate a path toward a resilient and sustainable future, rooted in aloha for one another, respect for our lands and integrity and humility in our leadership.


Introduction
Message from Our CEO & Chair
Our Common Purpose
Our Companies at a Glance
Hawai‘i’s Climate Leadership
HEI
Hawai‘i has a long history of leading the nation in establishing ambitious climate goals. At HEI, we recognize the critical role we play in this journey. Our subsidiaries are uniquely positioned to advance statewide climate change mitigation and adaptation efforts. We expect to achieve net zero emissions from power generation by 2045 and have aligned our strategies with this ambition.
Hawai‘i sets goal of 40% electricity sales from renewables.
Hawai‘i becomes the first state in the country to:


Hawaiian Electric American Savings Bank
Pacific Current Appendix
Quantitative
Set goal of 100% electricity sales from renewables by 2045
Adopt the goals of the Paris Agreement following U.S. withdrawal in 2017
Commit to carbon neutrality by 2045
Hawai‘i Public Utilities Commission establishes performance-based regulatory framework (PBR) to further align Hawaiian Electric’s financial performance with 100% renewable energy targets and other climate objectives.

Hawaiian Electric establishes its Climate Change Action Plan, committing to reduce carbon emissions from generation by 70% by 2030 (vs. 2005 baseline).

Hawai‘i ends use of coal with retirement of its last remaining coal-fired power plant.
HEI, Hawaiian Electric and American Savings Bank sign the Hawai‘i Executive Collaborative’s Climate Action Pledge, committing to measure and reduce emissions in partnership with other Hawai‘i-based businesses.
As a company with a strategy focused on Hawai‘i, and with all of our operations in the state, we are intimately tied to the strength and sustainability of Hawai‘i’s communities. Our family of Hawai‘i-based companies is guided by our common purpose, which underscores this connection and serves as our North Star.

Introduction
HEI
Our Companies
Our Priorities Environment
GHG Emissions Inventory
TCFD Disclosures
Social Governance
Hawaiian Electric American Savings Bank
Pacific Current Appendix
Quantitative
Our companies provide the energy and financial infrastructure that empower much of the economic and community activity of our state. Our three subsidiaries all contribute meaningfully to advancing our common purpose.
FOUNDED 1891
SERVES 95% OF HAWAI‘I’S POPULATION
Leading a community-wide energy transition
Our utility is at the center of Hawai‘i’s energy transformation efforts, partnering with stakeholders and community members to help drive a clean energy transition that benefits our whole community. Our work includes running the largest renewable energy procurement effort ever undertaken in the state so we can reduce fossil-fuel usage and the energy bill fluctuations that come with it; integrating the nation’s highest percentage of rooftop solar per capita among investor-owned utilities; expanding community-based renewable energy programs to enable those without the ability to add rooftop solar to benefit from renewable energy; modernizing the grid; and helping electrify more of our economy.
FOUNDED 1925
ONE OF HAWAI‘I’S LARGEST FINANCIAL INSTITUTIONS
American Savings Bank’s success relies upon the economic health of businesses and families in our state. That’s why ASB is actively engaged in building a sustainable local economy. We do this through our core banking operations by financing businesses that help diversify our economy and create new jobs; lending for clean energy, electrification and energy efficiency projects that support our state’s decarbonization efforts; and providing funding for community development efforts and sustainable, affordable and workforce housing to enable more Hawai‘i families to thrive. We also work to build a more sustainable local economy by fostering innovation and entrepreneurship, furthering financial literacy and improving the environmental impact of our operations.
Pacific Current was created to advance Hawai‘i’s sustainability through green infrastructure investment. We see sustainable infrastructure — to support clean transportation, renewable energy, local agriculture and water and wastewater management — as an opportunity to help solve important challenges for our state, create local jobs and support our economy. Pacific Current’s investments to date include bioenergy, solar-plus-storage systems, EV charging and water treatment.
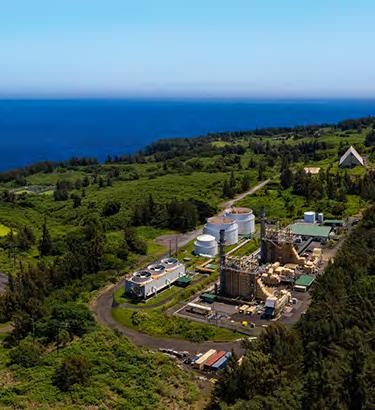 FOUNDED 2017
~80 MW OPERATING FACILITIES IN HAWAI‘I WITH A FOCUS ON RENEWABLES
FOUNDED 2017
~80 MW OPERATING FACILITIES IN HAWAI‘I WITH A FOCUS ON RENEWABLES
JULIE SMOLINSKI, VP Strategy & Corporate Sustainability at HEI

We developed the consolidated HEI ESG priority assessment in 2021, building upon earlier assessments conducted by each of our subsidiaries. This combined assessment prioritizes issues based on their importance to our business performance and value creation and to our stakeholders, including customers, employees, investors, policy makers, community leaders and non-profit organizations.
Our top ESG priority areas reflect HEI’s common purpose, and highlight the essential connection between the health of Hawai‘i’s environment, economy and communities and our success as a company. These priority areas are decarbonization, economic health & affordability, reliability & resilience, secure digitalization, employee engagement, climaterelated risks & opportunities, and diversity, equity & inclusion.
More detailed information on how we defined and identified these priorities can be found here.
“When we think about sustainability for our HEI family of companies, what we’re focused on is the factors we need to manage well in order to provide long-term value for our customers, employees, communities and shareholders. Those factors are reflected in our ESG priorities, which are aligned with our business strategies and operations.”
Our ESG priority areas align with the United Nation’s Sustainable Development Goals (UN SDGs) and with the Aloha+ Challenge. The Aloha+ Challenge, Hawai‘i’s statewide sustainability framework, has been recognized as a model for local implementation of the UN SDGs and for other island economies as they tackle challenges like energy and food security, waste management and economic growth.
Hawai‘i Green Growth, which has been designated a UN Local2030 Hub, worked with stakeholders across the islands to develop the Aloha+ Challenge. Progress on the Aloha+ Challenge goals is tracked through an online dashboard and measured through community co-developed metrics and indicators. All HEI companies are actively involved in Hawai‘i Green Growth, including through the Sustainability Business Forum, which brings together businesses throughout the state to collectively advance important sustainability efforts, including energy efficiency and local food production.
HEI, Hawaiian Electric and ASB signed the Hawai‘i Executive Collaborative Climate Coalition Pledge in 2022, committing to measure and reduce emissions while partnering with others to advocate for equitable and effective climate policy.
READ MORE
Leverage the strength of our companies to:
Lead and facilitate GHG emissions reductions across Hawai‘i
Reduce enterprise-wide carbon emissions
Increase climate adaptation efforts, with a focus on resilience
Invest in business models that drive climate solutions (e.g., electrification)
Advocate for sound policies to meet climate objectives
Introduction
HEI
Our Companies
Our Priorities Environment
GHG Emissions Inventory
TCFD Disclosures
Social Governance
Hawaiian Electric American Savings Bank
Pacific Current Appendix
Quantitative
HEI’s core strategies are deeply integrated with climate change mitigation and adaptation outcomes. The long-term value of our enterprise is directly linked to our ability to support climate goals at the local, national, and global levels and our ability to adapt to climate impacts.
Our companies are uniquely positioned to advance Hawai‘i’s statewide climate efforts. As providers of critical infrastructure and services, our subsidiaries play essential roles in Hawai‘i’s transition to a net zero economy. Hawaiian Electric anchors our climate change strategy, as the utility aggressively decarbonizes Hawai‘i’s energy and transportation sectors while building resilience to the impacts of climate change. American Savings Bank provides financing for its customers to invest in clean energy and resilience projects and is making its banking operations more sustainable. Pacific Current is deploying innovative sustainability projects to help Hawai‘i achieve its climate ambitions and a more sustainable future.
Execute Climate Change
Action Plan to achieve aggressive electricity generation emissions reductions
Promote beneficial electrification to reduce emissions in other sectors (e.g., transportation)
Evaluate emissions removal options (e.g., carbon removal, offsets) as levers towards net zero goal
Enhance system resilience
Navigate energy transition with attention to affordability, reliability and environmental justice
Finance Hawai‘i’s climate transition through lending for energy efficiency, renewable energy and storage, electric vehicles, fleet electrification and resilience
Fund sustainable and affordable housing
Improve resource efficiency across bank operations
Invest in non-regulated sustainable infrastructure, including electric vehicle charging, renewable energy and storage
Contribute to sustainability efforts in other sectors, including water, wastewater, agriculture and carbon removal, storage and re-use technologies
Introduction
HEI
Our Companies
Our Priorities
Environment
GHG Emissions Inventory
TCFD Disclosures
Social Governance
Hawaiian Electric American Savings Bank
Pacific Current Appendix
Quantitative
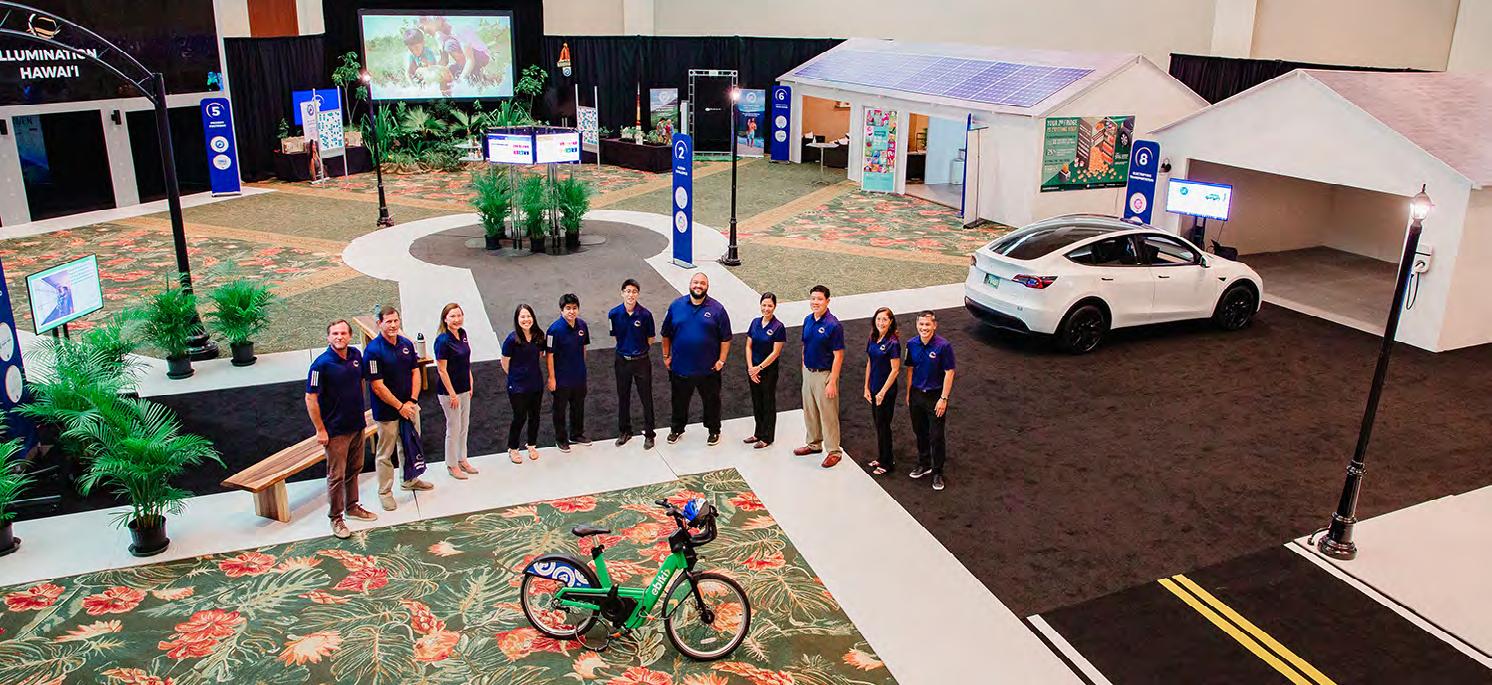
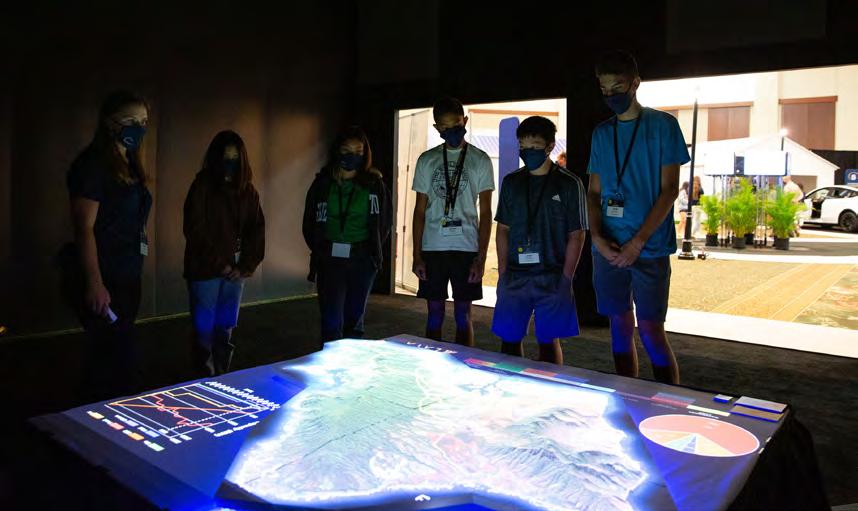
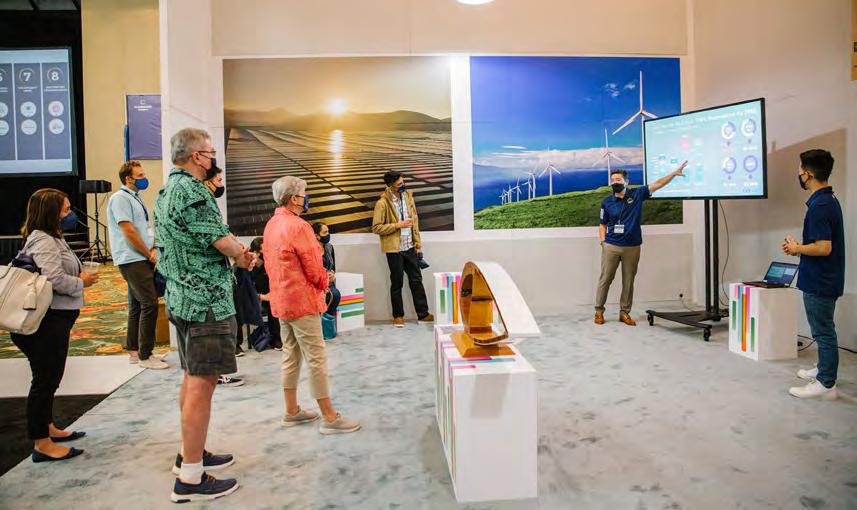
In collaboration with energy stakeholders, environmental groups, academic institutions, government agencies and community leaders, HEI organized Illumination Hawai‘i: Summit on Energy and Climate. The summit included conversations around climate mitigation and adaptation, clean energy transformation, conservation and decarbonizing our economy.
The centerpiece of the summit was the Illumination Village of the Future, an interactive learning experience that enabled our student guests and other visitors to learn from local innovators and community leaders regarding the diverse efforts and innovative solutions underway to help Hawai‘i achieve a resilient and more sustainable future.
Given how central climate impact is to our state and our strategies, we’ve prioritized measuring and reporting on HEI’s enterprise-wide GHG emissions. We completed our first detailed emissions inventory in 2022 and continue working with experienced advisors to calculate and disclose emissions in line with global and industry standards. This year, we’ve built upon our initial inventory by expanding coverage of Scope 3 categories for non-utility subsidiaries.
The GHG emissions inventory captures the types of emissions listed in the table above over the last three years (relative to a 2015 base year, the earliest year for which we have a complete enterprise-wide inventory). Net enterprise-wide GHG emissions in measured categories decreased 13% from 2015 to 2022, driven largely by reductions in the utility’s generation-related emissions. In 2022, we saw an increase in absolute emissions relative to 2021 as overall electricity demand increased in response to Hawai‘i’s continued postpandemic economic recovery. Emissions intensity of electricity generation continued decreasing in 2022 (see page 91), but the increase in electricity demand caused overall emissions to rise. While the state’s last coal plant shut down late in the year, supply chain challenges delayed anticipated contributions from new renewable energy projects.
Direct emissions, including:
Company-owned generation
SCOPE 1
Company vehicle fleet
Fugitive emissions from company operations
Indirect emissions, primarily:
SCOPE 2
Evaluated for all entities.
Utility generation represents nearly the entirety of Scope 1 enterprise emissions.
SCOPE 3
Purchased electricity for use in own operations
Fugitive emissions from HVAC units in leased facilities
Value chain emissions, including:
Purchased electricity for resale
Upstream emissions from purchased fuelrelated activities, such as extraction and production
Business travel and employee commuting
Evaluated for all entities. Utility electricity is generated directly from company-owned power plants or from the grid. As the utility is vertically integrated and does not access wholesale markets, its Scope 2 emissions are already fully accounted for in its Scope 1 and 3 generation emissions.
Evaluated for the utility, as its Scope 3 emissions are significant and include generation-related categories. This year, we’ve built upon our initial inventory by adding coverage of selected Scope 3 categories for non-utility subsidiaries.
As these projects come online, we expect to continue our emissions reduction trajectory in line with our targets. We will be providing further updates in 2023 about our pathway to achieving target reductions.
The following pages include a summary of our consolidated enterprise inventory and each entity’s historical GHG emissions inventory and components. Please see Appendix — GHG Inventory Methodology for notes on methodologies and emissions factors used in developing the inventory.
We have chosen to display both (a) a consolidated view of our inventory to show our combined footprint and (b) GHG inventories by subsidiary to reflect categories and sources specific to each operating business, which is where the sources can be most impacted by company actions. With respect to the consolidated inventory, please note that since all of our companies operate in Hawai‘i and one of those companies is an electric utility, enterprise-wide emissions will not exactly equal a sum of the emissions from each entity. For example, for ASB, the HEI holding company and Pacific Current, Scope 2 purchased electricity emissions largely represent electricity these entities purchase from our utility and are thus already reflected in our utility Scope 1 and 3 generation emissions. Similarly, Pacific Current’s Scope 1 owned generation largely represents energy that it generates at its Hamakua Energy facility and sells to Hawaiian Electric for resale on Hawai‘i Island; thus it is counted in the utility’s Scope 3 purchased electricity for resale category.
our initial inventory by adding coverage
Note: While the utility continues to execute on its plans, and currently believes that the 70% GHG emissions reduction target remains achievable, additional renewable energy procurements and timely construction of significant generating capacity beyond its current Stage 3 RFP process are required. Future events may impact the pace and amount of newly installed renewable variable and firm generation or cause unexpected issues with existing generation, and thus affect the timing for achievement of our goals.
“This year, we’ve built upon
of selected Scope 3 categories for non-utility subsidiaries.”
Decrease in net enterprise-wide GHG emissions in measured categories vs. 2015*
Decreased emissions
Increased overall electricity demand
Acquisition of Army T&D equipment
Increased business travel and commuting
*Based on preliminary 2022 data.
Note: Figures have been developed in partnership with an experienced GHG emissions advisor, and should be considered preliminary and subject to future verification. Numbers may not add up precisely due to rounding. Certain totals for 2015, 2020, and 2021 have been revised slightly from previous disclosures to reflect considerations including: use of IPCC AR4 GWPs consistent with regulatory reporting, recategorization of a minor utility generation asset for consistency with financial accounting, and addition of select Scope 3 categories for non-utility subsidiaries.
As a vertically integrated utility without access to wholesale electricity markets, the utility's Scope 2 electricity use is already reflected in its Scope 1 and 3 generation emissions
ii SF6 emissions are from T&D equipment losses from O‘ahu only, and do not include Hawai‘i Island or Maui County.
iii T&D losses associated with purchased power are included in Scope 3 purchased electricity emissions.
iv Biogenic CO2 emissions from biofuel combustion are reported separately and not included in totals (CH4 and N O from biofuel are included in totals).
v Scope 2 fugitive emissions include emissions from HVAC units not owned or controlled (generally leased facilities).
vi Pacific Current data does not yet reflect emissions (primarily biogenic) from a closed-loop biomass plant acquired in 2022; employees from this acquisition are included in commuting data for consistency with 10K disclosures.
vii Categories in purple are also reflected in utility Scope 1 and 3 generation emissions. To correct for double counting, these items have been removed from consolidated totals. Adjustment amounts exclude ASB electricity purchased outside of Hawaiian Electric service areas.
6.9M
Note: Changes driven largely by the bank’s move to its current campus in 2019 and shrinkage of branch footprint.
Note: Reductions driven largely by transitioning generation to clean and renewable energy sources.
SCOPE 1: Direct Emissions
SCOPE 2: Indirect Emissions
SCOPE 3: Value Chain Emissions
Hawaiian Electric’s Scope 2 emissions are from electricity produced either on-site or from the grid, and are already captured in generation-related Scope 1 and 3 emissions.
* Includes fugitive SF6 T&D emissions and mobile combustion (company vehicle fleet)
** Includes upstream mobile fuel emissions, employee commuting and business travel
As noted above, the utility’s structure (vertically integrated with no access to wholesale electricity markets) means that its Scope 2 electricity use emissions are already reflected in its Scope 1 and 3 generation emissions. The utility’s generation emissions are also inclusive of transmission and distribution (T&D) losses, reflecting the electricity that is consumed/lost in a T&D system. While utilities sometimes report independent power producer (IPP) T&D losses as Scope 2 emissions, the utility has categorized these IPP T&D losses as Scope 3 to remain consistent with its other IPP-related public reporting.
Note: Reductions driven largely by transitioning a portion of generation to biofuels.
As of 2022, the utility’s preliminary GHG emissions from electric generation represented a 22% reduction from its Climate Change Action Plan 2005 baseline. The utility maintains a publicly available, online GHG emissions scorecard to report annual emissions from sources that supply electricity to our grids.
Note: All figures should be considered preliminary and subject to future verification. Detailed GHG methodology and assumptions are available on page 74. Although utility Scope 2 emissions are captured in Scopes 1 and 3 for the utility (as discussed above), the company intends to further quantify utility Scope 2 emissions in subsequent reports in order to better inform efficiency-related emissions reduction strategies. Biogenic CO2 emissions from biofuel combustion are considered carbon neutral. They are calculated and shown on page 13 but not included in utility emissions totals, in line with the GHG Protocol guidance.
Note: Reductions driven by decreases in administrative space and electricity use.
The following section is a condensed summary of our TCFD disclosures. For a more detailed discussion of these topics, please see our full TCFD document available here.
Company strategies are overseen by the Board as a whole and are managed through HEI’s strategic planning processes. The Board provides guidance on strategic priorities and plans and approves the overall corporate budget to allocate resources for agreedupon strategies.
The Board, along with the operating company boards of Hawaiian Electric and American Savings Bank, are involved in frequent discussions about and receive regular reports on important ESG-related risks and strategic matters. Such discussions and reports have included:
Introduction
HEI
Our Companies
Our Priorities
Environment
GHG Emissions Inventory
TCFD Disclosures
Social Governance
Hawaiian Electric American Savings Bank
Pacific Current Appendix

Quantitative
Annual review of company strategy and enterprise risk at board strategy retreats:
x 2019: “deep dive” on climate change risk and sea level rise, which included presentations by a leading climate risk analytics firm and by each operating company on climate-related risks and mitigation plans
x 2020: update on the integration of material ESG elements, including climate change, into risk management and strategic planning
x 2021: “deep dive” on decarbonization strategies, alignment with global climate ambitions, and development of utility’s climate targets and pathways to achieve net zero carbon emissions
x 2022: analysis of cross-sector decarbonization pathways for Hawai‘i to achieve climate objectives
Quarterly review of progress on strategic initiatives as part of regular board meetings
Monthly updates on Hawaiian Electric’s progress on initiatives to achieve Hawai‘i RPS goals and Climate Change Action Plan targets
Each Board committee has responsibilities with respect to oversight of climate-related risks and opportunities, and reports on its activities and recommendations through regular and, as necessary, special Board and/or committee meetings, as listed on the next page.
The organization’s governance around climate-related risks and opportunities
Strategy
The actual and potential impacts of climate-related risks and opportunities on the organization’s business, strategy and financial planning
The processes used by the organization to identify, assess and manage climate-related risks
The Board has approved a consolidated ERM system recommended by management. The system is designed to identify and assess risks across the HEI enterprise so that information regarding enterprise risks can be reported to the Board along with proposed strategies for mitigating and managing these risks. The structure of the ERM system includes separate chief risk officers at Hawaiian Electric and ASB in addition to HEI’s chief risk officer (CRO). The ERM functions for “other” operations of HEI, such as Pacific Current, are performed by the HEI CRO or HEI employees under the supervision of the HEI CRO. Each subsidiary CRO reports directly to the respective subsidiary president and functionally to the HEI CRO, who reviews and evaluates such risks on a consolidated basis. This risk management structure allows for industry-specific risk identification and management at the subsidiary levels while also ensuring an integrated and consolidated view of risk at the holding company level.
Source: TCFD, "Implementing the Recommendations of the Task Force on Climate-Related Financial Disclosures"
(June 2017)
The metrics and targets used to assess and manage relevant climaterelated risks and opportunities
The NCG Committee is responsible for ensuring all priority ESG issues, including climate-related risks and opportunities, have appropriate Board oversight.
The Audit & Risk Committee is responsible for overseeing (i) the ERM program, which includes management of climate-related risks and (ii) financial and other reporting to ensure transparency and consistency with best practices and standards.
The Compensation & Human Capital Management Committee oversees executive compensation, including establishing incentive goals to drive execution of strategy, as well as human capital management matters such as diversity, equity and inclusion. Several ESG goals, including those related to climate change, are included in executive incentive compensation for HEI and utility executives. This includes goals related to accelerating renewable energy, reducing GHG emissions and improving reliability and electrification of transportation (EoT).
In addition to the HEI Board committees, the Hawaiian Electric Audit & Risk Committee assists in overseeing the utility ERM program and the ASB Risk Committee assists in overseeing the bank’s ERM program.
In preparation for this report, risks and opportunities were considered for three time horizons — short term (<5 years), medium term (5-15 years) and long term (15+ years).
Climate change presents a range of risks as well as meaningful opportunities for our companies. With our remote island location, we see many climate-related risks — and our need to address them — as near-term considerations. We also see many of our opportunities the same way. We increasingly incorporate quantitative climate insights into our long-term strategies, as reflected in our proposed climate resilience program and ongoing statewide decarbonization pathways analysis. The paragraphs that follow discuss key risks and opportunities related to climate change that we’re addressing and factoring into our strategies and plans.
Climate change is expected to increase the severity and frequency of hurricanes, flooding and droughts in Hawai‘i while leading to rising temperatures and sea level across the state. If not appropriately planned for and addressed, these physical climate change impacts could cause damage to (i) Hawaiian Electric facilities, impacting operations and reliability, (ii) the properties that secure American Savings Bank’s residential and commercial loans, impacting the value of that collateral and (iii) the state economy, affecting the financial health of our customer base. We’re focused on managing and mitigating physical risks to our operations from climate change and are leaders in community planning initiatives to promote physical and economic resilience in the state.
Hawaiian Electric continues its work to assess resilience threats and prioritize improvements to enhance resilience. This has included an independent review of potential resilience vulnerabilities, using climate risk analytics to refine and prioritize specific needs and engaging with stakeholders to incorporate their perspectives. These considerations are part of our Integrated Grid Planning (IGP) process, which is our in-progress planning effort to determine future generation, transmission and distribution needs for our system.
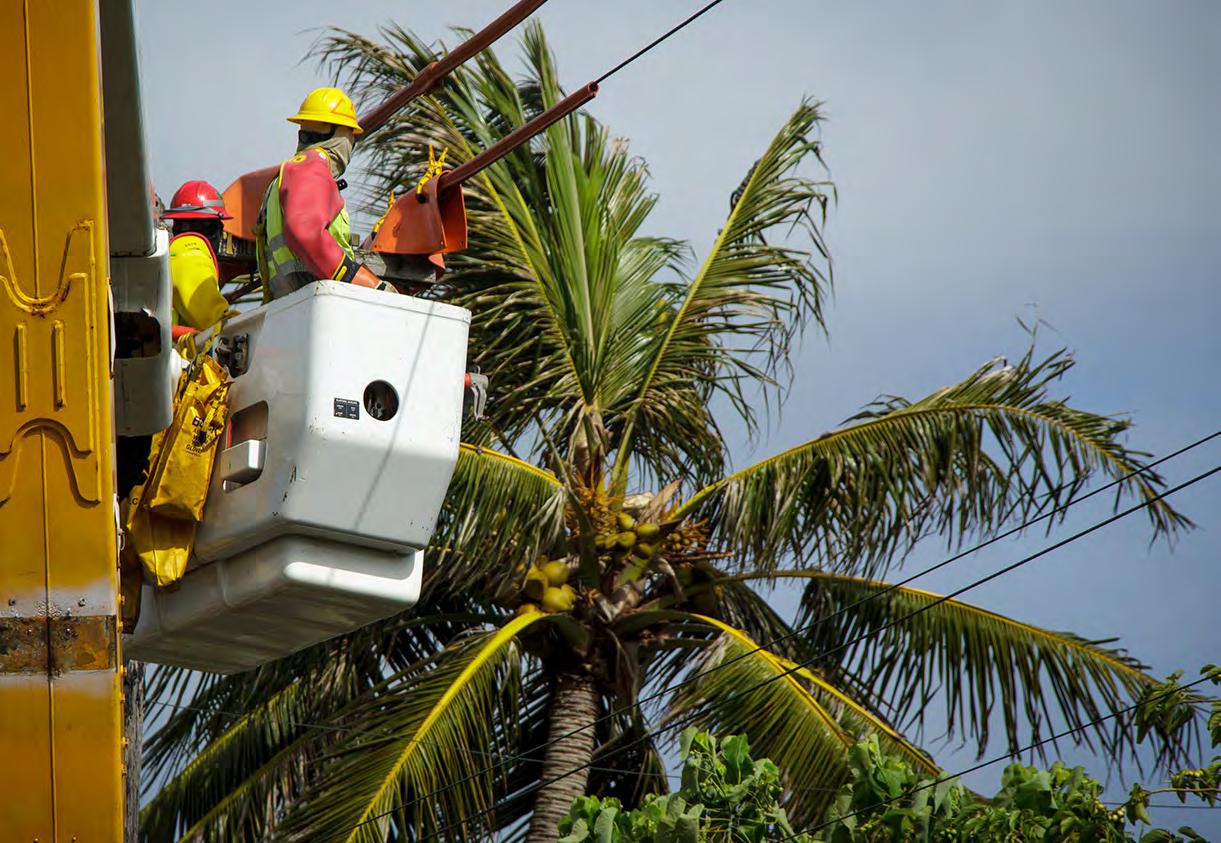
Hawaiian Electric engaged a leading consulting firm in electric utility resilience to perform an independent assessment to identify key vulnerabilities to severe natural events. Following this assessment, the consultant report outlined a set of recommendations to ensure quick restoration of power to critical customers, reduce total restoration time and minimize the total amount of damage from a severe natural event. This included recommendations for system hardening, substation flood monitoring, enhanced vegetation management, emergency restoration, damage prediction modeling and additional in-depth studies.
In 2022, Hawaiian Electric worked with a nationally recognized consulting firm to develop long-term, economywide decarbonization scenarios that meet Hawai‘i’s climate targets.3 This analysis covers a wide range of sectors across Hawai‘i including electricity, transportation, agriculture, buildings and other commercial activities. The study is being provided to policymakers, stakeholders and the broader public to help focus efforts, measure progress, and drive action plans.
Among the key findings of the pathways analysis:
Renewable electricity generation is necessary but not sufficient by itself to meet Hawai‘i’s decarbonization goals.
Electrification is a key driver in decarbonization of ground transportation but in aviation and marine transportation decarbonized fuels will be required.
The pace of GHG reductions will be governed by the lifetimes of energyconsuming equipment, vehicles and buildings, as well as by the timelines to site and develop new renewable resources and the electricity infrastructure to deliver that power to customers.
Even ambitious efforts to achieve statutory GHG reduction targets may not be enough and more aggressive near-term actions may be required to hit the State of Hawai‘i’s 2030 target of 50% GHG reductions.
Energy efficiency and conservation support the net zero goal by reducing the amount of renewable electricity and fuels that must be procured.
The electrification of transportation and industry will significantly increase the amount of electricity that needs to be generated.
Carbon dioxide removal — also called carbon sequestration — will be required to achieve net zero, either through increased natural sinks or negative emissions technologies.
New policies and regulations are needed to ensure the deployment of decarbonization strategies outside the electric sector.
“Hawaiian Electric continues its work to assess resilience threats and prioritize improvements to enhance resilience.”
Hawaiian Electric engaged a leading provider of predictive climate risk analytics software to support initial climate risk analyses for its generation, transmission and distribution infrastructure. The utility used this climate risk analysis to inform decisions about the location, prioritization and timing of investments to improve electric system resilience.
Hawaiian Electric is also using these analyses to inform its IGP process and planning. The IGP process includes a Resilience Working Group composed of stakeholders representing critical infrastructure providers, emergency management agencies, state and local government energy, planning, climate change and resilience officials, the hospitality and healthcare industries, the military, solar and other renewable energy providers and other stakeholders. Thus far, the Resilience Working Group has identified key resilience threats and associated scenarios; developed recommendations for: 1) the IGP process, 2) utility work outside of the IGP process and 3) key customer and infrastructure partners to improve resilience; developed a taxonomy for categorizing and prioritizing critical customers; and assessed the capabilities and needs of key customers and infrastructure.
The utility used insights from these analyses and the IGP Resilience Working Group to develop a five-year, $190 million Climate Adaptation Transmission and Distribution Resilience Program. The program prioritizes high-impact, cost-effective projects for O‘ahu, Maui County, and Hawai‘i Island to address climate-related vulnerabilities. Program benefits are evaluated against quantified risks, including projected countylevel impacts to GDP based on hurricane severity. Key elements of this plan include strategic investments in critical transmission and distribution asset hardening, wildfire prevention and mitigation, hazard tree removal and advanced resilience performance modeling. The program application was filed with the Hawaii Public Utilities Commission in June 2022. The utility is also pursuing federal grant funding for the program through the Infrastructure Investment and Jobs Act (IIJA) Grid Resilience and Innovation Partnerships (GRIP) program to help offset costs to customers. If awarded, the grant would offset about 50% of the program cost.
In parallel, Hawaiian Electric continues to focus on strengthening its emergency response capabilities through training and development as well as by engaging with community leaders and stakeholders to strengthen broader community resilience. See page 44 for more on our work to advance community resilience.
American Savings Bank regularly monitors its credit exposure in areas at risk of sealevel rise and increased exposure to climate-related weather events. Its appraisal team performs property research to confirm flood zones, and its underwriting decisions evaluate flood zone maps, which consider property location, topography and elevation. The bank requires borrowers with property in a Special Flood Hazard Area, as defined by the Federal Emergency Management Agency (FEMA), to maintain sufficient flood insurance throughout the life of the loan. Should Special Flood Hazard Areas change due to sea-level rise, the
bank may require affected borrowers to obtain flood insurance. The bank monitors leading indicators to assess how and when market valuations may reflect potential future climate change impacts and discusses such indicators and any mitigation recommendations with the ASB Risk Committee, HEI CRO and HEI Audit & Risk Committee.
ASB also considers and plans for other physical risks related to climate change, such as the potential for business interruption due to severe weather. To promote resilience and continued customer service, the bank’s core processing is located on the U.S. mainland with back-ups in several different U.S. states. This geographic diversification supports the bank’s ability to serve its customers even in the event of severe storms, flooding or other acute events impacting Hawai‘i.
While climate change presents significant risks, it also offers meaningful opportunities for HEI and its subsidiaries. As the State of Hawai‘i strives to transition to a carbon neutral economy and continues one of the nation’s most ambitious energy transformations, our companies have opportunities to invest in decarbonization and resilience, advance electrification of our economy to benefit all customers, offer new products and services and partner with our communities to advance a more sustainable future for Hawai‘i.
Adding hundreds of megawatts of renewable energy to our system and retiring fossil fuel-based generation to reduce carbon emissions, increase energy independence and promote customer bill stability
Incorporating battery storage to help integrate increasing amounts of intermittent renewable energy such as solar or wind resources
Creating opportunities for customers to benefit from and participate in the clean energy transition by providing programs and rate structures to integrate customer-owned distributed energy resources (DERs) that include private rooftop solar, battery storage, energy efficiency and electric vehicles
Expanding access to clean energy benefits through our community based renewable energy (community solar) program, enabling customers without the ability to add private rooftop solar, as well as qualified low-to-moderate income (LMI) customers, to participate in the clean energy transition and benefit from bill credits
Enabling the use of customer DERs to provide grid services, supporting reliable grid operations, responding to variability in electricity supply and demand and providing new opportunities for customers to gain value from connection to the grid
Advancing opportunities to electrify the state’s economy, including the transportation sector, and thus reducing Hawai‘i’s overall carbon emissions; this includes deploying utility-owned fast chargers, proposing make-ready infrastructure to support electric buses and fleets, providing educational resources to help overcome barriers to electric vehicle adoption and collaborating with stakeholders to advance electrification
Modernizing our grid to facilitate increased integration of clean energy and distributed resources, greater efficiency, resilience, improved reliability and more customer options
Enhancing the resilience of our system through partnering with key customers, including the military, to develop resilient generation and microgrids that can be isolated from the grid when needed; hardening or reinforcing critical transmission, sub-transmission and distribution circuits; locating equipment outside areas prone to flooding; and considering alternative paths for transmission circuits to increase geographic diversity
Taking a leading role in developing economy-wide net zero pathways to forecast how Hawai‘i’s economy will have to adapt to meet the state’s ambitious climate change goals and working with stakeholders to share and operationalize insights (e.g., impact of increased electrification on pathways)
Identifying opportunities to partner with different industries to deploy mitigation strategies that drive efficient infrastructure investment to address climate impact and opportunities
Earning financial incentives for accelerating the growth of renewable energy on our system through the renewable energy performance incentive (see discussion on page 24)
Financing customer investments in energy efficiency, renewable energy, storage, electric vehicles and resilience as businesses and consumers throughout Hawai‘i work to mitigate and adapt to climate change
Participating in tax credit programs, such as New Markets Tax Credits (NMTC), to help fund renewable energy and other projects in disadvantaged communities. Through a Hawai‘i-based community development entity formed in partnership with the O‘ahu Economic Development Board, the bank has helped deploy over $100 million in NMTCs and plans to apply for future allocations. These allocations bring new investments, services and jobs to underserved, low-income communities and include direct investment in renewable energy projects as part of our state’s clean energy transition.
Deepening customer relationships by offering educational resources to help customers plan for climate change impacts, such as sea-level rise or increased severity of storms, on homes and businesses
Enhancing the energy and water efficiency of the bank’s real estate footprint (reduced in recent years through office and branch consolidations) and incentivizing employees to use low-carbon transportation options
Reducing reliance on the physical retail branch network, increasing resource efficiency as the bank upgrades facilities and transitions to mobile- and technologyenabled “Anytime, Anywhere Banking”
Financing the development of sustainable, affordable and workforce housing; such housing can be equipped with features such as solar water heating, solar plus battery storage and efficient water and water reuse systems
In 2021, we conducted a high-level scenario analysis to assess the potential impact on our business, strategy and financial planning of certain climate scenarios. To inform our analysis of risks and opportunities, we selected one transition scenario, the International Energy Agency’s Energy Technology Perspectives (ETP) 2ºC Scenario, and one physical scenario, the Intergovernmental Panel on Climate Change’s (IPCC) Representative Concentration Pathways (RCP) 6.0.
Accelerated
(Faster Innovation Case — 1.5ºC) PHYSICAL
In early 2021, we selected the ETP 2°C Scenario as a basis for our analysis. This choice was partially informed by our anticipation of an eventual shift to 1.5°C alignment. The ETP’s inclusion of a “Faster Innovation Case” provides an accelerated scenario focused on achieving a 1.5°C target by 2050.
We have since confirmed our view that the accelerated ETP Scenario is appropriate as it (i) recognizes the importance of decarbonizing economic sectors beyond electricity to reach net zero global emissions by 2050 (in line with a 1.5°C target) and (ii) highlights the role of the electricity sector in enabling broader economy decarbonization.
The accelerated ETP Scenario assumes a transformation of energy generation and consumption to yield a broad reduction in carbon emissions across energy generation, transportation, industry and buildings. Under this scenario, significant increases in renewable electricity generation enable decarbonization of other sectors. As more companies and sectors electrify, electricity consumption is expected to grow significantly. The scenario assumes renewable energy generation, process electrification and other technologies, such as carbon capture, utilization and storage (CCUS) and low-carbon fuels needed to effectuate carbon reductions, are commercially available or sufficiently advanced in their development lifecycle. Policymakers will have a critical role in enabling the transition, for example, by enacting policies to incentivize investment in new technologies and in electrification of the transport, industry and building sectors.
Increase in beneficial electrification. Electrification of transportation and other sectors would drive increased electricity demand. For our utility, this would require procurement and/or construction of more renewable energy generation to meet renewable energy and decarbonization targets, as well as infrastructure investment (such as make-ready infrastructure for electric vehicle charging) and upgrades to the transmission and distribution system. Increased electrification would enable the cost of such investments to be spread across a larger base, and thus would be expected to reduce the perunit cost of electricity for customers. However, greater generation needs could exacerbate land use issues (e.g., due to limited availability of land appropriate for siting utility-scale renewable energy projects), making large-scale projects challenging. The utility’s goal of net zero emissions from generation by 2045 is consistent with the 2050 economy-wide net zero target identified in 1.5°C scenarios.
Increased need for management of diverse sources and services. Increased reliance on electricity across other economic sectors would stimulate more demand for energy efficiency solutions as well as tools to manage and optimize energy usage. Customers are playing a more active role in energy generation and in providing services to the grid and this trend is expected to continue. Further growth in distributed energy resources (DERs) and aggregation of DERs to provide
grid services increases the need for a sophisticated grid and customer programs to integrate and optimize such resources. The role of the utility may include serving as a platform or marketplace that provides and manages a range of customer DERs and services from third-party service providers. A key challenge in this context is optimizing our state’s island grids using all available levers, including energy efficiency and other demand-side programs.
Affordable/workforce housing and sustainable investment. The bank would also see greater demand for financing solutions to develop and deliver more affordable, sustainable and energy-efficient housing options.
Opportunities to finance the clean energy transition. Our bank would see greater demand for financing solutions from retail and commercial customers to acquire and install distributed generation and storage assets, invest in energy efficiency and vehicle electrification and pursue other carbon reduction solutions, such as CCUS.
Investment in customer relationships. The changing energy landscape creates opportunities for new customer segments and service offerings. Expanded customer relationships may require additional investments by our utility to adapt to evolving customer expectations. Our bank may also need to invest in additional customer analytics and marketing to develop and deploy new banking products and services for customers investing in clean energy, efficiency and resilience measures.
Creation of new jobs and employment opportunities. The transition to a low-carbon economy and the corresponding evolving role of the utility to include more technologyenabled service delivery will require increased technological skills within our utility workforce. These changes are similar at the bank, as customers increasingly expect technologyenabled banking solutions and as the bank continues to enhance its digital offerings. Hawai‘i’s clean economy transition may also support other industries (e.g., regenerative tourism).
For our physical scenario we selected the RCP 6.0 Scenario. This scenario assumes a moderate approach to developing and integrating low-carbon solutions in the global economy. Under this scenario, global mean surface temperature is forecast to increase by 0.8 to 1.8ºC by mid-century and could increase up to 3.1ºC by 2100, leading to a range of climate impacts. Our climate risk models also incorporate parameters from the more severe RCP 8.5 Scenario. The Hawai‘i State Climate Commission’s 2022 Sea Level Rise Report indicates Hawai‘i could experience sea-level rise of 1 foot by 2050 and nearly 4 feet by the end of the century (mid-range estimates). Increased temperatures and sea level can lead to higher, more frequent storm surges, increased coastal flooding and erosion, increased inland flooding, more frequent periods of extreme heat and increased storm intensity and frequency. Hotter, drier conditions could also develop on some parts of the islands and could lead to increased frequency of wildfires.

Physical ramifications of climate change. Climate change could impact our utility’s physical assets, increase operational disruptions and negatively affect our customers. This would require further investments to “harden” our system, prevent and protect against wildfires, ensure sufficient geographic distribution of generation and transmission assets to enhance reliability and protect against safety risks to employees and customers. Investments to protect against/adapt to climate change physical impacts in advance are more cost effective than addressing those impacts after they occur.
Lending zone shrinkage at the bank. For our bank these physical impacts necessitate appropriate risk mitigation steps to avoid valuation impacts to loan portfolio collateral. The bank monitors such risks and has identified risk mitigation steps to be implemented if and when needed. As climate-related impacts continue to intensify, the bank may need to cease lending in certain at-risk parts of the islands.
Potential impact on tourism and the state economy. Warmer temperatures, sea-level rise, increased flooding and coastal erosion and greater frequency of severe weather could adversely impact Hawai‘i’s appeal as a place to live, run a business and visit. Our success is closely tied to the health of Hawai‘i’s economy, and a decline in tourism, business activity and/or rise in Hawai‘i residents permanently leaving the islands could reduce our customer base or impact customers’ financial health.
HEI tracks a range of metrics to assess, monitor and inform our actions to manage climate-related matters. Several of these metrics are reported in other sections of this report, notably the enterprise-wide GHG inventory (see pages 12-14). For the utility our primary climate-related metrics are carbon and other GHG emissions (see page 91), renewable energy performance (see pages 76 and 90) and system reliability performance (see page 82). For the bank, key climate-related metrics relate to sea-level rise, including the number and value of mortgage loans in the 100-year flood zone (see page 88) as well as internally monitored indicators of potential future shifts in Hawai‘i property market values. As we continue to mature our analyses of climate-related risks and opportunities we may refine and/or expand the metrics we track and report.
Renewable Portfolio Standard (RPS) represents the percentage of net electricity generated by renewable sources. The definition of Renewable Portfolio Standard (RPS) was changed by state law in 2022. It was previously defined as the percentage of electricity sold that came from renewable resources. GHG emissions apply to stack emissions from power generation on Hawaiian Electric’s system from both utility-owned sources and independent power producers.
We have aligned our efforts with Hawai‘i’s state RPS and carbon neutral to carbon negative economy goals. Since the enactment of the 100% RPS mandate, we’ve continued to accelerate our work to procure more renewable energy; these procurements are expected to significantly reduce carbon emissions within the next few years. Our company and management team are incentivized to continue our efforts to outperform the RPS milestones in both magnitude and timeframe. We have also adopted our own additional GHG reduction goals. We measure our performance against:
Hawai‘i’s statutory RPS requirements, which are to achieve 100% RPS by 2045, with interim goals of 30% by 2020, 40% by 2030, 70% by 2040. We outperformed the 2020 RPS goal, reaching 34.5% RPS (at the time calculated based on renewable generation as a percent of electricity sales) in 2020. Under the newly redefined calculation, we achieved 32% RPS in 2022. Notwithstanding the change in how RPS is calculated, we still expect to meet the 40% by 2030 requirement ahead of schedule.

Hawaiian Electric reports its RPS progress quarterly via its website.
Our utility’s Climate Change Action Plan goals, adopted in 2021, are to reduce GHGs in stack emissions from power generation 70% by 2030 (compared to 2005 levels) and achieve or exceed carbon neutrality from power generation by 2045. As of 2022, we achieved a preliminary 22% reduction compared to 2005.
Hawai‘i’s Performance Based Regulation (PBR) framework, which includes incentives for outperforming the RPS trajectory, faster interconnection of customer DERs and other demand-side incentives in areas such as energy efficiency. Hawaiian Electric reports its performance against PBR metrics via its website
“Our utility’s Climate Change Action Plan goals, adopted in 2021, are to reduce GHGs in stack emissions from power generation 70% by 2030 (compared to 2005 levels) and achieve or exceed carbon neutrality from power generation by 2045."
Hawaiian Electric has several financial incentives to outperform Hawai‘i’s statutory RPS goals:
Should Hawaiian Electric fall short of a statutory RPS milestone in 2030, 2040 or 2045, it could be subject to a penalty of $20 for each MWh that it is deficient. The penalty may be waived or reduced if the shortfall is due to circumstances outside the utility’s reasonable control.
In 2021, the Public Utilities Commission (PUC) implemented the RPS-A performance incentive to promote accelerated RPS achievement. The utility is eligible to earn a reward of $15/MWh in 2023 and $10/MWh in 2024 and beyond should it outperform the RPS-A target each year. The annual RPS-A targets are an interpolation of the RPS goals for 2020, 2030, 2040 and 2045 (definitions of RPS and RPS-A were initially different but have since converged).
x In 2022, the utility did not earn an award under the RPS-A incentive. Based on assumptions as of December 2022 regarding renewable project commercial operations dates and total generation, the 2023-2025 RPS-A performance incentive ranges are set forth in the adjacent table. Projections may change as completion timelines shift (see Renewable Project Status Board on Hawaiianelectric.com for latest updates).
In 2020 the Compensation Committee of the Board established a compensation incentive for HEI and utility executives to encourage executives to work toward achieving higher RPS levels well ahead of statutory requirements.
Beginning with the 2022-24 performance period, in light of Hawaiian Electric’s goal to reduce carbon emissions 70% by 2030 compared to a 2005 baseline, the climate goal component of the long-term incentive plan was updated to measure emissions reductions. For the 2022-24 and 2023-25 periods, 20% of HEI and Hawaiian Electric executives’ long-term incentive pay is tied to emissions performance.
As part of PBR, the PUC established several new Performance Incentive Mechanisms (PIMs) designed to incentivize the utility to achieve goals to advance an equitable, affordable clean energy transition. These PIMs include the RPS-A PIM described above and are discussed in detail on page 32.
“Beginning with the 2022-24 performance period, in light of Hawaiian Electric’s goal to reduce carbon emissions 70% by 2030 compared to a 2005 baseline, the climate goal component of the long-term incentive plan was updated to measure emissions reductions."
As stated in our common purpose, our employees are key catalysts in amplifying our collective impact. HEI places a high priority on ensuring that our employees are wellpositioned to deliver results for our businesses and communities. While our operating companies retain distinct cultural elements, we strive to create a consolidated HEI-wide approach to human capital management where appropriate. Our overarching talent strategy aims to position our companies as employers of choice in their respective industries. We pursue this ambition through focused investments in talent development and by taking a strategic, long-term approach to workforce planning. Key enablers on this journey include attractive and equitable benefits, a proactive approach to diversity and inclusion, and sustained efforts to cultivate a healthy corporate culture.
Human capital updates are regularly provided to the Compensation & Human Capital Management Committee of the HEI Board, and related metrics (e.g., employee engagement scores) are incorporated into executive incentive compensation. More detailed information on our employee strategies and efforts can be found in the operating company sections of this report (see pages 49-54 and 64-67)
“Our overarching talent strategy aims to position our companies as employers of choice in their respective industries.”
Workforce Planning Talent Development
Employer of Choice
Introduction
HEI Our Companies
Our Priorities
Environment
GHG Emissions Inventory
TCFD Disclosures
Social Governance
Hawaiian Electric American Savings Bank
Pacific Current Appendix
Quantitative

$3 Million

Donated by HEI Foundation and HEI Companies
$750,000
Donated by HEI Employees (Enterprise Wide)
Working together for a sustainable future
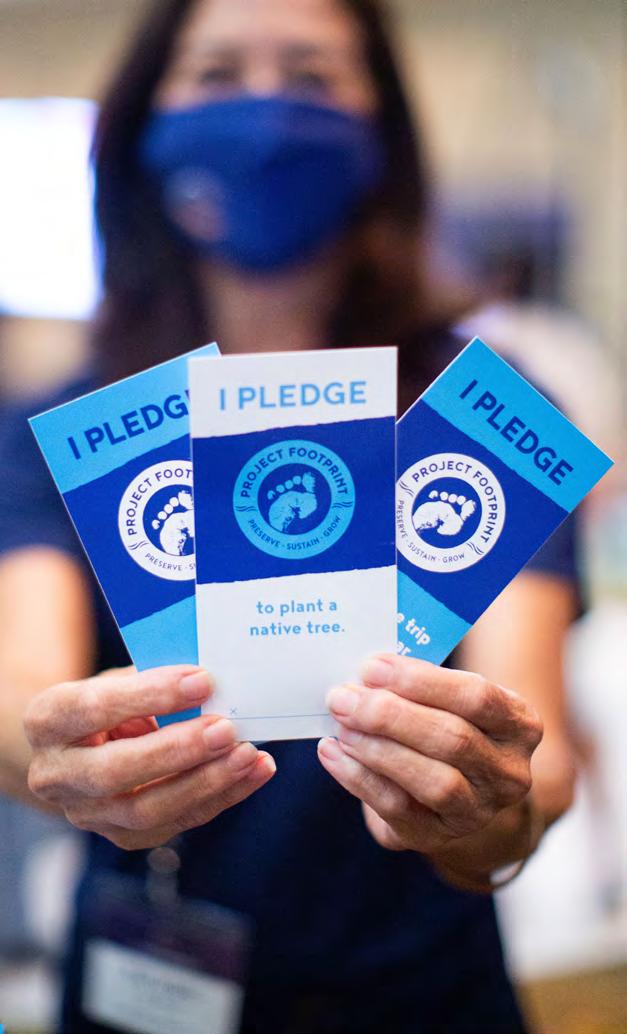
Project Footprint provides customers the knowledge and energy options they need to reduce their carbon footprint, helping Hawai‘i achieve its ambitious emissions reduction goals and transitioning our islands toward a more sustainable future.
20,000 Volunteer Hours by HEI Employees (Enterprise Wide)
The HEI Charitable Foundation is a longstanding part of our presence in Hawai‘i. The foundation focuses on community programs that promote environmental sustainability, community resilience, economic strength and educational excellence. These areas align well with our common purpose and our ESG priorities. We take pride in giving back to the community through volunteerism, grants, donations, scholarships and our employee matching gift program.
The HEI Charitable Foundation established the Kōkua Community Champion Service Award to honor individual employees who have demonstrated exemplary volunteer service in our communities. Each year, the Foundation also awards college scholarships to children of employees through the HEI Scholars program.
HEI Scholars are chosen based on factors including academic achievement, community service and career goals.
Project Footprint gained national recognition and received numerous awards for its innovative approach to customer engagement, creative messaging and commitment to environmental sustainability.

An initiative of the HEI Charitable Foundation, Project Footprint encourages participants to have an endemic Hawaiian tree planted in their name or in the name of a loved one. Each tree is tagged with an RFID chip and GPS technology, which enables participants to monitor and watch the tree grow online. All trees are planted at the Project Footprint Legacy Forest by the Hawaiian Legacy Reforestation Initiative, a nonprofit that has already planted more than half a million trees.
Project Footprint also encourages participants to support, donate and volunteer at other nonprofits aligned with their mission. These community partners include Bikeshare Hawai‘i, Blue Planet, Coral Reef Alliance, Hawaiian Islands Land Trust, Institute for Climate and Peace, Kupu, Mālama Learning Center, Mālama Maunalua, Polynesian Voyaging Society, The Nature Conservancy of Hawai‘i and The Trust for Public Land.
We see ESG-related strategies and risks as having the same potential as other strategies and risks to impact long-term value creation. As such, we’ve identified priority ESG factors across our businesses and have integrated them into our governance structures and management activities.
Company strategies are overseen by the HEI Board of Directors (Board) as a whole and are managed through our strategic planning and oversight process. The Board provides guidance on strategic priorities and plans and approves the budget to allocate resources for agreed-upon strategies.
Our Board reviews and provides input on major risks and determines our risk appetite. This includes risks relating to safety, resilience and climate change impacts. The HEI Audit & Risk Committee oversees our Enterprise Risk Management (ERM) program, which is designed to identify, assess and report key risks to the Board, along with strategies for mitigating and managing such risks. The Hawaiian Electric Audit & Risk Committee and the ASB Risk Committee assist in risk oversight of those subsidiaries.
The HEI Nominating & Corporate Governance Committee is responsible for ensuring appropriate Board oversight and governance for all material matters, including material ESG issues. It is also responsible for Board and senior executive succession planning.
Human capital management and diversity, equity and inclusion were previously overseen by the HEI Nominating & Corporate Governance Committee. The Board determined that these areas better align with the focus of the HEI Compensation Committee, and thus assigned these areas to that committee and renamed it the HEI Compensation & Human Capital Management Committee to reflect this expansion. This committee is also responsible for overseeing executive compensation, including establishing incentive goals to drive performance.
Several ESG goals are included in incentive compensation for HEI and utility executives. Our bank executive goals focus predominantly on bank financial performance, while bank executives also have individual goals, some of which tie to ESG matters such as human capital management. See our 2023 proxy statement for more information on executive performance goals.
20% of HEI and utility executive long-term incentive pay for 2022-24 and 2023-25 is based on achievement of emissions reductions aligned with the targets established in our Climate Change Action Plan
See the TCFD section of this report for further detail on ESG risk management.
The HEI Board possesses critical ESG expertise to oversee our enterprise and strategies. Below we’ve highlighted the ESG expertise of five of our independent directors who have direct experience on ESG topics, including renewable energy, climate change strategy and environmental management.
Celeste Connors is a climate risk expert and has advised U.S. presidents and other officials on clean energy and sustainable development. She served as Director for Climate Change & Environment at the National Security Council and National Economic Council. She is Executive Director of Hawai‘i Green Growth Local2030 Hub, one of the world’s first UN-recognized local sustainability hubs.
(9 of 10 are independent)
Anticipated demographics following May 2023 annual meeting of shareholders
Richard Dahl oversaw the development of sustainability strategies as President & COO of Dole Food Company. Under his leadership, Dole increased its investments in sustainability initiatives (including a carbon offset program to secure a carbon neutral operating footprint) and was named one of the World’s Most Ethical Companies by Ethisphere Magazine.

Peggy Fowler was CEO of Portland General Electric (PGE) when PGE made the strategic decision to reduce its use of oil and coal. Under her leadership, wind and solar projects were constructed and integrated into the PGE grid. PGE has been ranked #1 on multiple occasions for supplying more renewable power to residential customers than any other U.S. utility.


Micah Kāne leads the Hawai‘i Community Foundation, Hawai‘i’s largest foundation. As an acknowledged Native Hawaiian community leader, he brings invaluable experience in understanding Hawai‘i’s complex cultural and land use history. He has worked to bring the community together to address important issues facing Hawai‘i, including environmental sustainability, homelessness and affordable housing.
Jim Scilacci has extensive experience overseeing the financial aspects of utility clean energy transitions and managing risks, including ESG-related risks such as climate change impacts. His career includes serving as CFO of Edison International and its subsidiary, Southern California Edison, a leading utility with respect to grid modernization, transportation electrification and renewable energy.
HEI’s Corporate Code of Conduct establishes high ethical standards across our family of companies. The Code applies to all board members, executive officers, employees (including full- and part-time), and third parties (e.g., vendors, suppliers, contractors) in their engagements with HEI.
All of us at HEI have a responsibility to know, understand and adhere to our Code of Conduct, company policies and applicable laws and regulations. HEI strives to promote a culture in which employees feel comfortable raising concerns and reporting issues in good faith without fear of retaliation. We provide annual training on the Code of Conduct. We also provide several avenues for confidential, anonymous reporting of suspected violations, including through the company’s EthicsPoint platform. We have procedures for investigating reported concerns or suspected violations, and we do not tolerate retaliation against employees who report in good faith any ethics or compliance issues. Our Board of Directors reviews and approves the Code of Conduct as needed and reviews reports of potential violations with management on a quarterly basis.
Our Code of Conduct includes several components focused on respect for human rights. For example, the Code of Conduct outlines our zero tolerance policy with respect to human trafficking and forced labor; this policy applies to all those covered by the Code of Conduct, including vendors and contractors. In addition, the Code of Conduct describes our commitment to providing a work environment that is safe, dignified, productive and free of harassment and discrimination. We plan to further detail our commitment to and policies regarding human rights in future materials.
Areas addressed by the Code (not exhaustive):
Our shared responsibility and commitment
Examples of violations
Resources and reporting avenues
Anti-retaliation
We act in the best interest of our company and our customers
Protecting confidential information
Protection and use of company assets

Conflicts of interest
We act with honesty and integrity
Fair dealing, antitrust and anti-tying
Anti-corruption and anti-bribery
Anti-human trafficking
100% of active employees across Hawaiian Electric, ASB and Pacific Current completed HEI Code of Conduct training and acknowledgment in 2022
We honor our legal obligations
Insider trading
Financial reporting obligations
Anti-money laundering, anti-terrorist financing and trade sanctions
We welcome diversity and foster a productive work environment
Equal employment opportunity and anti-discrimination
Anti-harassment and anti-violence
Alcohol and drug-free workplace

We care about our community and neighbors
Environmental management and training
Charitable contributions
Political activity, lobbying, contributions and endorsements
Details about HEI’s political activities, including HEI’s political engagement policy, political contributions and trade association memberships are publicly available online
Given the types of critical infrastructure that our companies provide, HEI must engage productively with elected officials and policymakers. Hawai‘i’s transition to a net zero economy depends on the development of sound public policy that considers the positions of a range of stakeholders, including HEI. We are committed to complying with all federal, state and local laws governing our participation in the political process and engaging in that process in a way that is transparent and ethical.

HEI companies hold memberships in national industry, trade and business associations representing the energy and banking industries and the business community. In addition, as important employers and proponents of economic development in Hawai‘i, our companies are members of local chambers of commerce, industry groups and business organizations. Our involvement with these organizations helps our companies build relationships, learn the views of others, obtain constructive feedback, support the community and gain insight into important social, business and community issues. Company leaders and team members participate in working groups and committees and serve on boards of such organizations to learn about and inform industry policies and positions.
HEI has one political action committee (PAC), the Hawaiian Electric Committee for Enlightened Government (CEG), which was established in 1989 to participate in political advocacy on legislative matters and in contributions to candidates for state and county races in Hawai‘i. The CEG is registered with the Hawai‘i State Campaign Spending Commission and files reports of members’ contributions and political campaign donations several times each year, as required by state statute. No corporate funds are used for political contributions. Since 2006, the committee has been funded exclusively by executives and managers of the utility. Participation in the CEG is voluntary. Employees are not reimbursed (either directly or indirectly). HEI does not have a federal PAC.
Among the HEI companies, Hawaiian Electric has historically had the most involvement in political activities. The Hawaiian Electric Vice President of Government and Community Relations and Corporate Communications is responsible for managing Hawaiian Electric’s participation in the political process. Under the supervision of this executive, the Hawaiian Electric Government Relations Department is responsible for coordinating Hawaiian Electric’s involvement in the political process and ensuring that employees receive adequate communication and training on matters relating to that process. The HEI
Board of Directors oversees Hawaiian Electric’s political participation through standing board meeting discussions with management at least quarterly. The HEI Nominating and Corporate Governance Committee reviews our overall governance structure and will consider whether specific oversight responsibilities should be delegated to a committee.
“We are committed to complying with all federal, state and local laws governing our participation in the political process and engaging in that process in a way that is transparent and ethical.”

Hawaiian Electric is dedicated to serving Hawai‘i’s energy needs and caring for our environment with purpose, compassion, empathy and aloha. Our role is to empower Hawai‘i, our communities, our customers and our employees to thrive, together.
Hawaiian Electric has been one of the most aggressive utilities in the nation in transitioning to renewable energy and working through complex technical issues and social equity considerations to keep our system stable, reliable and affordable for all our customers.
In 2022, Hawaiian Electric completed its first full year under the current performance-based regulation (PBR) framework. Despite an unusually challenging macroeconomic backdrop, 2022 was a successful stress test of the new framework. High fuel prices and supply chain-related delays of renewable energy projects resulted in net penalties in 2022. Hawaiian Electric accrued $3.4 million in estimated performance-incentive rewards in 2022, primarily through:
Collaborating to deliver energy savings for low-to-moderate income customers
Achieving faster interconnection times for new distributed energy resources
Efficiently acquiring grid services capabilities from distributed energy resources
The company is focused on achieving defined outcomes established after a collaborative process involving Hawaiian Electric, the Public Utilities Commission, the Consumer Advocate and other stakeholders in the PBR proceeding. In addition to those listed above, these outcomes include:


At Hawaiian Electric we are committed to achieving our statewide and company climate goals in an effective and equitable way. We surpassed Hawai‘i’s 2020 goal of a 30% renewable portfolio standard (RPS). We are working to achieve the goals of 40% by 2030, 70% by 2040 and 100% by 2045 ahead of schedule.
In 2022, we achieved an RPS of 32%, defined as the percentage of electricity generated by renewable resources. The RPS definition was changed under state law in July 2022, and results in a lower RPS in comparison to prior years. Under the prior definition, which was based on the renewable percentage of electricity sold, we would have achieved a 39% RPS in 2022. Both the company and our executives have financial incentives to achieve higher levels of RPS ahead of state targets. See TCFD discussion on page 24 for more detail.
We increased energy from renewables in 2022, although those gains were offset by higher overall electricity demand and generation. The increase in renewable energy was primarily driven by the Mililani I Solar project coming online, as well as new customer-sited solar. Due to supply chain issues and other challenges, several grid-scale renewable projects scheduled for completion in 2022 were delayed and are now projected to be completed in 2023 or 2024.
32% 2022 RPS*
Accelerating achievement of Hawai‘i’s RPS goals
Achieving faster interconnection times for large renewable energy projects

Promoting customer engagement via deployment of advanced meters
Incentivizing cost control over fuel, purchased power, and Exceptional Project Recovery Mechanism costs
Introduction
HEI
Hawaiian Electric Thriving Environment
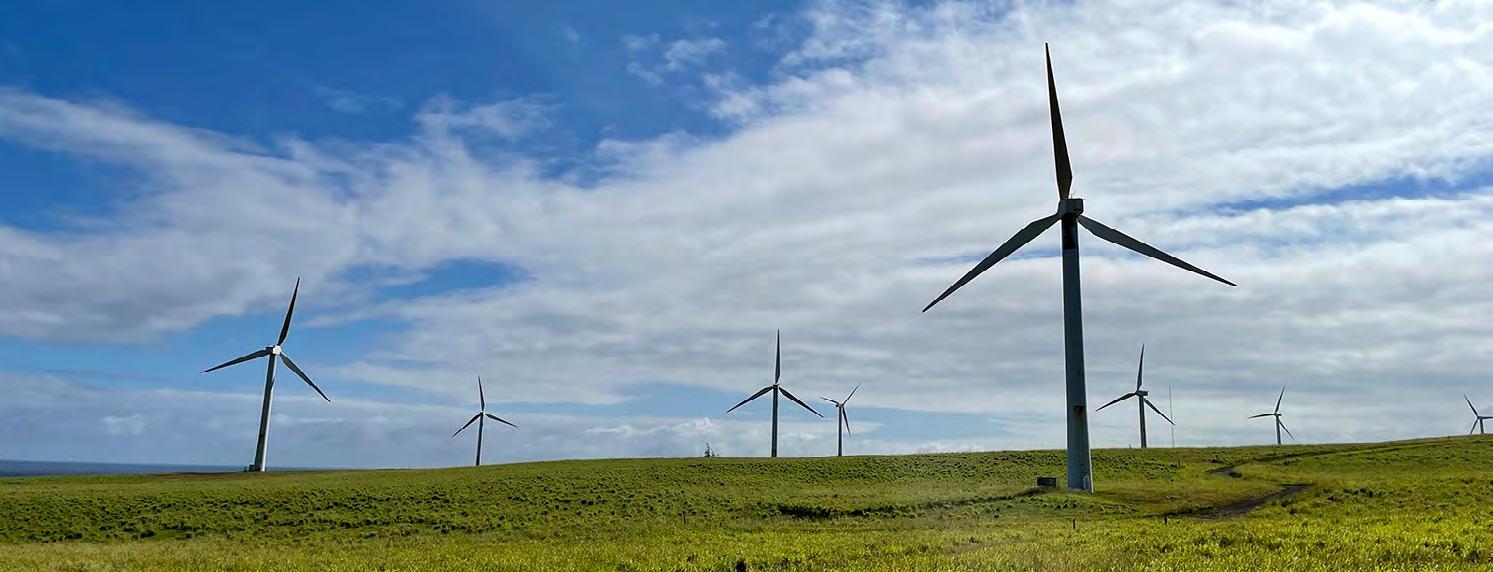
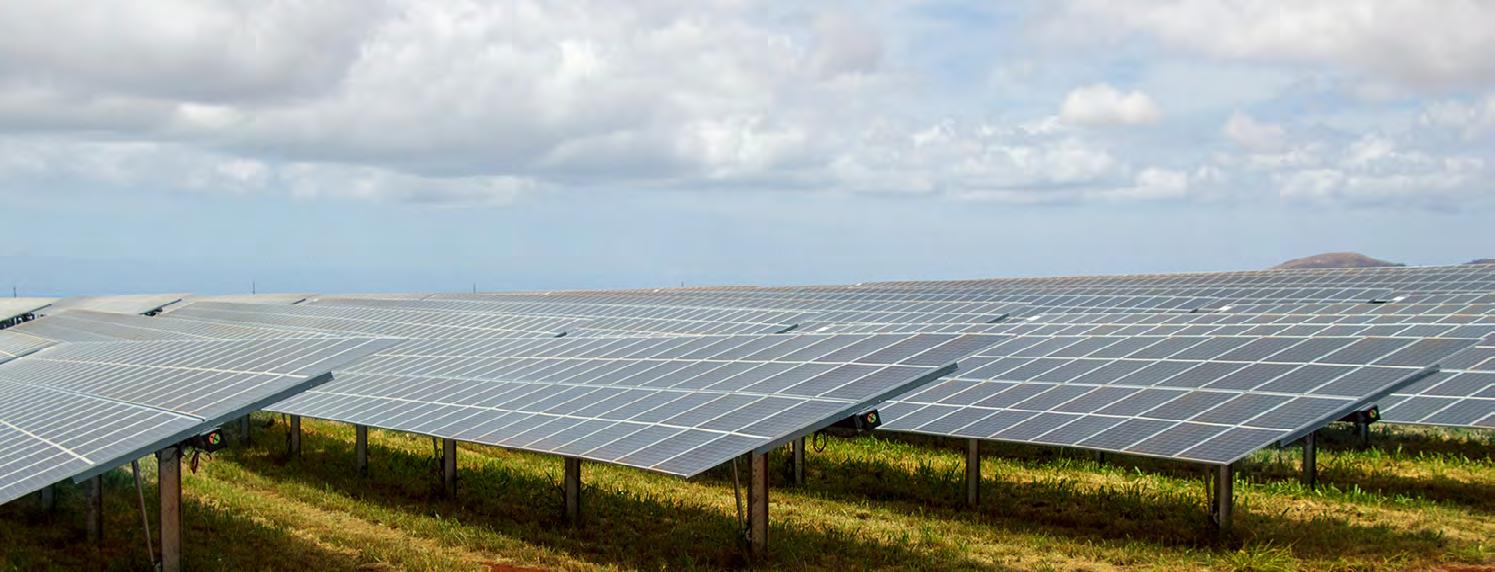
Thriving Economy
Thriving Communities
Thriving Employees
American Savings Bank
Pacific Current Appendix

Quantitative
70%
Reduction in Carbon Emissions by 2030 (vs 2005 Baseline)
GHGs in Stack Emissions from Electricity Generation by 2045
In the spirit of our common purpose, we aspire to build a better Hawai‘i that thrives environmentally, economically and socially. In 2017, the State of Hawai‘i was the first in the nation to align with the Paris Climate Accords. Additionally, county governments across the islands we serve have all committed to specific greenhouse gas (GHG) reductions. To support these important endeavors and contribute to bettering our communities, Hawaiian Electric set a goal of reducing carbon emissions by 2030 by 70% compared to 2005 levels. By 2045, we’re targeting net zero carbon emissions, meaning whatever small amount of emissions we produce will be captured or offset.
Meeting our ambitious carbon emissions goals requires contributions from across our entire company, as well as the unified efforts of the community, state and local governments and the PUC to create a cost-effective, sustainable and resilient energy system for future generations. We have taken major strides forward this past year with the shutdown of Hawai‘i’s last operating coal-fired power plant in September and the addition of significant renewable generation through both utility-scale (Mililani I Solar) and distributed resources supported by company programs such as Battery Bonus.
Each project sent to the PUC for approval has had an analysis of its GHG impacts. As of 2022, we have managed to reduce emissions by 22% compared to 2005 levels.
Note: While the utility continues to execute on its plans, and currently believes that the 70% GHG emissions reduction target remains achievable, additional renewable energy procurements and timely construction of significant generating capacity beyond its current Stage 3 RFP process are required. Future events may impact the pace and amount of newly installed renewable variable and firm generation or cause unexpected issues with existing generation, and thus affect the timing for achievement of our goals.
Our renewable generation portfolio includes a diverse range of resources, including biomass, biofuels, wind, solar, hydro, geothermal and customer-sited solar. While gridscale renewable energy is important, our largest source of renewable generation in 2022 remained customer-sited solar.
Our current generation mix reflects our progress toward increasing renewable energy. We expect to add more battery storage to our system, enabling use of solar power at night or on cloudy days. To incentivize greater battery adoption among our customers, Hawaiian Electric continues to operate its Battery Bonus program providing bill credits for customers who install batteries and supply power to the grid during peak hours.
47.9%
32%
These maps show existing and planned generating facilities and the maximum potential power in megawatts (MW) they can produce.
With the change in the RPS calculation, our total system generation mix now aligns with RPS.
FIRM GENERATION: Energy available on demand, which can be adjusted as needed.
VARIABLE GENERATION: Energy that may not always be available or controllable.
28.2%
We call our vision for using 100% local, clean energy, “Hawai‘i Powered.” Throughout the past two years, as part of our long-range Integrated Grid Planning process, we have engaged with the community and other stakeholders about our goals and the needs of the system. In 2022 we launched the Hawai‘i Powered website, a consolidated customer facing tool for collaboration and input on current and future generation, transmission and distribution projects. Additionally, our team engaged in 19 community meetings across our service territory to hear stakeholder concerns and brainstorm future sites for renewable resources and community needs. As part of our commitment to transparency, engagement and making positive change for Hawai‘i, we have made community benefit packages a requirement of our Phase 3 renewable energy Request for Proposals.
We are working aggressively to add more renewable energy to our system. Some of the new renewable energy facilities are owned by Hawaiian Electric, while many others are currently and are expected to continue to be developed and owned by third-party independent power producers (IPPs).
Our state’s policy is for the utility to create competitive procurements for the best technologies and pricing to provide energy options for our customers. A robust pipeline of utility-scale projects is under development due to our recent renewable energy procurement efforts, the largest ever undertaken in Hawai‘i. Our online Renewable Project Status Board lists all pending renewable energy projects, how much they are anticipated to contribute to RPS, the year they are expected to come online and their current status.
Today, the peak load for our entire five-island system is about 1,500 MW. Together, projects under development or pending approval by the PUC from the two large renewable energy procurements we’ve run since 2018 have the potential to contribute nearly 400 MW of additional solar and over 2 GWh of storage to our system by the end of 2025.
Gray-shaded area on chart shows RPS under prior definition as % of sales
NOTE: The definition of Renewable Portfolio Standard (RPS) was changed by state law in 2022. It is now defined as the percentage of electricity generated by renewable resources. It was previously defined as the percentage of electricity sold that came from renewable resources.
Using
Expanding
Promoting
Creating
Introduction
HEI
In 2014 we deactivated our 113-MW Honolulu Power Plant on O‘ahu and in 2015 we deactivated the 15.2-MW Shipman Plant on Hawai‘i Island. In September 2022, our power purchase agreement for the 180-MW coal-fired AES power plant on O‘ahu expired, ending the use of coal for power generation in Hawai‘i. By 2027 or 2028, we plan to deactivate our Kahului Power Plant on Maui as well as two additional generating units at our Waiau facility on O‘ahu (assuming sufficient replacement resources are online).
Making the most of Hawai‘i’s abundant renewable energy resources will require creative management of Hawai‘i’s scarce land area. Thus, community based renewable energy and customer-sited solar are key components of our renewable energy transition.
Today we have among the nation’s highest percentages of rooftop solar per capita (22% of residential customers, roughly 40% of single family homes on O‘ahu). We’ve invested heavily in our grid and in programs to integrate all of this intermittent, distributed generation while maintaining the reliability our customers expect. Because of all our efforts, Hawai‘i has one of the highest percentages of solar generation in the country.4 Importantly, 91% of new rooftop solar applications in 2022 also had battery storage. This allows daytime excess solar production to be used to reduce fossil-based power at night. We’re continually working to increase participation and make the interconnection process easier for customers.
Transportation (ground, air and marine) is responsible for over half of Hawai‘i’s energy sector GHG emissions, with ground transportation accounting for the largest portion of transportation emissions.5 Increased renewable energy on our system and the growing market demand for electric vehicles (EVs) allows us to help decarbonize this sector. Hawai‘i has among the highest per capita rates of EVs in the country at 1.7 EVs per 100 passenger vehicles,6 which we expect to increase by at least 700% over the next 10 years.7
+25%
Increase in Passenger EVs from January to December 2022
Hawaiian Electric
Thriving Environment
Thriving Economy
Thriving Communities
Thriving Employees
American Savings Bank
Pacific Current Appendix
Quantitative
Promoting equity in our energy transition is an important part of the utility’s role. One way we’re promoting equity is by developing programs for all customers to benefit from renewable energy, not only those who own their homes and rooftop solar systems. Begun in 2020, the company’s Shared Solar program (community-based renewable energy) expands solar access to a wider range of residents, with priority to those who have been underrepresented in solar adoption, such as renters and customers with low-to-moderate incomes. Phase 2 of the Shared Solar program was launched with projects selected on Moloka‘i and Lāna‘i at the end of 2021, seven dedicated low-to-moderate income projects were selected for O‘ahu, Maui and Hawai‘i Island in 2022.
The utility is pursuing a holistic decarbonization strategy to help achieve Hawai‘i’s carbon neutral to carbon negative economy goal. The company is evaluating levers beyond its priority focus on emissions reduction, including technologies around carbon removal, sequestration and offsets. The recent Inflation Reduction Act has created several grants and opportunities that are likely to improve the technology and process around carbon capture and the company continues to monitor these developments for opportunities that are a good fit for Hawai‘i.
Electric transportation creates benefits for all customers by putting downward pressure on rates. Increased electrification of transportation enables the cost of grid investments to be spread over more kilowatt-hours, reducing per-unit customer costs in our decoupled environment, and introducing opportunities to provide grid services.
In 2016, we were founding partners of Drive Electric Hawai‘i, a coalition of public, private and nonprofit partners to promote transportation electrification. Hawaiian Electric’s 2017 EoT Strategic Roadmap set forth our electrification strategy, which includes 10 key initiatives. These initiatives result in three customer-facing programs: public charging, EV rates and make-ready infrastructure. As of 2022, Hawaiian Electric offers a network of 31 public chargers and rates for public, commercial and electric bus charging.
Our Charge Up Commercial program launched in late 2022 to offer make-ready infrastructure for Hawai‘i’s commercial EV needs. Under this program, the company will cover the costs of the needed back-end infrastructure to install an electric vehicle charger. This reduces the upfront costs and makes adding electric vehicle charging more feasible for condominiums, apartments, retail centers and similar developments. We continue to work towards our commitment to electrify 100% of our company’s own light-duty fleet vehicles by 2035. A focus in 2022 was expanding charging infrastructure and improving maintenance to better support overall adoption.
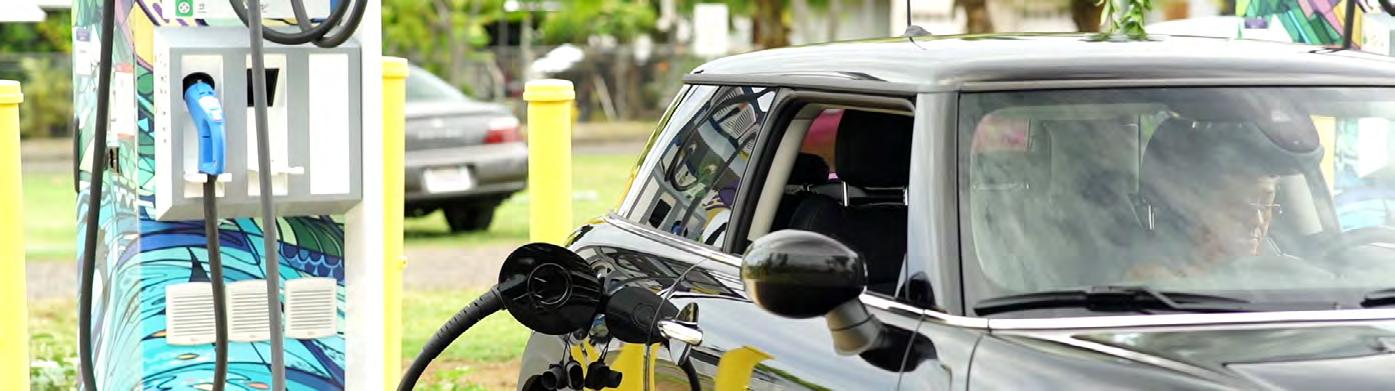
Hawaiian Electric is building the grid of the future to reliably support more renewable energy and electric vehicles and to enable the evolving ways customers generate and consume electricity.


Our Grid Modernization Strategy will empower customers with information to better manage their usage and take advantage of different rates and programs to fit their needs; reduce the number of customers impacted by outages when they occur, as smart devices will be able to section off parts of the grid as needed; and provide system operators more visibility and control to manage intermittent renewable energy and improve reliability.
Under Phase 1, we’ve implemented a system to collect and store advanced meter data, delivered an online customer energy portal and are rapidly deploying advanced meters and the enabling telecommunications network. We have already installed about 193,000 advanced meters covering 41% of our service area and will finish full deployment by Q3 2024. The data from these meters will be instrumental in giving customers more visibility into their energy usage and empowering them to make changes. Combined with the recently approved time of use rate pilot program from the PUC, these meters empower customers to control their energy usage and their bills. When implemented, Phase 2 will include deployment of field devices such as smart reclosers and smart fuses to automatically respond to grid conditions, and an advanced distribution management system.
Mālama ‘Āina, to care for the land, is the traditional Hawaiian value of sustainability, a way of life that respects, conserves and protects our natural resources for future generations. At Hawaiian Electric we prioritize protecting Hawai‘i’s environment and culture as they are inherent in what makes Hawai‘i special.
Internal audits are conducted to verify compliance with permits, regulations and policies and support corporate risk management. Our internal audit team audits the Environmental Division at least once every three years. Audit reports are used to create Management Action Plans, ensuring high-risk items are given priority and addressed promptly. The Environmental Division also periodically audits utility facilities to identify areas for improvement.
Hawai‘i’s air is some of the cleanest in the nation due in part to a lack of heavy industry, relatively low population density, and a year-round temperate climate that brings abundant wind and rain to the islands. In the American Lung Association’s (ALA) 2022 State of the Air Report, Urban Honolulu was ranked #3 on the list of Top Cleanest Cities for YearRound Particle Pollution, with Kahului-Wailuku-Lahaina on Maui coming in at #4.8 Year over year, Urban Honolulu is among the top five cleanest U.S. cities to live in with respect to low levels of air pollution.
In alignment with the Clean Air Act, we’re focused on maintaining compliance with key regulations including the National Ambient Air Quality Standards (NAAQS), State Ambient Air Quality Standards (SAAQS), New Source Review/Prevention of Significant Deterioration, Mercury and Air Toxics Standard (MATS) and many others.
“Beyond our compliance work, the Environmental Division and the Company diligently work to protect Hawai‘i’s unique environment through volunteer initiatives that help improve air and water quality in communities, restore green spaces and valuable watersheds, and protect native species and their critical habitats.”
KARIN KIMURA, Environmental Division Director at Hawaiian ElectricMore than 30 environmental professionals, including scientists, engineers, chemists and a wildlife biologist, work full-time at our utility to ensure employees and contractors understand and comply with applicable environmental laws, regulations, permitting requirements and procedures regarding air and water quality, noise control, hazardous materials and protected species.
Critical elements of our programs include year-round risk and opportunities assessment, continuous improvement, compliance management, air and water quality monitoring and extensive training in air quality requirements, spill prevention control and countermeasures, storm water runoff, proper handling and disposal of hazardous materials and protected species awareness and protection. All contractors working at Hawaiian Electric sites are required to attend Contractor Environmental Orientation training conducted by our environmental staff.
As part of a commitment to the West O‘ahu community for the development of the Campbell Industrial Park (CIP) Generating Station, we voluntarily installed monitoring stations to measure the daily Air Quality Index in the area. Near real-time data for several air quality parameters, including SO2, O3, CO, PM10, PM2.5 and NO2, are available on www.westoahuair.com
Introduction
HEI Hawaiian Electric Thriving Environment
Thriving Economy
Thriving Communities
Thriving Employees
American Savings Bank
Pacific Current Appendix
Quantitative
At Hawaiian Electric, water plays a critical role in the operations of our generating units and is vital to efficient and reliable generation. We respect the need to conserve and protect our water resources, and primarily use water from non-potable sources at our facilities. As an example, the Kahe Power Plant and Campbell Industrial Park Generation Station use reclaimed wastewater for plant process water needs.
The company does not currently operate in an area of water stress as defined by the Aqueduct Water Risk Atlas and uses primarily ocean water and brackish well water for power generation. Over 99% of the water used in our oncethrough cooling systems is later returned to groundwater or surface water.

Hawaiian Electric’s strategic pillars are centered on building a stronger Hawai‘i, creating customer value and strengthening the foundation of the utility. In serving its customers and communities, Hawaiian Electric aims to build longterm value for all stakeholders. The utility intends to:

The remainder is primarily used in air emissions control systems and is not from fresh water or sea water sources.
We focus on managing waste streams in accordance with local, state and federal regulations. We do not have any nuclear facilities and do not produce any nuclear waste.
We implemented a Hazardous Waste Minimization Plan to reduce the volume of hazardous waste generated. Our operations generate relatively low volumes of hazardous waste — in 2022, a total of 5,187 pounds, mainly from maintenance and repair projects. If hazardous waste is generated, it is placed in designated areas where it is safely stored and inventoried. Containers are inspected for leaks while awaiting
timely disposal. We hire qualified hazardous waste shipping contractors to transport the waste to EPA-permitted treatment, storage and disposal facilities.

A prime example of our waste minimization strategy is the recycling of used oil for energy recovery. Used oil is one of the highest-volume industrial wastes produced by Hawaiian Electric’s facilities. Since the used oil has appreciable heat content, a number of our facilities are permitted to burn the used oil for energy recovery.
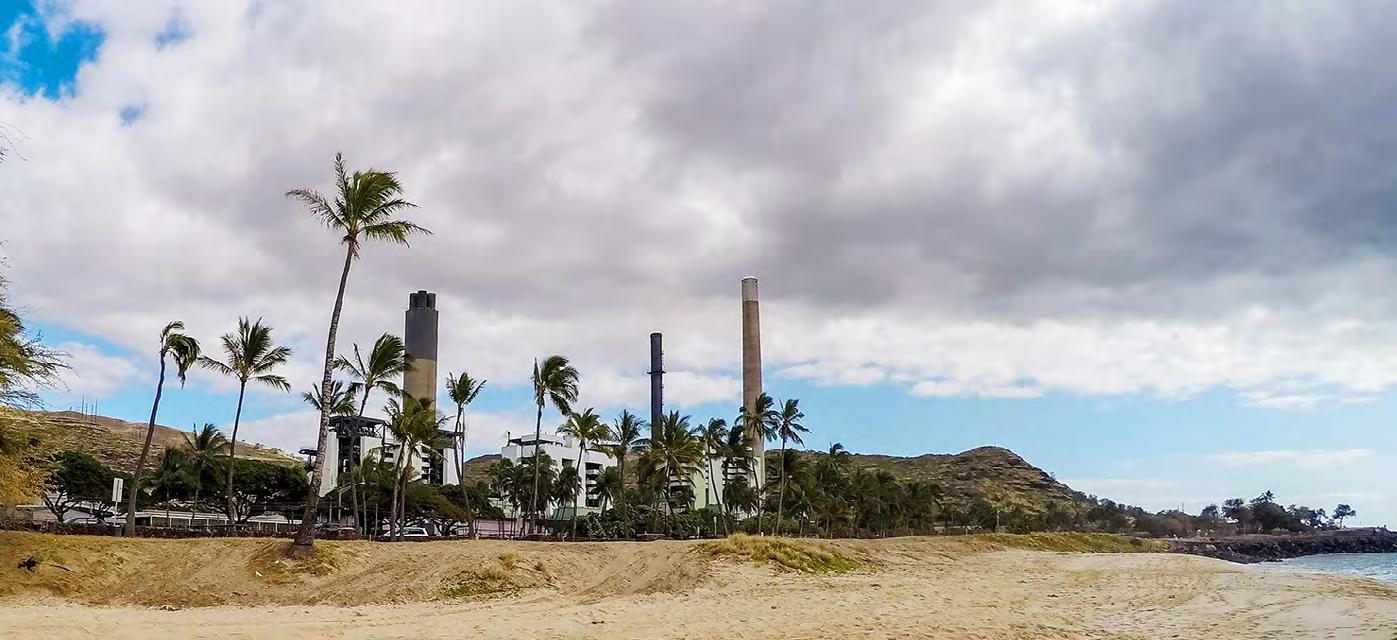
Drive Hawai‘i’s efforts to diversify the economy, create local job and investment opportunities and reimagine a sustainable and equitable future
Build a modern and resilient energy system that supports a holistic decarbonization strategy, including renewable generation and beneficial electrification
Develop our people to be leaders in our industry and community who are committed to the highest levels of performance and safety, and champion diversity, inclusion and teamwork
Serve as a trusted energy partner by collaborating with customers to provide solutions that are sustainable, affordable, reliable and tailored to create value
Improve financial performance by maximizing efficiency and streamlining operations
The utility’s ability to thrive through evolution and disruption is ultimately determined by the value it can deliver to its customers. Operating as efficiently as possible improves our overall capabilities while driving customer and community support. Stakeholder support facilitates our ability to develop new solutions and invest in the renewable energy transformation. These areas positively reinforce one another and build a sustainable source of shared value for years to come.
Introduction
HEI
Hawaiian Electric
Thriving Environment
Thriving Economy
Thriving Communities
Thriving Employees
American Savings Bank
Pacific Current Appendix
Quantitative
Hawai‘i is one of the most biologically diverse places on the planet, with thousands of endemic species found nowhere else. Today, many of Hawai‘i’s native, endemic species are threatened by introduced predators, invasive species, habitat loss and climate change. At Hawaiian Electric, our environmental stewardship efforts both protect native species and minimize company risk. Under the guidance of an on-staff wildlife biologist, our Protected Species Program takes a voluntary, proactive approach to minimize potential impacts company operations may have on protected species. We train our crews, design our equipment and set procedures with this in mind. Our community partnerships raise awareness of threatened and endangered species issues and support habitat conservation and restoration, species recovery and rehabilitation, and invasive species eradication efforts.
To minimize onshore lighting that could distract native seabirds during their nocturnal flights to feed, we’ve installed bird-friendly lighting and shielded fixtures at our facilities. Other mitigation efforts include installing bird diverters on some power lines.
the endangered Hawaiian petrel while providing long-term benefits to the birds and their habitats. We are working in conjunction with the U.S. Fish & Wildlife Service and Hawai‘i Department of Land and Natural Resources to complete the HCP.
To protect the endangered Hawaiian Hoary Bat, or ‘ōpe‘ape‘a, we developed detection protocols, including the use of thermal imaging devices, to minimize impacts on bats while conducting vegetation management activities during the critical pupping season. No bats have been detected in the species of trees trimmed within the utility corridors during five years of data collection. We also conduct acoustic monitoring to identify risks near existing or planned infrastructure.
In 2022, we partnered with the Hawai‘i Department of Land and Natural Resources on the design, fabrication and installation of boot brush stations at six popular hiking trails to help prevent rapid ‘ōhi‘a death, or ROD, a fungal infection affecting this environmentally and culturally important endemic tree, from spreading across O‘ahu’s native forests.
Since the 1970s we’ve conducted marine monitoring along the Leeward shores of O‘ahu to study the effects of warm water discharge from our Kahe Power Plant on coral, sand movement, water temperature, and fish communities. Earlier studies demonstrated that storms in 1980 and hurricanes in 1982 and 1992 were the major sources of impact to marine communities rather than our Kahe plant operations. In the 2022 study, researchers found no significant changes that can be attributed to the Kahe Power Plant or Campbell Industrial Park Generating Station.
Our Code of Conduct instructs all employees and contractors to adhere to our environmental commitment, which includes:
Maintaining a robust environmental management system, including assigned roles and responsibilities for environmental management
Monitoring our environmental performance and regular reporting on our environmental management
Ensuring environmental training for all relevant employees

Consulting with stakeholders on environmental issues
Preparing for and responding to any emergency that might impact the environment
Sean Moura, senior environmental scientist and wildlife biologist at Hawaiian Electric, is a Kaua‘i native who has translated his love of nature into a career. He manages the company’s protected species program, which focuses on minimizing the potential impact of our operations on protected and endangered species.
On Maui, we committed to the development of a Habitat Conservation Plan (HCP) to minimize risk and mitigate impacts on native seabirds such as

Introduction
HEI
Energy affordability is a priority for us. Almost all materials and goods must be shipped into the state, increasing the cost of everything from housing to groceries. According to the U.S. Bureau of Economic Analysis, in 2021 Hawai‘i had the country’s highest “all items regional price parity,” a measure of cost of living that reflects the price of goods and services, such as food, transportation and education, as well as housing rents, compared to a national baseline price level.9
Electricity prices in Hawai‘i are among the highest in the nation,10 due in part to the cost of imported oil used to power many of the islands’ generators. In 2022, fuel prices rose sharply due to the Russia-Ukraine conflict. The fact that the five islands we serve are not connected also contributes to the higher cost of electricity. Each island grid must operate a stand-alone system, unable to draw power from other islands or wholesale markets if needed. As such, system reliability requires that we have reserve generating capacity and multiple distribution routes.

Hawaiian Electric
Thriving Environment
Thriving Economy
Thriving Communities
Thriving Employees
American Savings Bank
Pacific Current Appendix
Quantitative
We strive to operate as a highly efficient utility. In 2022, we quickly adjusted and maintained operational efficiency despite multiple challenges from supply chain constraints, inflation, interest rates and fuel costs. As a result, we were able to keep annual operations and maintenance cost increases below the level of inflation. Looking forward, the PBR framework includes strong incentives for cost efficiency. We continue to implement plans to reduce costs through improved planning and scheduling of work leading to reduced overtime, managing the size of our workforce, continuing our process improvement initiatives, strategic sourcing of goods and services and reducing our office footprint. In 2022, we completed our headquarters move, bringing much of our office workforce into one space, reducing our square footage by 32% and saving the company over $2 million annually.
Substituting fixed-price, lower-cost renewable energy resources for fossil fuel-based generation is the best opportunity to provide customers with lower and more stable electric rates. This renewable energy transition can also drive savings in other sectors (e.g., lowering costs of operating electric vehicles).
FROM 2008
Oil use increased in 2022 as Hawai‘i’s continued economic recovery increased electricity demand while supply chain constraints delayed anticipated new renewable energy projects. We expect to resume our downward trajectory of oil consumption as these new projects come online.
We continue to innovate procurement mechanisms that reduce costs for developers, helping lower costs for customers and facilitating attainment of our RPS goals, while working to ensure our independent power producers are good stewards for our communities. Across many different initiatives, we have heard the desire of communities to be more engaged early on in the process for renewable energy development. To this end we have increased community engagement prior to issuing a final RFP. We also have modified the requirements in our requests for proposals and power purchase agreements for independent power producers who are selected through our procurements to complete a community engagement plan, contract with a community consultant, hold community meetings and take community feedback and incorporate that into their project to the extent reasonable. We have also expanded requirements for community engagement by adding a requirement for a community benefits package to be submitted with proposals and to be implemented if the project is ultimately selected.
At minimum, Proposers should commit to setting aside at least $3,000 per MW per year for community benefits. These funds shall be donated for actions and/or programs aimed at addressing specific needs identified by the host community, or to a 501(c)(3) not-forprofit community-based organization(s) to directly address host communityidentified needs. Further, preference will be given in our procurements to Proposers that commit to setting aside a larger amount or commit to providing other benefits (including but not limited to creating local jobs, payment of prevailing wages or improving community infrastructure). This ensures that in addition to providing clean energy at affordable, stable rates and key grid services, new developments will have a direct positive benefit to the communities they are situated in, hopefully increasing community buy-in for the project.
Hawaiian Electric understands that energy costs can be a significant challenge to our customers. In 2022, we hired an Equity Access and Affordability Manager who will work to focus our efforts on assisting customers with their bills. Programs we currently operate include:
Kakimoto harnesses her passion for community and outreach as she helps Hawaiian Electric reduce the burden for those struggling to pay their bills. Through research and stakeholder engagement, she’s helping shape company strategies and programs to better support low-to-moderate income customers.

Hawaiian Electric is taking steps to help our vulnerable populations. Energy burden is a significant issue in the state with Hawai‘i experiencing one of the highest costs of living in the nation coupled with relatively low average wages. This was exacerbated during the pandemic and in 2022 when the conflict in Ukraine caused fuel prices to surge. In response, Hawaiian Electric created a High Bill Task Force, in addition to a bill assistance program and long-term payment plan program to help customers in arrears.
With the rollout of advanced meters, we utilized the meters’ capabilities to send alerts when energy usage was high, giving customers more visibility and control over their bills. Hawaiian Electric also collaborated with Hawai‘i Energy to promote its energy efficiency programs through customer communications and worked with government agencies on the LIHEAP program. In 2022, we helped more than 9,000 families receive more than $5.5 million in energy assistance.
The Hawai‘i Green Infrastructure Authority (HGIA) Green Energy Money $aver (GEM$) On-Bill Program helps customers reduce electricity costs by installing energy improvements such as rooftop solar, solar hot water systems and/ or commercial energy efficiency retrofits, which are repaid through the customer’s electric bill.
LIHEAP (Low Income Home Energy Assistance Program) that provides qualifying low-income households a one-time credit to offset energy costs.
The Special Medical Needs Program is designed to provide reduced electricity rates for qualified customers who are dependent on life-support equipment used in their homes and/or have increased heating and cooling needs due to their medical conditions.
We also partner with nonprofits who provide utility payment assistance and connect our customers with nonprofits for help.
In addition to these short-term initiatives, we are also focusing on longerterm, more systemic actions to help increase the equity, accessibility and affordability of electricity. In 2022, we created a manager position specifically to work with our customer service team on building out these new initiatives. We continue to participate in the Low-to-Moderate Income (LMI) Council on each island to increase energy efficiency in these populations, an effort that the Performance-Based Regulation framework rewards through the LMI Energy Efficiency Performance Incentive Mechanism. We also work with rural communities whose geographic isolation makes frequent power outages a challenge.
Energy efficiency helps customers save money, reduces overall demand, may reduce the need for more generation facilities, and helps preserve our environment. In 2021, Hawai‘i had the lowest average annual electricity consumption per residential utility customer in the US (Source: US Energy Information Administration).
In Hawai‘i, all electric utility customers pay a public benefits fee (PBF) that funds demandside reduction and energy efficiency initiatives. Under current Hawai‘i law, a public utility cannot administer such programs or use PBF surcharge funds. The PUC contracts a third party known as Hawai‘i Energy to administer programs that support energy efficiency, clean energy technology, demand-side management (DSM) and energy conservation services and products.
We encourage the efficient use of energy through online customer education tools and in partnership with Hawai‘i Energy where permitted. Under the PBR framework the utility benefits financially for advances made in energy efficiency for low-to-moderate income customers. Additionally, Hawaiian Electric provides energy efficiency and ENERGY STAR® information in our customer education resources and refers customers to Hawai‘i Energy for programs and services whenever possible.
In 2022 the PUC approved a pilot program for time of use rates. This pilot program gives customers more control over their bills and encourages behavior that benefits grid reliability and the utilization of renewable resources.
In the past, electricity generation took place only at large-scale, centralized power plants. Distributed energy resources, or DER, refers to smaller generators and storage devices located throughout the energy grid, such as rooftop solar on customers’ homes and businesses, customer-sited energy storage, electric vehicles that store and use electricity and demand response devices like grid-interactive water heaters, which can be turned off during system peak usage.
Our DER strategy is anchored by three principles:
Need. Customer-sited DER is essential to achieving our 100% renewable energy goal and our Climate Action Plan. In fact, our Climate Action Plan calls for 50,000 more rooftop systems by 2030.
Opportunity. The utility must expand opportunities for cost-effective DER.
Equity. The expansion of DER must benefit all customers.
Affordability and equity are central to our DER strategies. We’re committed to integrating distributed generation with fair pricing for all customers. With among the highest rates of rooftop solar adoption in the U.S., we have shared our insights in grid operations under these conditions with other utilities and continue to innovate programs to ensure that the benefits of DER are shared equitably across the whole grid.
To promote fair pricing, we have implemented several programs for customers who would like to offset their energy bill by investing in clean energy generation, including Customer Grid-Supply Plus and Smart Export. These programs compensate customers for exporting energy to the grid at prices that place less burden on non-DER customers than the original net energy metering program.
We’re developing new DER tariffs and programs to benefit all customers. For example, we’re expanding our Community-Based Renewable Energy program, or Shared Solar. We have procured aggregated grid services from customer DERs, which provide additional economic benefits to DER customers while providing cost-effective ancillary services that benefit all customers. We are committed to managing Hawai‘i’s renewable transition in a way that helps address societal inequities.
Right: More than 40% of customers on O‘ahu, Hawai‘i Island and Maui have upgraded from an analog to an advanced meter, allowing them to better monitor energy use and manage bills.
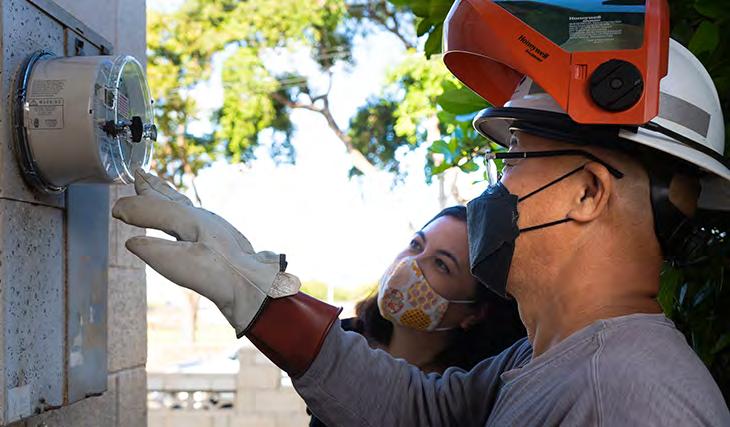
“We are committed to managing Hawai‘i’s renewable transition in a way that helps address societal inequities.”
Introduction
HEI Hawaiian Electric Thriving Environment
Thriving Economy
Thriving Communities
Thriving Employees
American Savings Bank
Pacific Current Appendix
Quantitative
Consistent, reliable electric power is vital to the lives and livelihoods of our customers and communities. With more variable renewable generation on the grid and the projected increase in severe weather events due to climate change, Hawaiian Electric is constantly innovating how we safeguard the grid to provide the reliability our customers expect and recover from any disruptions quickly, safely and with minimal customer impact.
As an island utility, we are not connected to a large system of interconnected generation facilities like U.S. mainland utilities, nor are our individual islands interconnected. This means each island must independently provide high levels of reliability, and we must plan carefully to ensure resilience.
We constantly work to maintain and upgrade our transmission and distribution infrastructure to ensure that power gets to our customers. Vegetation impacts during high winds and storms are the cause of many power outages and so we regularly trim vegetation around our equipment and replace traditional power lines with insulated conductor systems in areas that are especially prone to vegetation-related outages.
We’re working to reduce the impact of outages by adding smart switches to section off parts of the grid to reduce the number of customers affected by an outage. We measure and report reliability performance using metrics commonly used in the electric utility industry regarding the duration and frequency of power interruptions for customers. Hawaiian Electric and its executives have financial incentives to promote strong reliability performance.
We filed a multi-year plan with the PUC in 2022 focused on foundational investments in transmission and distribution system resilience. Our proposed plans include:
Strengthening our most critical transmission lines to withstand extreme winds
Hardening distribution lines serving critical community lifeline facilities such as hospitals, military sites, communications infrastructure, water and wastewater facilities, ports and emergency response facilities
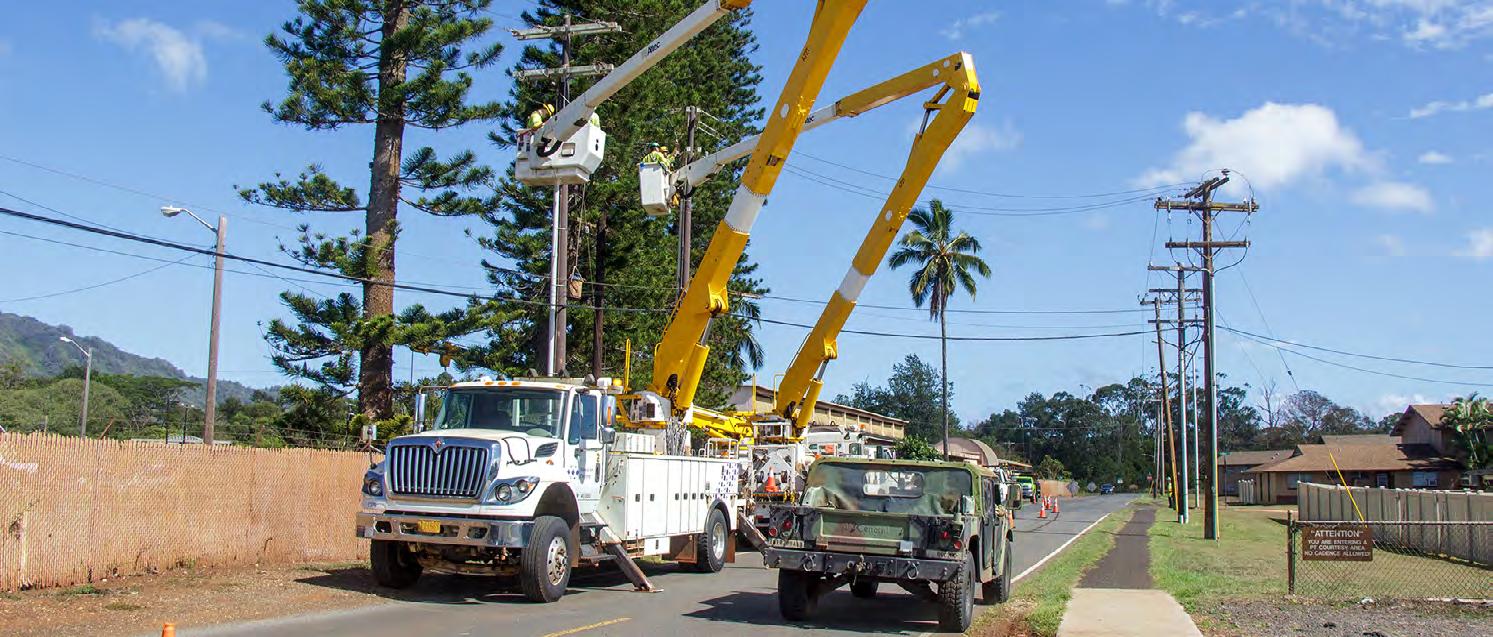
Upgrading poles to improve restoration after a storm or hurricane
Moving lines underground in targeted areas prone to vegetation-related damage
Removing hazardous trees that are at risk of falling into lines during a storm
Strengthening lines and deploying devices to help prevent and respond to wildfires
Installing equipment in select substations to reduce flood impacts
We are also exploring various opportunities from the federal Inflation Reduction Act and Infrastructure Investment and Jobs Act to provide additional funding for these important system improvements.
Episodic drought, a warming climate and the expansion of nonnative fire-prone grasses and shrubs has led to an increase in wildfires in Hawai‘i. Over 98% of wildfires are human caused and the threat to communities is high year-round. We joined with community members and wildfire collaborators to help prevent and mitigate wildfires in known hot spots across our service areas.
As members of the Wai‘anae Wildfire Hui in West O‘ahu and Pacific Fire Exchange on Maui, we meet monthly to share ideas and discuss priority projects. We support the Hawai‘i Wildfire Management Organization on Hawai‘i Island, which works with communities across the state on wildfire planning, prevention and mitigation activities. By raising awareness, implementing key land management practices and collaborating on projects, these organizations are working to reduce the wildfire risk in Hawai‘i and build strong, resilient communities.
HEI
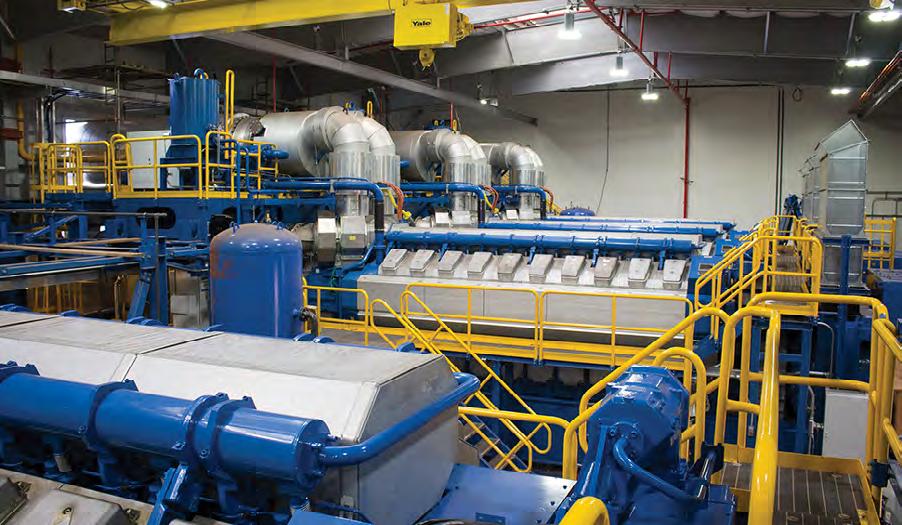
As we increase the share of our energy generated from variable renewable sources it is vital that we maintain grid reliability and stability. This will require both upgrading our firm generation to increase flexibility and availability of power during adverse weather and new technologies for fast frequency response. One established technology that we are continuing to leverage for reliability is battery storage. We expect over 1.1 GWh of battery energy storage systems to come online in 2023 and the flexibility provided by these combined projects will enable higher levels of renewable energy on the grid.
We are focused on ensuring the resilience of our system. Our efforts include:
Using advanced climate risk modeling to assess risks and inform our planning process
Deploying advanced meters and other technologies that allow us to respond more quickly to system interruptions
Exploring the use of damage prediction modeling to estimate damage from severe natural event scenarios in order to support planning and response
Exploring use of community microgrids and/or critical customer hubs to be able to quickly restore power to critical customers
Hawaiian Electric Thriving Environment
Thriving Economy
Thriving Communities
Thriving Employees
American Savings Bank
Pacific Current Appendix
Quantitative
Building more modern and efficient power plants inland, away from the coastline. An example is the Schofield Generating Station, which was completed and brought online in 2018. The biofuel-fired generating facility is located on military property inland at a higher elevation. It can be isolated to serve the military base and other critical facilities in the event of an emergency, and feeds electricity to the grid that serves all O‘ahu customers the rest of the time.
Collaborating with partners, such as the military, to supply energy to customers during an emergency
Engaging with stakeholders to incorporate resilience needs and priorities through Hawai‘i Powered and community engagement efforts
Cybersecurity is consistently recognized as one of the top risks facing the electric utility industry. As digitalization of our economy increases, ensuring security of our system and customer data is of increasing importance. We apply a disciplined risk management approach based on industry standards and best practices, prioritizing our investments and resources to protect our most critical assets and sensitive data.
We engage with local, state and federal agencies, utility peers and experts to share threat information and best practices, perform tests and assessments and conduct cybersecurity exercises. We also participate in mutual assistance programs including the Cyber Mutual Assistance Program (CMA), the Cybersecurity Risk Information Sharing Program (CRISP) and the Electricity Information Sharing and Analysis Center (E-ISAC). Our customer and community outreach efforts include cyber safety campaigns via social media and our company website. Internally, we promote a strong cybersecurity culture through awareness and training. We perform periodic testing and exercises to improve our cybersecurity response capabilities. Additionally, we continue to strengthen the cybersecurity components in our purchase power agreements.
We continue to strengthen our protection and detection capabilities across people, processes and technology to defend our networks, our customers and our grid. The enterprise cybersecurity program prescribes a comprehensive set of management, operational and technical controls aligned to an industry-standard framework and tailored to address our unique risk profile. Controls are continuously monitored for effectiveness, with tracking of key performance indicators. These metrics are presented to the Board of Directors and the Board Audit and Risk Committee each quarter.
“We apply a disciplined risk management approach based on industry standards and best practices, prioritizing our investments and resources to protect our most critical assets and sensitive data.”
Introduction
HEI
Hawaiian Electric
Thriving Environment
Thriving Economy
Thriving Communities
Thriving Employees
American Savings Bank
Pacific Current Appendix
Quantitative
We are deeply rooted in our communities and take pride in serving our customers, our extended ‘ohana (family). Our primary customer service goal is to create positive and meaningful experiences, making it easy to do business with us. We understand that addressing the needs of our customers is key to delivering value, and our strategy relies on continuous evaluation and improvement so we can evolve as a customer-centric, community-focused organization.
Customer satisfaction is deeply important to us, and we seek to make our services as accessible as possible and of the highest quality. We continue to roll out new online and mobile options for customers to pay bills, start and stop service and make changes to their account. We also use multiple online channels to allow customers to report and receive updates on power outages and other grid impacts.
To stay in touch with our customers and their needs, we conduct quarterly residential customer satisfaction surveys, which are benchmarked against 99 other utilities across the nation.
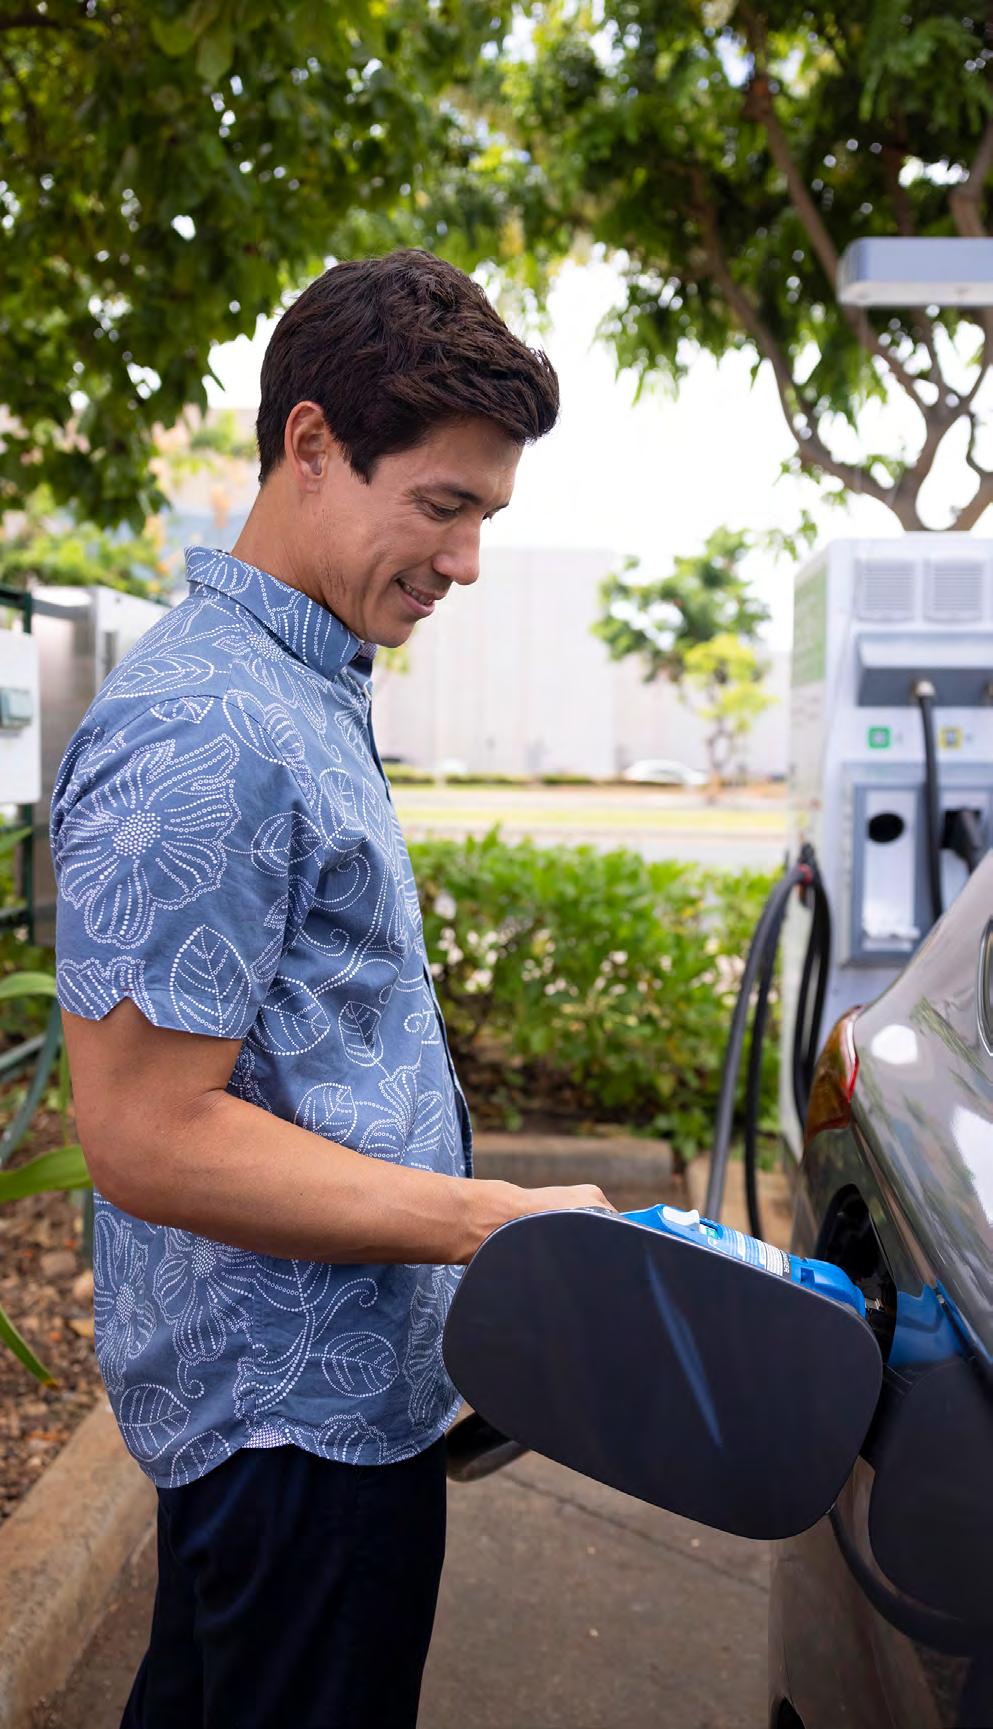
We have made significant strides in improving customer satisfaction. Our 2022 consolidated overall satisfaction score of 73 represents a 20% increase since 2015. We take pride in this improvement as a reflection of our customer-centered strategies.
We will be safe, courteous, professional and efficient as we serve you and earn your trust. To do so, we will:
T reat you as a member of our ‘ohana
R espond promptly with respect and empathy
U nderstand and listen to your needs and perspectives
S hare information clearly and concisely
T ake ownership and keep our commitments
“Our 2022 consolidated overall satisfaction score of 73 represents a 20% increase since 2015.”
Introduction
HEI
Laulima, the Hawaiian concept of “many hands cooperating and working together,” is also our approach to serving our customers and communities. More than an obligation, it is the moral, just and equitable way we strive to conduct our business. We consistently support nonprofits and organizations that advance the wellbeing of vulnerable populations and are working to ensure that diversity, equity and inclusion are foundational to everything we do.
As we endeavor to decarbonize our operations and achieve a resilient and sustainable energy future for Hawai‘i, we recognize that success requires everyone working together. We also acknowledge it is our kuleana, our responsibility, to care for and support the communities where we live, work and play.
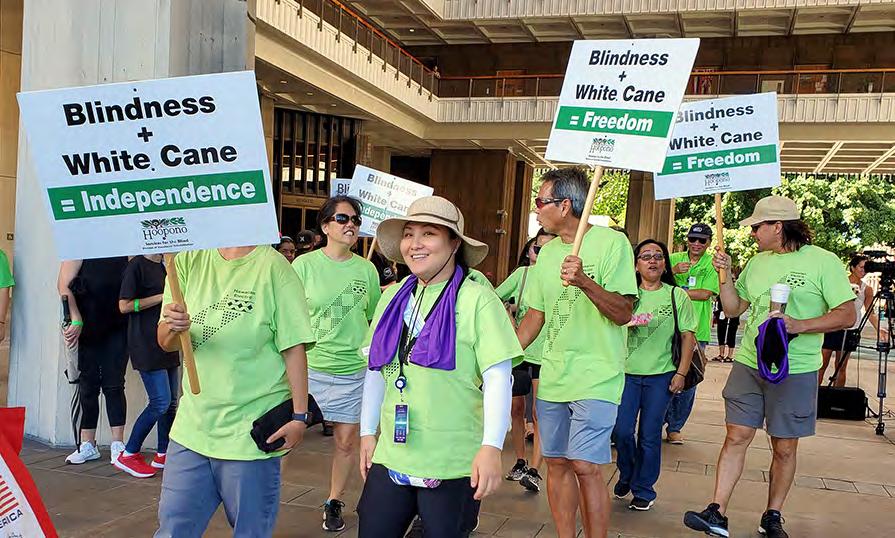
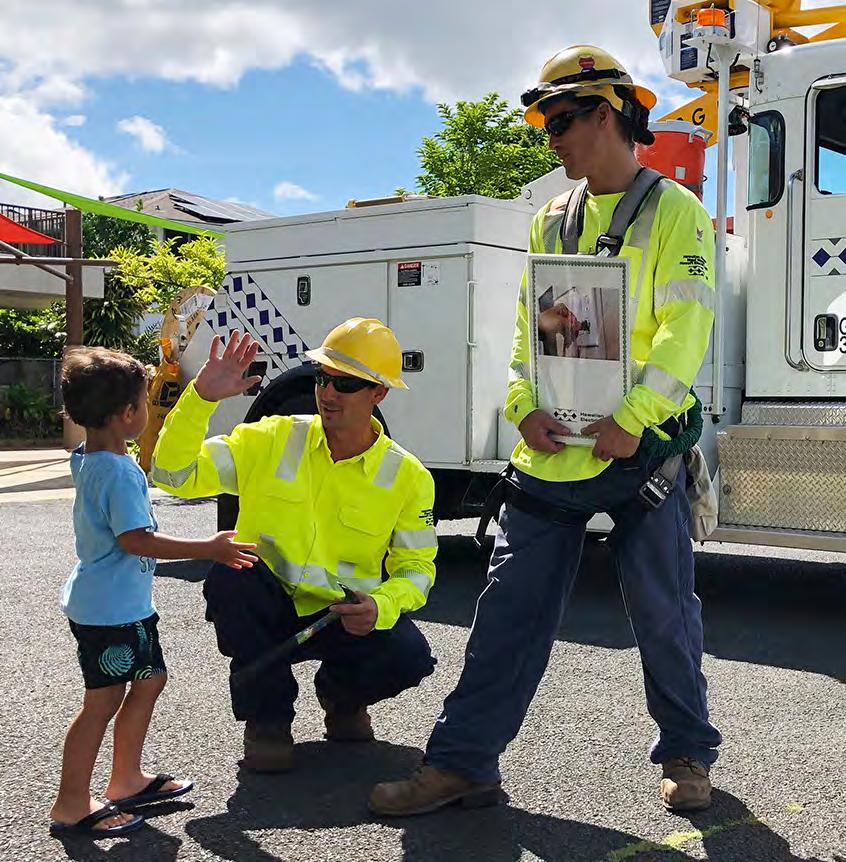
Hawaiian Electric
Thriving Environment
Thriving Economy
Thriving Communities
Thriving Employees
American Savings Bank
Pacific Current Appendix
Quantitative
Hawaiian Electric understands the impact our operations have on the community, from the resources that power electricity to the infrastructure that delivers it. We are committed to transparency about our plans and engaging in meaningful discussions with community members. It is through careful listening, responsiveness and a commitment to shared values that these efforts can succeed. To that end, we work alongside grassroots and civic leaders, government and private sector businesses and organizations to foster our shared goal of strengthening communities to build a stronger Hawai‘i. For every major project, we conduct a risk assessment to identify stakeholders and affected community members for engagement. This framework involves communicating early in the process and gathering feedback at multiple stages to build and sustain trusting relationships throughout the project.
Hawaiian Electric prioritizes early and frequent community engagement and also requires third-party developers to improve transparency and engage communities far in advance of the start of any energy project. Through discussions with community leaders, we implement their recommendations to ensure the renewable energy procurement process to build new generation is inclusive and beneficial to the communities where projects are proposed. Many of these new requirements have been incorporated by regulators into our most recent renewable energy project procurement effort. As part of the procurement process, we evaluate the volume, frequency and method of community engagement as a differentiator between proposals. This allows us to prioritize projects that meaningfully engage communities and incorporate feedback in planning, design and construction. In this way, communities are empowered to provide informed input into the process, resulting in better outcomes for all.
“We also acknowledge it is our kuleana, our responsibility, to care for and support the communities where we live, work and play.”
Hawai‘i’s indigenous concept of sustainably caring for the land and natural resources is a top priority and responsibility for all areas of our company. This includes protecting Hawai‘i’s treasured cultural and archaeological resources. We provide cultural sensitivity training to operations employees and contractors to ensure they are aware of the importance of protecting cultural and historical sites in Hawai‘i. By training these individuals to recognize potential archaeological sites and what do to upon encountering them, we demonstrate our respect of the Native Hawaiian culture and reduce the risk of potential issues when working in culturally sensitive areas.
We make every effort to strengthen the well-being of communities by supporting community nonprofit partners and their programs. This is done through employee giving and civic projects, as well as through service projects where our employees can support community-driven initiatives.
We work side-by-side with nonprofits, community and environmental groups and educational institutions to protect the environment, advocate for equity and address societal issues (e.g., homelessness and hunger), promote sustainable, healthy lifestyles and advance economic and educational opportunities. Our executive leadership is involved on the boards of key community service and business organizations.
Our connection to our communities and our commitment to build a better Hawai‘i are at the heart of our community service initiatives, all led by employee volunteers. We identify opportunities for collaboration through our employees and community engagement.

Our volunteer service projects include helping feed the hungry; holding donation drives for basic necessities such as slippers and baby supplies; participating in beach cleanups; ‘āina restoration to clear invasive vegetation and replant native Hawaiian species such as kalo (taro); clearing vegetation and reinforcing structures to protect rehabilitating wildlife; rebuilding traditional Hawaiian fishponds to improve food sustainability; building affordable homes for families and preparing living quarters for the homeless, among many other service activities.
2,400+ Volunteers (including Friends &
6,500+ Volunteer Hours
~900 Units of Blood/Apheresis Donated
$1 Million+ Total Corporate Giving
$190,000+ STEM Donations
Left: Hawaiian Electric and HEI employees joined nonprofit Kāko‘o ‘Ōiwi to clear taro patches in preparation for a new planting. Family)Introduction
HEI
Hawaiian Electric
Thriving Environment
Thriving Economy
Thriving Communities
Thriving Employees
American Savings Bank
Pacific Current
Appendix
Quantitative
Our people are our power. Our employees are valuable partners in our work towards a resilient and sustainable Hawai‘i.
Safety is one of Hawaiian Electric’s top priorities. It is our responsibility to provide a safe work environment for our employees and to conduct business in a manner that focuses on the safety of all employees, contractors, customers and the communities we serve; this is all the more critical because of the risks inherent in our industry (working at height, or in confined spaces, with dangerous levels of current and voltage and flammable materials).
We care about the wellbeing of our employees and are committed to making sure our employees are able to return home safely each day. We take seriously our goal of preventing all incidents, injuries and occupational illnesses. In this respect, we continuously work to identify and manage safety risks associated with our operations and look for innovative approaches to improve our health and safety measures.
“Our people are our power. Our employees are valuable partners in our work towards a resilient and sustainable Hawai‘i.”

Introduction
HEI
Hawaiian Electric
Thriving Environment
Thriving Economy
Thriving Communities
Thriving Employees
American Savings Bank
Pacific Current Appendix
Quantitative
We understand that safety is everyone’s responsibility and that, to foster a safety culture, all of our people must consider how their actions affect others and our workplace, and engage in meaningful, open and respectful dialogue about safety and wellbeing matters.
We demonstrate our safety commitment by:
Providing our people with the programs, tools, time and training to do what is right without taking on unnecessary risks.
Complying with all applicable laws, regulations, rules and instructions.
Undertaking regular reviews and evaluations of our operations to measure progress, foster compliance and improve safety awareness and practices, e.g., conducting regular safety observations, holding safety meetings at job sites.
Maintaining a comprehensive Safety and Health Program with procedures for hazard identification and safety risk assessment.
Operating health and safety guidelines, procedures and policies.
Auditing, monitoring and reviewing measurable targets to achieve continuous improvement in our safety capabilities; conducting an annual audit focused on safety to identify gaps for improvement.
Our safety culture begins with our executives. Our entire senior management team is committed to maintaining a strong safety culture by:
Providing visible leadership and strategic direction for the health and safety management system and programs in their area of responsibility, helping to build and maintain a strong safety culture and drive safety improvement.
Setting the tone and leading by example by prioritizing safety across the organization; encouraging and enforcing the Code of Conduct to support professionalism and psychological safety.
Investing in resources to enable implementation of safety programs.
Viewing safety of our workforce as their personal responsibility and holding themselves and others accountable for adhering to safety policies and procedures.
We strive to build a safety culture that aims for zero incidents by having all employees take ownership of the role they have in creating a safe work environment for themselves, their co-workers, contractors and the public. Our efforts include:
Reinforcing safety through a behavior-based safety system such as SafeStart®, which offers practical techniques to keep employees aware and alert to hazards. SafeStart alert communications provide lessons learned after an incident including a summary of the errors that contributed to the accident and error reduction techniques that may have prevented it.
Empowering employees and contractors to immediately STOP any work activity that presents a danger to themselves, their co-workers, contractors or the general public, without fear of reprimand or retribution.
Investing in on-site first aid services, where available, to provide early care and treatment. Early care ensures prompt reporting and avoids delay in treatment and potential further aggravation to an injury.
Implementing procedures in the field to improve safety behaviors. The Safety Observation Program is designed for improved safety communication to mitigate risks and enhance safety engagement. Safety observations provide the opportunity for employees to identify and correct hazards and communicate the problems they can’t fix. Safety observations and associated corrective actions are captured and addressed using safety management software.
Ensuring consistent procedures for investigating safety incidents through our Safety Incidents Investigation Program and Executive Incident Review Board. We use root cause analysis to determine where processes need to be improved and identify solutions to address any gaps.
Recognizing and rewarding employees for safe behaviors to encourage our workforce to be mindful of workplace hazards and take proactive measures to prevent on-the-job accidents.
Developing an employee health and safety management platform to provide ease of reporting incidents, near misses and safety observations and enhance recordkeeping for tracking and trending safety incidents for the organization.
Our safety commitment is to provide and support:
Managerial responsibility for health and safety issues
Procedures for hazard identification and safety risk assessment
Operating health and safety guidelines, procedures and policies
Emergency planning and preparedness procedures
Safety performance monitoring, measurement and reporting
Internal and external health and safety audits
Our Safety and Health Manual provides detailed safety guidelines, including commitments to ensure employees receive training and are familiar with all safety-related work programs and procedures that pertain to their job. All new employees are required to attend new employee safety training. Contractors must comply with our Safety and Health Manual, and compliance with safety guidelines is included in contractual agreements. We require all contractors to undertake contractor orientations, including safety training, at least every two years. Our internal audit team conducts an audit focused on safety every year.
Introduction
HEI
Hawaiian Electric Thriving Environment

Thriving Economy
Thriving Communities
Thriving Employees
American Savings Bank
Pacific Current Appendix
Quantitative
“Hawaiian Electric, by 2025, shall be one of the most progressive and highestperforming companies in the world, serving the energy needs of each person in Hawai‘i with purpose, compassion, empathy and aloha for our fellow humans and our natural environment. We commit to be the best in all we do. We turn our Hawai‘i spirit and our connectedness with others to our community’s advantage. We act with boldness and urgency, without fear of failure. Our highest priority is to build a sustainable Hawai‘i in which our children and grandchildren, our communities, our customers, and employees will thrive, together. We succeed by providing exceptional service to our customers and integrating and aligning our actions with those of other businesses and organizations. We drive ourselves and others to higher levels of achievement than ever before.”
We evaluate our safety performance by monitoring recordable incidents, total case incident rate (TCIR) and severity rate. For more information, see pages 81 and 92. TCIR measures the number of work-related injuries and illnesses per 100 employees. Severity rate measures the total number of Occupational Safety and Health Administration (OSHA) recordable days per 100 employees.
Executive compensation is tied to achievement of recordable incident targets. These targets reward improvements in workplace safety, promote employee well-being and reduce expenses.
We’re committed to building a strong culture to support the long-term success and sustainability of the utility and our workforce. In 2020, we adopted the declaration to the left as a means to not only inspire us, but also to hold ourselves accountable to be the best we can be for our customers, communities and fellow employees.
Our leaders are empowered to create a working environment that supports high performing teams through action plans that address productivity and meaningful teamwork by living the Company’s Values of Safety, Aloha, Integrity, and Excellence. We solicit employee feedback to keep pace with employee sentiment and engage them in building the future of the company. Expected behaviors to support the Declaration are embodied in the leadership and organizational competencies that are reinforced in development programs. We aspire to continue strengthening our relationships with and among our employees while providing flexibility to do purposeful and high-quality work as we commit to fulfilling the company’s declaration and strategies.
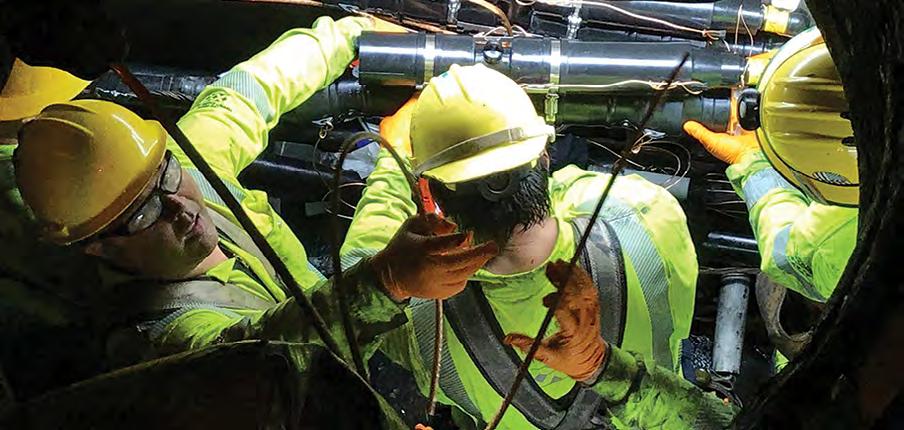
“Our leaders are empowered to create a working environment that supports high performing teams through action plans that address productivity and meaningful teamwork by living the Company’s Values of Safety, Aloha, Integrity, and Excellence.”
At Hawaiian Electric, we see diversity — of people, backgrounds, experiences, thoughts and perspectives — as an advantage that helps us meet our customers’ needs and achieve our goals.
Hawaiian Electric’s workforce is racially diverse, reflecting the unique demographics of Hawai‘i. As reported in our 2022 data, 89.9% of our utility’s total workforce was non-white (listed as “racially diverse” in the chart to the right), as were 85% of our leaders and 56.3% of our executives. 28.8% of our total workforce was female, as were 28.9% of leaders and 37.5% of our executives.
Hiring and promoting individuals from diverse backgrounds is very important to us. We are committed to providing inclusivity and equal employment opportunity in all areas of employment. We strive to provide employment opportunities in a manner that does not discriminate on the basis of race, color, age, religion, sex, national origin, disability, pregnancy, protected veteran status, sexual orientation, gender identity or any other legally protected status under applicable state and federal laws.
We recognize that words require action, so here are some concrete initiatives that we undertook in 2022:
We again established a DEI goal for all employees to continue growing and expanding their awareness of the circumstances and experiences of others. 99.8% of our workforce participated in various in-person, virtual and online activities to meet this goal which we will once again pursue in 2023.
The company supported local organizations that advocate for inclusion and acceptance. To name a few, we walked and fundraised to expand programs that benefit people with intellectual and developmental disabilities in Hawai‘i for Best Buddies; we officiated bocce competitions with Special Olympics Hawai‘i athletes at their ‘Aukake Classic event; and we participated in Ho‘opono Services for the Blind’s White Cane Walk, helping raise awareness of how the white cane empowers blind and visually impaired individuals and supports their independence, freedom, and confidence.
Guest speakers and training on various topics continue to be a part of our DEI program including an Executive DEI Roundtable comprised of a few of our executives and President and CEO sharing their DEI stories and perspectives. Additional topics included the vast gender spectrum, LGBTQIA+ history and ways to be a supportive LGBTQIA+ ally in the workplace.
Our company’s speaker’s bureau program provided our employees the opportunity to engage with students from Title 1 schools to provide education on energy conservation and efficiency, emergency preparedness and careers.
Our affirmative action efforts include initiatives relating to women, minorities, individuals with disabilities and veterans, and partnering with organizations that promote opportunity and inclusion. Examples of our outreach efforts in 2022 include:
Hawaiian Electric aspires to further develop an environment in which all members of our communities feel respected and valued for their differences and unique contributions.
We also celebrated unity, equal rights, and inclusion of all gender identities and the diversity of our LGBTQIA+ community at the Honolulu Pride Festival as LGBTQIA+ allies and engaged with the LGBTQIA+ community at our booth.
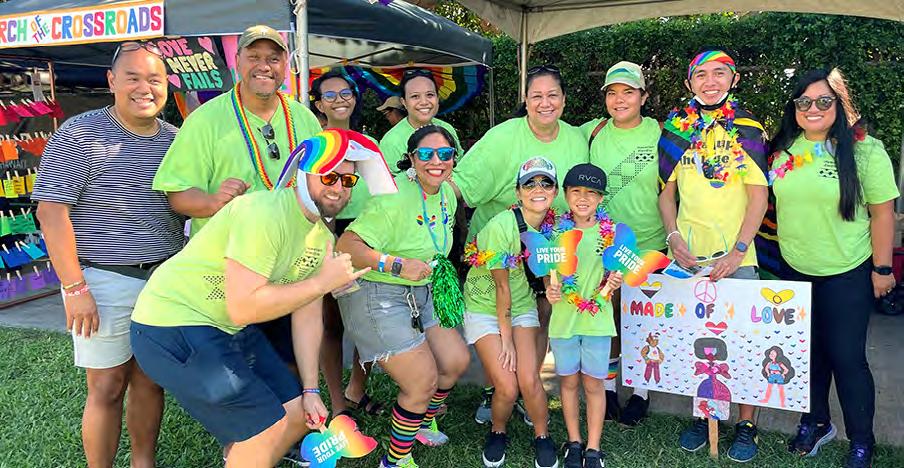
Outreach to agencies that serve veterans, women and individuals with disabilities, including American Job Center, Work for Warriors Hawaii, Military & Family Support Center Joint Base Pearl Harbor-Hickam, Department of Veterans Affairs, U.S. VETS — Hawai‘i, Women’s Fund of Hawai‘i and the State of Hawai‘i Vocational Rehabilitation Division.
Participating in job fairs and career events with schools and organizations with further outreach into the community and employer presentations.
Employee engagement is key to strengthening our foundation and developing an engaged, high-performance workforce. Our CEO and executive team hold regular “talk story” sessions with employees to learn the pulse of our company, gain insights to our employees’ needs and encourage continuous dialogue.
We conduct employee engagement surveys to give our leaders visibility to the health of our company. Employee engagement surveys provide a “snapshot” of company culture and are conducted on a one- to two-year cycle. Results of the 2022 survey have been shared with business areas so they may develop plans toward increasing engagement. Transitioning our business to 100% renewable energy can create an environment of change for our employees, and we are committed to helping them successfully navigate and embrace the changes we face.
Our company and leadership team continue to work alongside employees to reach our goals as they align to our 2021-2025 Strategic Plan and Declaration. Results from the 2022 employee engagement survey indicate that employees understand our purpose to build a sustainable Hawai‘i for future generations and our work is meaningful. Results also showed an increase in employee job satisfaction. It is encouraging that our employees feel this way and have demonstrated that they are adaptable and resilient in light of the challenges and transitions of the last year. We recognize how the evolving nature of work and our industry is impacting our employees. We use different ways to show employees that the company cares about their well-being. This means doing a better job implementing change across the company, including introducing One Company efficiencies, sustaining our workforce and enhancing collaboration within and between teams.
Our company owes its success to our hard-working, dedicated and engaged employees. We believe for our employees to feel fulfilled and happy working here, we need to take care of their needs.
Financial well-being. We offer pensions to employees hired prior to January 1, 2022, and for employees who join thereafter, a 10% non-elective employer 401K contribution to help employees develop greater financial security. We continue to assess the competitive landscape with respect to these programs so we can make appropriate adjustments. We also offer voluntary educational assistance, bus pass reimbursement and arrangements with vendors to offer our employees discounts for a variety of products and services, such as computers, computer products, business software, advanced electronics and cellular equipment.
Emotional well-being. We recognize the importance of achieving work-life balance for our employees and company. To help employees manage their needs, we offer opportunities for part-time (less than 20 hours/week) work schedules, flextime schedules, teleworking and various leave programs. We also provide other employee benefits such as vacation, paid holidays, family and medical leave, bereavement leave and adoption expense reimbursement. In addition, we offer an employee assistance program that provides free and confidential counseling and assistance on a range of topics.
Compensation. We seek to provide compensation that is comprehensive, marketcompetitive and internally equitable. This helps us to attract, engage and retain highly skilled employees to advance our commitment to provide customers and communities with affordable, reliable and clean energy. In that effort, we continue to assess total rewards compared to the market and make appropriate adjustments to be competitive
Approximately 48% of our workforce is represented by the International Brotherhood of Electrical Workers (IBEW) Local 1260. Our current collective bargaining agreement with IBEW Local 1260 took effect on November 1, 2021, and is in effect through October 31, 2024. In 2019, IBEW Local 1260 and Hawaiian Electric together developed a joint Code of Excellence (COE), which aims to create a collaborative partnership between the utility and union. COE training was delivered to over 60% of Company and Union leaders in 2022. The COE training, which is facilitated by both the utility and union, will continue in 2023.
As we accelerate towards our net zero future, the company seeks to ensure that employees impacted by fossil fuel plant closures are able to navigate this transition equitably. Elements of our plans under development include:
Expanding resources dedicated to holistic workforce planning capabilities
Identifying areas and functions across the company potentially well-suited for impacted employees
Investing in reskilling and training opportunities for impacted employees
Physical well-being. Our health and welfare benefits include medical, dental, vision, prescription drug, group life insurance, accidental death & dismemberment insurance, long-term disability insurance, worker’s compensation, long-term care and flexible spending accounts. Wellness and preventive programs include sick leave, an employee assistance program and other wellness education programs.
We are committed to creating an environment of diversity, seeking the best candidates while giving all applicants equal opportunity. Finding and attracting diverse and talented candidates requires thoughtful planning and partnering with the community. Our efforts include working with organizations with a focus on women, veterans and those with disabilities, partnering with educational institutions and expanding our reach through multiple social media platforms. We also provide opportunities for internships and externships, and support science, technology, engineering & math (STEM) and mentoring programs, and are one of the largest employers of skilled tradespeople in the state with many coming through our own apprenticeship programs. Our employees have been longstanding mentors for high school students participating in robotics programs on O‘ahu and Hawai‘i Island. Today, several former robotics students are employed at Hawaiian Electric as engineers.
Our succession planning strategy is designed to ensure we have the right talent and leadership to fill critical positions. This includes leadership assessments that result in individual comprehensive development plans. Part of the strategy is a 360-degree feedback assessment (based on defined leadership competencies) which includes individual coaching sessions on results and use of individual development plans. We also encourage and support developing leaders in applying to community leadership programs such as Omidyar Fellows, Patsy T. Mink Leadership Alliance and Pacific Century Fellows.
To build a high-performance workforce, we offer courses in required safety training, leadership development, employee development, technical training, apprenticeship programs and operational and environmental compliance. Engaging courses are offered in a multitude of modalities — through remote, in-person and live virtual learning. In addition, we make available to our employees a suite of fully automated learning via our Learning Management System (LMS) where employees can browse learning material at their leisure. We also offer leader and employee assessments geared toward improving job effectiveness and productivity.
Our annual performance review process includes assessment of performance-based goals as well as on culture dimensions and individual achievements. Our Human Capital Management (HCM) Strategy focuses on integrating programs to enable our workforce to achieve current and future business strategies. HCM areas include Strategic Workforce Planning, Strategic Business Partnering, Employee & Leadership Development, Labor Relations, Competitive Compensation and Benefits (Total Rewards). Within each of these areas, specific initiatives include culture renovation, succession, partnerships with schools and community organizations to upskill, reskill and provide talent pipelines, DEI programs, workforce planning action plans, labor-management Code of Excellence and workforce data analysis. Collectively, these programs and initiatives build and strengthen our workforce. Annual succession planning ensures the identification and development of successors and high potentials and nurtures a leadership pipeline.
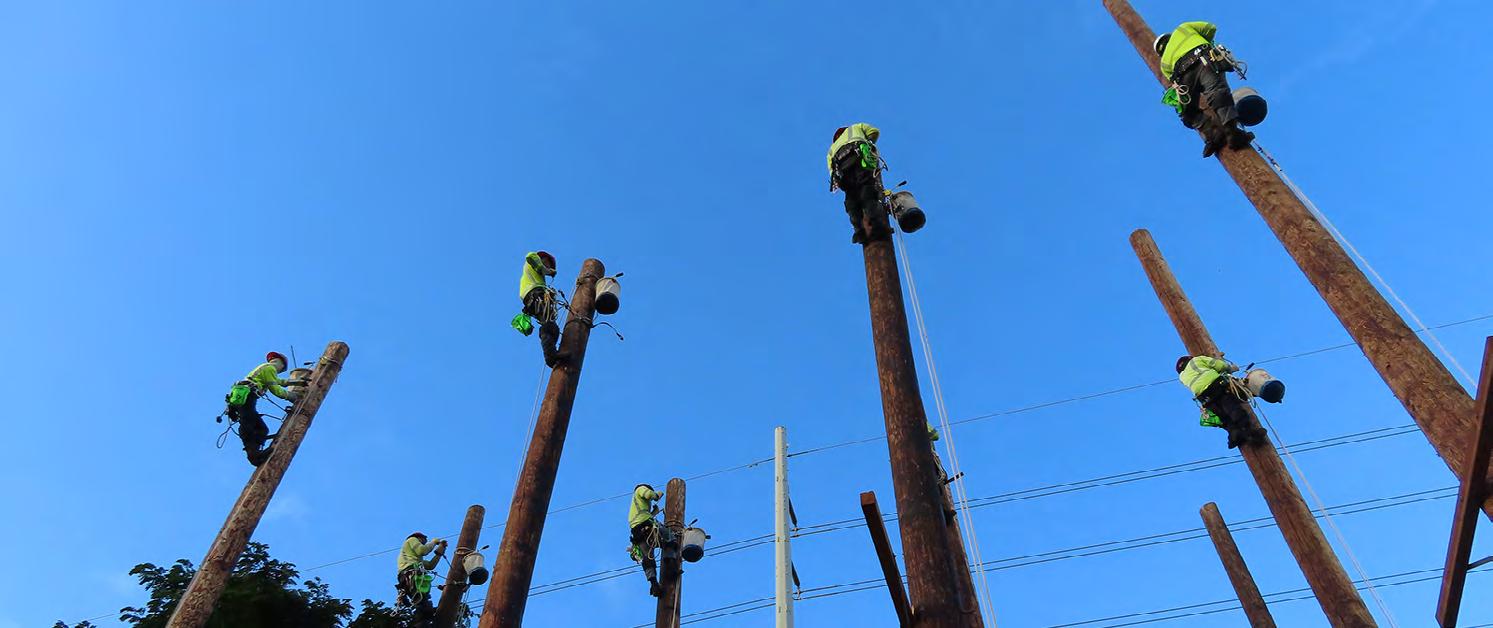
“Our Human Capital Management (HCM) Strategy focuses on integrating programs to enable our workforce to achieve current and future business strategies.”

American Savings Bank has been proudly serving the people and businesses of Hawai‘i since 1925. We are committed and passionate about making dreams possible for our customers, community and 1,100 teammates across the state.
We run our business in a way that helps uplift our community and make it a better place for future generations. Our commitment is reflected in everything we do — from supporting local businesses and entrepreneurs to being responsible stewards of our environment, hiring and investing in the best employees and bringing real impact to our community. We look forward to serving Hawai‘i for the next 100 years and beyond.

Introduction
HEI
Hawaiian Electric

American Savings Bank
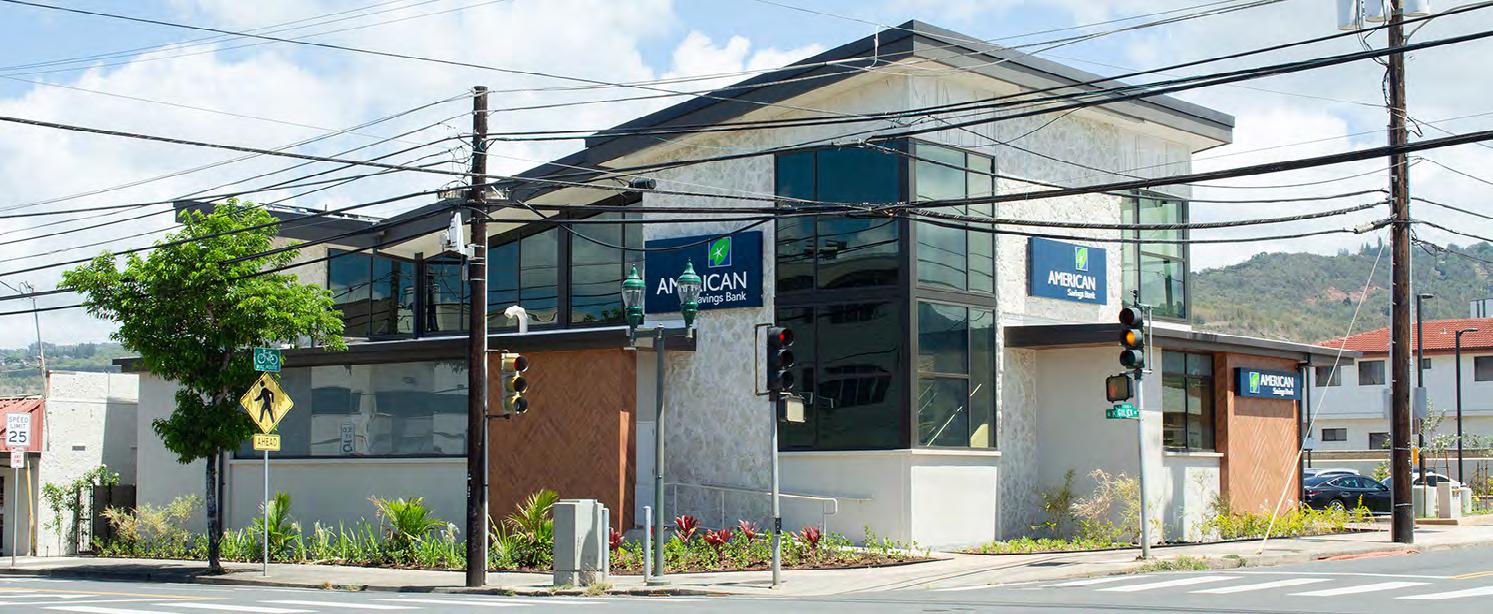
Thriving Economy
Thriving Customers
Thriving Communities
Thriving Employees
Thriving Environment
Pacific Current Appendix
Quantitative

For decades, Hawai‘i has aimed to create a diverse and resilient economy. The COVID-19 pandemic underscored the importance of self-sufficiency, supporting small businesses as the lifeblood of our economy, adopting sustainable environmental and business practices and the need for collaboration across all sectors to solve key issues to truly enable the state to become more self-reliant.
ASB is proud to share in and be at the forefront of this mission by expanding solutions and possibilities for Hawai‘i consumers and businesses. Our core business focuses on lending to help businesses and families thrive, and in 2022 we funded over $2 billion in loans for our customers. We foster innovation and entrepreneurship through monetary support and by providing business and financial expertise to Hawai‘i’s startup community.
When Congress established the Paycheck Protection Program (PPP) in March 2020 through the CARES Act, ASB teammates from all across the bank rallied and created a 24-hour operation to secure as much federal funding as possible for Hawai‘i companies before funding ran out. From setting up loan application processes to verifying documents, our team members went above and beyond to support local companies during an extremely difficult time.
In March 2020, ASB established a loan payment deferment program for our commercial borrowers, which continued through 2021. Business customers were able to request up to two 90-day deferments, which provided some breathing room as they took care of their customers and workers and purchased protective equipment.
We helped our PPP customers navigate the subsequent loan forgiveness process, which was a huge relief and turning point for businesses as they transitioned from survival to recovery mode. As long as their loan proceeds were used on payroll costs, mortgage interest payments, rent payments, utilities, operations expenditures, property damage costs, supplier costs and worker protection expenditures, and the borrower met all program requirements, the loan was eligible for forgiveness by the U.S. Small Business Administration. As loans were forgiven, banks received fees related to these loans. In 2021, PPP fees contributed about $14 million in revenue for ASB.
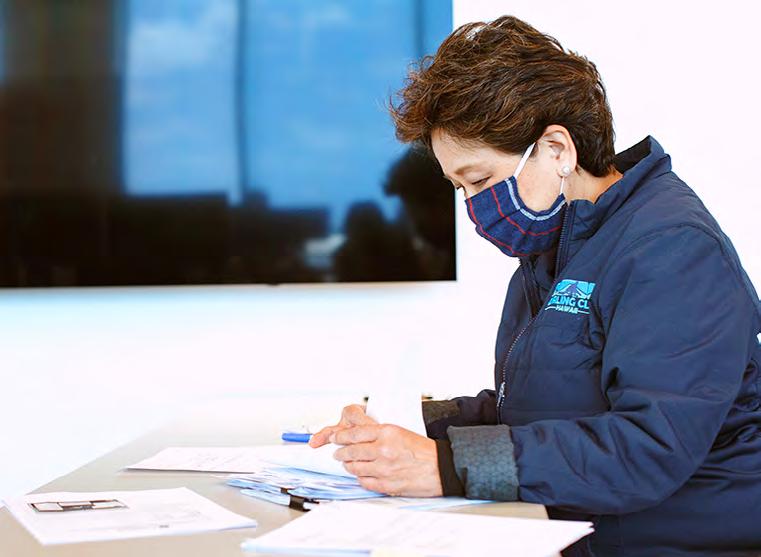
Purchasing a home in Hawai‘i is no simple feat and more kama‘aina (residents of Hawai‘i) are finding it challenging to remain in the islands with the high cost of living. Combined with rising interest rates and inflation, it’s more important than ever for us to encourage, support and invest in affordable housing in Hawai‘i and provide more quality living spaces for families, keiki (children) and kupuna (senior citizens).
According to the Honolulu Board of Realtors, the median price of a single-family home on O‘ahu soared to $1,105,000 in December 2022, an 11.6% year-over-year increase.
Currently, ASB has investments in more than 25+ low-income housing projects in Hawai‘i, including:
$9.2 million in Kaiāulu O Waikoloa, a multi-family apartment development in Waikoloa, Hawai‘i Island
$8.3 million in Kaiāulu O Halele‘a, a multi-family rental community in Kīhei, Maui
“In 2022, ASB worked to become one of the few local lenders in Hawai‘i participating in the U.S. Department of Housing and Urban Development’s Section 184A Native Hawaiian Housing Loan Guarantee program, which will increase the financing options for Department of Hawaiian Home Lands (DHHL) beneficiaries.”
Introduction
HEI
Hawaiian Electric American Savings Bank
Thriving Economy
Thriving Customers
Thriving Communities
Thriving Employees
Thriving Environment
Pacific Current Appendix
Quantitative

$9.3 million in Kaiāulu O Kūku‘ia, an affordable workforce housing development in Lāhainā, Maui
$20.4 million in Halewai‘olu Senior Residences, a new development in the heart of Downtown Honolulu
25+
We are also a major supporter of the Hawai‘i Community Foundation’s House Maui Initiative, a program designed to expand access to affordable housing in Maui County.
In 2019 ASB’s primary regulator, the Office of the Comptroller of the Currency (OCC), recognized ASB’s “excellent level of qualified community development (CD) investments” on O‘ahu, Kaua‘i and Hawai‘i Island.
Just steps away from the ASB Campus, Halewai‘olu Senior Residences is an affordable housing project that will provide 156 living spaces to seniors in the surrounding Chinatown community. The project began in 2021 with ASB’s investment of $20.4 million and is estimated to be completed in 2023.
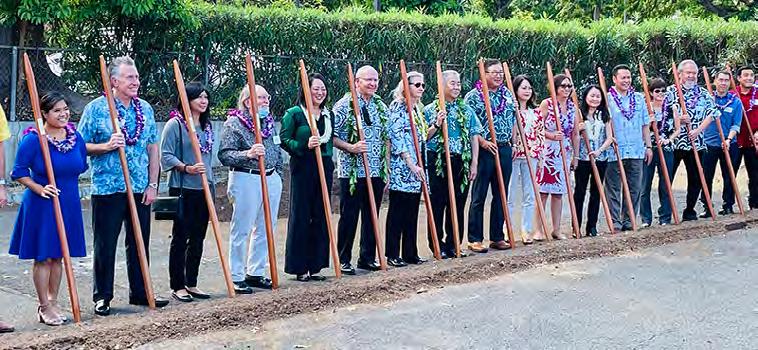
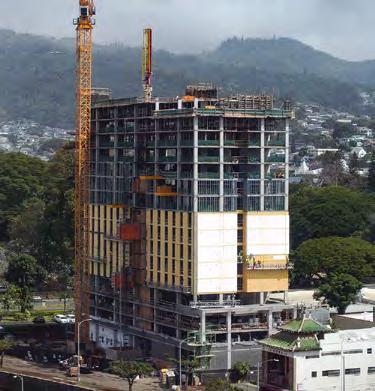
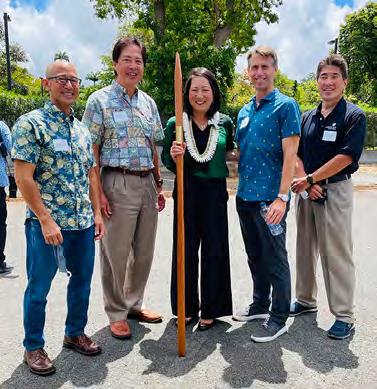
In 2022, ASB worked to become one of the few local lenders in Hawai‘i participating in the U.S. Department of Housing and Urban Development’s Section 184A Native Hawaiian Housing Loan Guarantee program, which will increase the financing options for Department of Hawaiian Home Lands (DHHL) beneficiaries. With nearly 30,000 Native Hawaiians on the waitlist for homes, we are committed to providing financial support and resources to help these families make their homeownership dreams possible. Our partnership with Hawaiian Community Assets will help to provide financial literacy to beneficiaries to elevate their financial education. The nonprofit operates financial opportunity centers statewide providing financial counseling, income support and employment and entrepreneurship coaching to low-and moderate-income households and communities.
Statewide Low-Income Housing Project Investments
Left: ASB teammates attend a groundbreaking ceremony for Halewai‘olu Senior Residences, a new 156-unit affordable housing project constructed in Downtown Honolulu, steps away from ASB’s Campus.Introduction
HEI Hawaiian Electric American Savings Bank
Thriving Economy
Thriving Customers
Thriving Communities
Thriving Employees
Thriving Environment
Pacific Current Appendix
Quantitative

ASB is a proud supporter of several local business accelerator programs, including Blue Startups, a 13-week program for tech-focused companies, Mana Up, a 12-week program for consumer packaged goods companies with a Hawai‘i influence, and Elemental Excelerator, a nonprofit accelerator for climate tech deployment. We have also been longtime supporters of the state’s student entrepreneurs at the Hogan Entrepreneur Program at Chaminade University and the University of Hawai‘i’s Shidler College of Business and Pacific Asian Center for Entrepreneurship (PACE).
We recognize that innovation and entrepreneurship begin from the earliest days in the classroom. In 2015, ASB created the KeikiCo Contest, designed to foster innovation and entrepreneurship among the state’s youngest learners. In 2022, the annual contest received 128 entries from nearly 400 students and 17 schools across the state and ASB awarded more than $140,000 in unrestricted funding to nine schools.
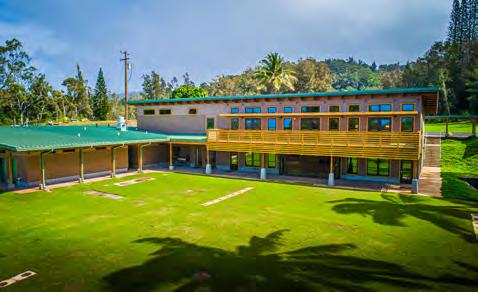
In addition to KeikiCo, ASB has supported many other K-12 entrepreneurship efforts, such as Center for Tomorrow’s Leaders, the Hawai‘i Agricultural Foundation’s Young Entrepreneurship Program and Kupu’s Hawai‘i Youth Sustainability Challenge, which are programs that teach Hawai‘i students about entrepreneurship, innovation, STEM, environmental stewardship and leadership.
$100,000
Donated to Girl Scouts of Hawai‘i’s STEM Center for Excellence
$500,000
Pledged, in partnership with HEI, to the University of Hawai‘i Foundation for Residences for Innovation Student Entrepreneurs (RISE), a livework community for future entrepreneurs
ASB is invested in the growth and development of Hawai‘i’s students and future workforce. In July 2021, ASB donated $100,000 in support of Girl Scouts of Hawai‘i’s STEM Center for Excellence at Camp Paumalu, a 135-acre living laboratory that provides year-round opportunities in cybersecurity, astronomy, robotics, computer coding, botany, chemistry, environmental stewardship and more. The center enables young women to enjoy outdoor adventures while exploring science, technology, engineering and careers in STEM through on-site experiments.
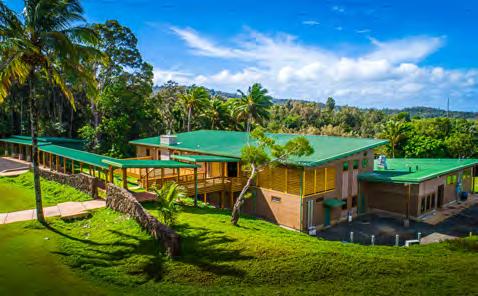

As part of our commitment to develop the state’s future leaders and entrepreneurs, ASB and HEI pledged $250,000 each to the University of Hawai‘i Foundation’s live-learn-work community at Residences for Innovative Student Entrepreneurs (RISE). The combined pledge of $500,000 will be used to fund the RISE center’s furnishings, fixtures and equipment, along with operational programs and student scholarships over the next 10 years.
Far left: ASB awarded $140,000 to nine local schools in the annual 2022 Bank for Education KeikiCo Business Plan Competition.
Above: ASB donates $100,000 to Girl Scouts of Hawaii to support their STEM Center for Excellence at Camp Paumalu.
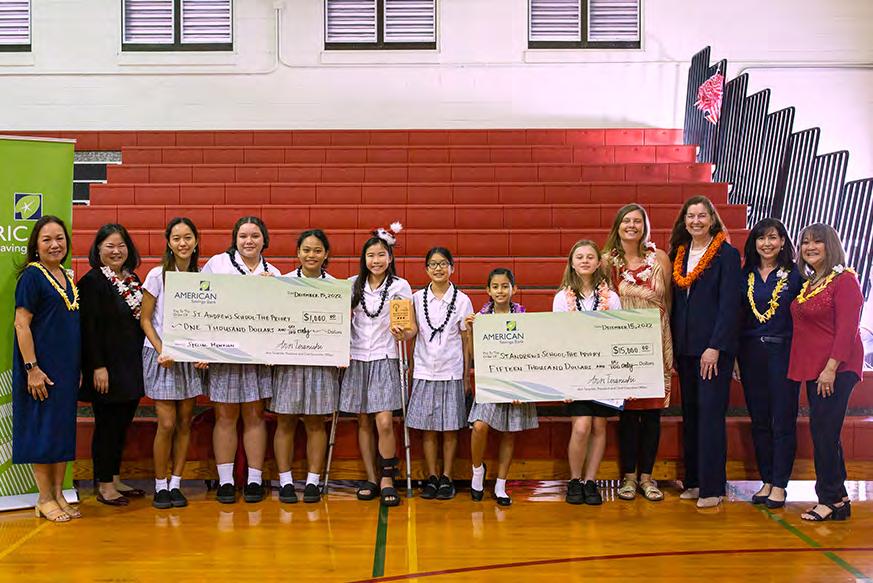
For a local community bank, there is no greater measure of success than when its customers thrive. We pride ourselves on making dreams possible and guiding customers through every major financial milestone in their life.
We have branches on five islands — O‘ahu, Maui, Hawai‘i Island, Kaua‘i and Moloka‘i — and our online banking platforms and Customer Banking Center (telephone banking center) make our tools accessible to everyone.
With 36 locations across the state and 29 offering weekend hours, we strive to provide customers with banking options that meet their needs and lifestyle. We also seek opportunities to enhance our Customer Banking Center, which customers can call for support seven days a week, including most holidays.

Introduction
HEI
Hawaiian Electric American Savings Bank
Thriving Economy
Thriving Customers
Thriving Communities
Thriving Employees
Thriving Environment
Pacific Current Appendix
Quantitative
Over the years, we’ve made strategic decisions to consolidate some of our locations to align with customers’ evolving banking preferences. To meet these needs, ASB continues to invest in technology and enhance our digital banking solutions. Along with these shifts, we’ve also gained opportunities to streamline and automate processes and support our teammates in delivering an even better customer experience.
Our online tools and resources continue to be the preferred method of banking for many of our customers. Customers can easily open a checking, savings or Certificate of Deposit account within minutes on their tablet, phone, laptop or personal computer. With our userfriendly online mortgage form, customers can easily submit information needed to apply for a mortgage and upload documents from their laptop, phone or tablet.
Through the ASB Hawai‘i Mobile App, customers can safely manage their finances with ease. In 2022, we upgraded our Pay-a-Friend service to Zelle, a new, secure, fast and more convenient way to send money digitally to friends and family. Our ASB Hawai‘i Mobile App makes it easy for customers to deposit checks directly into their ASB accounts.
In response to our customers’ changing needs and banking preferences, we opened three ASB Digital Centers (two on O‘ahu and one on Kaua‘i) and introduced customers to a first-of-its-kind way of banking in Hawai‘i. With no traditional teller windows, customers complete their common banking transactions at our full-service ATMs. They can also speak in-person with an experienced banker for help with their individual financial needs and goals, learn through banker-guided demonstrations about our online and mobile banking options, or connect virtually with other bankers for additional support and services using an on-site meeting room. At our ASB Digital Centers, customers can expect an easy and convenient digital banking experience and receive the same warm and friendly service they would at any ASB branch.
At our full-service ATMs that are conveniently located across the state, customers can safely and securely complete common transactions, including deposits, withdrawals, balance inquiries and more. Customers no longer need to visit a branch during business hours to complete common transactions; our ATMs make it faster and easier to bank on-the-go.
Customers can visit asbhawaii.com or our mobile app and log in to online banking to quickly and easily schedule an appointment by choosing a date, time and location that fits their schedule.

36
ASB Locations Across Five Islands — O‘ahu, Maui, Hawai‘i Island, Kaua‘i and Moloka‘i
29 ASB Branches Offering Weekend Hours
Introduction
HEI
At ASB, feedback and collaboration are core to our company culture. We regularly seek customer feedback through surveys, comment forms and focus groups to ensure we are providing the best possible service, making banking easy and continually finding ways to improve.
As more customers conduct their banking transactions online or using our mobile app, we are focused on ensuring their digital experience mirrors the simple, secure, personalized support they would receive from any of our bankers and locations.
Teammates who receive a complaint notify their manager, who will address the situation or escalate it to the appropriate team member for resolution. We also monitor ASB’s social media sites and other online comment boards for customer feedback. On a quarterly basis, our Consumer Banking, Legal and Compliance teams review trends in customer feedback to identify any accessibility issues and assess whether we should make changes to our policies or procedures.
Safeguarding our customers’ confidential information is one of our top priorities. We devote significant resources to regularly maintain and update our systems and processes to protect the security of our computer systems, software, networks and other technology assets that store customer information.

As we continue to expand online access and tools for customers, ASB has adopted a robust information security program to monitor, detect and mitigate cyberattacks. We have implemented administrative, physical and technical controls, including layers of firewalls and data security software, regular risk and security assessments, access control, monitoring, penetration testing, vendor engagement reviews and training to protect sensitive information.
The ASB Information Security Program is based, in part, on section 501(b) of the GrammLeach-Bliley Act, the associated Interagency Guidelines Establishing Standards for Safeguarding Customer Information and guidance provided by the Federal Financial Institutions Examination Council, National Institute of Standards and Technology’s Cybersecurity Framework (version 1.1), and the Center for Internet Security’s 18 Critical Security Controls.
Hawaiian Electric American Savings Bank
Thriving Economy
Thriving Customers
Thriving Communities
Thriving Employees
Thriving Environment
Pacific Current Appendix
Quantitative
We recognize the trust that our customers place in us when they deposit their hard-earned money, consult our bankers or take out a loan with us.
Protecting our customers begins with ASB providing the information customers need to make informed decisions about opening an account, taking out a loan or making an investment. We hold ourselves to high ethical standards and provide customers with appropriate disclosures as required of financial institutions.
Customers who open accounts should know that we have their best interests in mind. We train our tellers, personal bankers and operations teammates to recognize counterfeit, forged or altered checks, as well as signs of identity theft and elder abuse.
Our Enterprise Risk and Fraud teams monitor transactions to identify potential fraud and other unlawful activity. If we detect suspicious activity, our experienced fraud investigators will promptly conduct an investigation and provide any appropriate redress to the customer. If customers detect any fraudulent or suspicious activity on their ASB accounts, they are encouraged to immediately contact our Customer Banking Center.
Globally, phishing and smishing are the primary methods of attack for unauthorized access to systems and information. Our teammates receive regular training on how to protect information and avoid social engineering attacks. Our Information Security team routinely tests our teammates’ knowledge with simulated emails and attempts at phone-based social engineering. We also provide regular updates to our teammates and customers on the latest scams.
“We regularly seek customer feedback through surveys, comment forms and focus groups to ensure we are providing the best possible service, making banking easy and continually finding ways to improve.”
Introduction
HEI
Hawaiian Electric American Savings Bank
Thriving Economy
Thriving Customers
Thriving Communities
Thriving Employees
Thriving Environment
Pacific Current Appendix
Quantitative
At ASB, community is at the core of everything we do. It is central to who we are, how we do our business, how we engage our employees and how we succeed in the long term. Some of the many ways we support a thriving community are by offering community development loans, affordable housing investments, small business development programs, charitable contributions, community service projects, financial education initiatives and pro bono services.
Our teammates consistently share through quarterly engagement surveys that they are proud to work for a company that brings real impact to our community. Our teammates are deeply engaged in these efforts — from supporting our nonprofit partners to sponsoring events and activities year-round that help advance local families, our team members give big and from the heart to make Hawai‘i a better place.
ASB offers a free, online Financial Checkup, which provides customers and noncustomers a real-time assessment of their financial wellness, as well as recommendations
to help them learn about improving their situation. Thousands of residents have also improved their financial futures by taking advantage of our ASB Financial Education program, a free, comprehensive resource center available on asbhawaii.com.
In addition to the online self-service tools and content, ASB regularly hosts free in-person and virtual seminars on a variety of topics such as first-time homebuyer tips, saving and investing, planning for retirement, cybersecurity tips, green energy loans and fraud prevention, among others.
Our bankers also frequently engage with local schools and nonprofit organizations, such as Junior Achievement and Girl Scouts of Hawai’i, to teach about personal financial responsibility and entrepreneurship. ASB partners with 46 public and private schools across the state through our Bank for Education program. Since the Bank for Education program began in 2010, ASB has donated more than $1.6 million to local schools.
Through our affiliations with nonprofits and other community partners, we support a variety of programs for some of the most vulnerable groups in our state. For example, we assist lowand moderate-income individuals and families with completing their income tax returns free of charge, through our participation in the Internal Revenue Service’s Volunteer Income Tax Assistance program and partnership with Goodwill Hawaii. We also have provided cybersecurity tips for kupuna, translation services to ensure non-English speaking residents have access to important financial tools and resources, and created a “Quick Tip Tuesday” monthly video series featuring our bankers providing useful financial tips on our social media platforms.
46
Public and Private Schools in Hawai‘i Partnered with ASB Through the Bank for Education Program
$1.6 Million
Donated to Local Schools Through the Bank for Education Program
Left: ASB partnered with Super Skate Posse, Trust for Public Land and Down With APB to host a skateboard giveaway event at ‘A‘ala Park — next to ASB’s Campus — for 50 youth from surrounding public schools. Each participant received a brand new skateboard, helmet and sneakers, in addition to free skate lessons from notable skateboarders.
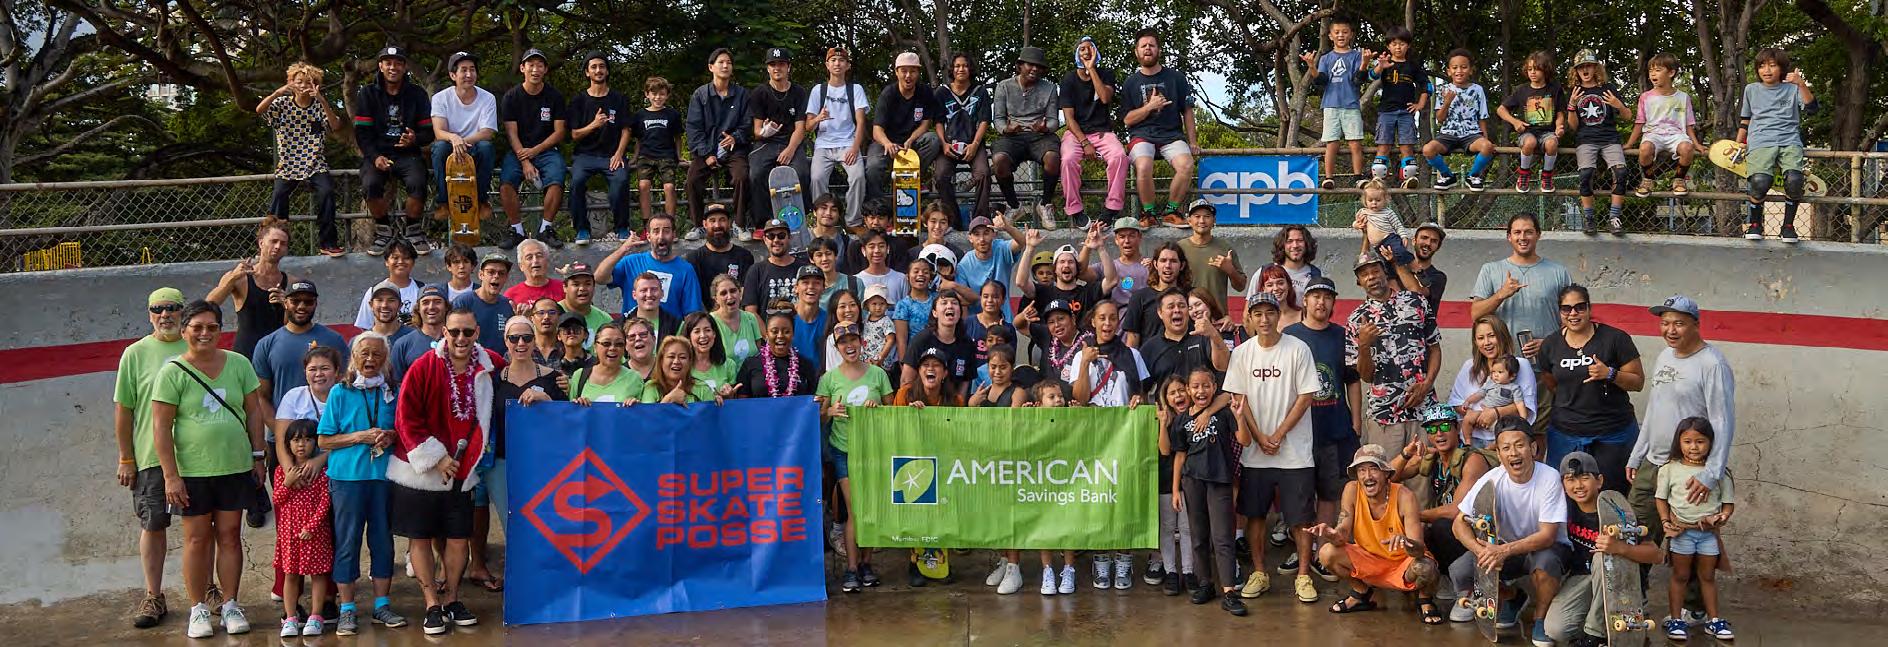
Introduction
HEI
ASB strongly supports the Community Reinvestment Act (CRA), which is a federal law that encourages financial institutions to help meet the credit needs of the communities in which we operate, including low- and moderate-income neighborhoods, consistent with safe and sound operations.
We offer a number of solutions that benefit low- and moderate-income families. For instance, we participate in the Fannie Mae HomeReady and Freddie Mac Home Possible programs, which help make homeownership a possibility for credit-qualified low- and moderate-income families.
ASB is also a participating lender in the Mortgage Credit Certificate Program, which reduces the amount of federal taxes that low- and moderate-income borrowers pay and frees up their income for mortgage qualification purposes. Additionally, we participate in programs that provide down payment or reduced closing costs to qualified first-time homebuyers (ASB’s First Time Homebuyers program, Hometown Heroes program for frontline workers, and Federal Home Loan Bank of Des Moines’ Home$tart and Native American Homeownership Initiative programs).
Hawaiian Electric American Savings Bank
Thriving Economy
Thriving Customers
Thriving Communities
Thriving Employees
Thriving Environment
Pacific Current Appendix
Quantitative
In 2019, ASB received a “Satisfactory” CRA rating from the OCC. The OCC recognized ASB’s “excellent responsiveness to the credit needs” of Hawai‘i residents and commented that the bank’s service delivery systems were “readily” or “reasonably accessible” to people of “different income levels.”

ASB also offers a variety of additional banking products to help families get ahead. For example, our Kalo Essentials checking account, which does not have a monthly service fee or minimum balance requirement, is a great option for customers looking to build their savings. We even offer a free Moneyhune Savings account with no minimum monthly balance for children who want to start building their financial future early.
Through our nonprofit partners, we also offer Individual Development Accounts (IDA). With IDAs, nonprofit organizations match funds that are deposited by the account holder. This wealth-building tool helps low- and moderate-income individuals achieve their goals by providing funds for life events such as a college education, starting a small business or saving toward homeownership.
ASB is proud to be the official banking partner of Partners in Development Foundation’s Keiki Assets Account, or “KAA”, an initiative to improve financial literacy and help Hawai‘i
families build wealth through education savings accounts for their keiki. ASB worked closely with Partners in Development on the design and launch of the program, and continues to provide technical support and financial literacy resources to the program’s coaches and participants.
To focus our giving efforts and ensure we are bringing real impact to our community in a meaningful way, ASB supports five Kahiau partners — Child and Family Service, Kapiolani Health Foundation, Kupu, Partners in Development Foundation and United Way chapters in Hawai‘i (Aloha United Way, Friendly Isle United Fund, Hawai‘i Island United Way, Kaua‘i United Way and Maui United Way)— through monetary and in-kind donations throughout the year.
The OCC recognized ASB’s “excellent responsiveness to the credit needs” of Hawai‘i residents and commented that the bank’s service delivery systems were “readily” or “reasonably accessible” to people of different income levels.
Left: ASB collaborated with one of its community partners, Kupu, to establish a food truck at ASB’s headquarters to provide fresh, healthy and convenient lunch options for the surrounding community and teammates.Introduction
HEI
Hawaiian Electric American Savings Bank
Thriving Economy
Thriving Customers
Thriving Communities
Thriving Employees
Thriving Environment
Pacific Current Appendix
Quantitative
At ASB, bringing real impact to our community means more than just giving financially. Our teammates generously give year-round of their time, “sweat equity,” best ideas and leadership to more than 180 nonprofit organizations across the state.
Our teammates raised more than $212,000 during our annual Kahiau Giving Campaign, ASB’s annual workplace donation campaign. Combined with ASB’s matching contribution of $150,000, ASB donated more than $360,000 to five of ASB’s Kahiau Partners.
A remarkable 93 percent of ASB teammates participated in our annual Kahiau Giving Campaign resulting in the largest Kahiau program donation since 2011. Through the hard work of our teammates, ASB has donated nearly 112,000 volunteer hours and millions of dollars to Hawai‘i’s nonprofits and community organizations, including more than $2.9 million raised through our Kahiau Giving Campaign since 2011.
For the eighth year in a row, ASB partnered with Helping Hands Hawai‘i to prepare Hawai‘i’s keiki for school through our Ready to Learn program. The month-long program encourages teammates, customers and community members to make a donation at any of our branches to ensure Hawai‘i’s low-income and homeless students receive the basic educational tools to start the school year off right and succeed in the classroom.
In 2022, through the Ready to Learn program, we distributed 1,300 backpacks filled with school supplies to Hawai‘i’s students.
$212,000+
Raised by Teammates During the 2022 Annual ASB Kahiau Giving Campaign
93%
Participation by ASB Teammates in the 2022 ASB Kahiau Giving Campaign
112,000
Volunteer Hours Donated to Hawai‘i’s Nonprofits and Community Organizations Since 2011
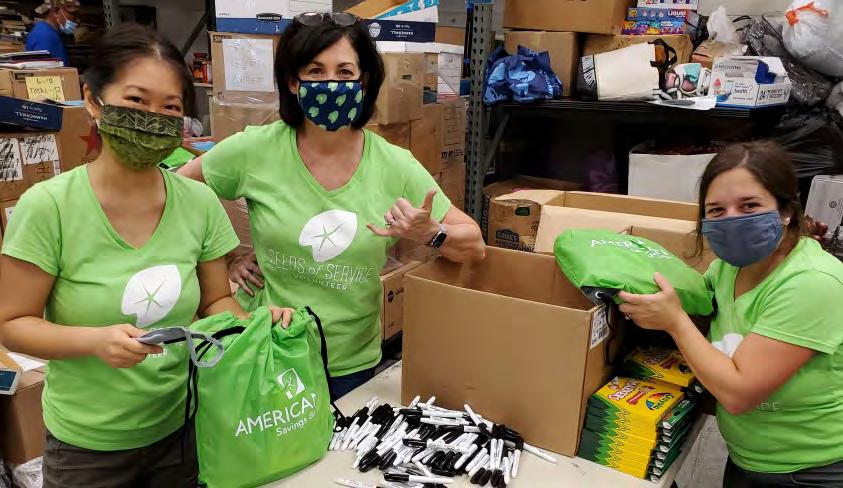
Left, Top: Nānākuli High and Intermediate School receives a $25,000 prize for ranking first place in ASB’s Bank for Education KeikiCo Contest.
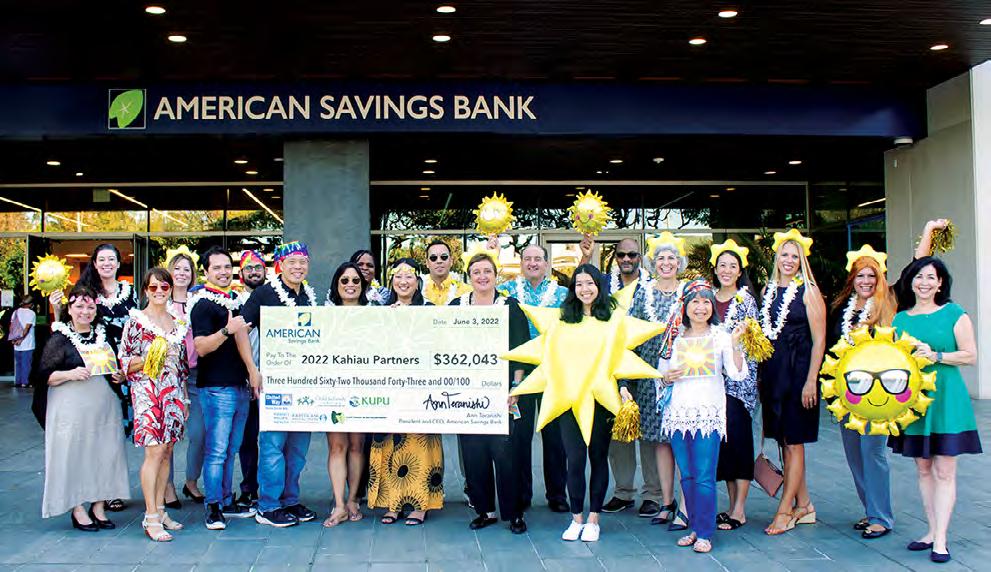
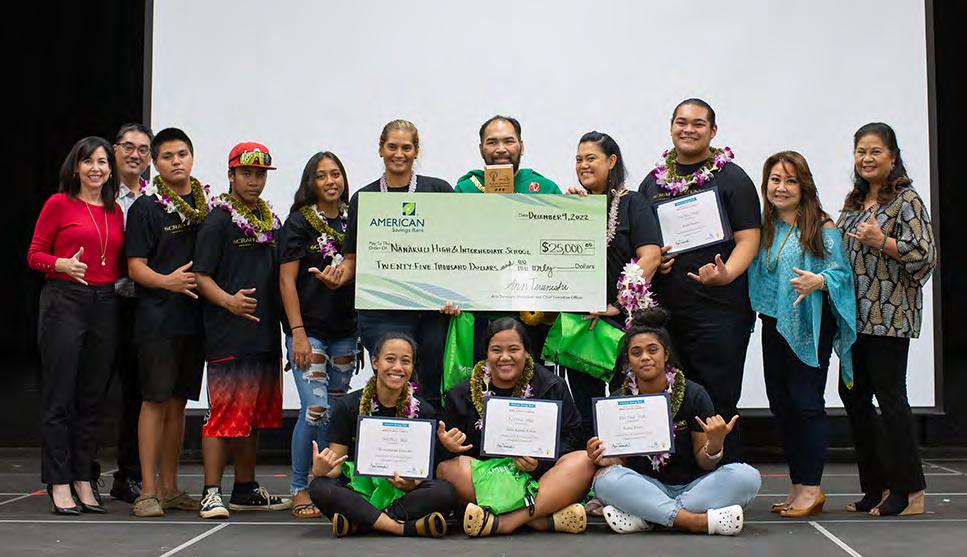
Left, Middle: Teammates pledged more than $212,000 to our Kahiau partners through our annual Kahiau Giving Campaign.
Left, Bottom: Teammates volunteered more than 112,000 community service hours through ASB's Seeds of Service program.
Introduction
HEI
ASB matches its excellent customer experience with an employee experience that has garnered dozens of local and national awards over the years. Our 1,100 teammates are unified by a common vision to help make dreams possible. We work hard to create a culture in which people feel welcome and want to come to work, motivated and empowered to reach their full potential, and are enthusiastic about helping others live their best life.
Ensuring our team members understand our vision and how their individual efforts contribute to our overall company goals is crucial to our success. We communicate frequently and hold people accountable for knowing our priorities and how we are tracking against them throughout the year to ensure everyone is aligned.
Best Places to Work
Hawaii Business Magazine
Our teammates are committed to making our customers’ dreams possible and we’re committed to doing the same for them. In addition to offering some of the best health and wellness benefits in the state, ASB provides numerous career advancement opportunities and benefits to support our valued teammates and their loved ones.
Hawaiian Electric American Savings Bank
Thriving Economy
Thriving Customers
Thriving Communities
Thriving Employees
Thriving Environment
Pacific Current Appendix
Quantitative
Throughout the year, ASB conducts employee engagement surveys as one way to collect feedback from our teammates on what we’re doing well and how we can improve their experience. Some of our programs have earned local and national awards, which we are always proud to receive since they are driven by teammate feedback. We invite feedback from all teammates twice a year through our Your Voice Matters Survey, to gain deeper insight on topics that contribute to engagement including clarity of direction, professional development, career opportunities, personal well-being and sense of belonging. Responses provide a road map of areas to focus and enhance our teammate experience.
Once our Human Resources and Organizational Development teams comb through results, they meet individually with team managers to discuss their results. To ensure everyone actively participates in making ASB a great place to work, managers host team meetings to share results and discuss ways to improve. These goals are entered into our survey action planning system and revisited throughout the year to keep engagement top of mind. As part of our annual Team Review process, managers provide updates and progress on their engagement plan.
The ultimate opportunity to collaborate came in 2019, when nearly 650 teammates from five separate locations across O‘ahu moved into our new 11-story, 373,000-square-foot ASB Campus in downtown Honolulu. The ASB Campus is the single biggest investment ASB has ever made in its teammates, customers and community. Designed to promote a culture of openness and efficiency, our campus puts collaboration at the forefront by incorporating it into every design element of the building.
Recognized by Great Place To Work®

In 2023, we were named one of the Best Places to Work in Hawai‘i by Hawai‘i Business Magazine for the 14th year in a row and recognized by Great Place to Work®, a global authority on workplace culture, employee experience and leadership.


ASB teammate views on working at ASB (results from 2022 Great Place to Work® survey)
86% of teammates say ASB is a great place to work (compared to a benchmark of 57% at a typical U.S.-based company)
96%
of teammates feel that they are treated fairly, regardless of their sexual orientation
93% of teammates say that when they join ASB, they are made to feel welcome
94% of teammates feel physically safe at ASB
92% of teammates feel good about the ways ASB contributes to the community
Introduction
HEI
We arm our bankers with the tools and training they need to make our customer’s dreams possible. Curriculum includes technical banker training programs that cover all aspects of banking laws, banking operations, new product and service offerings, legal and regulatory compliance, procedures and ethics. We also offer ongoing specialized courses for teammates in specific job functions to ensure they are kept abreast of all the current laws, regulations and industry trends.
In 2015, we launched our ASB Leadership Academy, a year-long program designed to give high-performing, high-potential team members a deeper understanding of leadership, professional skills and banking. In 2023, we’re kicking off our eighth Leadership Academy cohort. This group of ASB leaders meets once a month to experience engaging coursework, team-building exercises, interactive executive sessions and group/individual assignments. Many of the program graduates, including our current CEO and CFO, have gone on to assume greater responsibilities and leadership opportunities.
As part of our continued efforts to develop leaders and high performers, in 2020, ASB launched RISE, an intensive six-month program designed to help managers flourish in their roles. These teammates engage in learning through in-person sessions, mentor circles and a 360-degree feedback process, which helps prepare them for greater leadership roles.
Hawaiian Electric
American Savings Bank
Thriving Economy
Thriving Customers
Thriving Communities
Thriving Employees
Thriving Environment

Pacific Current Appendix
Quantitative
We provide a range of soft skills training, including emotional intelligence, change resilience, giving feedback, diversity and inclusion, and respect in the workplace.
To be a leader at ASB, teammates must complete our Leading the ASB Way course, which covers expectations for all managers and an annual leadership certification refresher course. We also provide monthly leadership training sessions open to all managers to help them sharpen their skills and lead their teams.
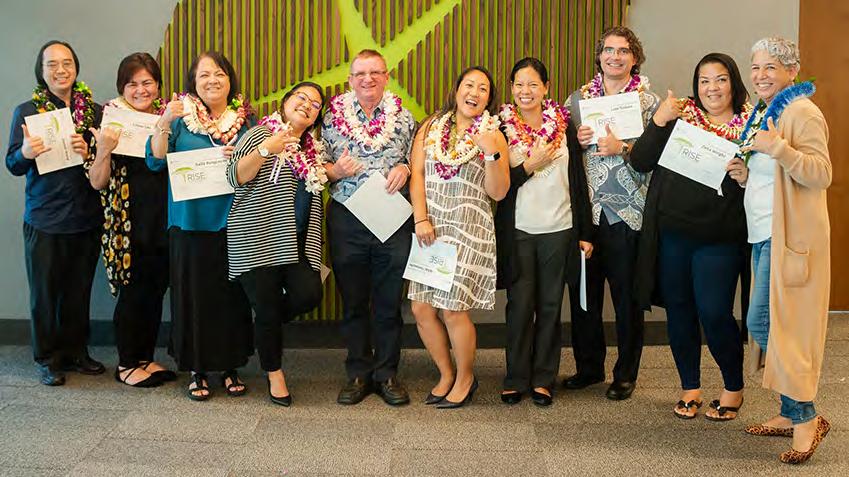
We host quarterly Leader Round-up sessions with team leaders to share key financial and business updates, engage them in strategic planning, request feedback and encourage relationship building and networking.
In 2022, ASB launched ASPIRE, a six-week leadership program designed for teammates who are eager for growth and career development and want to build leadership skills while influencing others in a positive way.

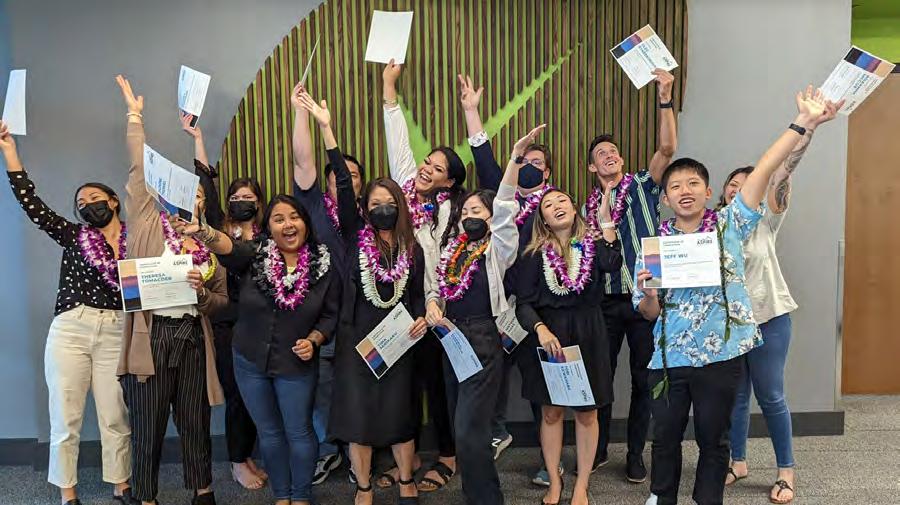
For teammates looking to “spark” their careers, we created the eight-week Ignite program, which allows participants to learn about self-leadership, accountability and values and to build confidence and credibility to create their own leadership pathway.
Each year, ASB selects teammates to attend the Pacific Coast Banking School, a three-year program that includes two-week resident sessions at the University of Washington’s Graduate School of Business and two years of written extension assignments. The curriculum is designed to provide graduate-level executive leadership, financial management education and valuable strategies to help tackle important banking issues.
Top: RISE graduates Above: ASPIRE CohortIntroduction
HEI
We pride ourselves on hiring talented individuals who share our commitment to take care of our customers, community and each other. Through our partnerships with Hawai‘i high schools, colleges, professional networks and community organizations, we have recruited hundreds of new teammates from the communities we serve.

We partner with Hawai‘i is Hiring, a one-stop resource from the Chamber of Commerce Hawai‘i that connects Hawai‘i residents to job opportunities, training programs and career navigation. We’ve also worked with the Economic Development Alliance of Hawai‘i to support the Aloha Connects Innovation program, which provides unemployed workers with new job opportunities to help set a course for a more sustainable, resilient Hawai‘i. Not only has this program helped many of the state’s displaced workers, it has also helped to diversify and strengthen our economy.
Hawaiian Electric American Savings Bank
Thriving Economy
Thriving Customers
Thriving Communities
Thriving Employees
Thriving Environment
Pacific Current Appendix
Quantitative
At ASB, we do not tolerate discrimination or harassment against our teammates by anyone, including fellow teammates, customers or suppliers. We expect our teammates and suppliers to comply with federal and state anti-discrimination laws and our Code of Conduct. We are committed to providing a work environment that is safe, dignified, productive and free of harassment and discrimination. We encourage any teammate who believes they are subjected to discrimination or harassment to report the conduct to a supervisor, anyone in the Legal or Human Resources teams or through EthicsPoint. We take all reports of discrimination or harassment seriously and all incidents are promptly investigated and appropriate action is taken.
We expect our managers to lead by example by fostering a culture of compliance and ethics and preventing Code of Conduct violations before they occur. We encourage all teammates to be role models for ethical behavior, engage in open communication, promptly respond to misconduct and maintain a safe and productive work culture.
We offer a generous Paid Parental Leave of 16 weeks of paid time off for teammates who are growing their family through the birth, adoption or foster of a child. Teammates may also be approved to return to work, following their 16 weeks of paid time off, at a reduced schedule with full pay for up to four additional weeks.
To ensure teammates are fairly compensated, we also annually review wages and conduct market comparisons to ensure our compensation is in line with — if not better than — what other employers in the financial services industry are offering. In 2023, we launched several new benefits including an increased 401(k) match and student loan repayment assistance.
ASB does not tolerate violence of any kind. If we suspect that a teammate may be subject to domestic violence or threats of violence, we make reasonable accommodations to remove the teammate from harm’s way by relocating the teammate, changing their contact information and implementing additional methods for their protection.
We will not engage with any suppliers who are known to violate child labor laws.
“We encourage all teammates to be role models for ethical behavior, engage in open communication, promptly respond to misconduct and maintain a safe and productive work culture.”
American Savings Bank is committed to creating a diverse, respectful and inclusive company for all teammates, customers and community members. We welcome and celebrate diversity in ideas, experiences, race, ethnicity, gender, age, disability, religion, sexual orientation and veteran status and do not tolerate discrimination or harassment. We truly believe this diversity provides a wealth of experiences and perspectives that inform our decision making, leads to the best results, is key in maintaining our great place to work culture and allows us to better connect with our diverse customers.
*Source: EEO-1 Survey Data
**Source: 2021 U.S. Census Bureau American Community Survey 1-Year Estimate
Last October, we once again demonstrated our support for the LGBTQIA+ community as a Visionary Sponsor for the Honolulu Pride Festival and Parade. We also rainbow-ed out our 11-story ASB Campus with colorful exterior building lights and decorated the front lawn with oversized illuminated “Aloha Wins” marquee letters flanked by hundreds of rainbow pinwheels.

ASB’s IDEAS (Inclusion, Diversity, Equity, Allyship and Safety) Council rallied more than 100 teammates to participate in the Honolulu Pride Parade by riding in our ASB Pride trolley and walking through Waikiki while handing out cool logo items. Thousands of community members stopped by our Pride Festival booth and were greeted by members of the council.
In 2022, ASB received Pacific Business News’ Business of Pride award, which celebrates individuals and companies in Hawai‘i that have contributed and supported diversity, inclusion and equity efforts in meaningful ways.
Since 2015, our ASB Women’s Network has been bringing together female teammates from across the company to discuss issues unique to women in the workplace. Participants help select topics of interest and meet quarterly to hear from guest speakers, develop new skills and build their network.
“Creating a workplace culture that is truly founded on diversity and inclusion involves looking at data, tracking it to see how you’re using it to make better decisions, changing your practices and behaviors, and creating a safe space for open, honest dialogue. I’m proud to work for a company where 65% of our teammates are women, 40% of our executives are women and 20% of executives identify as LGBTQIA+.”
BETH WHITEHEAD, EVP and Chief Administrative Officer at ASB
Introduction
HEI

As a company located in an island state that is home to 1,100 of our teammates, we have a responsibility to protect and care for our land and natural resources. We see the direct and societal benefits of having our own clean energy system and know how important it is to help our customers save on energy costs and reduce their impact on the environment.
In 2022, ASB originated over 270 new Clean Energy Loans totaling $12 million. We also acquired a portfolio of residential clean energy loans from another lender, valued at $115 million as of December 31, 2022. These loans allowed homeowners to purchase and install their own photovoltaic systems, solar water heaters, solar air conditioning and battery backup and storage. We work closely with local contractors to make financing easy for consumers. We offer financing for green purposes, such as electric transport, solar energy, storage and large-scale renewable energy systems.
$12 Million
Hawaiian Electric American Savings Bank
Thriving Economy
Thriving Customers
Thriving Communities
Thriving Employees
Thriving Environment
Pacific Current Appendix
Quantitative
We also financed over $65 million in commercial clean energy projects from 2010 to 2022, supporting a total of 21.30 MW in renewable energy capacity. From nonprofits to large commercial real estate and apartment buildings, we are equipped to help customers finance medium and large-scale clean energy improvements. The following are just a few examples:
GEMS. By partnering with the Hawai‘i Green Energy Market Securitization Program, ASB is able to provide customized financing options for commercial clients interested in clean energy improvements. Our tailored loan structures allow customers the time and flexibility they need to repay their outstanding loan balance, which means more local businesses can take advantage of energy efficiency opportunities.
Apartment and Multi-Family Owners’ Associations. We work with apartment associations and owners of multi-family dwellings to help bring energy efficiencies to buildings across the islands. While most of our projects have centered around solar installations, we help condo associations finance other improvements, such as energy efficient lighting, HVAC, building envelope and water heating projects.
Other. Recent commercial financing includes clean energy loans for non-profit customers, schools and both leased and owned commercial properties where our customers operate their businesses.
We also have opportunities to participate in tax credit programs, such as New Markets Tax Credits (NMTC), to help fund renewable energy and other projects in disadvantaged communities. Through a Hawai‘i-based community development entity formed in partnership with the Oahu Economic Development Board, we helped deploy over $100 million in NMTCs and plan to apply for future allocations. These allocations help bring new investments, services and jobs to some of the most underserved, low-income communities in our state and include direct investment in renewable energy projects in support of our state’s clean energy transition.
Introduction
HEI
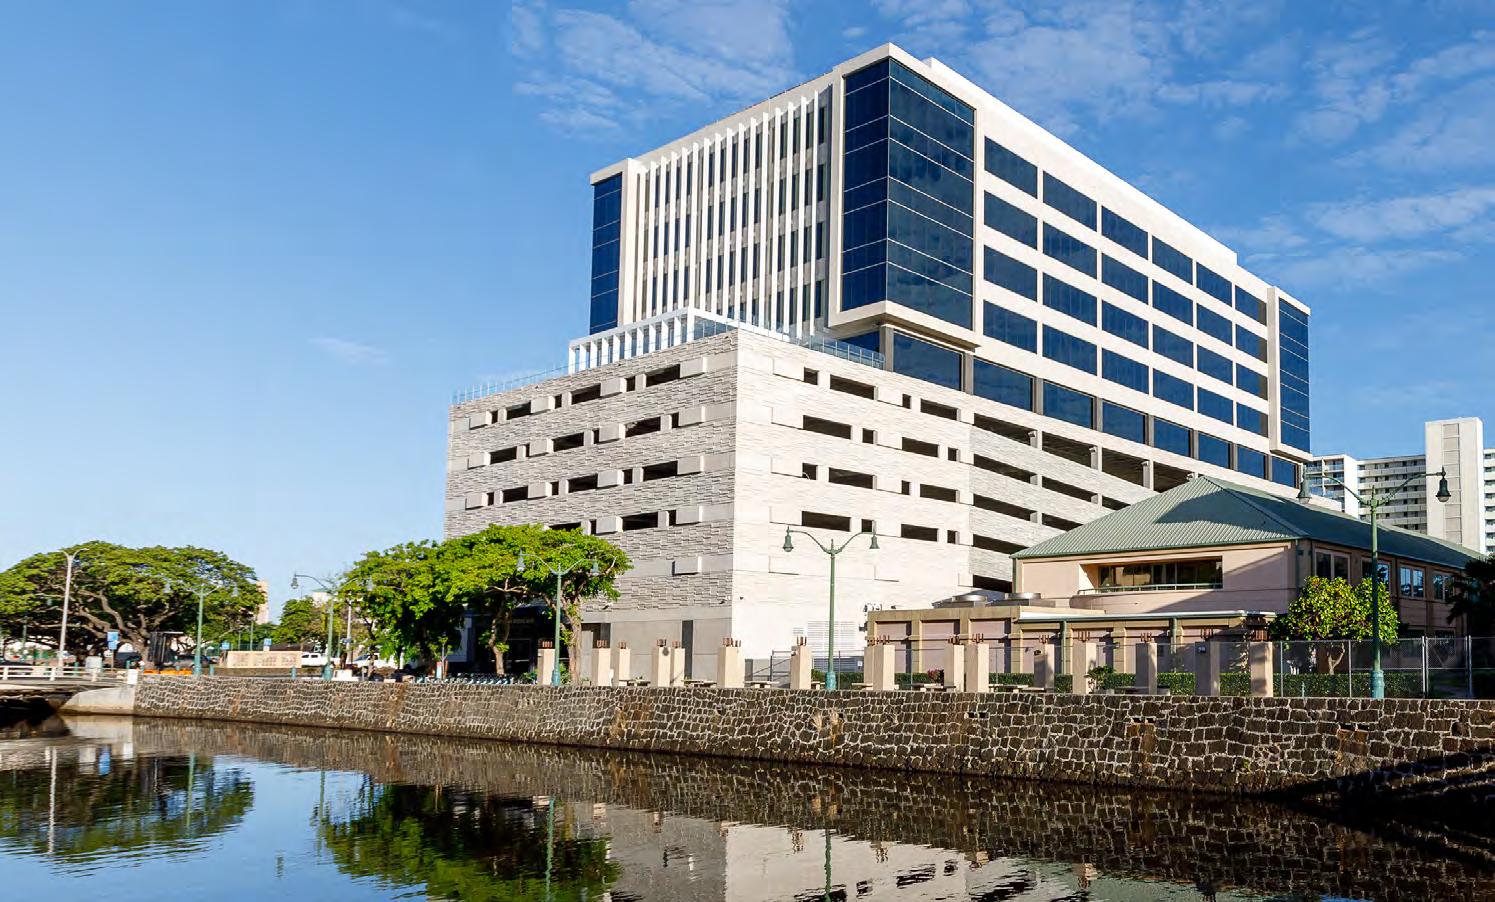
Our ASB Campus enabled us to bring more than 650 teammates who were once spread out across five different office locations across O‘ahu together under one roof. Our campus features some of the latest green technologies, including solar panels, electric vehicle charging stations, self-tinting windows, responsive LED lighting, water bottle filling stations and reclaimed wood furniture. We also used this opportunity to evaluate our work processes and committed to being as nearly paperless as possible.
We encourage our teammates to commute to work by carpool, mass transit, bike or other means — and reward those who do for their commitment to the environment. Teammates who participate in a carpool receive one free parking stall per group at our ASB Campus, plus a monthly stipend for each member of the carpool. Teammates who find other means of getting to work and don’t park at campus receive a generous monthly Green Benefit stipend, which can be used to cover expenses for alternate transportation or whatever else they choose.
Hawaiian Electric
American Savings Bank
Thriving Economy
Thriving Customers
Thriving Communities
Thriving Employees
Thriving Environment
Pacific Current Appendix
Quantitative
As we build or renovate our new locations, we are incorporating LED light fixtures and signage, self-tinting windows and low-flow water fixtures. For our existing branches, we have rolled out green initiatives and are retrofitting the facilities with sustainable features. These include installing LED light fixtures and low-flow water fixtures and implementing recycling programs. In addition to having a positive impact on the environment, these features reduce our energy and water use and positively impact our bottom line.
We regularly monitor our credit risk exposure in areas at risk of future sea-level rise. All new residential and commercial real estate loans must undergo an environmental due diligence review as part of the underwriting process, which analyzes whether the property is located in a floodplain, sensitive ecological area or on contaminated land. Owners of commercial and residential properties located within the Special Flood Hazard Area, as designated by the Federal Emergency Management Agency, must obtain flood insurance through the National Flood Insurance Program as a condition of obtaining a property loan. We also require mortgagors to obtain hazard and hurricane insurance on their residential properties.
“We encourage our teammates to commute to work by carpool, mass transit, bike or other means — and reward those who do for their commitment to the environment.”
Pacific Current advances our common purpose through its focus on catalyzing Hawai‘i’s transition to a zero-carbon footprint, self-sufficiency and resiliency.

Introduction
HEI Hawaiian Electric American Savings Bank Pacific Current Appendix
Quantitative
In 2022, Pacific Current acquired a ~7 MW closed loop bio-mass plant on Kauai and completed construction on the University of Hawai‘i’s fifth solar + storage project at Honolulu Community College, growing its renewable asset portfolio and contributing to progress toward achievement of Hawai‘i’s climate goals. In addition, Pacific Current continued to deploy electric vehicle charging systems for multi-unit dwellings, expanding charging options for electric vehicle owners and supporting the state’s transportation decarbonization goals.
Customer-sited renewable resources will play a critical role in reaching Hawai‘i’s 2045 clean energy goals as a complement to utility-scale solar projects. Pacific Current pursues development of and investment in customer-sited renewable energy systems. We install, own and maintain power generation systems and make clean energy available under PPAs without the customer needing to bear the upfront capital improvement costs.
Reliability and resilience are critical given the increased frequency and severity of weather events and risk of sea-level rise. A number of Pacific Current’s “behind the meter” projects incorporate battery energy storage systems. These systems provide our customers additional resiliency and the ability to optimize their energy usage.
Across industries, new technologies are shifting the nature of work. The emergence of cost-effective renewables is playing a major role in this disruption, creating new demand for workers in clean energy — which includes renewable energy, energy efficiency, grid modernization, storage, clean fuels and zero-emission vehicles. On average, workers in the “clean energy” sector earn 25% more than the national median wage. Pacific Current’s projects and asset portfolio drive employment of these types of skilled jobs, which can help drive economic growth and prosperity. In doing so, we strive to encourage people who call Hawai‘i home to remain in Hawai‘i, and also entice people who left Hawai‘i for other opportunities to consider returning to the state.
Our projects often involve no upfront cost and result in reduced operating expenses for our customers. Examples of affordable customer solutions we deploy include solar + storage, onsite wastewater treatment, anaerobic digestion and renewable natural gas combined heat and power. Moreover, we seek to provide these solutions to segments of the community that have been traditionally underrepresented or hard to reach. One example of this is our Koa‘e Workforce Housing
Pacific Current’s portfolio includes ~80 MW in operating facilities in Hawai‘i, including:
~60 MW
Combined Cycle Plant on Hawai‘i Island, Operating One-Third on Biodiesel
~7 MW
Biomass Plant on Kaua‘i
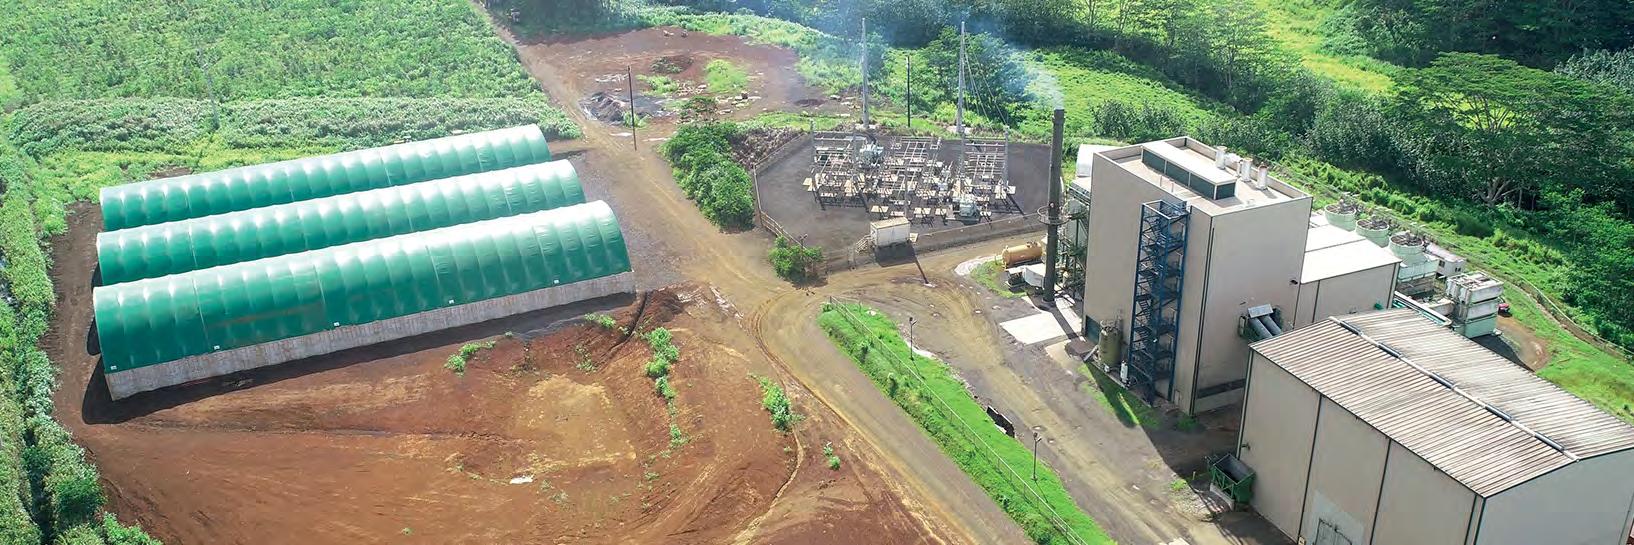
~6.5 MW
In Solar Plants on Kaua‘i and O‘ahu
~7 MW / ~38 MWh
Of Solar and Battery Storage Facilities on O‘ahu and Maui
solar plus battery energy storage project on Kaua‘i Island.Introduction
HEI
As an investor, owner and manager of long-term infrastructure assets, Pacific Current is committed to the communities we serve. To build a relationship of trust with community stakeholders, we proactively provide information on our projects and ensure open, continuous communication. In support of our community, we have proudly contributed to vital initiatives that provide access to education, workforce training and food to populations in need. Pacific Current team members also serve on several local non-profit boards, where we are helping our communities become more resilient and prosperous.
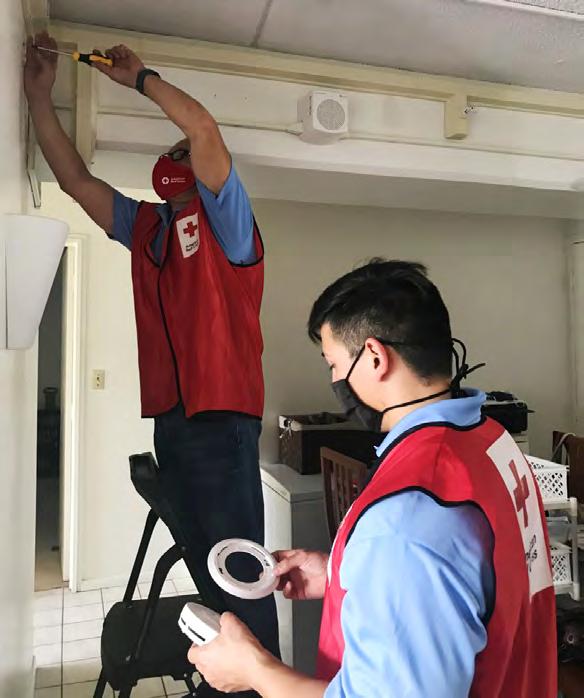
Employee engagement is a critical factor for Pacific Current. We operate with a small, tight-knit team and strive to have our employees be passionate, energetic and committed to our work and our mission. We accomplish that by maintaining a culture of openness and diversity, and by supporting employees’ ability to achieve work-life balance and pursue both personal and professional goals by offering flexible work schedules and competitive compensation and benefits.
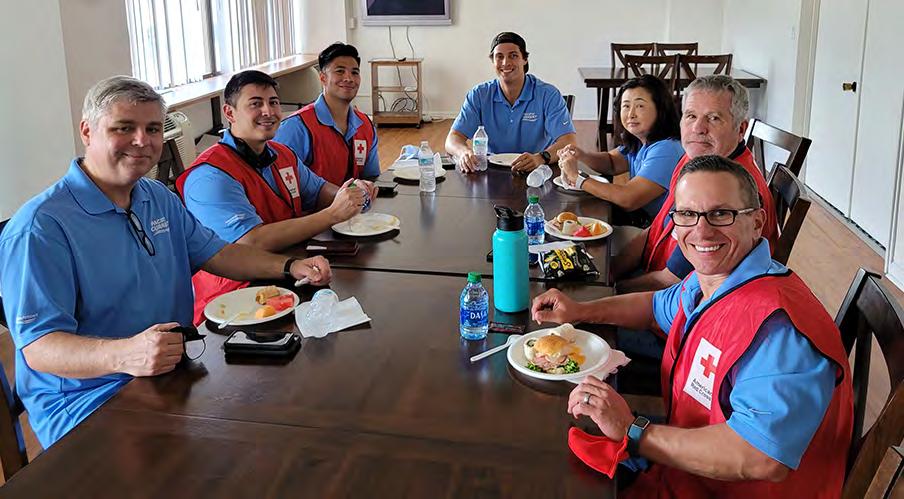
Hawaiian Electric American Savings Bank
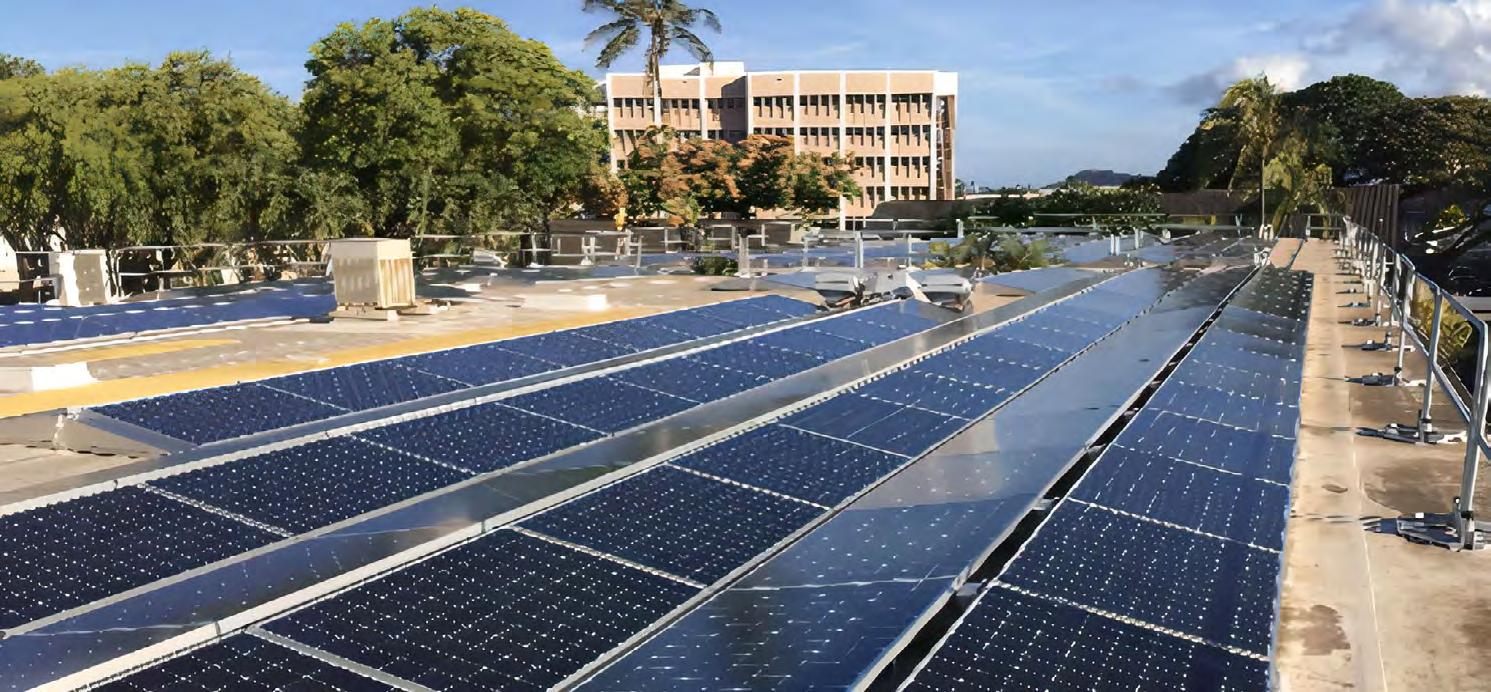
Pacific Current
Appendix
Quantitative
Pacific Current supports employment policies that ensure fair labor practices and a culture of openness and diversity. We believe that our differences not only make us each uniquely special, but also make us collectively stronger, more collaborative and able to make better long-term decisions. Several examples of this in practice are Pacific Current’s policies to help its employees achieve work-life balance and pursue personal family goals (e.g., paid maternity and family leave and generous PTO).
Left: Members of the Pacific Current team participated in a volunteer activity at the American Red Cross “Sound the Alarm” event. Above: In 2022, Pacific Current completed construction on a solar + storage project at Honolulu Community College“In support of our community, we have proudly contributed to vital initiatives that provide access to education, workforce training and food to populations in need."

HEI
Scope Categories
1 Stationary Combustion For all power plant fuel combustion, associated emissions were estimated using factors including fuel carbon content, measured/default heating values, and default emissions factors.
1 Mobile Combustion
1 The 32% RPS achievement in 2022 is based on a new RPS calculation that became effective in July 2022 pursuant to Hawai‘i law. Under the calculation in place prior to July 2022, the 2022 RPS achievement would have been 39%.
2 Based on most recent calculation at the time of publication, which differs slightly from the percentage (99.8%) referenced in the 2022 Annual Report
3 Pathways analysis covered the islands served by Hawaiian Electric, and thus excluded the island of Kaua‘i.
4 https://www.nrel.gov/docs/fy22osti/82854.pdf
1 SF 6 Fugitives
1-2 Fugitives
2 Purchased Electricity
Fuel consumption data was used to estimate CO2 emissions, vehicle mileage data was used to estimate CH4 and N2O emissions.
O‘ahu: As reported in accordance with 40 Code of Federal Regulations (CFR) Part 98 Mandatory Greenhouse Gas Reporting, Subpart DD Electrical Transmission and Distribution Equipment Use Report and Global Warming Potential from the UN IPCC AR4. Maui County and Hawai‘i Island: Excluded from this analysis, expected to be included in future reports.
Associated emissions were calculated per Greenhouse Gas Protocol guidance, estimating an upper bound refrigerant leakage rate that is 10% of the total HVAC unit capacity. Office square footage was also used to estimate HVAC capacity.
Associated emissions were calculated per EPA guidance using office space electricity consumption and EPA region-specific emissions factors. Location-based method.
3 Purchased Electricity for Resale Supplier-specific approach using site-specific data and Environmental Protection Agency (EPA) Facility Level Information on GreenHouse gases Tool (FLIGHT) database. Assumes all purchased electricity was re-sold.
3 Stationary Fuel Supplier-specific method; includes upstream, midstream & transportation emissions for all fuel types w/ exception of propane.
3 Mobile Fuel Supplier-specific method; includes upstream & midstream emissions for biodiesel and clear diesel.
3 Business Travel Spend-based method in which business travel spend is used to estimate emissions.
Hawaiian Electric American Savings Bank
Pacific Current Appendix
Quantitative
3 Employee Commuting Data for 2021 and earlier is based on average (national) data on commuting patterns, adjusting for remote work percentages. 2022 data was calculated using Hawai‘i-specific commuting patterns. This Hawai‘i-specific data was derived by calculating estimated commute distances of 1,000+ ASB employees, based on anonymized ZIP codes.
CO2e figures have been calculated using global warming potentials from the UN IPCC 4th Assessment Report (AR4), consistent with environmental regulatory reporting.
Sources of emissions factors used in analysis include:
UN IPCC AR4
EPA Center for Corporate Climate Leadership
EPA eGRID
EPA Inventory of US Greenhouse Gas Emissions
EPA US Environmentally-Extended Input-Output Models
The Climate Registry
Analysis from Par Refinery, Pacific Biodiesel, and ecoinvent
5 Hawai‘i Greenhouse Gas Emissions Report for 2016: Final Report
6 As of January 2022.
7 Integrated Grid Planning Forecast.
8 https://www.lung.org/getmedia/74b3d3d3-88d1-4335-95d8-c4e47d0282c1/sota-2022
9 https://www.bea.gov/news/2022/real-personal-consumption-expenditures-state-and-real-personal-income-state-and
10 However Hawai‘i’s average residential electricity bills are helped by lower-than-average electricity usage. Based on 2020 average annual esidential customer kWh sales data from the U.S. Energy Information Administration, the average Hawai‘i home used 40% less electricity than the national average.
11 Racially diverse defined as all races/ethnicities that are not ‘White.’
12 Executives includes EEO-1 category 1.1 - Executive/Sr. Level Officials
13 Leaders includes EEO-1 category 1.2 First/Mid-Level Officials
14 All Workforce includes EEO-1 categories 1.1 - Executive/Sr. Level Officials, 1.2 - First/Mid-Level Officials, 2 - Professionals, 3 - Technicians, 4 - Sales Workers, 5 - Administrative Support Workers, 6 - Craft Workers, 7 - Operatives, 8 - Laborers and Helpers, 9 - Service Workers
15 Racially diverse defined as all races/ethnicities that are not ‘White.’
16 Executives includes EEO-1 category 1.1 - Executive/Sr. Level Officials
17 Leaders includes EEO-1 category 1.2 First/Mid-Level Officials
18 All Workforce includes EEO-1 categories 1.1 - Executive/Sr. Level Officials, 1.2 - First/Mid-Level Officials, 2 - Professionals, 3 - Technicians, 4 - Sales Workers, 5 - Administrative Support Workers, 6 - Craft Workers, 7 - Operatives, 8 - Laborers and Helpers, 9 - Service Workers

Number of: (1) residential, (2) commercial, and (3) industrial customers served
Total electricity delivered to: (1) residential, (2) commercial, (3) industrial, (4) all other retail customers, and (5) wholesale customers 1
All of the electricity generation listed above is in a regulated market
This metric is not applicable to Hawai‘i, as Hawai‘i does not have a wholesale electricity market. Hawaiian Electric purchases energy directly from independent power producers (IPPs). The information regarding the amount of MWh purchased from IPPs can be found in footnote 2 to table IF-EU-000.D (see below).
1 Minor methodology differences regarding renewable components of certain generators and timing of underlying reporting account for differences between the SASB and EEI ESG reported metrics and the Form 10-K.
3 2020 generation amount reflects the fact that the Puna Geothermal Venture (PGV) plant was out of service from May 2018 until late 2020.
Key:
AES = AES Hawai‘i
CIP = Campbell Industrial Park Generating Station
DOH = State of Hawai‘i Department of Health
Hamakua Energy = owned by Pacific Current
HAR = Hawai‘i Administrative Rules
KPLP = Kalaeloa Partners
PGV = Puna Geothermal Venture
Hawaiian Electric’s greenhouse gas (GHG) emissions from power generation (stationary combustion) are calculated using fuel consumption data (collected by fuel meters, fuel purchase receipts, tank gauging), carbon content in fuel (determined by laboratory analysis), default emission factors from 40 CFR Part 98 Subpart C, and Global Warming Potentials (GWPs) from the Intergovernmental Panel on Climate Change (IPCC) Fourth Assessment Report (AR4). Hawaiian Electric’s GHG emissions from its mobile fleet (mobile combustion) are calculated using fuel consumption data, vehicle mileage, and emission factors from the EPA Center for Corporate Climate Leadership. Three (HFCs, PFCs and NF3 of seven GHGs under the Kyoto Protocol are not generated by Hawaiian Electric. The GHG emissions presented below exclude biodiesel CO2 emissions and include biodiesel CH4 and N2O, which is consistent with the State of Hawai‘i’s GHG Emissions regulations (HAR, Title 11, Chapter 60.1, Subchapter 11), in which biodiesel is assumed to be 100% plant-based and to not include any fossil fuels. Disclosures are aligned with regulatory reporting and exclude emissions from units and emergency generators not under covered source permits, which represent 0.05% of total GHGs.
Introduction
HEI
Hawaiian Electric American Savings Bank
Pacific Current Appendix
Quantitative
SASB – Hawaiian Electric SASB – American Savings Bank
EEI ESG Metrics
See page 13 for details of our GHG emissions inventory by emissions scope.
Percentage of gross global Scope 1 emissions covered under emissions-limiting regulations IF-EU-110a.1
Under the State of Hawai‘i Act 234 and HAR Title 11 Chapter 60.1, Subchapter 11 — Greenhouse gas (GHG) emission regulations, Hawaiian Electric and GHG Emission Reduction Plan (ERP) partners (AES, KPLP, and Hamakua Energy) were required to reduce GHG emissions by 16% below partnership’s cumulative 2010 emission levels by 2020, achieved a 23% reduction in 2020, and continued to meet this reduction requirement through 2022.
Under the covered source permit for the Schofield Generating Station, emissions of CO generated from the facility are limited to 1,700 Ib/MWhe, gross, on a 12-month rolling average basis. In 2022, Hawaiian Electric reported 1,340 lb/MWhe of CO emissions on a 12-month rolling average basis, or equivalent to 79% of the permit limit. The covered source permit allows use of diesel, biodiesel and natural gas as fuels. The CO2 limit applies to emissions from burning any of these fuels, including biogenic and non-biogenic emissions.
Percentages in the table below represent the GHG emissions affected by emissions limitations divided by total gross global Scope 1 emissions.
PERCENTAGE OF SCOPE 1 EMISSIONS COVERED UNDER EMISSIONS-LIMITING REGULATIONS 2015, 2019 THROUGH 2021
1 Includes CO²e emissions from Hawaiian Electric power generation facilities and mobile fleet (mobile combustion) on O‘ahu, Maui County and Hawai‘i Island and its O‘ahu transmission and distribution (T&D) sulfur hexafluoride (SF6 emissions from gas insulated equipment. Excludes biogenic CO² emissions. Maui County and Hawai‘i T&D SF emissions will be included in future HEI ESG reports.
2 Intensities in g/kWh are calculated by dividing Scope 1 emissions by total Hawaiian Electric owned generation.
1 Calculated as the total amount of gross global Scope 1 GHG emissions (CO²e) that are covered under emissions limiting-based regulations divided by the total amount of gross global Scope 1 GHG emissions (CO²e).
Introduction
HEI
Hawaiian Electric American Savings Bank
Pacific Current Appendix
Quantitative
SASB – Hawaiian Electric SASB – American Savings Bank
EEI ESG Metrics
Percentage of gross global Scope 1 emissions covered under emissions-reporting regulations
Under the EPA GHG Mandatory Reporting Program, an emissions-reporting based regulation that requires disclosure of GHG emissions data, Hawaiian Electric has provided its data annually since 2011, starting with reporting year 2010 data, for facilities that emit 25,000 metric tons or more of CO2e, not including biogenic CO2
The State of Hawai‘i DOH requires all covered source facilities to report GHG emissions annually for the purpose of emissions fees in accordance with HAR, Title 11, Chapter 60.1, Subchapter 6. The emissions fees are assessed following the fee schedule set forth by the DOH.
Percentages in the table below represent the GHG emissions reported under the EPA GHG Mandatory Reporting Program divided by the total gross global Scope 1 emissions.
PERCENTAGE OF SCOPE 1 EMISSIONS COVERED UNDER EMISSIONS-REPORTING REGULATIONS 2015, 2020 THROUGH 2022
The GHG emissions presented below are total GHG emissions reported from Hawaiian Electric generation, transmission, distribution, and IPPs. Hawaiian Electric transmission and distribution operations do not generate HFC, PFC and NF3 emissions, three of the seven GHGs under the Kyoto Protocol. Disclosures are aligned with regulatory reporting.
GHG EMISSIONS ASSOCIATED WITH POWER DELIVERIES IN METRIC TONS CO2E1
Discussion of long-term and short-term strategy or plan to manage Scope 1 emissions, emissions reduction targets, and an analysis of performance against those targets
Please see discussion on pages 32-38 of this report.
(1) Number of customers served in markets subject to renewable portfolio standards (RPS) and (2) percentage fulfillment of RPS target by market
Hawaiian Electric provides electricity to 95% of the population of the State of Hawai‘i. Our service territory includes the islands of O‘ahu, Maui, Moloka‘i, Lāna‘i and Hawai‘i Island. Across our service territory, we had a total of 469,988 customers as of 12/31/22. As our entire service territory is in Hawai‘i, 100% of our customers are served in markets subject to our state’s renewable portfolio standard (RPS) law. (Note: Kaua‘i is served by the Kaua‘i Island Utility Cooperative.)
The State of Hawai‘i’s RPS law is one of the most aggressive in the nation, targeting 100% RPS by 2045, with interim goals of 30% by 2020, 40% by 2030 and 70% by 2040. In 2022 we achieved a consolidated RPS of 32%.
For more discussion on RPS, please refer to pages 23-24 of this report.
1 Calculated as the total amount of gross global Scope 1 GHG emissions (CO²e) that are covered under emissions reporting-based regulations divided by the total amount of gross global Scope 1 GHG emissions (CO²e).
1 Final data for 2022 for IPPs are not yet available at EPA FLIGHT. 2022 emissions data for IPPs are estimated using 2021 emissions intensity from emissions data published in EPA FLIGHT and the generation supplied to Hawaiian Electric. 2021 IPP data has been updated to reflect final data at EPA FLIGHT.
The Environmental Division monitors and reports emissions in accordance with applicable environmental regulations, which include certain emissions from stationary sources covered under Hawaiian Electric’s Covered Source Permits. The following air quality data does not include emissions from IPPs.
Air emissions from NO X , excluding N 2 O
TOTAL NO X EMISSIONS FOR HAWAIIAN ELECTRIC GENERATING FACILITIES FOR 2015, 2020 THROUGH 2022
TOTAL LEAD EMISSIONS FROM HAWAIIAN ELECTRIC GENERATING FACILITIES
IF-EU-120a.1
The lead emissions presented above are consolidated for all the company’s covered source facilities. Lead emissions trend in proportion to fuel consumption and electric generation. Lead emissions are calculated and reported to the DOH to comply with the annual emissions fees requirement.
TOTAL MERCURY EMISSIONS FROM HAWAIIAN ELECTRIC GENERATING FACILITIES
Air emissions from SO X
IF-EU-120a.1
The emissions of SOX from conventional combustion systems are predominantly in the form of sulfur dioxide (SO2). According to the EPA, SO2 is the component of greatest concern and is used as the indicator for the larger group of gaseous sulfur oxides (SOX).
Hawaiian Electric monitors and reports SO2 as required by the company’s covered source permits and applicable regulations. We conservatively calculate SO2 emissions with the assumption that 100% of sulfur in fuel converts into SO2 using mass balance. Consistent with EPA’s statement, SO2 emissions alone are sufficient to demonstrate the level of SOX emissions from company-wide facilities.
SO2 emissions are calculated based on fuel consumption and sulfur content in fuel. SO2 emissions generated from the company’s covered source facilities are calculated and reported to the DOH to meet the annual emissions fees requirement.
TOTAL SO 2 EMISSIONS FROM HAWAIIAN ELECTRIC GENERATING FACILITIES FOR 2015, 2020 THROUGH 2022
Percentage of each pollutant (NO X , SO X , PM 10 , Pb, Hg) in or near areas of dense population IF-EU-120a.1
SASB defines an "area of dense population” as “an area with a densely settled core and contiguous territory that together have a minimum population of 50,000.” It considers a facility to be "near” such an area if it is within 49 km of the area of dense population. Hawaiian Electric’s facilities on O‘ahu, Maui, and Lāna‘i meet the criteria of facilities that are within 49 km of an area with a minimum population of 50,000 persons. The assessment of population follows the list of urbanized areas based on U.S. Census results from 2010, available in Federal Register, Vol. 77, No. 59, Part IV.
The data in the table below represents the percentage of pollutants generated from Hawaiian Electric facilities on O‘ahu, Maui County and Hawai‘i Island that were released in or near densely populated areas.
Hawaiian Electric operates in compliance with the requirements of multiple federal and state environmental regulations, including numerous rules under the Clean Air Act.
Air emissions from Particulate Matter (PM 10 )
TOTAL PM10 EMISSIONS FROM HAWAIIAN ELECTRIC GENERATING FACILITIES FOR 2015, 2020 THROUGH 2022
IF-EU 120a.1
The PM10 emissions presented above are consolidated PM10 emissions for all of the company’s covered source facilities. Historically, more than half of the company’s PM10 emissions come from Kahe and Waiau generating stations on O‘ahu. Emissions from Kahe and Waiau are measured using a combination of source testing and PM Continuous Emissions Monitoring System (“CEMS”). In 2020-2022, the PM10 emission rates recorded from Kahe and Waiau boilers were generally lower than 2015 due to better quality fuel, containing lower carbon residue. The boilers at the two plants are the only generating units subject to a PM limit (MATS) and the company has been demonstrating compliance with the MATS PM limit. PM10 emissions generated from other facilities are calculated and reported to the DOH to comply with the annual emissions fees requirement.
1 As reported to the EPA in the Toxics Release Inventory (TRI) report, and only includes facilities that exceed the TRI reporting threshold. Since 2014, only Kahe triggered the reporting threshold. 2022 data is not yet available.
2 As reported in the annual emission fees report to the DOH Clean Air Branch (CAB) for the purpose of assessing emission fees. Mercury is not used in the fees assessment, but the mercury emissions are reported to the DOH as part of the emissions fees report.
3 The mercury emissions presented above are consolidated for all of the company’s covered source facilities. Mercury emissions are proportional to fuel consumption and electric generation. Mercury emissions are calculated and reported to the DOH annually as required to meet the emissions reporting requirement.
Total water withdrawn from all sources
HAWAIIAN ELECTRIC WATER WITHDRAWAL IN THOUSAND CUBIC METERS (M³ X 10³)
IF-EU-140a.1
Description of water management risks and discussion of strategies and practices to mitigate those risks
IF-EU-140a.3
Hawaiian Electric uses mainly non-potable water sources for generation operations and complies with regulations to manage water withdrawals and discharges through applicable permits, such as the National Pollutant Discharge Elimination System (NPDES) and Underground Injection Controls (UIC). In general, approximately 94% of the water used came from non-potable sources such as the ocean and brackish water wells. At Kahe Power Plant and Campbell Industrial Park Generating Station in West O‘ahu, reclaimed water from sewage treatment plants was used. The use of these non-potable water sources offsets the demand for higher-quality water and reduces water supply risk.
Over 99% of the water we use at our facilities (in once through cooling systems) is later returned to groundwater or surface water. The less than 1% of the water consumed during power generation is primarily used in air emissions control systems and is not from fresh water or sea water sources.
Total water consumed 2
HAWAIIAN ELECTRIC WATER CONSUMPTION IN THOUSAND CUBIC METERS (M³ X 10³)
IF-EU-140a.1
Amount of coal combustion residuals (CCR) generated, percentage recycled
IF-EU-150a.1
Percentage of (i) water withdrawn and (ii) water consumed in regions with high or extremely high baseline water stress
Degree of water stress is defined using the World Resources Institute’s Aqueduct Water Risk Atlas
IF-EU-140a.1
Hawaiian Electric does not operate any facilities in regions with high or extremely high baseline water risk according to the “World Resources Institute Water Risk Atlas Tool, Aqueduct.” Thus, the percentage of water withdrawn and water consumed in regions with high or extremely high baseline water stress is zero.
Number of incidents of non-compliance associated with water quantity and/or quality permits, standards and regulations
IF-EU-140a.2
In 2022, there were no water-related incidents of non-compliance that resulted in a formal enforcement action by the State of Hawai‘i Department of Health, the U. S. EPA or other regulatory agency.
The company operates five facilities with Clean Water Act, National Pollutant Discharge Elimination System (NPDES) permits (Kahe, Waiau, Honolulu, Kahului and Mā‘alaea).
The company operates five facilities with Safe Drinking Water Act, Underground Injection Control (UIC) Permits for industrial discharges (CIP, Mā‘alaea, Keāhole, Hill and Puna).
The company’s Compliance Task Manager (CTM) program is utilized for management and tracking compliance with permit requirements and associated associated activities.
Hawaiian Electric does not operate any coal-fired power plants and therefore we do not generate any hazardous coal ash. The only generation facility in our service territory that used coal in 2022 was owned and operated by a third-party independent power producer (IPP) that generated and sold power to Hawaiian Electric under a power purchase agreement (PPA). The PPA for that plant expired in September 2022, upon which time there was no more coal generation on our system. In 2022, the IPP’s coal plant provided 6.5% of our total electricity generated.
Average electric rate for residential, (i) commercial and (ii) industrial customers IF-EU-240a.1
2022 AVERAGE RATES IN CENTS / PER KWH FOR RESIDENTIAL, COMMERCIAL AND INDUSTRIAL CUSTOMERS
1 Reclaimed water is used for NO emissions control and make-up water for the Kahe and CIP generating units. Reclaimed water used for emissions control is lost through evaporation and the majority of the reclaimed water withdrawn is returned to the ocean or groundwater.
2 Water use data updated to align with SASB definitions.
HEI Hawaiian Electric American Savings Bank Pacific Current Appendix Quantitative SASB – Hawaiian Electric SASB – American Savings Bank EEI ESG Metrics
Typical monthly electric bill for residential customers for the first 500 kWh of electricity delivered / month
2020, 2021, AND 2022 SCHEDULE R, 500 k Wh
IF-EU-240a.2
(1) Total recordable incident rate (TRIR), (2) fatality rate and (3) near miss frequency rate (NMFR)
Typical monthly electric bill for residential customers for the first 1000 kWh of electricity delivered / month
2020, 2021, AND 2022 SCHEDULE R, 1000 k Wh
IF-EU-240a.2
Number of residential customer electric disconnections for non-payment and percentage reconnected within 30 days
2022 RESIDENTIAL NON-PAY RECONNECTS
IF-EU-240a.3
For more discussion on the company’s nonpayment programs and bill relief, please refer to “Helping customers manage their usage and bills” on page 42 this report.
Discussion of impact of external factors on customer affordability of electricity, including the economic conditions of the service territory
IF-EU-240a.4
The affordability of energy is critical to Hawai‘i’s sustainable, clean energy future. We’re committed to providing affordable electricity for all of our customers. See discussion beginning on page 41 regarding factors that impact cost of electricity in Hawai‘i and ways that we are working to reduce costs.
HEI
Percentage of electric utility revenues from rate structures that are decoupled
Number of incidents of non-compliance with physical and/or cybersecurity standards or regulations
IF-EU-420a.1
Total Electric Utility Revenues include revenue items that are not included in Target Revenues and are collected through other recovery mechanisms, such as fuel and purchased power expenses (recovered through the Energy Cost Recovery Clause and the Purchased Power Adjustment Clause), demand side management and demand response programs (recovered through the IRP Cost Recovery and Renewable Energy Infrastructure Program surcharges) and revenue taxes. A small portion of Total Electric Utility Revenues consists of “other operating revenues” that are not directly from electricity sales and that represent Customer Service establishment fees, field collection charges, returned payment charges, late payment charges, rental income from utility property, including land, pole attachments and parking fees. On a consolidated basis for Hawaiian Electric, Hawai‘i Electric Light and Maui Electric, such “other operating revenues” were $26.4 million in 2020, $32.1 million in 2021 and $42.3 million in 2022.
To date, there have been no material incidents, violations, or fines due to non-compliance with cybersecurity and privacy standards or regulations.
See page 45 for additional discussion on cybersecurity.
System Average Interruption Duration Index (SAIDI)
SAIDI — GENERATION, TRANSMISSION, AND DISTRIBUTION INTERRUPTIONS (MINUTES)
See pages 44-45 for additional discussion on grid reliability and resilience.
System Average Interruption Frequency Index (SAIFI) IF-EU-550a.2
SAIFI — GENERATION, TRANSMISSION, AND DISTRIBUTION INTERRUPTIONS
Electric American Savings Bank
Current Appendix Quantitative
– Hawaiian Electric SASB – American Savings Bank
EEI ESG Metrics
The company technically does not have a lost revenue adjustment mechanism. However, revenue losses that result from customer participation in the company’s distributed generation rate tariffs (net energy metering, customer grid supply, customer self-supply, smart export) are recovered through the decoupling mechanism (because participation in these tariffs can lower actual revenues versus the target revenue).
Percentage of electric load served by smart grid technology
IF-EU-420a.2
In 2019, we launched Phase 1 of our grid modernization effort, which included a critical implementation piece — the installation of advanced meters at homes and businesses. Through the end of 2022, Hawaiian Electric has deployed 193,000 advanced meters across O‘ahu, Maui, and Hawai‘i Island, representing 41% of all customers. Advanced meters will aid in allowing more renewables to be added to the grid and enable customers to participate in energy programs such as private rooftop solar, demand response, and time-of-use rates. Additional technical upgrades will help build a more reliable and resilient grid.
See page 38 for additional discussion on grid modernization.
Customer electricity savings from efficiency measures, by market
IF-EU-420a.3
By Hawai‘i law, since 2009, the energy efficiency programs for the state are managed by a third-party administrator known as Hawai‘i Energy and selected by the Hawai‘i Public Utilities Commission. For more information about Hawai‘i Energy, visit www.hawaiienergy.com
Emergency
Hawaiian Electric does not have any nuclear facilities.
See pages 44-45 for additional discussion on grid reliability and resilience.
Customer Average Interruption Duration Index (CAIDI) IF-EU-550a.2
CAIDI — GENERATION, TRANSMISSION, AND DISTRIBUTION INTERRUPTIONS (MINUTES)
See pages 44-45 for additional discussion on grid reliability and resilience.
1 For the period prior to and including March 31, 2021, reliability indices were calculated using the Institute of Electrical and Electronics Engineers (IEEE) Standard 1366TM-2012 methodology. For the period April 1, 2021, and forward, reliability indices are calculated using an adjusted* IEEE 1366 methodology. For service eliability indices, current outage event data is used to calculate the indices. Outage event data for previously reported periods may change as new information becomes available.
*As approved in Docket No. 2019-0110, Decision and Order No. 37600, issued on February 2, 2021.
Introduction
HEI Hawaiian Electric American Savings Bank
Pacific Current Appendix
Quantitative
SASB – Hawaiian Electric
SASB – American Savings Bank
EEI ESG Metrics
Discuss notable service interruptions such as those that affected a significant number of customers or disruptions of extended duration
Below is a summary of major event days (MEDs) 1 in 2022 and events that significantly impacted normalized 2022 SAIDI or SAIFI results for each of O‘ahu, Hawai‘i Island and Maui County. Contributions from MEDs are excluded from normalized results.
The following were determined to be MEDs on O‘ahu in 2022:
1. March 1: Transmission & distribution (T&D) equipment failure during abnormally configured sub-transmission system.
2. December 19: Various vegetation and weather-related interruptions affected O‘ahu.
Events that significantly impacted normalized 2022 SAIDI or SAIFI results for O‘ahu:
1. February 28: Cable fault in a manhole. Sustained interruption to 864 customers for up to 21 hours and 2 minutes. Contributed 3.54 minutes to the annual SAIDI.
2. June 30: Motor vehicle accident caused a broken pole. Sustained interruption to 1,955 customers for up to 12 hours and 17 minutes. Contributed 3.38 minutes to the annual SAIDI.
3. August 2: Deteriorated T&D equipment failed. Sustained interruption to 10,939 customers for up to 5 hours and 33 minutes. Contributed 2.58 minutes to the annual SAIDI and 0.036 interruptions to the annual SAIFI.
4. August 20: UFLS when a generator tripped offline. Sustained interruption to 6,810 customers for up to 21 minutes. Contributed 0.022 interruptions to the annual SAIFI.
5. December 20: High winds affected various parts of O‘ahu. Sustained interruption to 7,387 customers for up to 2 hours and 55 minutes. Contributed 0.024 interruptions to the annual SAIFI.
The following were determined to be MEDs on Hawai‘i Island in 2022:
1. December 19: Various vegetation and weather-related interruptions affected Hawai‘i Island.
2. December 20: Various tree-caused interruptions affected Hawai‘i Island during high winds.
Events that significantly impacted normalized 2022 SAIDI or SAIFI results for Hawai‘i Island:
1. May 13: Motor vehicle accident to a pole. Sustained interruption to 2,500 customers for up to 14 hours and 7 minutes. Contributed 11.34 minutes to the annual SAIDI.
2. June 25: UFLS when a generator tripped offline. Sustained interruption to 13,745 customers for up to 11 minutes. Contributed 0.156 interruptions to the annual SAIFI.
3. July 10: A tree fell and brought down conductors. Sustained interruption to 4,536 customers for up to 2 hours and 55 minutes. Contributed 6.64 minutes to the annual SAIDI.
4. July 16: UFLS when a generator tripped offline. Sustained interruption to 12,928 customers for up to 14 minutes. Contributed 0.146 interruptions to the annual SAIFI.
5. November 9: Deteriorated transmission pole broke. Sustained interruption to 14,038 customers for up to 1 hour and 8 minutes. Contributed 7.01 minutes to the annual SAIDI and 0.159 interruptions to the annual SAIFI. service int
The following were determined to be MEDs in Maui County in 2022:
1. January 17: T&D equipment failure on Lāna‘i.
2. March 15: Underfrequency load shed (UFLS) when a generator tripped offline on Lāna‘i.
3. April 21: Unknown cause affected the T&D system on Lāna‘i.
4. August 23: T&D substation equipment failure and UFLS on Maui.
5. December 19: Various vegetation and weather-related interruptions affected Maui.
Events that significantly impacted normalized 2022 SAIDI or SAIFI results for Maui County:
1. January 20: UFLS when a generator tripped offline. Sustained interruption to 7,235 customers for up to 36 minutes. Contributed 0.098 interruptions to the annual SAIFI.
2. September 24: Deteriorated T&D equipment broke and caused conductors to fall. Sustained interruption to 3,448 customers for up to 5 hours and 50 minutes. Contributed 5.80 minutes to the annual SAIDI.
3. November 21: High winds caused T&D equipment to come loose and swing short. Sustained interruption to 6,796 customers for up to 3 hours and 18 minutes. Contributed 6.79 minutes to the annual SAIDI and 0.092 interruptions to annual SAIFI.
4. December 18: Various vegetation and weather-related interruptions affected Maui and Moloka‘i. Sustained interruption to 4,951 customers for up to 215 hours and 31 minutes. Contributed 7.83 minutes to the annual SAIDI and 0.067 interruptions to the annual SAIFI.
For the Hawaiian Electric utiltiies, the most recent four main causes of outages are:
• Vegetation: Includes downed trees and tree branches in power lines and overgrown vegetation, some of which falls outside of the Companies’ scope of clearance
• Equipment deterioration: Equipment breakdown from natural causes
• Cable faults: Failure of underground cable system equipment
• Automatic underfrequency load shed: Controlled automatic load shed to recover from underfrequency conditions
1 For the period prior to and including March 31, 2021, reliability indices were determined using the Institute of Electrical and Electronics Engineers (IEEE) Standard 1366TM-2012 methodology. For the period April 1, 2021, and forward, reliability indices are determined using an adjusted* IEEE 1366 methodology. Contributions from MEDs are excluded from normalized results.
*As approved in Docket No. 2019-0110, Decision and Order No. 37600 issued on February 2, 2021.
For ASB we have selected the Commercial Banks, Mortgage Finance and Consumer Finance Standards based on the products ASB offers and its loan portfolio.
*While we have endeavored to provide fulsome responses to the SASB metrics, there are certain metrics for which we are not providing information due to the confidential nature of such information.

In the two charts that follow, “Consumer” refers to deposits and loans “primarily for personal, family or household purposes.” Within its general population of deposit accounts and loans, ASB does not separately categorize accounts as “small business” accounts. However, according to the U.S. Small Business Administration, 99.3% of Hawai‘i companies are considered small businesses. As such, we believe a significant proportion of companies that are our customers would be considered “small businesses.”
(1) Number and (2) value of checking and savings accounts by segment: (a) personal and (b) small business
CORE DEPOSIT ACCOUNTS BY SEGMENT
(1) Number and (2) value of loans by segment: (a) personal, (b) small business, and (c) corporate
NON-REAL ESTATE LOANS*
*Lines of credit that are not secured by real estate are included.
Introduction
HEI Hawaiian Electric American Savings Bank
Pacific Current Appendix
Quantitative
SASB – Hawaiian Electric SASB – American Savings Bank
EEI ESG Metrics
(1) Number of data breaches, (2) percentage involving personally identifiable information (PII), (3) number of account holders affected
*See comment on page 84. ASB is in compliance with applicable requirements.
Description of approach to identifying and addressing data security risks
Two of the most significant cyberattack risks that ASB faces are e-fraud and loss of sensitive customer data. Please see pages 23-24 of HEI’s 2022 Annual Report (10-K .
(1) Number and (2) amount of loans outstanding qualified to programs designed to promote small business and community development
Number of participants in financial literacy initiatives for unbanked, underbanked, or underserved customers FN-CB-240a.4
In early 2019, we launched an online financial checkup where individuals can answer a series of questions and get a basic financial health score. Based on their results, we make a recommendation on what area they could further explore. We also connect these individuals to bankers using an online appointment tool. In 2022, there were 585 financial checkups and 11,938 online appointments fulfilled.
On February 22, 2021, we launched an online financial education resource center. There, visitors can learn about Debt Management, Budgeting for Families, Credit Scores, Finance for Senior Caregivers and more. In 2022, 5,862 people accessed the center, with an average view time of 14 minutes and 14 seconds and an 18% conversion rate (measuring how many program users clicked through to a “custom moment”).
Customers also have the opportunity for financial education through our online financial calculators. In 2022, the calculators were viewed over 33,000 times. The most popular calculator was “Calculate a Mortgage Payment” with 6,343 page views.
Commercial
(1) Number and (2) amount of past due and nonaccrual loans qualified to programs designed to promote small business and community development
AND NONACCRUAL SMALL BUSINESS AND COMMUNITY DEVELOPMENT LOANS
*The industry code is based on the North American Industry Classification System (NAICS) code that the customer provides. We have not reviewed the NAICS code for accuracy.
While we seek to increase access to financial services and support those businesses that make a positive impact in the community, we primarily evaluate our borrowers’ creditworthiness based on the business’s commitment to honor the obligations to ASB. During our due diligence process, if we learn of any negative ESG factors that do not align with our values, we may decline financing the business.
Our Commercial Credit Policy team analyzes the potential impacts that sea level rise and natural disasters can have on properties that secure our loans. Additionally, we monitor other known ESG risks that can affect the quality of collateral or our customers’ ability to pay. These credit risks are regularly reported to senior leadership and the board.
Based on these potential environmental impacts, we continuously analyze our underwriting policies, credit policy and risk mitigation efforts.
Number of no-cost retail checking accounts provided to previously unbanked or underbanked customers
ASB does not collect data on customers’ unbanked or underbanked status.
FN-CB-240a.3
Total amount of monetary losses as a result of legal proceedings associated with fraud, insider trading, anti-trust, anti-competitive behavior, market manipulation, malpractice, or other related financial industry laws or regulations
Please see page 33 of HEI’s 2022 Annual Report (10-K)
Description of whistleblower policies and procedures
FN-CB-510a.1
FN-CB-510a.2
The Code of Conduct is a statement of the fundamental principles and key policies that govern our conduct; it is not intended to cover every applicable law or provide answers to every question that might arise. In many instances, the policies referenced in the Code of Conduct go beyond the requirements of the law.
Teammates who wish to report violations of ASB’s Code of Conduct may notify their managers, Human Resources, or anyone in the Legal Department. Teammates may also submit their concerns to EthicsPoint, a third-party reporting administrator. EthicsPoint permits teammates to make reports anonymously, through its website or hotline, and provides the content of the report to the appropriate individuals within the company to investigate. Teammates who make EthicsPoint reports also have the opportunity to answer questions anonymously and track the progress of their report through EthicsPoint’s website.
Speaking up can be extremely difficult for a number of reasons — one of which is a fear of retaliation. We believe that our teammates should feel comfortable raising their concerns. We do not tolerate retaliation against people who report suspected illegal conduct or violations of the Code of Conduct. Teammates who engage in retaliation are subject to discipline up to and including termination of employment.
All teammates receive regular in-person and computer-based training relating to identifying and reporting Code of Conduct violations and inappropriate conduct. Additionally, teammates must undergo annual training on compliance issues relevant to their job duties.
Global Systemically Important Bank (G-SIB) score, by category
ASB is not on the Financial Stability Board’s 2022 list of Global Systemically Important Banks, so it does not have a G-SIB score.
Description of approach to incorporation of results of mandatory and voluntary stress tests into capital adequacy planning, long-term corporate strategy, and other business activities
FN-CB-550a.1
FN-CB-550a.2
On an ongoing basis, we evaluate and address issues and activities that may pose potential risks to ASB, our teammates, customers, stakeholders and the community at large. This includes taking precautionary actions to anticipate, identify and manage risks related to our services and conducting regular stress tests.
With regard to stress testing, we analyze the impact of liquidity risk, interest rate risk, and credit risk on our financial position based on multiple adverse endemic and systemic scenarios. Our enterprise risk, finance and credit teams work in collaboration to perform this analysis at least on an annual basis. Additionally, we monitor risk indicators on a daily basis.
The Risk Committee of ASB’s Board of Directors assists with governance of ASB’s enterprise risk management program and provides a forum for detailed discussion and analysis of key issues and decisions designed to identify the significant risks potentially affecting ASB and to manage these risks. The enterprise risk management program focuses on various risk categories, including Credit (for loan, including related risk from sea level rise, and investment portfolios), Market (including interest rate sensitivity), Liquidity, Operations (including environmental, social, and governance), Strategic and Reputational.
Savings Bank Pacific Current Appendix Quantitative
– American Savings Bank
EEI ESG Metrics
(1) Number and (2) value of residential mortgages of the following types:
(a) Hybrid or Option Adjustable-rate Mortgages (ARM), (b) Prepayment Penalty,
(c) Higher Rate, (d) Total, by FICO scores above or below 660
RESIDENTIAL LOANS BY FEATURES AND FICO SCORE*1
(1) Number and (2) value of (a) residential mortgage modifications, (b) foreclosures, and (c) short sales or deeds in lieu of foreclosure, by FICO scores above and below 660
RESIDENTIAL MORTGAGE MODIFICATIONS, FORECLOSURES, AND SHORT SALES OR DEEDS IN LIEU OF FORECLOSURE, BY FICO SCORES*
* The loans are classified based on the borrowers’ FICO score at the time of origination. In the prior disclosure, missing FICO scores were included in the category “FICO >660.” This disclosure excludes those with missing FICO scores.
*The loans are classified based on the borrowers’ FICO score at the time of origination.
**Loan modifications are limited to those requested by customers facing financial hardship.
*** Foreclosures are limited to those where the borrower defaulted and a sale of the underlying property was forced.
Introduction
HEI
Hawaiian Electric American Savings Bank
Pacific Current Appendix
Quantitative
SASB – Hawaiian Electric
SASB – American Savings Bank
EEI ESG Metrics
Total amount of monetary losses as a result of legal proceedings associated with communications to customers or remuneration of loan originators
Please see page 33 of HEI’s 2022 Annual Report (10-K)
Description of remuneration structure of loan originators
FN-MF-270a.3
(1) Number and (2) value of mortgage loans in 100-year flood zones
RESIDENTIAL MORTGAGE LOANS IN 100-YEAR FLOOD ZONES1
(Dollars in
FN-MF-270a.4
Our residential loan officers receive a base wage, plus commissions of 40-90 basis points on originated residential mortgages. The actual rate of incentive compensation depends on whether the mortgages were externally sourced and the total monthly production of the loan officer.
Residential loan officers must comply with all regulations and ethical rules to be eligible for incentive compensation. We may refuse to pay commissions to loan officers who violate the law or ASB’s policies.
(1) Number, (2) value, and (3) weighted average Loan-to-Value (LTV) ratio of mortgages issued to (a) minority and (b) all other borrowers, by FICO scores above and below 660
TOTAL ORIGINATED RESIDENTIAL LOANS* AND HOME EQUITY LINES OF CREDIT BY MINORITY AND CREDIT SCORE**
FN-MF-270b.1
FN-MF-450a.1
* Land loans are excluded.
** Since last year’s ESG report, we modified some of the variables. 2021 figures are restated.
Total amount of monetary losses as a result of legal proceedings associated with discriminatory mortgage lending
Please see page 33 of HEI’s 2022 Annual Report (10-K)
Description of policies and procedures for ensuring nondiscriminatory mortgage origination
FN-MF-270b.2
FN-MF-270b.3
As a covered financial institution, we comply with the Fair Housing Act and Equal Credit Opportunity Act, which prohibit discrimination in residential real estate credit-related transactions based on certain protected classes, such as race, color, national origin, religion, sex and marital or familial status. To prevent discriminatory lending practices, we regularly review our application processes and requirements, sales practices, policies and marketing material to ensure that all protected classes are fairly and equally treated. We also periodically review lending data to identify any policies or practices that may potentially affect protected consumers unfairly and unequally.
(1) Total expected loss (EL) and (2) Loss Given Default (LGD) attributable to mortgage loan default and delinquency due to weather related natural catastrophes, by geographic region
The data is not available specific to weather-related natural catastrophes. ASB intends to expand its environmental risk analysis in the future.
Description of how climate change and other environmental risks are incorporated into mortgage origination and underwriting
Operating on an island chain, we know that we must prepare to adapt to the impacts of climate change and take steps to prudently mitigate related risks. Climate change may cause more frequent and intense weather-related natural catastrophes, such as hurricanes, storms, and flooding, and may result in sea level rise. We require all homeowners who live in a Special Flood Hazard Area, as defined by FEMA, to maintain sufficient flood insurance throughout the life of the loan. We also require all mortgages, with the exception of some home equity lines of credit, to secure hurricane and hazard insurance.
We regularly monitor our credit exposure in areas at risk of future sea-level rise. We perform property research to confirm flood zones, and our underwriting decisions consider factors such as the property location, topography and elevation.
* Residential Portfolio includes two (2) loans held for sale (total unpaid principal balance of $0.8 million). 1
Introduction
HEI
Number of unique consumers with an active (1) credit card account and (2) pre-paid debit card account
Number of (1) credit card accounts and (2) pre-paid debit card accounts
FN-CF-000.A
FN-CF-000.B
ASB does not issue any credit cards and does not offer any pre-paid debit cards. ASB’s branded credit cards are issued by Elan Financial Services, through a license from Visa U.S.A.
Number of account holders whose information is used for secondary purposes
FN-CF-220a.1
Similar to other financial institutions, we collect and maintain data, primarily to allow us to originate and maintain deposit accounts, loans, investment accounts and other products and services that we provide. We may also use our customers’ data to provide us insight into products and services that would be beneficial for our customers, protect against fraud, security breaches and other wrongful conduct, and support the general operation of our business. We do not sell our customers’ data, nor do we plan to do so.
As a financial institution, we comply with the Gramm-Leach-Bliley Act, as implemented by Regulation P, and other federal, state and local laws and regulations. Our Privacy Notice can be found on our website at www.asbhawaii.com/security-fraud-privacy
Hawaiian Electric American Savings Bank
Pacific Current Appendix
Quantitative
SASB – Hawaiian Electric SASB – American Savings Bank
EEI ESG Metrics
Total amount of monetary losses as a result of legal proceedings associated with customer privacy
Please see page 33 of HEI’s 2021 Annual Report (10-K)
Data Security (see also FN-CB-230a.1 and FN-CB-230a.2 on page 84)
Card-related fraud losses from (1) card-not-present fraud and (2) card-present and other fraud
Please see page 33 of HEI’s 2021 Annual Report (10-K)
FN-CF-220a.2
Percentage of total remuneration for covered teammates that is variable and linked to the amount of products and services sold
Eligible Branch Managers, Assistant Branch Managers and Personal Bankers who sell consumer loan products may receive incentive compensation of 10-15 basis points in their production of consumer loans, provided they meet the branch goal. These bankers must comply with all regulations and ethical rules to be eligible for incentive compensation. We may refuse to pay commissions to bankers who violate the law or ASB’s policies.
In 2022, only 6% of these teammates’ total compensation was variable and linked to the amount of products and services sold (e.g., referral fees, commissions, and bonuses).
Approval rate for (1) credit and (2) pre-paid products for applicants with FICO scores above and below 660
FN-CF-230a.2
sell pre-paid products.
* The 2020 and 2021 figures have been restated. This year’s disclosures are based on: (1) the decision status date or loan booking date, rather than loan application date; (2) the FICO score of the borrower with the lowest FICO score, rather than each borrower being counted; and (3) categorization of borrowers by “below or equal to 660” and “greater than 660.”
(1) Average fees from add-on products, (2) average APR, (3) average age of accounts, (4) average number of trade lines, and (5) average annual fees for pre-paid products, for customers with FICO scores above and below 660
We offer various consumer loan products with a range of interest rates. As of December 31, 2022, the average interest rate for all of our consumer loan accounts was 7.72% and the average age was 1.1 years.
(1) Number of complaints filed with the Consumer Financial Protection Bureau (CFPB), (2) percentage with monetary or nonmonetary relief, (3) percentage disputed by consumer, (4) percentage that resulted in investigation by the CFPB FN-CF-270a.4
*See comment on page 84. ASB is in compliance with applicable requirements.
Total amount of monetary losses as a result of legal proceedings associated with selling and servicing of products
Please see page 33 of HEI’s 2021 Annual Report (10-K)
FN-CF-270a.5

The Hawaiian Electric data in this section is reported in alignment with the Edison Electric Institute (EEI) Environmental, Social, Governance / Sustainability (ESG) reporting template. The charts in this section have been modified as appropriate to reflect the specific activities of Hawaiian Electric.
1 For total system generation reported by source, customer-sited generation is included as part of SASB and EEI ESG metrics in this report but was not included in HEI’s Annual Report on Form 10-K for year ended 2022. Minor methodology differences regarding renewable components of certain generators and timing of underlying reporting account for additional differences between the SASB and EEI ESG reported metrics and the Form 10-K.
2 2019 and 2020 generation amounts reflect the fact that the Puna Geothermal Venture (PGV) plant was out of service from May 2018 until late 2020. The loss of firm power from PGV generation was offset by firm generation from petroleum. PGV returned to service with firm capacity of 13 MW in the first quarter of 2021 and ramped up to 23.9 MW in the second quarter and continued to provide 23.9 MW for the remainder of 2021.
HEI Hawaiian Electric American Savings Bank Pacific Current Appendix Quantitative SASB – Hawaiian Electric SASB – American Savings Bank
EEI ESG Metrics
Portfolio continued Investing in the future: capital expenditures, energy efficiency (EE), and smart meters
See pages 12-14 for detailed information on our GHG emissions inventory. GHG emissions: carbon dioxide (CO 2 ) and carbon dioxide equivalent (CO
electric customer count (at end of year)
1 Capital expenditures shown on an accrual basis and are net of contributions in aid of construction.
2 Source: Hawai‘i Energy 2020 Annual Report
1 Equal to Scope 1 Owned Generation + Scope 3 Purchased Power + non-generation (T&D SF6 emissions). No CO2 emissions from customer-sited solar. Intensities in MT/Net MWh are calculated by dividing emissions by net generation from owned generation, purchased power and customer-sited solar.
2 Equal to Scope 1 Owned Generation + Scope 3 Purchased Power. Intensities in MT/Net MWh are calculated by dividing emissions by net generation from owned generation and purchased power.
3 Equal to Scope 1 Owned Generation. Intensities in MT/Net MWh are calculated by dividing emissions by net generation from owned generation.
4 Equal to Scope 3 Purchased Power. Intensities in MT/Net MWh are calculated by dividing emissions by net generation from purchased power.
Introduction
HEI Hawaiian Electric American Savings Bank
Pacific Current Appendix
Quantitative
SASB – Hawaiian Electric SASB – American Savings Bank
EEI ESG Metrics
1 Total number of employees as of December 31.
2 Refers to board members of HEI, the parent company of Hawaiian Electric.
3 Executives includes EEO-1 category 1.1 - Executive/Sr. Level Officials.
4 Leaders includes EEO-1 category 1.2 - First/Mid-Level Officials.
5 All Workforce includes EEO-1 categories 1.1 - Executive/Sr. Level Officials, 1.2 - First/Mid-Level Officials, 2 - Professionals, 3 - Technicians, 4 Sales Workers, 5Administrative Support Workers, 6 - Craft Workers, 7 - Operatives, 8 - Laborers and Helpers, 9 - Service Workers.
6 Racially diverse defined as all races/ethnicities that are not ‘White.’
7 The company discloses severity rate data in alignment with EEI definitions. In prior eports this EEI template category was labeled as lost-time case rate. The label has been corrected to refer to severity rate.
70% reduction in GHG emissions from power generation. Emissions covered by this goal include stack emissions from generation owned by Hawaiian Electric (Scope 1) and independent power producers who sell electricity to the utility (Scope 3).
Net zero GHG emissions from power generation. Emissions covered by this goal include stack emissions from generation owned by Hawaiian Electric (Scope 1) and independent power producers who sell electricity to the utility (Scope 3).
Additional information on the emissions goals listed above can be found on pages 33-36
1 Fresh water resource uses are for company-owned thermal and hydroelectric generation.
2 Hawaiian Electric does not operate any coal-fired power plants and therefore does not generate any coal combustion products. The only generation facility in our service territory that used coal in 2022 was owned and operated by a third-party independent power producer (IPP) that generated and sold power to Hawaiian Electric under a power purchase agreement (PPA). The PPA for that plant expired in September 2022, upon which time there was no more coal generation on our system.

Certain statements contained in this report are forward-looking statements, including statements regarding our ESG targets, goals, commitments and programs and other business plans, initiatives and objectives, and other statements that are not purely historical. These statements are typically accompanied by words such as “aim,” “anticipate,” “hope,” “believe,” “could,” “expect,” “estimate,” “plan,” “will,” “would,” or similar expressions. All such statements are intended to be protected by the safe harbor for forward-looking statements within the meaning of Section 21E of the Securities Exchange Act of 1934, as amended. Forward-looking statements are based on current expectations and projections about future events and are subject to risks, uncertainties and the accuracy of assumptions concerning HEI and its subsidiaries, the performance of the industries in which they do business and economic, political and market factors, among other things. These forward-looking statements are not guarantees of future performance. Our actual future results, including the achievement of our targets, goals or commitments, could differ materially from those reflected or implied in the forward-looking statements, which involve risks, uncertainties and other important factors. Such risks, uncertainties and factors include the risk factors discussed in our most recent Annual Report on Form 10-K and subsequent quarterly reports on Form 10-Q and other reports filed with the SEC. With respect to our ESG targets, goals, and commitments outlined in this report or elsewhere, certain challenges, assumptions, risks, uncertainties and factors are identified in this report. We urge you to carefully consider all of the risks, uncertainties and factors discussed in such reports in evaluating the forward-looking statements in this report. We cannot assure you that the results reflected or implied by any forward-looking statement will be realized or, even if substantially realized, that those results will have the forecasted or expected consequences and effects. The forward-looking statements in this report are made as of the date of this report, unless otherwise indicated, and we undertake no obligation to update these forward-looking statements to reflect subsequent events or circumstances.
HEI’s 2022 CDP disclosure can be found here
In 2022, HEI received a rating of AA (on a scale of AAA-CCC) in the MSCI ESG Ratings assessment.
The use by HEI of any MSCI ESG research LLC or its affiliates (“MSCI”) data, and the use of MSCI logos, trademarks, service marks or index names herein, do not constitute a sponsorship, endorsement, recommendation, or promotion of HEI by MSCI. MSCI services and data are the property of MSCI or its information providers, and are provided ‘as-is’ and without warranty. MSCI names and logos are trademarks or service marks of MSCI.
 ©2023 Hawaiian Electric Industries, Inc.