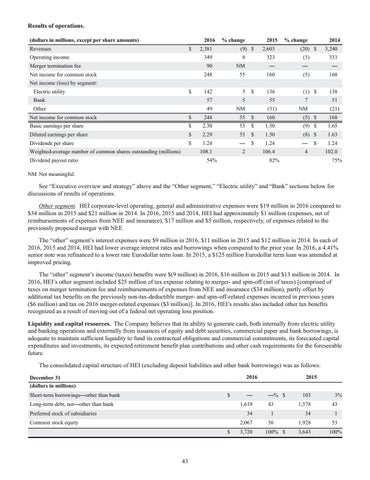
Results of operations. (dollars in millions, except per share amounts)
2016
Revenues
$
Operating income Merger termination fee Net income for common stock
% change
2,381
2015
(9) $
% change
2,603
2014
(20) $
3,240
349
8
323
(3)
333
90
NM
—
—
—
248
55
160
(5)
168
136
(1) $
138
Net income (loss) by segment: Electric utility
$
Bank Other Net income for common stock
$
142
5
57
5
49
NM
248
55
$
55 (31) $
160
7
51
NM
(21)
(5) $
168
Basic earnings per share
$
2.30
53
$
1.50
(9) $
1.65
Diluted earnings per share
$
2.29
53
$
1.50
(8) $
1.63
Dividends per share
$
1.24
—
$
1.24
—
108.1
2
106.4
4
Weighted-average number of common shares outstanding (millions) Dividend payout ratio
54%
$
82%
1.24 102.0 75%
NM Not meaningful.
See “Executive overview and strategy” above and the “Other segment,” “Electric utility” and “Bank” sections below for discussions of results of operations. Other segment. HEI corporate-level operating, general and administrative expenses were $19 million in 2016 compared to $34 million in 2015 and $21 million in 2014. In 2016, 2015 and 2014, HEI had approximately $1 million (expenses, net of reimbursements of expenses from NEE and insurance), $17 million and $5 million, respectively, of expenses related to the previously proposed merger with NEE. The “other” segment’s interest expenses were $9 million in 2016, $11 million in 2015 and $12 million in 2014. In each of 2016, 2015 and 2014, HEI had lower average interest rates and borrowings when compared to the prior year. In 2016, a 4.41% senior note was refinanced to a lower rate Eurodollar term loan. In 2015, a $125 million Eurodollar term loan was amended at improved pricing. The “other” segment’s income (taxes) benefits were $(9 million) in 2016, $16 million in 2015 and $13 million in 2014. In 2016, HEI’s other segment included $25 million of tax expense relating to merger- and spin-off (net of taxes) [comprised of taxes on merger termination fee and reimbursements of expenses from NEE and insurance ($34 million), partly offset by additional tax benefits on the previously non-tax-deductible merger- and spin-off-related expenses incurred in previous years ($6 million) and tax on 2016 merger-related expenses ($3 million)]. In 2016, HEI’s results also included other tax benefits recognized as a result of moving out of a federal net operating loss position. Liquidity and capital resources. The Company believes that its ability to generate cash, both internally from electric utility and banking operations and externally from issuances of equity and debt securities, commercial paper and bank borrowings, is adequate to maintain sufficient liquidity to fund its contractual obligations and commercial commitments, its forecasted capital expenditures and investments, its expected retirement benefit plan contributions and other cash requirements for the foreseeable future. The consolidated capital structure of HEI (excluding deposit liabilities and other bank borrowings) was as follows: 2016
December 31 (dollars in millions) Short-term borrowings—other than bank
$
Long-term debt, net—other than bank Preferred stock of subsidiaries Common stock equity
—
43
—% $
103
3%
1,619
43
1,578
43
34
1
34
1
2,067 $
2015
3,720
56 100% $
1,928
53
3,643
100%