COMPUTER APPLICATIONS
ACADEMIC PORTFOLIO

SCHOOL OF PLANNING AND ARCHITECTURE VIJAYAWADA
Aim : To create a 3 - dimensional array of cubes


2 CADS Portfolio
3-D View GH script
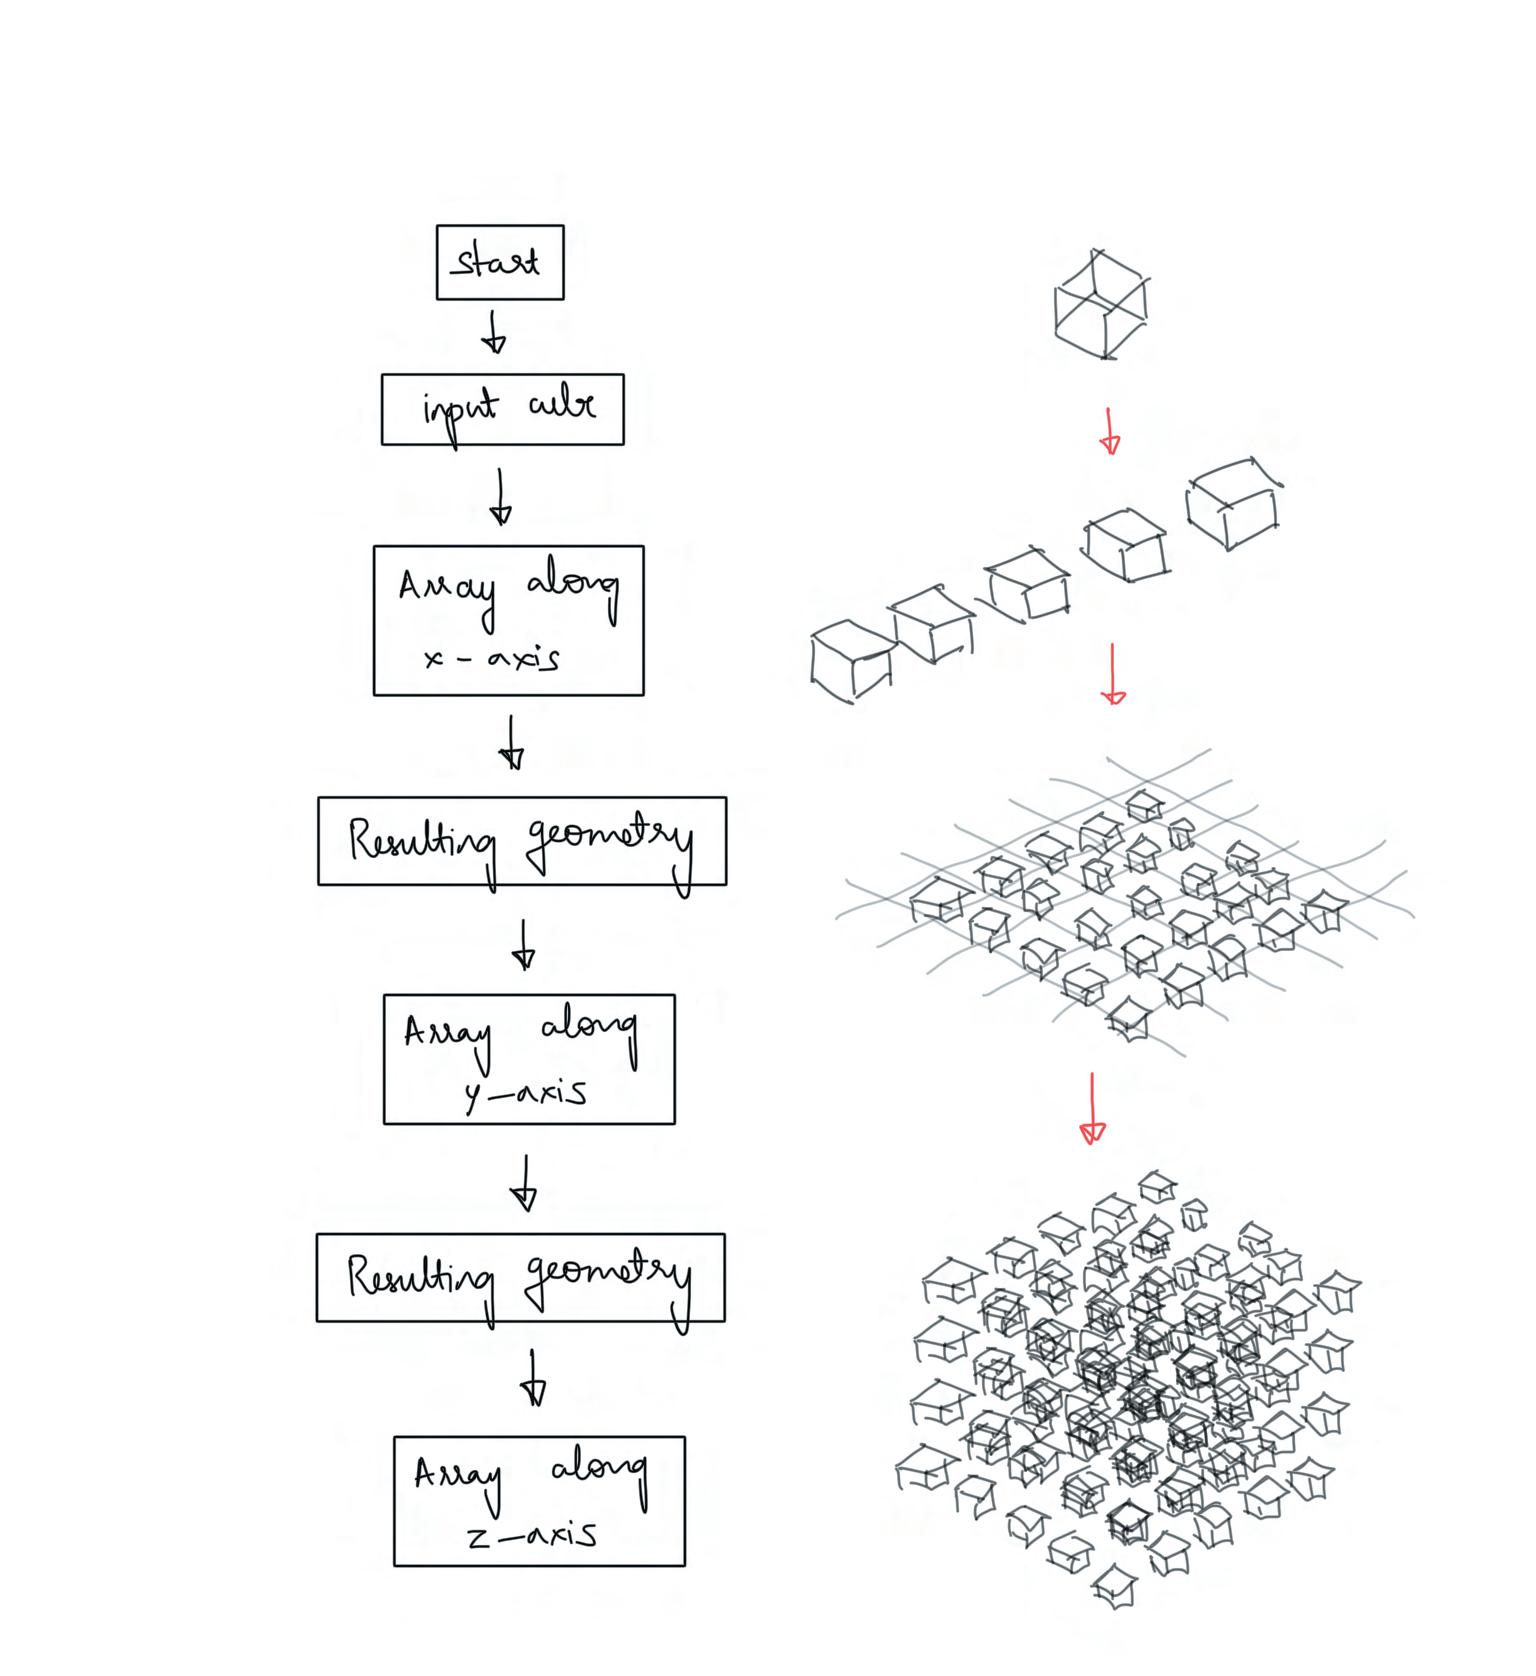
3D array of cubes : flowchart
3 Semester VIII
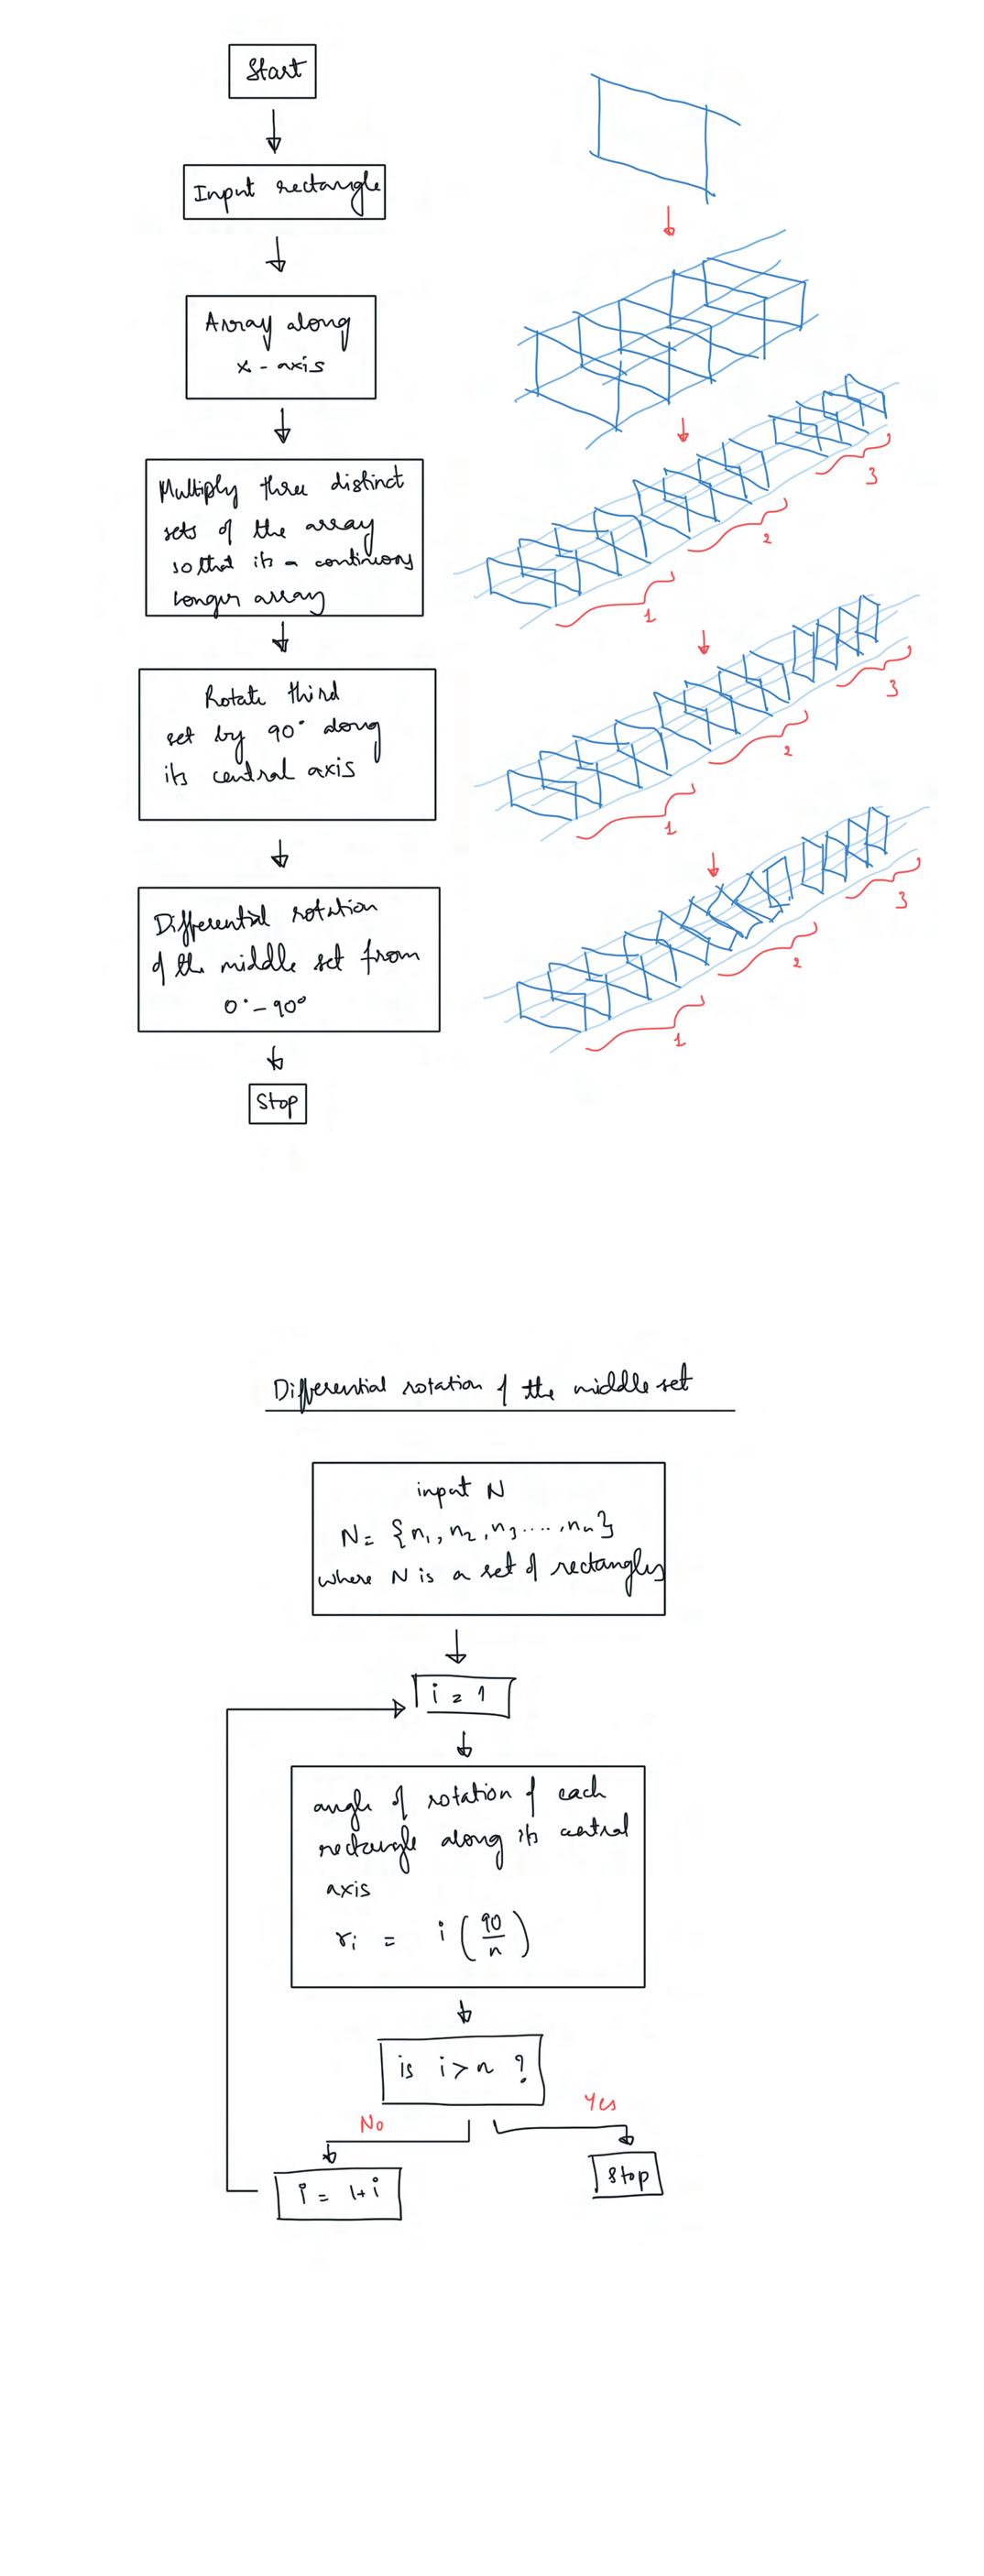
Rotating array
Aim : To create an array of rectangles that rotate 90 deg along the middle segment


4 CADS Portfolio
Rendered View
GH script
Parametric portal : Series
Aim : To create a parametric portal whose height varies in equal intervals


6
Portfolio
CADS
Rendered View
GH script

7
flowchart Semester VIII
Parametric portal :
Parametric portal : Random
Aim : To create a parametric portal whose height varies randomly


8 CADS Portfolio
Rendered View
GH script
Parametric portal : Repeat
Aim : To create a parametric portal whose height repeates between two numbers


9 Semester VIII
Rendered View
GH script
Attractive point - circles become smaller
Aim : To create a dynamic point which moves such that all the circles near the point become smaller


10 CADS Portfolio
Rendered View
Flow Diagram
GH script
Aim : To create a dynamic point which moves such that all the Attractive point - circles become larger


11 Semester VIII
Rendered View
GH script
Kinetic facade
Aim : To create a facade with movable elements that close as the sun intensity increases and open as it decreases

The facade is made with triangular elements which sinch and move upwards at the centre point
Facade closes according to the location of the sun element

Facade closes opens up when the sun moves away

12 CADS Portfolio

13 Semester VIII
Kinetic facade : GH code

14 CADS Portfolio
GH script
15 Semester VIII script
Isovist : Concept
Aim : To calculate the percentage of visibility that is reduces by placeing obstacles surrounding the field of view


16 CADS Portfolio
Observer Location and circle of vision Obstacles New field of visibility GH script


17 Semester VIII
Concept Flowchart
Visibility variance : site plan


18 CADS Portfolio
- 80% Average visibility from any point : - 35% - 10% GH script
Visual Visibility Diagram of site elements

Average visibility of each grid box from every point on the site can also be calculated with the GH script
19 Semester VIII GH code
script
Average number diagram for each grid cell

GH script

script
Introduction to Python
Aim : To explore the scope of python in improving coding efficiency of grasshopper
Python allows us to extend Grasshopper’s functionality beyond what is provided by its native components. We can write custom scripts to perform complex calculations, automate repetitive tasks, or integrate with external software and libraries.
Simple tasks:
__author__ = “harsh”
__version__ = “2024.03.18”
import rhinoscriptsyntax as rs import ghpythonlib.components as ghcomp
a= ghcomp.ConstructPoint(x,y,z)
p=[]
for i in range(10): for j in range(5): for k in range (3): pnt = ghcomp.ConstructPoint(i,j,k) p.append(pnt)
Applications:

In the flowsurface algorithm, the last task of moving the point down by a small distance dz and finding the nearest point on the surface has to be done several number of times; the process would be very elaborate in grasshopper and hence the following python script is used to execute the task :
__author__ = “harsh”
__version__ = “2024.03.18”
import rhinoscriptsyntax as rs import ghpythonlib.components as ghcomp
fpt = []
fpt.append(pt)
dz= ghcomp.VectorXYZ(0,0, -1)[0]
for i in range(iteration): p= fpt[len(fpt)-1] #last point in the list fpt mpt = ghcomp.Move(p,dz)[0] #v is translation vector spt = ghcomp.SurfaceClosestPoint(mpt,srf)[0] fpt.append(spt)
a=spt
__author__ = “kamsa” __version__ = “2024.03.25”
import rhinoscriptsyntax as rs import ghpythonlib.components as ghcomp import math
org=ghcomp.Deconstruct(origin)
pts=[]
step=int(360/count) z=0

In the optimised location algorithm, its very easy to get the smallest average distance value from the grasshopper algorithm, but its very complicated to extract the list item index and the position of the optimised location point; this task is done by the following python script :
__author__ = “harsh” __version__ = “2024.04.01”
import rhinoscriptsyntax as rs import math
T = min(t)
Tidx = t.index(T)
print t,”,”,Tidx
L = f.pop(Tidx) print L
tsorted = sorted(t) print tsorted
22 CADS Portfolio

Optimised Location: Brute force method
Aim : To find the optimal location to place a new point such that it is near to all the existing points

Boundary of site and location of existing buildings

the rectangular grid

 GH script
Optimised Location : General Algorithm
Aim : To optimise the efficiency of the algoritm running the algorithm only for points which have more probablity of being the optimised location


24 CADS Portfolio
GH script


Sine curve in 2D

Z - parametre for sine curve in 3D

Double curve Loft
 GH script
Ladybug Tools
Aim : To explore the scope of Ladybug for climatic analysis

An annual monthly chart comparing values of Dry bulb temperature, Relative humidity and wind direction
Ladybug tool imports weather data of any available location from an online https://www.ladybug.tools/epwmap/
Ladybug weather data can be used to prepare several types of graphs with respect to parametres of temperature, humidity, sun radiance etc.

The data output from ladubug can be used for accurate site analysis and for developing initial design concepts.
Ladybug tools enable architects to perform comprehensive environmental analysis early in the design process, facilitating the creation of sustainable and environmentally responsve buildings.
Wind rose charts comparing the wind dpeed and direciton with various other parametres like Dry bulu temperature and Relative Humidity

Shows the realistic sunpath surrounding the building and its context; it also gives additional data such as horizontal radiation.

Skymask : it shows the percentage of sky visible from the site chosen; the surrounding context should also be accurately defined to execute this function.

26 CADS Portfolio
27 Semester VIII
