
Washington, D.C. Metro
April 2024 Housing Market Report
Prepared by Bright Research
Key Market Statistics
More inventory has led to more transactions in the Washington D.C. metro. For three consecutive months active listings have trended higher than last year. At the end of April, there were 6,569 active listings, which is 21.8% higher than April 2023.
Buyers continue to purchase, and closed sales surpassed what they were last April (+7.4%). Pending sales also improved, up 4.0%. This is the first year-over-year increase in new pending sales since February 2022.
There is still a disconnect with showings. Year-to-date closed sales and pending sales have lagged slightly compared to 2023, down 1.4% and 2.0%, respectively, yet showing activity is 12.7% below last year. Potential buyers may be waiting for rates to fall or stepping away as affordability challenges only grow.
The median price in the metro was $640,000in April 2024, hitting a new record. Median sales prices for detached homes and townhomes were both at record highs, while condo prices were slightly below the February 2024 high.
Data asof May 6, 2024
New listings have added more supply to the D.C. metro, with new listings outpacing new pending sales. Nonetheless, home prices and the pace of sales have been unyielding for home shoppers. Affordability challenges could keep more buyers on the sidelines this summer, as showing activity indicates a weakening demand pool in the region.
Source: Freddie Mac
Weekly Avg. Mortgage Rate 30-yr fixed rate For more, visit brightmls.com/research
Housing
Market Outlook 4% 5% 6% 7% 8% May
May '24
Market Trends
'23
Apr 2024 Apr 2023 Change YTD 2024 YTD 2023 Change Closed Sales 4,518 4,207 +7.4% 14,144 14,347 -1.4% Median Sold Price $640,000 $586,000 +9.2% $588,000 $548,000 +7.3% Median
6 days 7 days -1 day 8 days 11 days -3 days New
5,386 5,179 +4.0% 17,135 17,491 -2.0% New Listings 5,964 5,028 +18.6% 22,042 21,083 +4.5% Active Listings 6,569 5,393 +21.8% 6,569 5,393 +21.8% Months of Supply 1.62 1.16 +0.46 mos. 1.62 1.16 +0.46 mos. Showings 113,834 131,850 -13.7% 404,925 463,768 -12.7%
Days on Market
Pending Sales
April 2024
Apr '24 vs. Apr '23
Apr '24 vs. Mar '24
4,518 +7.4% +22.0% (Apr '23: 4,207) (Mar '24: 3,702)
Median Sold Price
$640,000 +9.2% +6.7% (Apr '23: $586,000) (Mar '24: $599,990)
April 2024
Apr '24 vs. Apr '23
Apr '24 vs. Mar '24
Median Days on Market
Apr '24 vs. Apr '23 April 2024
Apr '24 vs. Mar '24
6 days -1 day -1 day (Apr '23: 7 days) (Mar '24: 7 days)
Closed Sales 2019-2022Range 2024 2023 2024 2023 2022 2021 2020 2019
April 2024 Housing Market Report Washington, D.C. Metro : 2 0 days 10 days 20 days 30 days 40 days 2019 2020 2021 2022 2023 2024 $350,000 $400,000 $450,000 $500,000 $550,000 $600,000 $650,000 $700,000 Jan Feb Mar Apr May Jun Jul Aug Sep Oct Nov Dec 0 2,500 5,000 7,500 10,000 Jan Feb Mar Apr May Jun Jul Aug Sep Oct Nov Dec
April 2024
Apr '24 vs. Apr '23
Apr '24 vs. Mar '24
5,386 +4.0% +12.3% (Apr '23: 5,179) (Mar '24: 4,797)
April 2024
Apr '24 vs. Apr '23
Apr '24 vs. Mar '24
5,964 +18.6% (Apr '23: 5,028) +20.0% (Mar '24: 4,969)
April 2024
Apr '24 vs. Apr '23
Apr '24 vs. Mar '24
6,569 +21.8% +17.1% (Apr '23: 5,393) (Mar '24: 5,609)
Active
New
New Pending Sales 2019-2022Range 2024 2023 2019-2022Range 2024 2023 April
Housing Market Report
Listings
Listings
2024
Washington, D.C. Metro : 3 0 2,500 5,000 7,500 10,000 12,500 15,000 2019 2020 2021 2022 2023 2024 0 2,500 5,000 7,500 10,000 12,500 Jan Feb Mar Apr May Jun Jul Aug Sep Oct Nov Dec 0 2,500 5,000 7,500 10,000 Jan Feb Mar Apr May Jun Jul Aug Sep Oct Nov Dec
Local Markets
Local Markets
Apr '24 vs. Apr '23 Apr '24 vs. Apr '23 Apr '24 vs. Apr '23 Washington, D.C. Metro 5,386 +4.0% 5,964 +18.6% 113,834 -13.7% Alexandria City, VA 211 +7.7% 206 +6.7% 3,399 -3.5% Arlington County, VA 228 -10.9% 249 +2.9% 4,120 -24.0% Fairfax City, VA 33 -13.2% 40 +0.0% 689 -41.0% Fairfax County, VA 1,344 +7.7% 1,316 +22.2% 30,458 -10.1% Falls Church City, VA 27 +107.7% 19 +46.2% 584 +72.3% Frederick County, MD 356 -3.0% 347 +16.1% 6,072 -15.5% Loudoun County, VA 515 +3.6% 560 +15.0% 9,863 -13.0% Montgomery County, MD 1,091 +17.6% 1,086 +18.7% 25,178 -7.1% Prince George's County, MD 911 +5.0% 954 +22.3% 20,639 -17.8% Washington, DC 670 -12.8% 1,187 +20.9% 12,832 -23.5% Apr '24 vs. Apr '23 Apr '24 vs. Apr '23 Apr '24 vs. Apr '23 Washington, D.C. Metro 4,518 +7.4% $640,000 +9.2% 6 days -1 day Alexandria City, VA 187 +1.6% $750,000 +20.5% 5 days -1 day Arlington County, VA 242 +13.6% $782,500 +15.1% 6 days -1 day Fairfax City, VA 27 +3.8% $830,000 +20.9% 5 days +1 day Fairfax County, VA 1,158 +16.5% $750,000 +7.1% 5 days +0 days Falls Church City, VA 9 -30.8% $1,150,000 +43.8% 4 days -3 days Frederick County, MD 279 -9.4% $460,000 +4.5% 7 days +1 day Loudoun County, VA 448 +5.2% $778,200 +11.1% 5 days +0 days Montgomery County, MD 868 +11.7% $650,000 +8.3% 6 days +0 days Prince George's County, MD 712 +8.5% $430,442 +2.5% 10 days -3 days Washington, DC 588 -3.6% $705,450 +4.3% 15 days +2 days April 2024 Housing Market Report
Closed Sales Median Sales Price Median Days on Market New Pending Sales New Listings Showings
Washington, D.C. Metro : 4
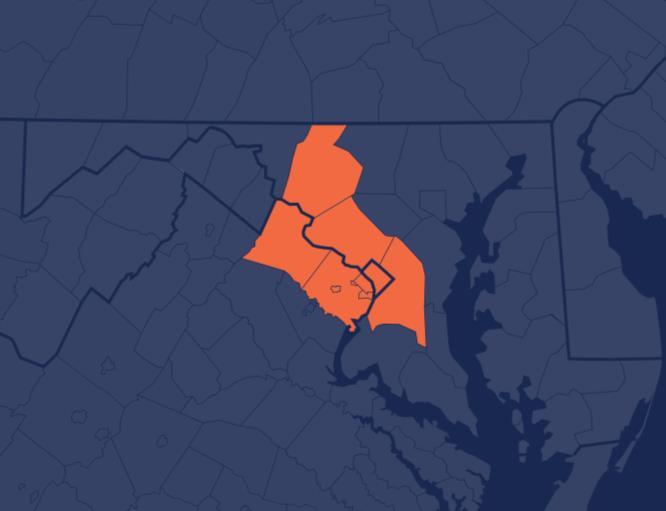
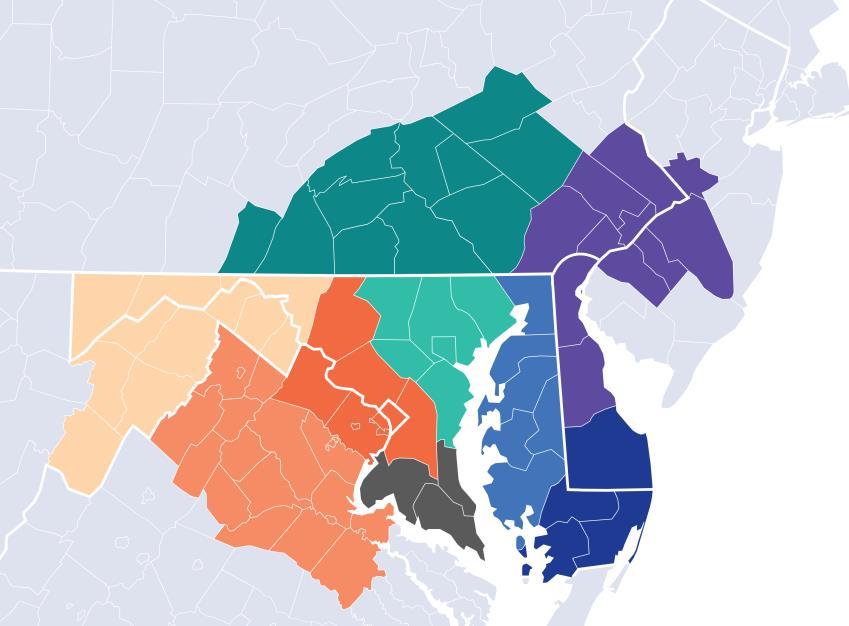
Local Market Map
MD/WV Panhandle
North Central Virginia
Washington D.C., Metro
Central Pennsylvania
Baltimore Metro
Southern Maryland
Maryland Eastern Shore
Philadelphia Metro
Del/Mar Coastal
About Bright MLS
Bright MLS was founded in 2016 as a collaboration between 43 visionary associations and two of the nation’s most prominent MLSs to transform what an MLS is and what it does, so real estate pros and the people they serve can thrive today and into our data-driven future through an open, clear and competitive housing market for all. Bright is proud to be the source of truth for comprehensive real estate data in the Mid-Atlantic, with market intelligence currently covering six states (Delaware, Maryland, New Jersey, Pennsylvania, Virginia, West Virginia) and the District of Columbia.
Please contact Christy Reap, Media Relations Director with interview or information requests:
• (202) 309-9362
• christy.reap@brightmls.com
Apr '24 vs. Apr '23 Apr '24 vs. Apr '23 Washington, D.C. Metro 6,569 +21.8% 1.62 +0.46 months Alexandria City, VA 159 +3.2% 0.94 +0.13 months Arlington County, VA 267 -2.9% 1.40 +0.07 months Fairfax City, VA 25 -21.9% 1.04 -0.19 months Fairfax County, VA 1,025 +16.2% 1.10 +0.28 months Falls Church City, VA 8 -20.0% 0.73 -0.18 months Frederick County, MD 359 +31.5% 1.22 +0.5 months Loudoun County, VA 483 +11.3% 1.24 +0.28 months Montgomery County, MD 926 +21.7% 1.20 +0.36 months Prince George's County, MD 1,009 +24.6% 1.41 +0.36 months Washington, DC 2,308 +31.0% 4.14 +1.35 months
More market insights are available at brightmls.com/research. Active Listings Months of Supply Washington, D.C. Metro : 5
Local Markets