Absorption Rate | Looks at the past year's monthly supply of inventory. In a normal market there should be a 6 month supply. The higher the rate above 6 the more aggressive a seller has to be with the competition; price and having a picture perfect property.
MONTHS SUPPLY OF INVENTORY
August 2025 | Single Family Homes
Months Supply of Inventory | Properties for sale divided by number of properties sold.
Units Listed | Number of properties listed for sale at the end of month.
Units Sold| Number of properties sold.
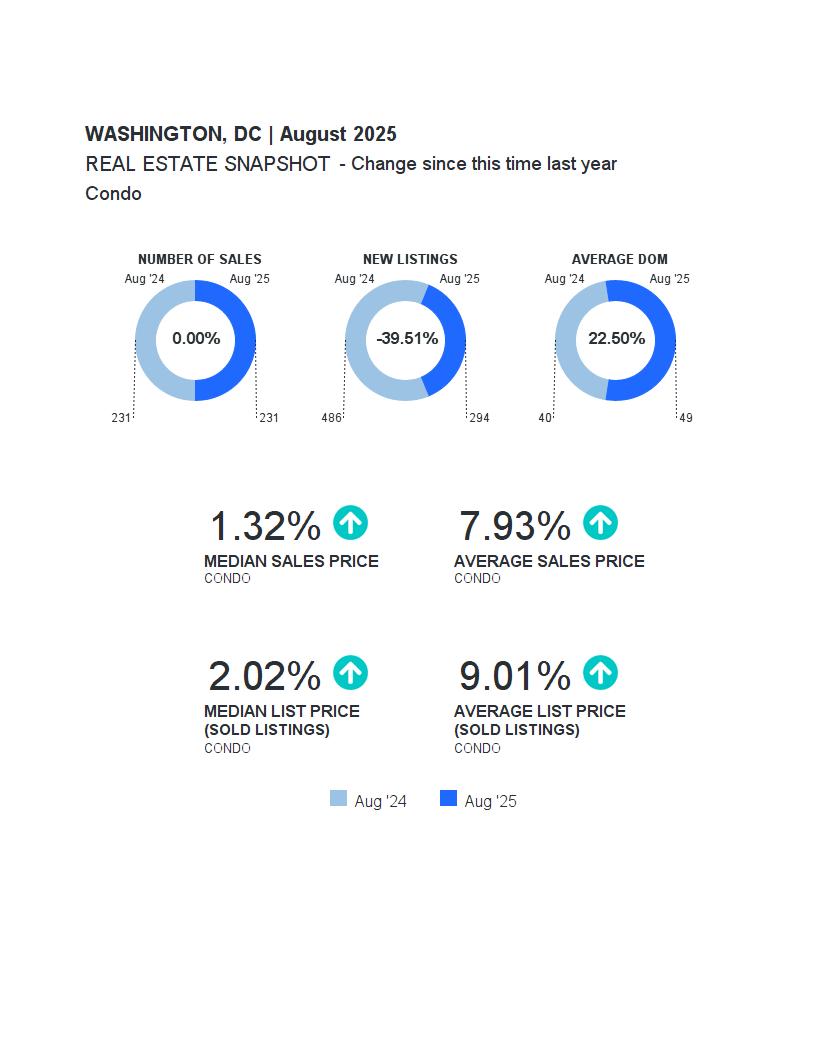
AREA REPORT
WASHINGTON, DC
FULL MARKET SUMMARY
August 2025 | Condo
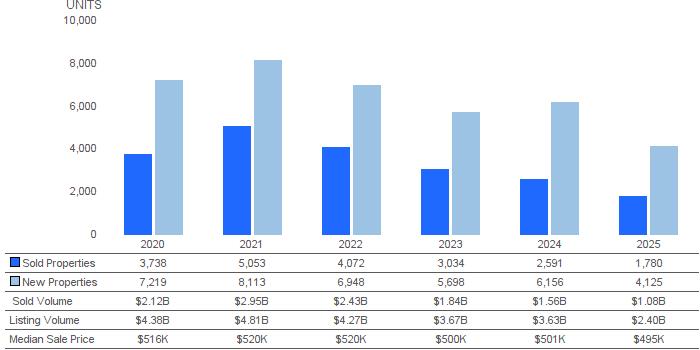
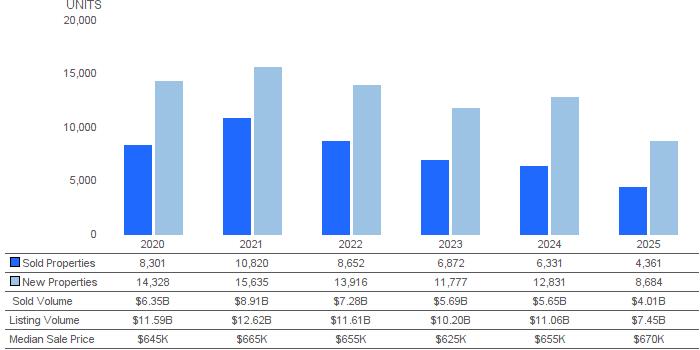
SOLD AND NEW PROPERTIES (UNITS)
August 2025 | Condo Sold Properties| Number of properties sold during the year New Properties | Number of properties listed during the year.
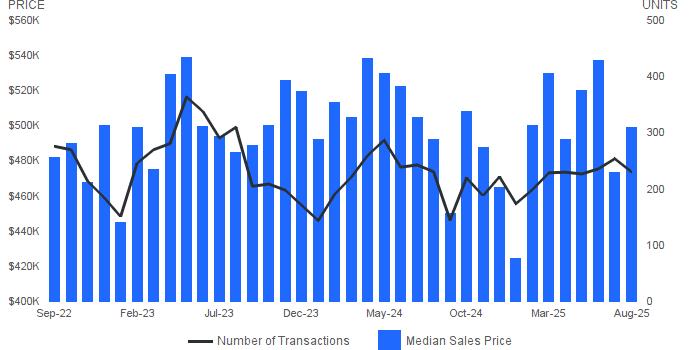
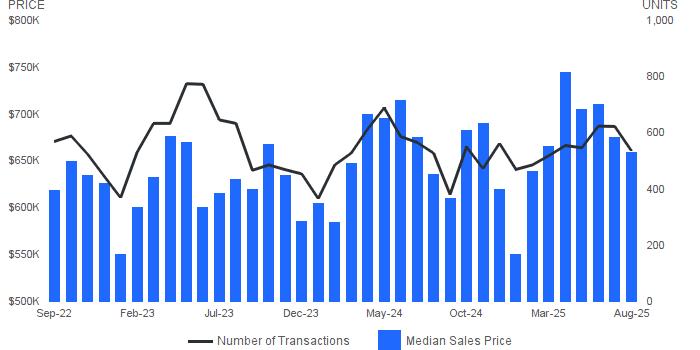
MEDIAN SALES PRICE AND NUMBER OF SALES
August 2025 | Condo
Median Sales Price | Price of the ""middle"" property sold -an equal number of sales were above and below this price. Number of Sales | Number of properties sold.
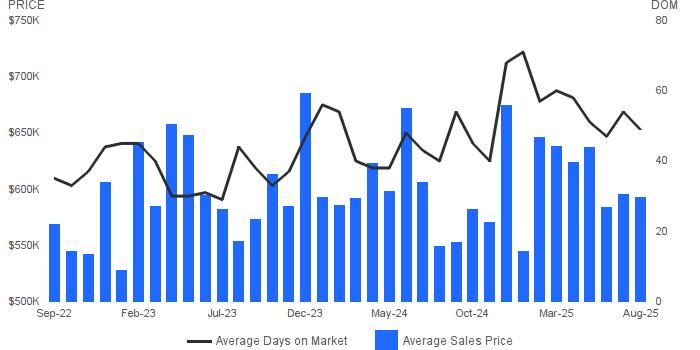
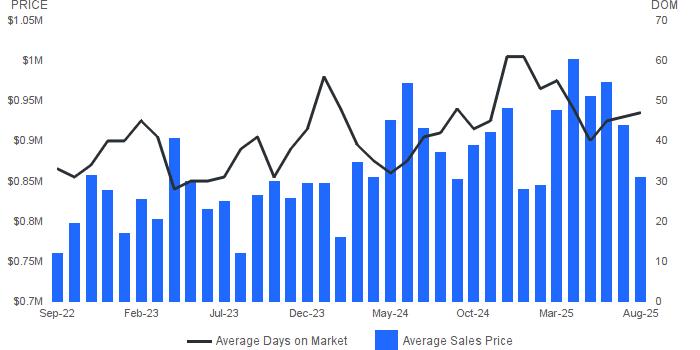
AVERAGE SALES PRICE AND AVERAGE DAYS ON MARKET
August 2025 | Condo
Average Sales Price| Average sales price for all properties sold. Average Days on Market | Average days on market for all properties sold.
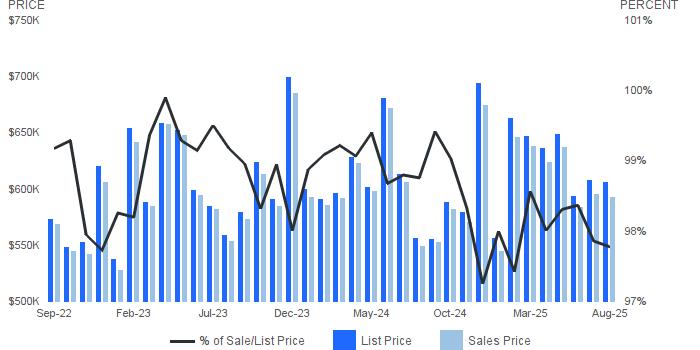
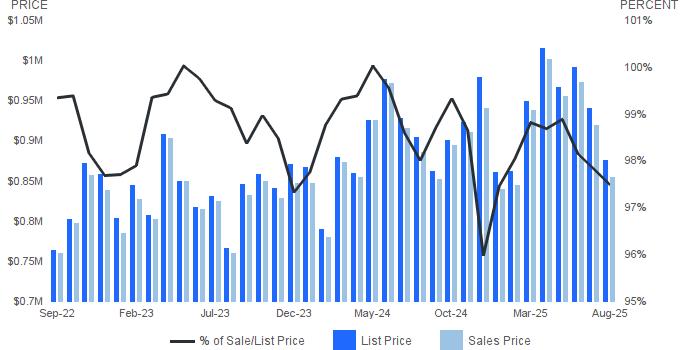
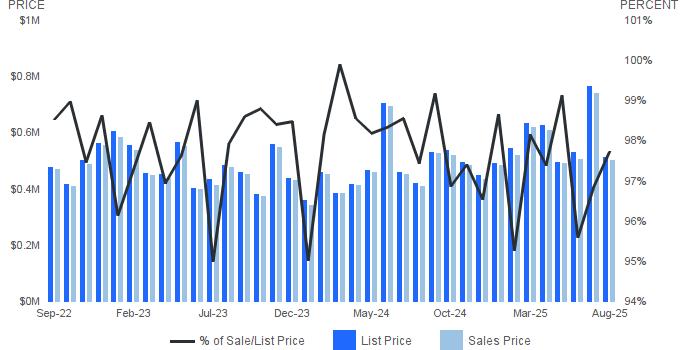
SALES PRICE AS A PERCENTAGE OF ORIGINAL PRICE
August 2025 | Condo
Sale Price as a Percentage of Original Price| Average sale price of property as percentage of final list price.
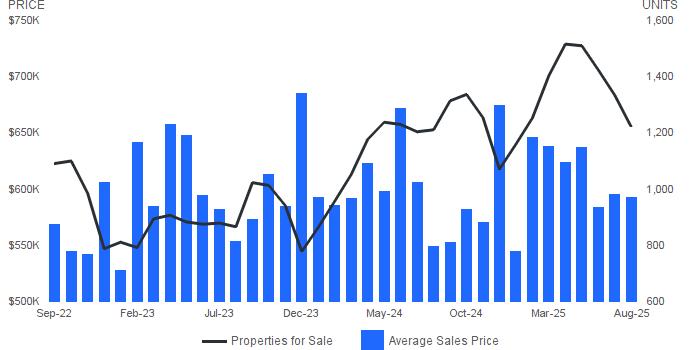
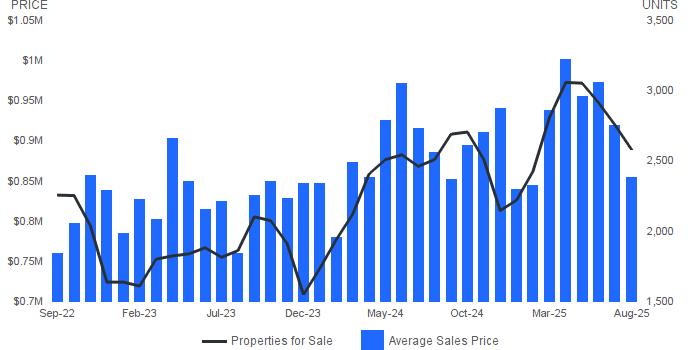
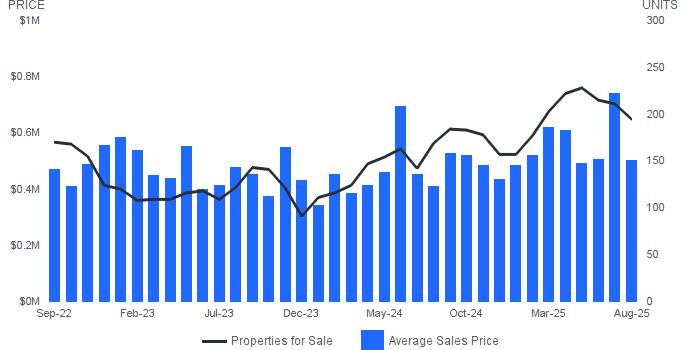
AVERAGE SALES PRICE AND NUMBER OF PROPERTIES FOR SALE
August 2025 | Condo
Average Sales Price| Average sales price for all properties sold. Properties for Sale | Number of properties listed for sale at the end of month.
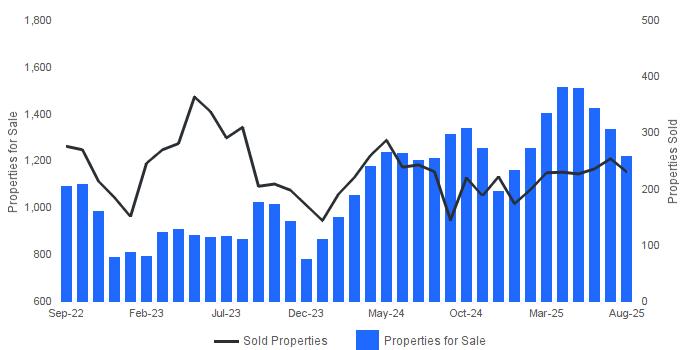
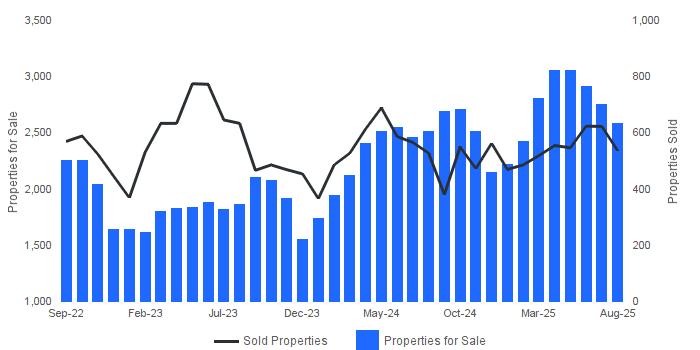
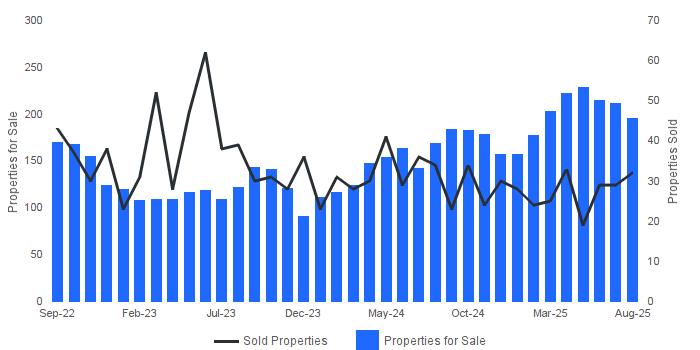
PROPERTIES FOR SALE AND SOLD PROPERTIES
August 2025 | Condo
Properties for Sale | Number of properties listed for sale at the end of month.
Sold Properties| Number of properties sold.
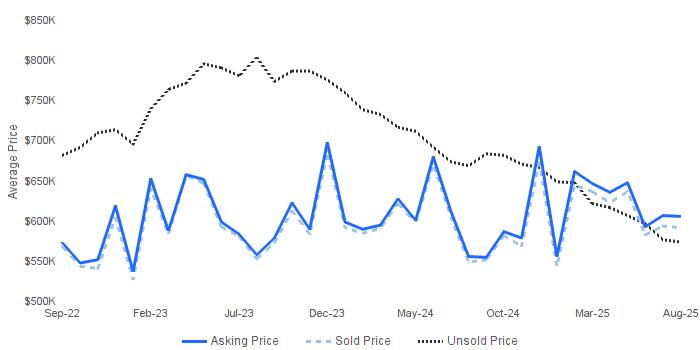
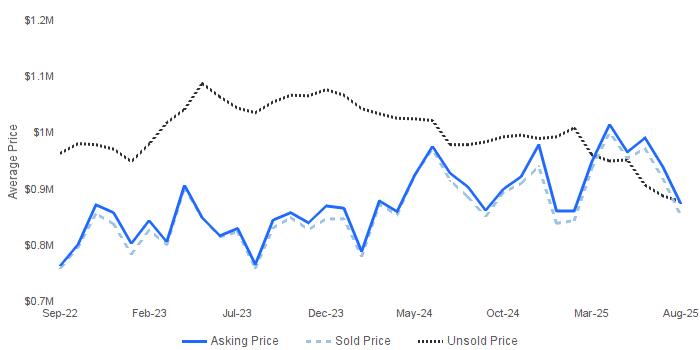
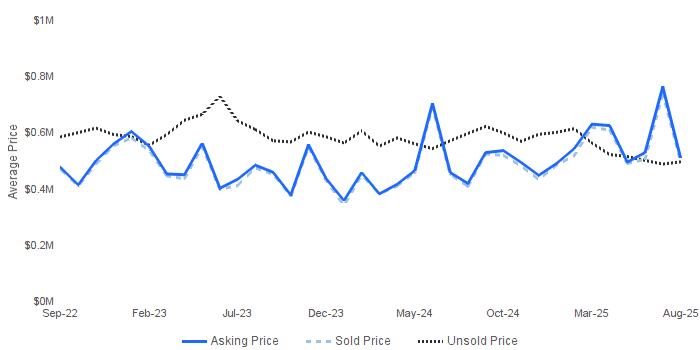
AVERAGE ASKING/SOLD/UNSOLD PRICE
August 2025 | Condo
Asking Price | the average asking price of sold properties
Sold Price | the average selling price
Unsold Price| the average active list price
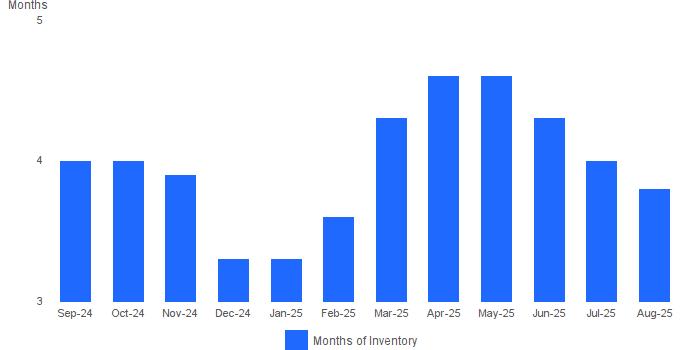
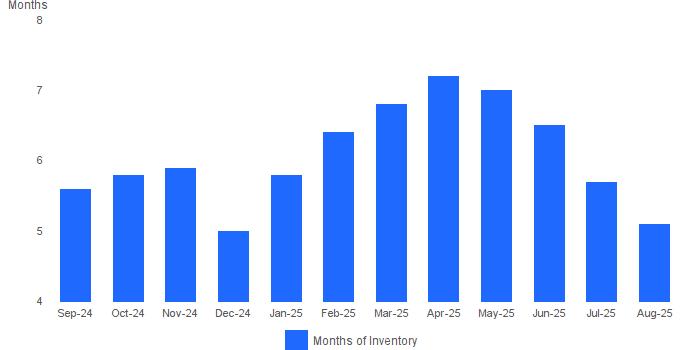
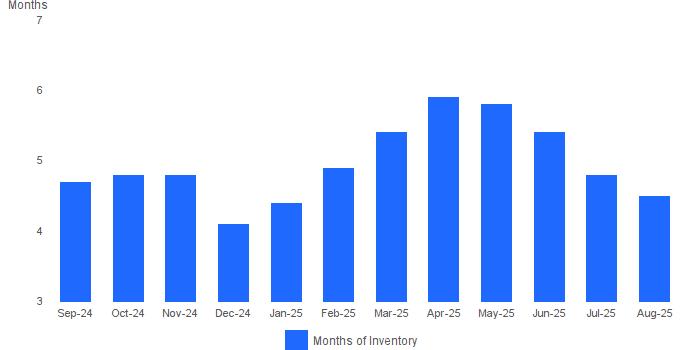
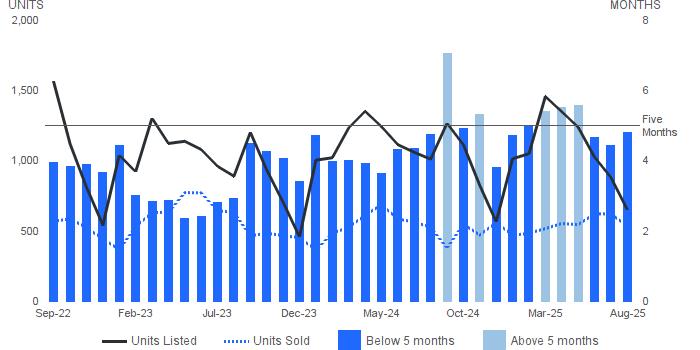
ABSORPTION RATE
August 2025 | Condo
Absorption Rate | Looks at the past year's monthly supply of inventory. In a normal market there should be a 6 month supply. The higher the rate above 6 the more aggressive a seller has to be with the competition; price and having a picture perfect property.
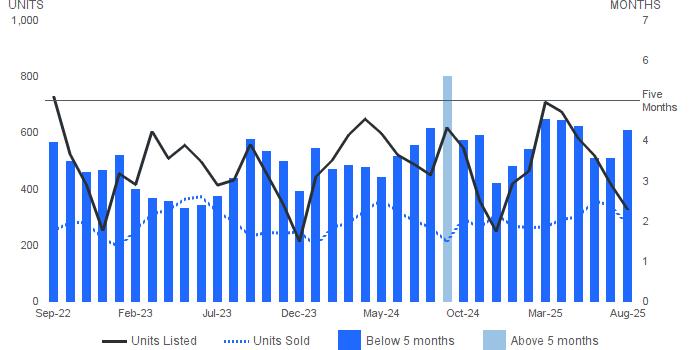
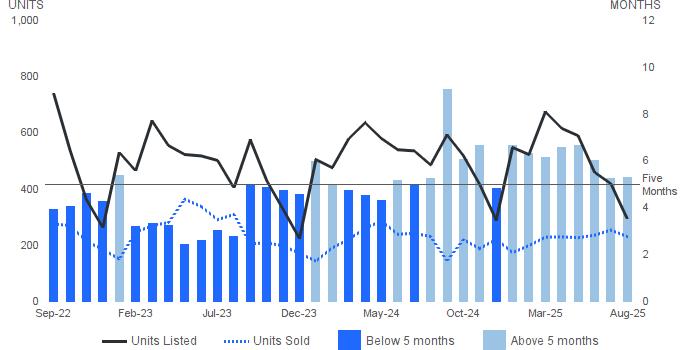
MONTHS SUPPLY OF INVENTORY
August 2025 | Condo
Months Supply of Inventory | Properties for sale divided by number of properties sold.
Units Listed | Number of properties listed for sale at the end of month.
Units Sold| Number of properties sold.
AREA REPORT
Washington, DC
FULL MARKET SUMMARY
August 2025 | All Property Types
SOLD AND NEW PROPERTIES (UNITS)
August 2025 | All Property Types Sold Properties| Number of properties sold during the year New Properties | Number of properties listed during the year.
MEDIAN SALES PRICE AND NUMBER OF SALES
August 2025 | All Property Types
Median Sales Price | Price of the ""middle"" property sold -an equal number of sales were above and below this price. Number of Sales | Number of properties sold.
AVERAGE SALES PRICE AND AVERAGE DAYS ON MARKET
August 2025 | All Property Types
Average Sales Price| Average sales price for all properties sold. Average Days on Market | Average days on market for all properties sold.
SALES PRICE AS A PERCENTAGE OF ORIGINAL PRICE
August 2025 | All Property Types
Sale Price as a Percentage of Original Price| Average sale price of property as percentage of final list price.
AVERAGE SALES PRICE AND NUMBER OF PROPERTIES FOR SALE
August 2025 | All Property Types
Average Sales Price| Average sales price for all properties sold. Properties for Sale | Number of properties listed for sale at the end of month.
PROPERTIES FOR SALE AND SOLD PROPERTIES
August 2025 | All Property Types
Properties for Sale | Number of properties listed for sale at the end of month.
Sold Properties| Number of properties sold.
AVERAGE ASKING/SOLD/UNSOLD PRICE
August 2025 | All Property Types
Asking Price | the average asking price of sold properties
Sold Price | the average selling price
Unsold Price| the average active list price
ABSORPTION RATE
August 2025 | All Property Types
Absorption Rate | Looks at the past year's monthly supply of inventory. In a normal market there should be a 6 month supply. The higher the rate above 6 the more aggressive a seller has to be with the competition; price and having a picture perfect property.
MONTHS SUPPLY OF INVENTORY
August 2025 | All Property Types
Months Supply of Inventory | Properties for sale divided by number of properties sold.
Units Listed | Number of properties listed for sale at the end of month.
Units Sold| Number of properties sold.
AREA REPORT
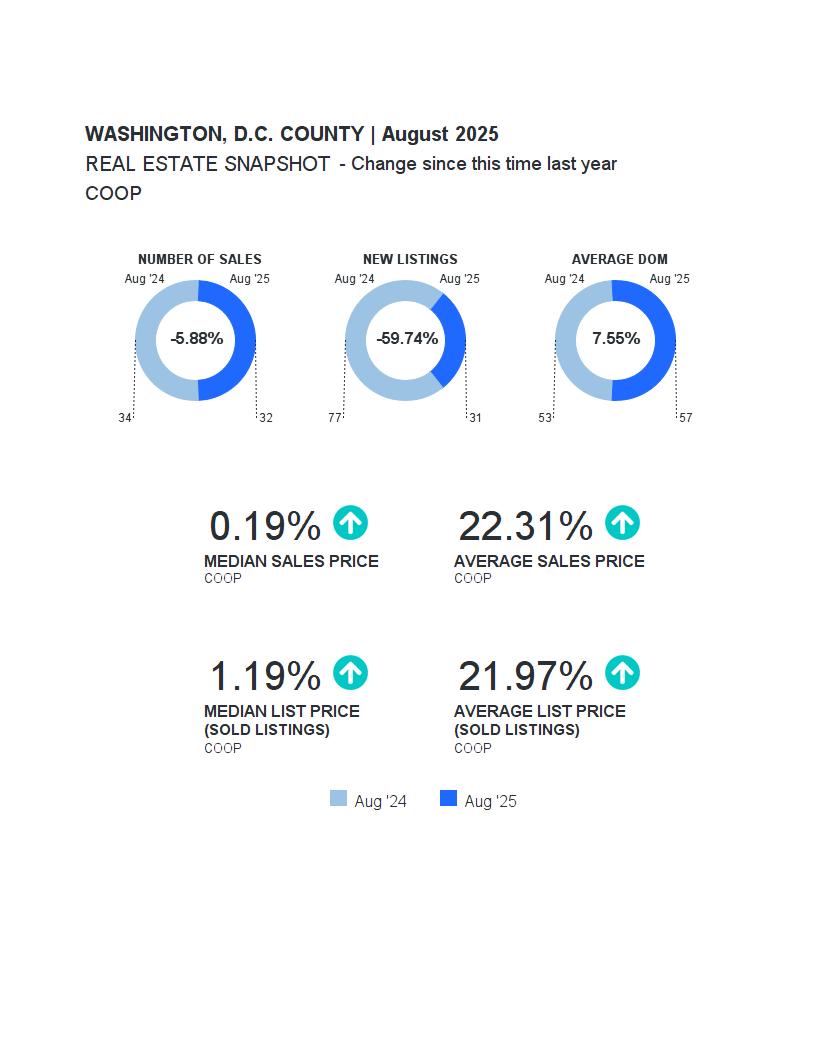
WASHINGTON, D.C. COUNTY
FULL MARKET SUMMARY
SOLD AND NEW PROPERTIES (UNITS)
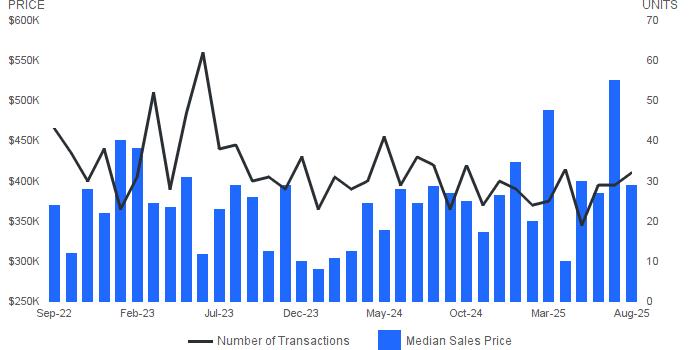
MEDIAN SALES PRICE AND NUMBER OF SALES
August 2025 | COOP
Median Sales Price | Price of the ""middle"" property sold -an equal number of sales were above and below this price. Number of Sales | Number of properties sold.
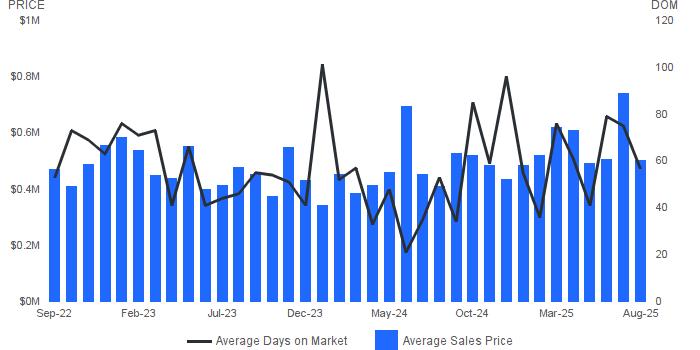
AVERAGE SALES PRICE AND AVERAGE DAYS ON MARKET
August 2025 | COOP
Average Sales Price| Average sales price for all properties sold. Average Days on Market | Average days on market for all properties sold.
SALES PRICE AS A PERCENTAGE OF ORIGINAL PRICE
August 2025 | COOP
Sale Price as a Percentage of Original Price| Average sale price of property as percentage of final list price.
AVERAGE SALES PRICE AND NUMBER OF PROPERTIES FOR SALE
August 2025 | COOP
Average Sales Price| Average sales price for all properties sold. Properties for Sale | Number of properties listed for sale at the end of month.
PROPERTIES FOR SALE AND SOLD PROPERTIES
August 2025 | COOP
Properties for Sale | Number of properties listed for sale at the end of month.
Sold Properties| Number of properties sold.
AVERAGE ASKING/SOLD/UNSOLD PRICE
August 2025 | COOP
Asking Price | the average asking price of sold properties