Washington, D.C. Metro
November 2025 Housing Market Report
Prepared by Bright Research
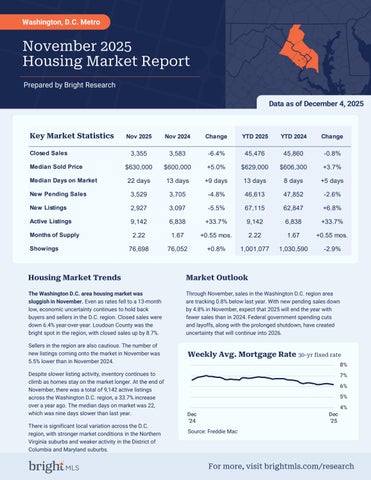
Key Market Statistics
Housing Market Trends
The Washington D.C. area housing market was sluggish in November. Even as rates fell to a 13-month low, economic uncertainty continues to hold back buyers and sellers in the D.C. region. Closed sales were down 6.4% year-over-year. Loudoun County was the bright spot in the region, with closed sales up by 8.7%.
Sellers in the region are also cautious. The number of new listings coming onto the market in November was 5.5% lower than in November 2024.
Despite slower listing activity, inventory continues to climb as homes stay on the market longer. At the end of November, there was a total of 9,142 active listings across the Washington D.C. region, a 33.7% increase over a year ago. The median days on market was 22, which was nine days slower than last year.
There is significant local variation across the D.C. region, with stronger market conditions in the Northern Virginia suburbs and weaker activity in the District of Columbia and Maryland suburbs.

Data as of December 4, 2025
Through November, sales in the Washington D.C. region area are tracking 0.8% below last year. With new pending sales down by 4.8% in November, expect that 2025 will end the year with fewer sales than in 2024. Federal government spending cuts and layoffs, along with the prolonged shutdown, have created uncertainty that will continue into 2026.
Source: Freddie Mac
November 2025
Nov '25 vs. Nov '24
Nov '25 vs. Oct '25
3,355 -6.4% -20.1% (Nov '24: 3,583) (Oct '25: 4,201)
Median Sold Price
2025
Nov '25 vs. Nov '24
Nov '25 vs. Oct '25
$630,000 +5.0% +0.0% (Nov '24: $600,000) (Oct '25: $630,000)
Median Days on Market
22 days +9 days
November 2025
Nov '25 vs. Nov '24
+4 days (Nov '24: 13 days) (Oct '25: 18 days)
Nov '25 vs. Oct '25
November 2025
Nov '25 vs. Nov '24
Nov '25 vs. Oct '25
3,529 -4.8% -18.6% (Nov '24: 3,705) (Oct '25: 4,335)
November 2025
Nov '25 vs. Nov '24
Nov '25 vs. Oct '25
2,927 -5.5% (Nov '24: 3,097) -39.8% (Oct '25: 4,861)
November 2025
Nov '25 vs. Nov '24
Nov '25 vs. Oct '25
9,142 +33.7% -14.2% (Nov '24: 6,838) (Oct '25: 10,661)
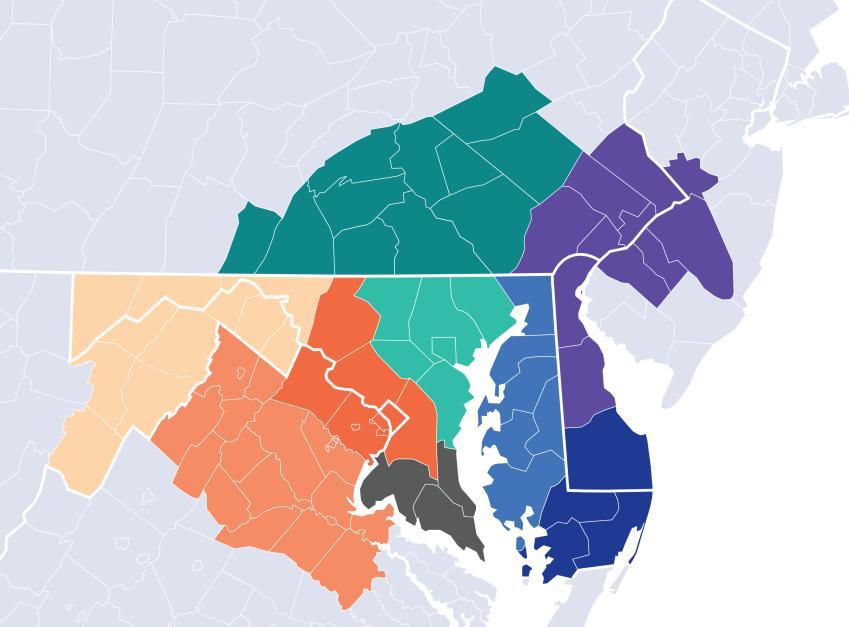
Local Markets
Local Market Map
MD/WV Panhandle
North Central Virginia
Washington D.C., Metro
Central Pennsylvania
Baltimore Metro
Southern Maryland
Maryland Eastern Shore
Philadelphia Metro
Del/Mar Coastal
About Bright MLS
Bright MLS was founded in 2016 as a collaboration between 43 visionary associations and two of the nation’s most prominent MLSs to transform what an MLS is and what it does, so real estate pros and the people they serve can thrive today and into our data-driven future through an open, clear and competitive housing market for all. Bright is proud to be the source of truth for comprehensive real estate data in the Mid-Atlantic, with market intelligence currently covering six states (Delaware, Maryland, New Jersey, Pennsylvania, Virginia, West Virginia) and the District of Columbia.
Please contact Christy Reap, Media Relations Director with interview or information requests:
• (202) 309-9362
• christy.reap@brightmls.com
Market Statistics
1,632 November 2025 +0.2%
Nov '25 vs. Nov '24 (Nov '24: 1,628)
Nov '25 vs. Oct '25 (Oct '25: 2,026)
$799,000
November 2025 +3.1%
Nov '25 vs. Nov '24 (Nov '24: $775,000) -1.4%
Nov '25 vs. Oct '25 (Oct '25: $810,000)
$900,000
$850,000
$800,000
$750,000
$700,000
$650,000
$600,000
$550,000
$500,000
Median Days on Market
21 days
November 2025
+11 days
Nov '25 vs. Nov '24 (Nov '24: 10 days)
+6 days
Nov '25 vs. Oct '25 (Oct '25: 15 days)
New Pending Sales
1,576
November 2025 -1.0%
Nov '25 vs. Nov '24 (Nov '24: 1,592)
Nov '25 vs. Oct '25 (Oct '25: 2,084)
1,171
November 2025 -0.3%
Nov '25 vs. Nov '24 (Nov '24: 1,174) -42.3%
Nov '25 vs. Oct '25 (Oct '25: 2,029)
3,472
November 2025 +40.6%
Nov '25 vs. Nov '24 (Nov '24: 2,469) -16.6%
Nov '25 vs. Oct '25 (Oct '25: 4,164)
About Bright MLS
Bright MLS was founded in 2016 as a collaboration between 43 visionary associations and two of the nation’s most prominent MLSs to transform what an MLS is and what it does, so real estate pros and the people they serve can thrive today and into our datadriven future through an open, clear and competitive housing market for all. Bright is proud to be the source of truth for comprehensive real estate data in the Mid-Atlantic, with market intelligence currently covering six states (Delaware, Maryland, New Jersey, Pennsylvania, Virginia, West Virginia) and the District of Columbia.

Prepared by Bright Research Data as of December 4, 2025
Market Statistics
Nov '25 vs. Nov '24 (Nov '24: 987)
Nov '25 vs. Oct '25 (Oct '25: 1,126)
$592,000
November 2025 +1.2%
Nov '25 vs. Nov '24 (Nov '24: $585,000) -1.3%
Nov '25 vs. Oct '25 (Oct '25: $600,000)
Median Days on Market
23 days
November 2025
+10 days
Nov '25 vs. Nov '24 (Nov '24: 13 days)
+6 days
Nov '25 vs. Oct '25 (Oct '25: 17 days)
New Pending Sales
1,080
November 2025
Nov '25 vs. Nov '24 (Nov '24: 1,083)
Nov '25 vs. Oct '25 (Oct '25: 1,228)
872
November 2025 -1.2%
Nov '25 vs. Nov '24 (Nov '24: 883) -34.3%
Nov '25 vs. Oct '25 (Oct '25: 1,327)
2,235
November 2025 +34.8%
Nov '25 vs. Nov '24 (Nov '24: 1,658) -15.4%
Nov '25 vs. Oct '25 (Oct '25: 2,641)
About Bright MLS
Bright MLS was founded in 2016 as a collaboration between 43 visionary associations and two of the nation’s most prominent MLSs to transform what an MLS is and what it does, so real estate pros and the people they serve can thrive today and into our datadriven future through an open, clear and competitive housing market for all. Bright is proud to be the source of truth for comprehensive real estate data in the Mid-Atlantic, with market intelligence currently covering six states (Delaware, Maryland, New Jersey, Pennsylvania, Virginia, West Virginia) and the District of Columbia.
Market Statistics
756 November 2025
Nov '25 vs. Nov '24 (Nov '24: 968)
Nov '25 vs. Oct '25 (Oct '25: 1,049)
$395,000
November 2025
+5.3%
Nov '25 vs. Nov '24 (Nov '24: $375,000)
+0.0%
Nov '25 vs. Oct '25 (Oct '25: $395,000)
$320,000
$300,000
Median Days on Market
27 days
November 2025
+9 days
Nov '25 vs. Nov '24 (Nov '24: 18 days)
+3 days
Nov '25 vs. Oct '25 (Oct '25: 24 days)
New Pending Sales
873
November 2025
Nov '25 vs. Nov '24 (Nov '24: 1,028)
Nov '25 vs. Oct '25 (Oct '25: 1,022)
882
November 2025 -14.8%
Nov '25 vs. Nov '24 (Nov '24: 1,035) -41.3%
Nov '25 vs. Oct '25 (Oct '25: 1,502)
3,435
November 2025 +26.7%
Nov '25 vs. Nov '24 (Nov '24: 2,711)
-10.9%
Nov '25 vs. Oct '25 (Oct '25: 3,856)
About Bright MLS
Bright MLS was founded in 2016 as a collaboration between 43 visionary associations and two of the nation’s most prominent MLSs to transform what an MLS is and what it does, so real estate pros and the people they serve can thrive today and into our datadriven future through an open, clear and competitive housing market for all. Bright is proud to be the source of truth for comprehensive real estate data in the Mid-Atlantic, with market intelligence currently covering six states (Delaware, Maryland, New Jersey, Pennsylvania, Virginia, West Virginia) and the District of Columbia.