Washington, D.C. Metro
July 2025 Housing Market Report
by

Data as of August 6, 2025
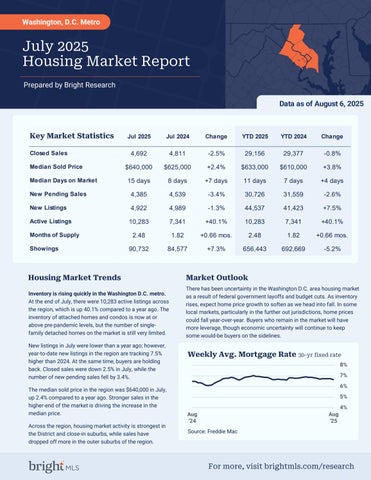
Key Market Statistics
Housing Market Trends Market Outlook
Inventory is rising quickly in the Washington D.C. metro
At the end of July, there were 10,283 active listings across the region, which is up 40.1% compared to a year ago. The inventory of attached homes and condos is now at or above pre-pandemic levels, but the number of singlefamily detached homes on the market is still very limited.
New listings in July were lower than a year ago; however, year-to-date new listings in the region are tracking 7.5% higher than 2024. At the same time, buyers are holding back. Closed sales were down 2.5% in July, while the number of new pending sales fell by 3.4%.
The median sold price in the region was $640,000 in July, up 2.4% compared to a year ago. Stronger sales in the higher-end of the market is driving the increase in the median price.
Across the region, housing market activity is strongest in the District and close-in suburbs, while sales have dropped off more in the outer suburbs of the region.
There has been uncertainty in the Washington D.C. area housing market as a result of federal government layoffs and budget cuts. As inventory rises, expect home price growth to soften as we head into fall. In some local markets, particularly in the further out jurisdictions, home prices could fall year-over-year. Buyers who remain in the market will have more leverage, though economic uncertainty will continue to keep some would-be buyers on the sidelines.
Source: Freddie Mac
July 2025
Jul '25 vs. Jul '24
Jul '25 vs. Jun '25
4,692 -2.5% -7.1% (Jul '24: 4,811) (Jun '25: 5,053)
Median Sold Price
$640,000 +2.4% -1.5% (Jul '24: $625,000) (Jun '25: $650,000)
2025
Jul '25 vs. Jul '24
Jul '25 vs. Jun '25
Median Days on Market
15 days +7 days
Jul '25 vs. Jul '24 July 2025
+3 days (Jul '24: 8 days) (Jun '25: 12 days)
Jul '25 vs. Jun '25
July 2025
Jul '25 vs. Jul '24
Jul '25 vs. Jun '25
4,385 -3.4% -11.8% (Jul '24: 4,539) (Jun '25: 4,972)
July 2025
Jul '25 vs. Jul '24
Jul '25 vs. Jun '25
4,922 -1.3% (Jul '24: 4,989) -6.4% (Jun '25: 5,259)
July 2025
Jul '25 vs. Jul '24
Jul '25 vs. Jun '25
10,283 +40.1% +0.4% (Jul '24: 7,341) (Jun '25: 10,245)
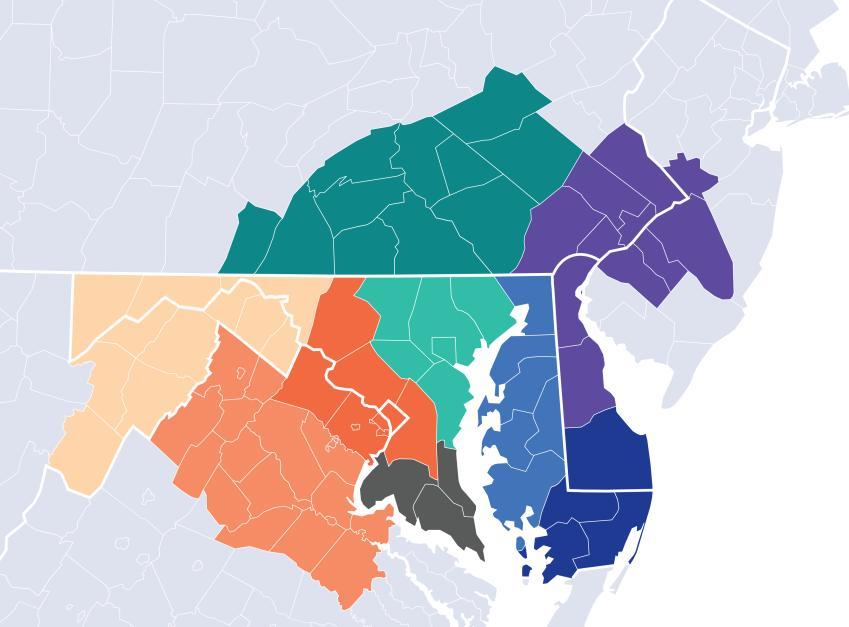
Local Markets
Local Markets
Local Markets
Local Market Map
MD/WV Panhandle
North Central Virginia
Washington D.C., Metro
Central Pennsylvania
Baltimore Metro
Southern Maryland
Maryland Eastern Shore
Philadelphia Metro
Del/Mar Coastal
About Bright MLS
Bright MLS was founded in 2016 as a collaboration between 43 visionary associations and two of the nation’s most prominent MLSs to transform what an MLS is and what it does, so real estate pros and the people they serve can thrive today and into our data-driven future through an open, clear and competitive housing market for all. Bright is proud to be the source of truth for comprehensive real estate data in the Mid-Atlantic, with market intelligence currently covering six states (Delaware, Maryland, New Jersey, Pennsylvania, Virginia, West Virginia) and the District of Columbia.
Please contact Christy Reap, Media Relations Director with interview or information requests:
• (202) 309-9362
• christy.reap@brightmls.com
Prepared by Bright Research Data as of August 6, 2025
Market Statistics
2,200 July 2025 -1.9%
Jul '25 vs. Jul '24 (Jul '24: 2,243)
Jul '25 vs. Jun '25 (Jun '25: 2,418)
$840,000
July 2025 +5.0%
Jul '25 vs. Jul '24 (Jul '24: $800,000) -2.3%
Jul '25 vs. Jun '25 (Jun '25: $860,000)
$900,000
$850,000
$800,000
$750,000
$700,000
$650,000
$600,000
$550,000
$500,000
Median Days on Market
12 days
July 2025
+4 days
Jul '25 vs. Jul '24 (Jul '24: 8 days)
+2 days
Jul '25 vs. Jun '25 (Jun '25: 10 days)
New Pending Sales
2,026
July 2025 -3.1%
Jul '25 vs. Jul '24 (Jul '24: 2,090)
Jul '25 vs. Jun '25 (Jun '25: 2,296)
2,109
July 2025
Jul '25 vs. Jul '24 (Jul '24: 2,111) -8.7%
Jul '25 vs. Jun '25 (Jun '25: 2,311)
4,294 July 2025 +45.7%
Jul '25 vs. Jul '24 (Jul '24: 2,947)
-0.3%
Jul '25 vs. Jun '25 (Jun '25: 4,305)
About Bright MLS
Bright MLS was founded in 2016 as a collaboration between 43 visionary associations and two of the nation’s most prominent MLSs to transform what an MLS is and what it does, so real estate pros and the people they serve can thrive today and into our datadriven future through an open, clear and competitive housing market for all. Bright is proud to be the source of truth for comprehensive real estate data in the Mid-Atlantic, with market intelligence currently covering six states (Delaware, Maryland, New Jersey, Pennsylvania, Virginia, West Virginia) and the District of Columbia.

Prepared by Bright Research Data as of August 6, 2025
1,282 July 2025
Jul '25 vs. Jul '24 (Jul '24: 1,285)
Jul '25 vs. Jun '25 (Jun '25: 1,370)
$600,000
July 2025 -1.2%
Jul '25 vs. Jul '24 (Jul '24: $607,000) -3.2%
Jul '25 vs. Jun '25 (Jun '25: $620,000)
Median Days on Market
13 days
July 2025
+6 days
Jul '25 vs. Jul '24 (Jul '24: 7 days)
+2 days
Jul '25 vs. Jun '25 (Jun '25: 11 days)
New Pending Sales
1,168
July 2025
Jul '25 vs. Jul '24 (Jul '24: 1,261)
Jul '25 vs. Jun '25 (Jun '25: 1,390)
1,337 July 2025 -3.5%
Jul '25 vs. Jul '24 (Jul '24: 1,386) -10.5%
Jul '25 vs. Jun '25 (Jun '25: 1,494)
2,479 July 2025
+40.1%
Jul '25 vs. Jul '24 (Jul '24: 1,769)
+1.6%
Jul '25 vs. Jun '25 (Jun '25: 2,439)
About Bright MLS
Bright MLS was founded in 2016 as a collaboration between 43 visionary associations and two of the nation’s most prominent MLSs to transform what an MLS is and what it does, so real estate pros and the people they serve can thrive today and into our datadriven future through an open, clear and competitive housing market for all. Bright is proud to be the source of truth for comprehensive real estate data in the Mid-Atlantic, with market intelligence currently covering six states (Delaware, Maryland, New Jersey, Pennsylvania, Virginia, West Virginia) and the District of Columbia.
Market Statistics
1,210 July 2025 -5.5%
Jul '25 vs. Jul '24 (Jul '24: 1,280)
Jul '25 vs. Jun '25 (Jun '25: 1,263)
Data as of August 6, 2025
$399,000
July 2025
+2.7%
Jul '25 vs. Jul '24 (Jul '24: $388,500)
+2.3%
Jul '25 vs. Jun '25 (Jun '25: $390,000)
$420,000
$400,000
$380,000
$360,000
$340,000
$320,000
$300,000
Median Days on Market
23 days
July 2025
+11 days
Jul '25 vs. Jul '24 (Jul '24: 12 days)
+4 days
Jul '25 vs. Jun '25 (Jun '25: 19 days)
New Pending Sales
1,191
July 2025
+0.3%
Jul '25 vs. Jul '24 (Jul '24: 1,187)
Jul '25 vs. Jun '25 (Jun '25: 1,284)
1,474
July 2025 -1.1%
Jul '25 vs. Jul '24 (Jul '24: 1,491) +1.5%
Jul '25 vs. Jun '25 (Jun '25: 1,452)
3,510
July 2025
+33.7%
Jul '25 vs. Jul '24 (Jul '24: 2,625)
+0.3%
Jul '25 vs. Jun '25 (Jun '25: 3,501)
About Bright MLS
Bright MLS was founded in 2016 as a collaboration between 43 visionary associations and two of the nation’s most prominent MLSs to transform what an MLS is and what it does, so real estate pros and the people they serve can thrive today and into our datadriven future through an open, clear and competitive housing market for all. Bright is proud to be the source of truth for comprehensive real estate data in the Mid-Atlantic, with market intelligence currently covering six states (Delaware, Maryland, New Jersey, Pennsylvania, Virginia, West Virginia) and the District of Columbia.