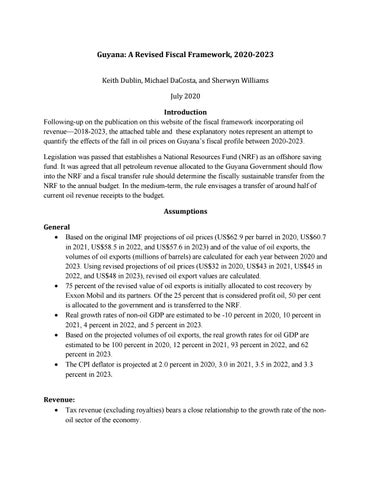
Guyana: A Revised Fiscal Framework, 2020-2023 Keith Dublin, Michael DaCosta, and Sherwyn Williams July 2020 Introduction Following-up on the publication on this website of the fiscal framework incorporating oil revenue—2018-2023, the attached table and these explanatory notes represent an attempt to quantify the effects of the fall in oil prices on Guyana’s fiscal profile between 2020-2023. Legislation was passed that establishes a National Resources Fund (NRF) as an offshore saving fund. It was agreed that all petroleum revenue allocated to the Guyana Government should flow into the NRF and a fiscal transfer rule should determine the fiscally sustainable transfer from the NRF to the annual budget. In the medium-term, the rule envisages a transfer of around half of current oil revenue receipts to the budget. Assumptions General • Based on the original IMF projections of oil prices (US$62.9 per barrel in 2020, US$60.7 in 2021, US$58.5 in 2022, and US$57.6 in 2023) and of the value of oil exports, the volumes of oil exports (millions of barrels) are calculated for each year between 2020 and 2023. Using revised projections of oil prices (US$32 in 2020, US$43 in 2021, US$45 in 2022, and US$48 in 2023), revised oil export values are calculated. • 75 percent of the revised value of oil exports is initially allocated to cost recovery by Exxon Mobil and its partners. Of the 25 percent that is considered profit oil, 50 per cent is allocated to the government and is transferred to the NRF. • Real growth rates of non-oil GDP are estimated to be -10 percent in 2020, 10 percent in 2021, 4 percent in 2022, and 5 percent in 2023. • Based on the projected volumes of oil exports, the real growth rates for oil GDP are estimated to be 100 percent in 2020, 12 percent in 2021, 93 percent in 2022, and 62 percent in 2023. • The CPI deflator is projected at 2.0 percent in 2020, 3.0 in 2021, 3.5 in 2022, and 3.3 percent in 2023. Revenue: • Tax revenue (excluding royalties) bears a close relationship to the growth rate of the nonoil sector of the economy.
2
• • •
Royalties are calculated as 2 percent of gross earnings of the oil companies or as 2 percent of the total value of oil exports. Non-tax revenue (excluding oil revenue) is projected to increase by 5 percent in each year between 2020 and 2023 to which oil revenue is added. Of the amount transferred to the NRF, approximately 50 percent goes as oil revenue to the government budget. The remaining 50 percent is retained in the NRF as savings.
Current Expenditure: • Wages are assumed to increase by 5 percent in 2020, and by 12 percent in each year between 2021 and 2023. • The provision of “other goods and services” which is estimated to be 7.2 percent of GDP in 2019 is projected to increase to 9 percent of non-oil-GDP in 2020, 2021, 2022, and 2023. • It is assumed that interest payments in each year are equivalent to 2 percent of the outstanding debt at the end of the previous year. This assumption is based on the effective rate of interest that was calculated for 2019. • Non-oil transfers are closely linked to the evolution of non-oil GDP. They are projected to increase by 6 percent a year in 2020-2023. • It is assumed that there is a policy objective to provide each of the estimated 200,000 households in the country with annual transfers financed from oil revenue that, at a minimum, are equivalent to US$ 500 per year by 2022.The cost of such transfers would be equivalent to G$21 billion in that year. Transfers would be less in 2020 and 2021. Given the projected level of oil revenue starting in 2023, it is assumed that transfers from oil revenue can be increased to a level in excess of US$900 per family annually. Capital Expenditure: • •
•
The foreign-financed public sector investment program (PSIP) between 2020-2023 is loosely based on the ratios to GDP documented in the IMF 2019 Article IV staff Report. The PSIP financed from local sources is estimated to be 5.3 percent of GDP in 2019. Given the limitations on other sources of financing, the PSIP financed from local resources is assumed to increase to 6 percent of non-oil GDP in 2020-2023. In principle, the policy objective for capital expenditure that is exclusively financed with oil revenue is to allocate the major share of these resources to financing capital projects. However, given the likely pressures to use oil revenue to address pressing social needs in the short-term, it is likely that the extent of the oil financed PSIP in 2020-2022 will be determined after resources are allocated to other pressing commitments. Given absorption constraints, it is projected that oil-financed projects are limited to G$45 billion by 2023.
3
Highlights of the table Current Expenditure: • A significant proportion on oil revenue is devoted to providing oil-related transfers in each year between 2020-2023 due to pressing social needs. Capital Expenditure: • Capital expenditure increases by an average of 20 percent annually during the projection period. A significant proportion of this expenditure would be financed by oil revenue. Overall Balance • After increasing to about 8 percent of GDP in 2020, the overall deficit declines in each subsequent year to about 5 percent of GDP in 2023. Financing • It is expected that the financing requirement will be met mainly from domestic sources. Debt • The stock of debt declines as a percentage of GDP, falling from 54 percent of GDP in 2020 to 36 percent of GDP in 2023. GDP •
GDP per capita is projected to more than double between 2020 and 2023, increasing from US$6,188 in 2020 to US$13,747 in 2023.
4
Guyana--A Revised Fiscal Framework, 2020-2023 (In billions of Guyana dollars) 2018 2019 Total Revenue and Grants Total Tax Revenue including Royalties Tax Revenue Royalties Non-tax Revenue of which: oil revenue
2023
14.7 0.0
328.8 259.2 243.7 15.5 65.4 48.4
391.9 285.1 258.3 26.7 101.4 83.5
10.2
11.2
9.3
8.1
4.2
5.5
199.7 59.5 51.3 8.5 80.4 0.0
223.0 70.2 61.0 8.7 83.1 0.0
252.2 73.7 70.4 9.5 88.1 10.5
277.3 82.6 79.8 11.1 93.4 10.5
311.1 92.5 85.9 12.8 99.0 21.0
355.1 103.6 93.3 14.8 104.9 38.5
Operating Balance Operating balance as percent of GDP
27.2 3.4
26.5 3.1
-3.0 -0.3
8.6 0.7
17.7 1.0
36.8 1.6
Capital Expenditure External PSIP Local PSIP Oil Financed Projects Capital Expenditure as a percent of GDP
55.1 19.9 35.2 0.0 6.8
69.3 24.1 45.2 0.0 8.1
76.2 23.9 47.0 5.4 7.3
94.6 27.9 53.2 13.5 7.4
117.5 32.9 57.3 27.4 6.8
142.8 35.6 62.2 45.0 6.0
-27.9 -3.5 27.9 8.0 19.9
-42.8 -5.0 42.8 8.7 34.1
-79.2 -7.6 79.2 14.5 64.7
-86.0 -6.8 86.0 12.7 73.3
-99.8 -5.8 99.8 17.3 82.6
-106.0 -4.5 106.0 21.4 84.7
68.3
65.5
806 806
852 852
32.0 38 1,210 302 151 76 76 76 1037 783
43.0 42 1,826 456 228 114 114 190 1270 887
45.0 82 3,690 922 461 231 231 420 1729 954
48.0 133 6,361 1,590 795 398 398 818 2373 1037
212
214
210
210
210
210
8,233 814 10,115 741 43
11,300 822 13,747 847 36
Overall Balance Overall balance as a percent of GDP Financing Net External Financing Net Domestic Financing Memorandum items & assumptions Oil Price Projections, revised (US$/bl) Implicit volumes (in millions of barrels) Revised Oil Exports (US$ millions). Oil profit (US$ millions) Government share of oil profit (US $ millions) in NRF Transfers to the Government Budget from the NRF Additions to the NRF after budget transfers Accumulated savings in the NRF (US$ millions) Nominal GDP (G$ billion) Non-oil GDP Exchange Rate (G$ per US$, end of period)
18.2 0.0
2022
285.9 237.6 229.9 7.7 40.2 24.0
Current Expenditure Wages Other goods and Services Interest Transfers (excluding oil transfers) Oil-related Transfers
249.5 223.6 223.6
2021
249.2 208.6 203.5 5.1 31.3 15.9
Grants
226.9 198.5 198.5
2020
GDP in US$ millions 3,802 3,981 4,938 6,048 Population (thousands) 782 790 798 806 GDP per capita US$ 4,862 5,040 6,188 7,503 Stock of debt in G$ billion 433 476 555 641 Stock of debt as a percentage of GDP 54 56 54 50 Sources: Budget Speech, Minister of Finance, November 2018; National Accounts Statistics, IMF; Bureau of Statistics; and GEAG estimates and projections.