


The Northern Gulf Natural Resource Management (NRM) region is a special place. Home to more than 9,000 people, it has some of the most intact savannahs on the globe, supporting diverse industry, amazing plant and animal diversity across unique landscapes – from rainforests up in the clouds across wide grasslands to the incredible Gulf of Carpentaria. The Gulf’s waters have rich and diverse species, and the lands produce an enormous array of food and fibre for our tables and exports.
With just 0.2% of the Queensland State population, the regional economy is rural, based on four principal activities –agriculture (including grazing and horticulture), fishing, mining and tourism. Total agricultural production from the regions varies between $600M and $750M per year, with total cropping some $150-$200M and livestock contributing $400-$600M annually.
The region has a long history. Indigenous peoples have been custodians of country for millennia. More recently, people seeking minerals (gold, tin) came to the region in the early 1800’s, with grazing developing in the mid-late 1800’s, and agriculture in the early 1900’s.
Despite this history, the region is very data-poor. It is one of the least studied and understood regions of our country. Reliable data with adequate spatial and temporal coverage is especially critical for good decision making in NRM, where patterns of change are measured in decades, and implications for management changes may play out over many of decades.
In 2022, Gulf Savannah NRM was successful in obtaining a grant from the Department of Resources Natural Resource Recovery Program – Innovative Data Collection to Support Informed Decision Making for NRM Stakeholders (2022/NRRP000054).
This project aimed to augment more traditional data sources by drawing on local community knowledge and learnings of NRM issues to inform future decision making. By access the lived experience, especially of long term, often multigenerational families, the project sought to understand what has come before.
There is no consistent source of this experience, and little of it has been written down. The project therefore used a semi-structured interview technique to access this oral history, illicit information regarding land management practices, land condition, biodiversity trends and community concerns from local people with an intimate knowledge of the local landscape.
The use of oral histories to access pre-recorded data, especially relating to environmental data is not a new concept. Previous works in North Queensland have used oral histories to examine perceptions of environmental change (Lankester, 2006) and farming practice (Lankester, 2012) Internationally, oral histories have also been a rich source of information to contextualise (Olson & da Silva, 2024) or even challenge modern data (Harvey & Riley, 2005). However, its application in the Gulf Savannah Region to translate the available information into a framework supporting future decision making is innovative.
Across 2023 and early 2024, 122 Interviews, encompassing some 1,000hrs of effort generated more than 200 hours of recorded interviews. This report presents an outline of the approach, the results and recommendations for future use of this information and improvements for similar works of this nature.
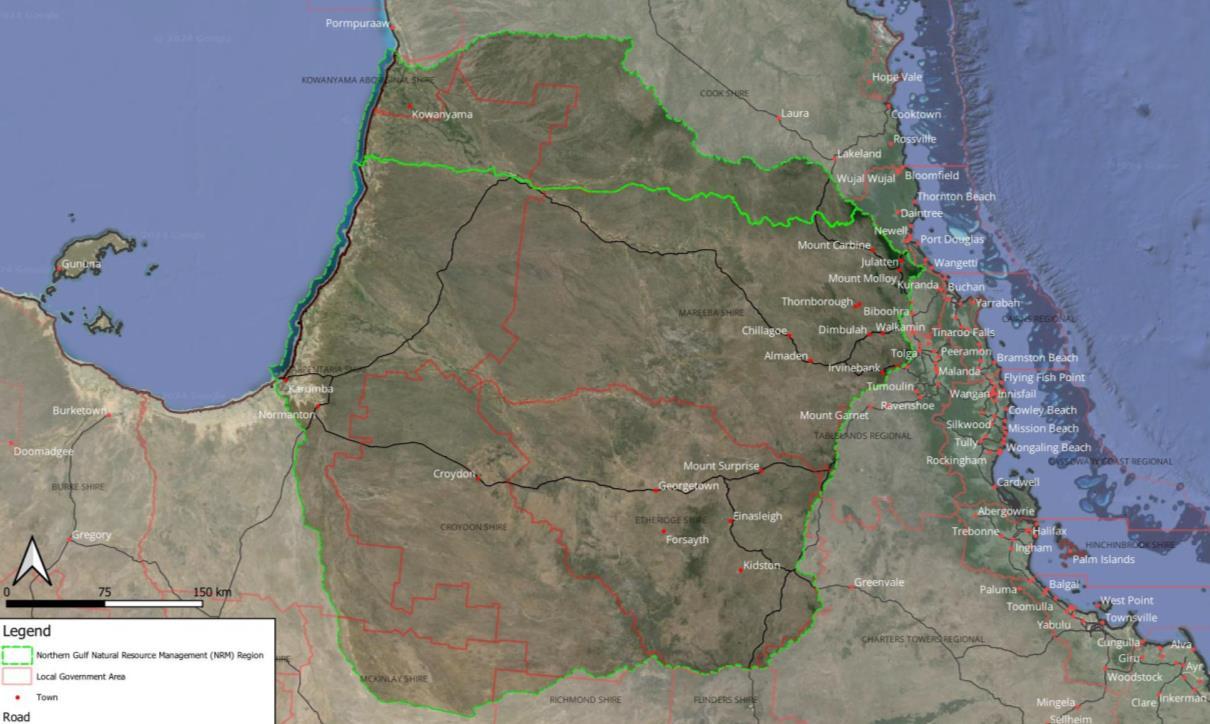
The Northern Gulf NRM region (Study Area) is extensive, covering an area of approximately 196,100km2, which is about 90% the size of Victoria. Twelve local government authorities have coverage within the Northern Gulf NRM region – Carpentaria, Cook, Croydon, Etheridge, Kaowanyama and Mareeba being the principal local government areas, with small areas of Charters Towers, Douglas, Flinders, McKinlay, Richmond and Tablelands also included.
The Study Area is approximately 450km east to west, and 550km north to south.
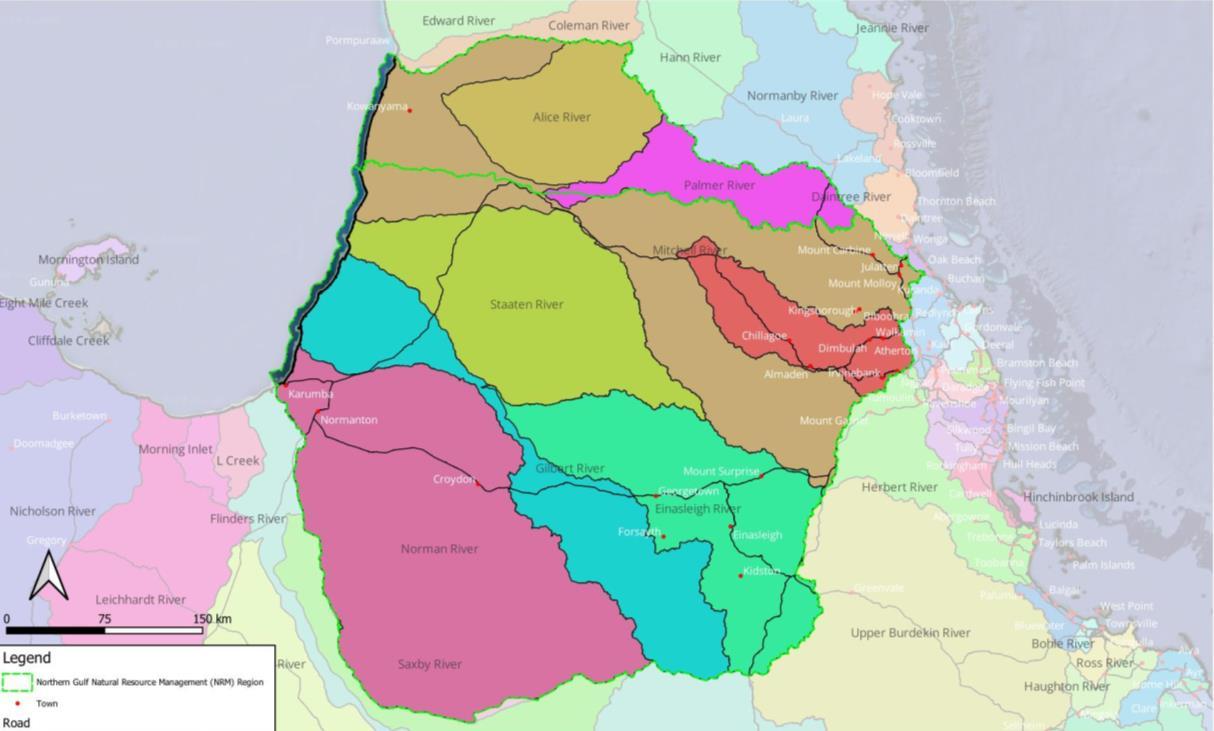
It includes the catchments of the Norman, Gilbert, Staaten, Mitchell and Staaten rivers, all of which flow west into the Gulf of Carpentaria (Figure 1 2). The topography of the Study Area varies markedly from approximately 1,300m in the east (Great Dividing Range) to the Gulf of Carpentaria (Sea Level) in the far west.
The vast majority of the Northern Gulf NRM region (~84%) is currently used for extensive beef cattle grazing properties, with ~11% Conservation and Natural Environments (National Parks and private Nature Refuges). The region supports extensive agricultural areas, especially in the Mareeba Dimbulah Irrigation Area (MDIA).
There are currently population clusters in the Upper Mitchell catchment and along the Gulf coast, with a dispersed network of small, remote townships. About 56% of the current population lives within the Mareeba Shire (especially within the township of Mareeba, the largest in the region), 21% in Carpentaria Shire, ~11% Kowanyama, 8.5% Etheridge and ~3% in Croydon Shire. About 18% of the population of the Study Area identifies as Aboriginal, Torres Strait Islanders or both, compared to the Queensland State average of just 4%.
A qualified and experienced social scientist was engaged to provide guidance on the project establishment, participant selection and engagement, carriage of interviews and subsequent data collation and analysis. Key aspects considered in the design were:
• Inclusion of participants from a cross-section of occupations, backgrounds, relationship to the region
• Design of a semi-structured interview framework which provided consistent coverage of the key aspects of interest (Land Management, Climate, Biodiversity and future NRM needs – See Section 8), whilst allowing freedom for the interviewee to tell their story.
• Approach and selection of participants, ensuring these did not feel pressured to engage and understood clearly the process, data collected, its intended use and ownership.
• Planning, carriage and recording of the interviews in a consistent fashion
• Review, collation of key aspects and data analysis.
The target participants were principally those people with long term (20+yrs, but ideally 40+ yrs) connection to the area, either living here now or having lived and/or worked in the Study Area
Initial project participants were discovered using multiple existing contacts databases of the Gulf Savannah NRM. However, to avoid a bias by selecting those people already engaged in NRM issues, additional contacts were sought. Multiple avenues were used to discover additional project participants, especially asking interviewees if they could recommend other people that had a long history with the region. This included following the breadcrumb trail of prospective interviewees.
Identified possible project participants were contacted either by phone or e-mail, the project explained, and asked if they would be able to participate. Approximately 66% of people contacted engaged further with the project. Staff conducting the interviews (either employed or project-contracted) identified themselves as being associated with Gulf
Savannah NRM, rather than an independent entity. It may be useful to explore further the reasons for this relatively low participation rate (See Section 5, Recommendations).
Once timing, location and interview format were established, the interview was conducted. Where previously agreed with the participant, interviews were recorded (notes only, audio only, video). The interviewer used the semistructured framework (see Section 8) to guide the interview, but allowed the interviewee to guide progress and content.
In addition, copies of any data sources held by the participant and discussed during the interview, were gathered. This included historical images, long-term rainfall records, diaries, notes and data as available.
As soon as practical, the interviewer transcribed their written notes into a summary format and saved all material (interview, consent forms, written interview notes, interview summary and any provided data) to the Gulf Savannah NRM servers for security (see Section 9 Guidance note).
A database was constructed to capture interview data. This was in three main sections:
• information about the interview (where, when, who, how),
• information about the interviewee (age class, sex, indigenous status, years connected to the region, sector most connected to) and
• a series of qualitative questions on key aspects of the project (Has the local climate, land management and biodiversity changed, and how). It should be noted that these questions were generally not asked directly of the interviewee, and the outcome was interpreted.
The summary document for each interview was then reviewed and recorded into the database. Where there was ambiguity on the data recorded, or points were not clear, the original interview material (notes/audio/video) was reviewed. Where points remained unclear, they were recorded as such (Not Stated/Not Specified).
In addition, important statements or information from the interviewee which pointed to perceptions on one of the key areas (Land Management, Climate, Biodiversity and Future NRM needs) was collated into a table – Key Statements
The Key Statements were then reviewed and cross referenced to determine themes from multiple participants. Each was recorded against the original source, or where originating from multiple participants, listed each participant1 The list of Key Statements was then reviewed several times to collate into common themes.
The possible use of the Key statement and likely cross-check data sources was recorded.
1 The full report containing participants names and cross-reference to interview material is retained by Gulf Savannah NRM This version has personal details removed.
During the project, 122 Interviews were conducted, encompassing some 1,000hrs of effort generated more than 200 hours of recorded interviews.
The interview process was labour and time intensive. Table 3.1 outlines average effort per interview.
Table 3 1: Typical Effort per Interview
Participant engagement Identification, contact, follow-up and successful engagement 1-1.5
Interview
• initial contact - 0.25hr
• Travel – 1-4hrs*
• Interview 1-1.5hrs
• Interview close-out with participant 0.5hr
• Data upload to server - 0.5-0.75hr
• Interview Summary – 1.5-2hrs 4.75-9hrs
Data Analysis and Reporting
• Review Interview Summary, extract participant and perception data, Key Statements and quotes, reviewing original material as required to verify - 0.5-1.5hrs.
• Data and Key Statement Collatation – 0.5 1-2hrs
Total/Interview 6.75 – 12.5 hrs
Total 120 Interviews 810 – 1,500 hrs
Approx 110 – 210 person/days FTE
* An emphasis was placed on face-to-face interviews where possible given project aims, NRM engagement and age class of participants. However, the Study Area is vast, coordination with multiple stakeholders difficult and travel can easily add 2-4hrs/interview. A secondary option was video conferencing (Teams), followed by teleconference. Where possible, staff located in regions were used for interviews which alleviated travel times, but did provide issues with interview consistency, see Section 5
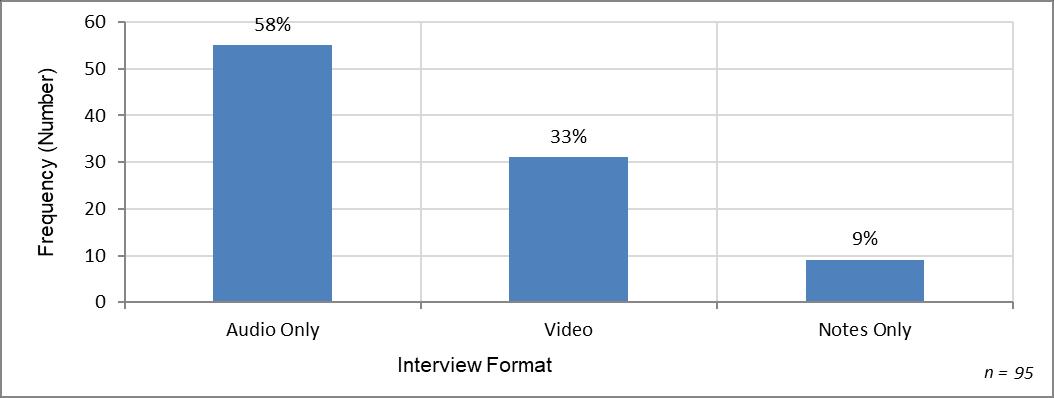
122 people participated in the Study. 82% of interviews were conducted face-to-face, with only 18% conducted over with video or telephone, reflecting the intentional bias for this format (Figure 3.1). A little over half of the interviews were recorded as Audio Only, with ~33% of interviews video recorded (Figure 3 2). Study Participants were given the option of video or audio, and most preferred the latter. Several participants requested the interview was not recorded in any format, and a percentage requested to see the summary notes before these were included in the study. Whilst only a minor proportion of the Study Participants (~1:10), this could be a trust issue and a point for possible future investigation (See Section 5). As the interviews were largely recorded to provide an opportunity to review the discussion in more detail in creating the interview summary document, it is not felt that the video/audio choice unduly impacted the results (see Section 5)

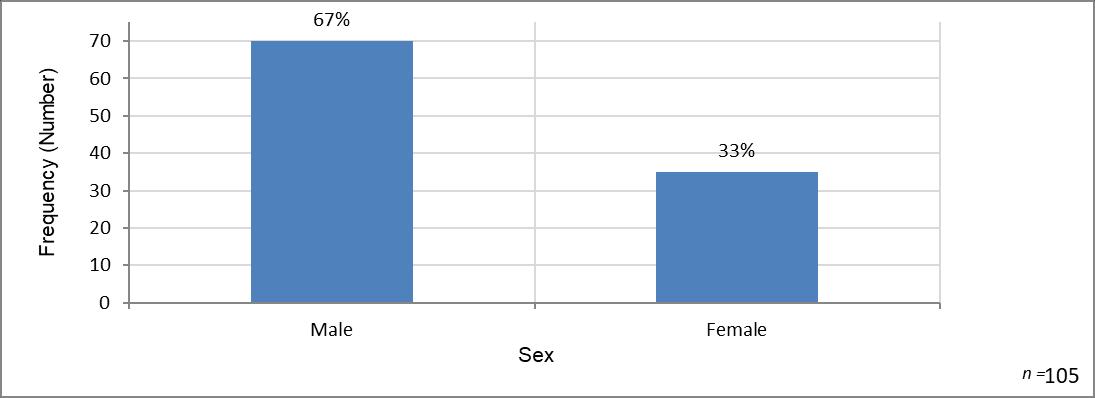
Slightly less than 70% of the participants were male, with just 33% female (Figure 3.3). This potentially represents a bias in the views presented as it does not reflect the regional population percentages(~50:50). However it potentially reflects the historical societal view of “land managers” in the target age group of the study
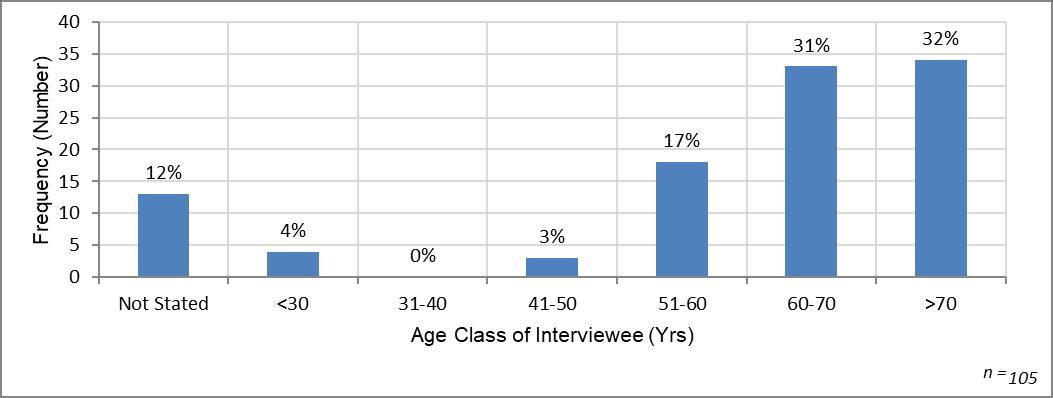
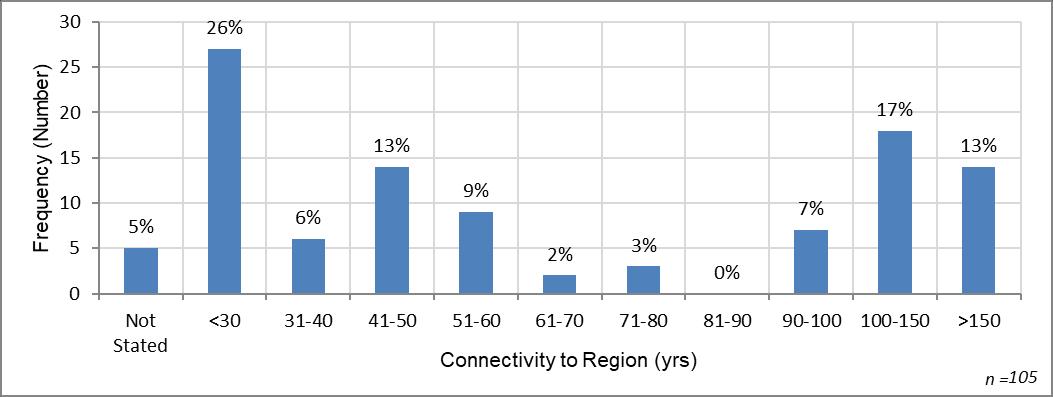
Approximately 65% of the Study participants were aged 60 years or more compared to the regional demographic of approximately 20% aged over 60 (Figure 3 4). This reflects the Study seeking these older individuals with connection and memories extending back 40+ years The distribution of Connectivity to the Study Area of Participants was bimodal
(Figure 3.5), reflecting long term but single generation connectivity to the area, or long-term and multiple generational connection of the Study Participant2 living and/or working within the Study Area.
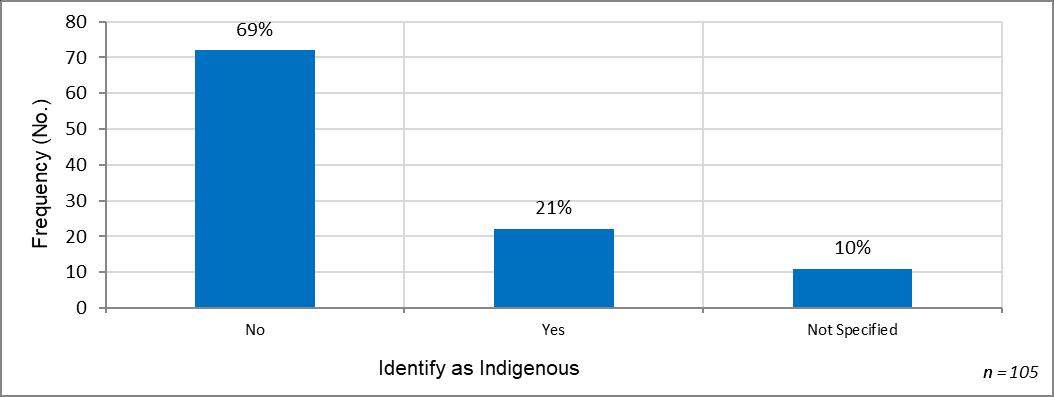
Approximately 1:5 of the Study Participants identified as Indigenous (Figure 3.6), which accurately reflects the Study Area demographic of approximately 18% identifying as Indigenous.
2 Connectivity to Region for Aboriginal people identifying with a group that has traditional lands in the Study Area was recorded as an arbitrary value of 200 years for the purposes of data capture.
TheGulfSavannahStory–OralHistoryInterviews–ExternalUse
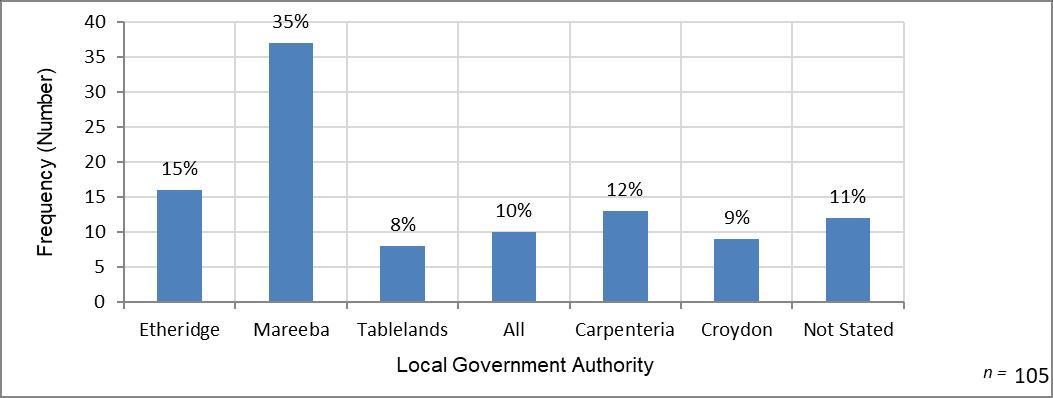
Study participants were connected to most of the Local Government Areas withinthe Study Area, with the percentages approximately reflecting the current population distribution (Figure 3 7) Kowanyama LGA is the standout, with no participants identifying just with that LGA, but several did include it in areas they associated with (listed as All).
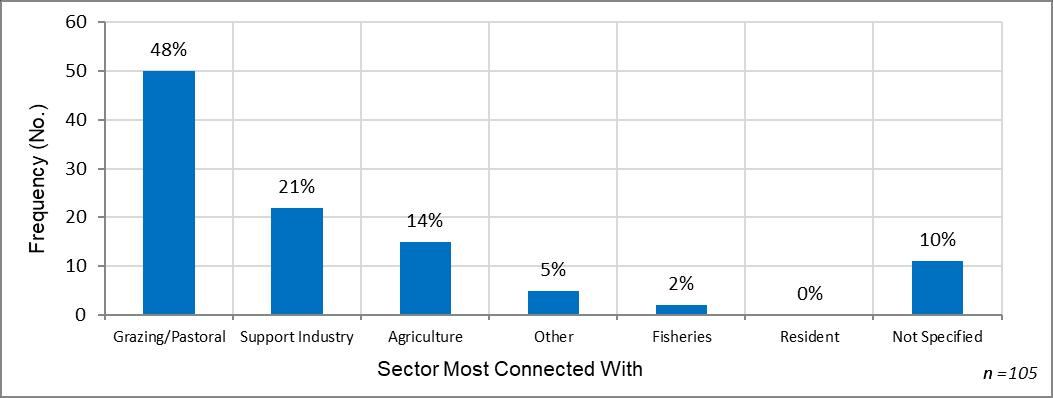
The majority (48%) of Study participants were connected with the Grazing/Pastoral Industry (Figure 3.8), with Support Industries (such as railway employee, consultants, government employee) and the agricultural sector representing about 1/5th and 1/8th respectively
Perceptions of Study participants is a qualitative assessment, gathered from their responses to the specific interview topics (climate, land management, biodiversity).
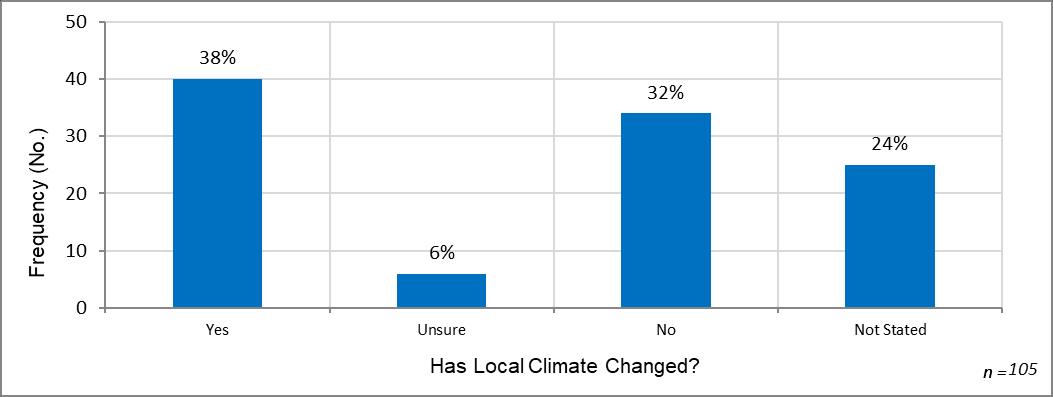
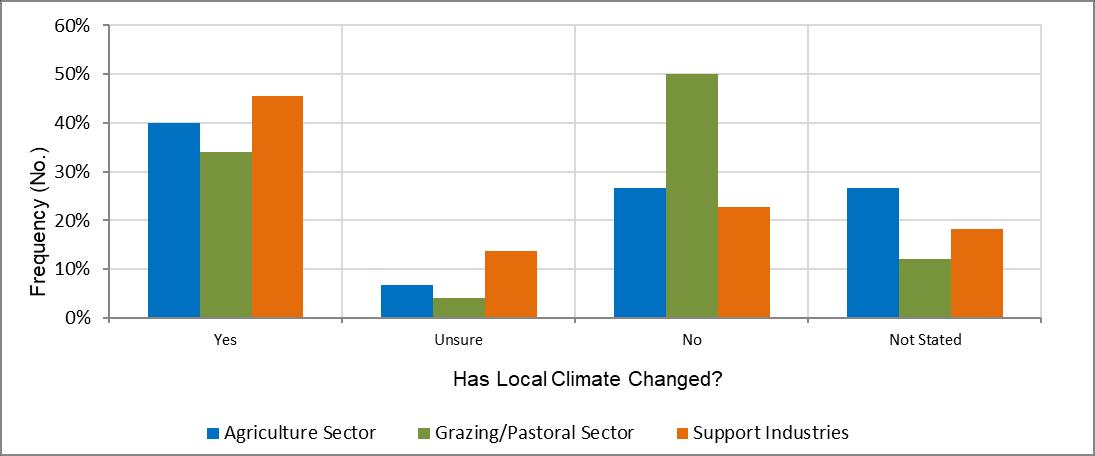
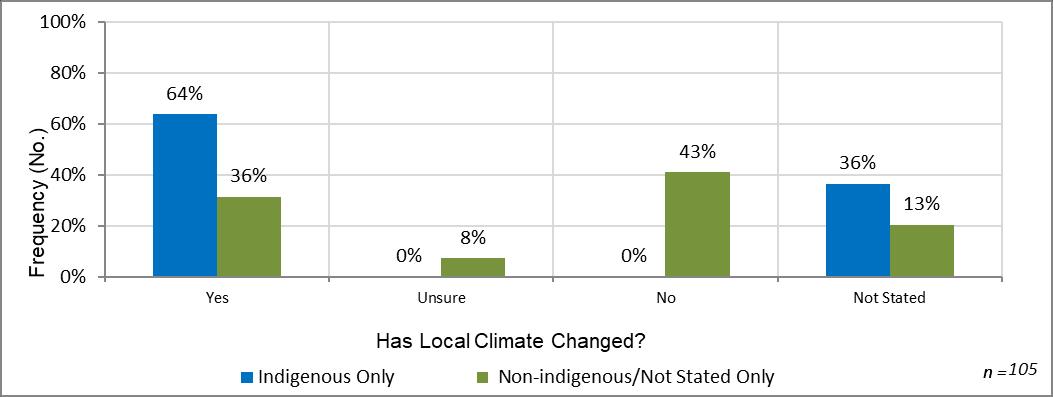
Study Participants were evenly split on the question of changes observed in their local climate, with ~40% indicating climate had/had not changed respectively (Figure 3.9). When the data was interpreted by the sector the participant was most connected with, the split was a little more decisive, with the majority of participants from the agricultural sector indicated they had noticed a change, while those from the grazing sector did not (Figure 3.10). In a similar fashion, the majority of the Study participants identifying as Indigenous perceived that the local climate had changed (Figure 3 11).
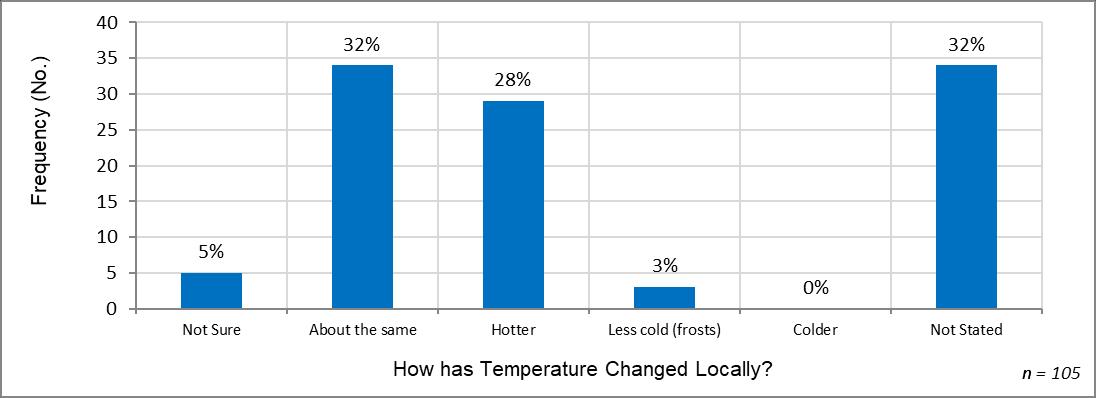
The direction and quantum of the change was relatively evenly split between responses about the temperature being about the same, or hotter (Figure 3 12) Many participants noted that climate, and the temperature
“Weather used to be regular. Regular wets, regular fires. These days it goes from being extremely wet to extremely dry in a week.”


“I don't think Europeans understand the climate in this country. Climate is so variable, and people don't understand and cannot account for the variability. So people manage according to averages but there is no such thing. We need to account for variability.”
component of that, came in long-term cycles (7-10 years oft quoted). Several respondents spoke of the temperature being about the same but noted that there were less frosts in their
local area than they remembered historically. Interestingly no participants indicate the temperature was colder now that they recall historically. Several Study Participants indicated that their lifespan was too short to determine temperature changes in an inherently variable backdrop, but noted other factors related to change (such as bird migration patterns) and/or large data sets and published material indicating change, basing their perception on this.

“The climate hasn’t changed. These things go in big cycles, every 10 years or so. There’s dry times, followed by big wets. It’s hard for people to see climate on that scale, and not just the last few years they have experienced.”

“The climate is changing. What was stable is no longer stable, what was regular in no longer regular. The rains don’t come on time.”

“Long-term monitoring was done in NT and WA, showing severe decline in ground mammals. The numbers of ground mammals, and small reptiles, in the Gulf Savannah are at the lowest points of that curve. They are beyond critical.”
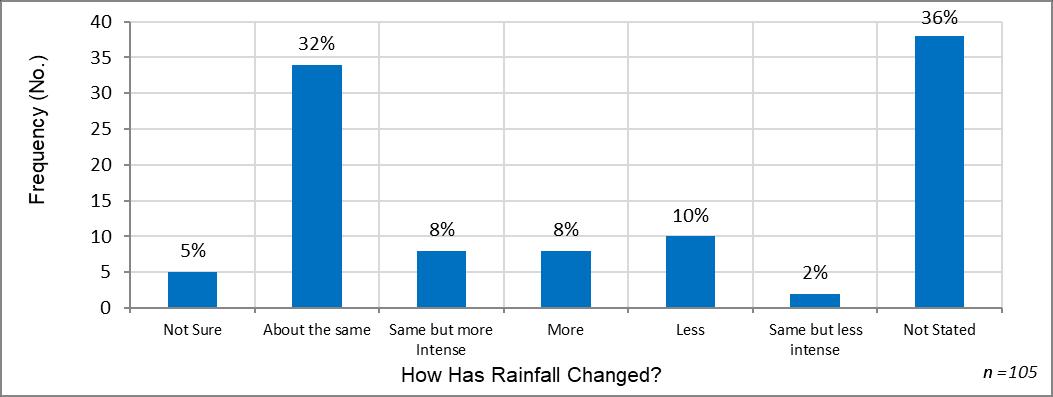
In regard to rainfall, fewer Study participants were able to perceive a noticeable change (Figure 3 13), many indicating that the system operates on long-term cycles, or the system was too variable for them to perceive a noted change. Some respondents did mention that they thought the total amount of rainfall was about the same, but more intense events were more common. It should be noted that the interviews were conducted 2023 and 2024, which were wet years, especially early 2024 with the passage of TC Jasper bringing substantial falls to the eastern portions of the Study Area.
“There was a lot of water points put in through the 1960’s and 70’s. This provided water for animals in areas they never had before. There are more animals now.”


“Weeds, especially the introduced grasses, have huge potential to change the landscape. In north Queensland, they are still a long way below their potential impact.”

“There’s been a huge increase in [freshwater] crocodiles. You fly over those river systems in the dry now and there’s as many croc tracks as cattle tracks.”
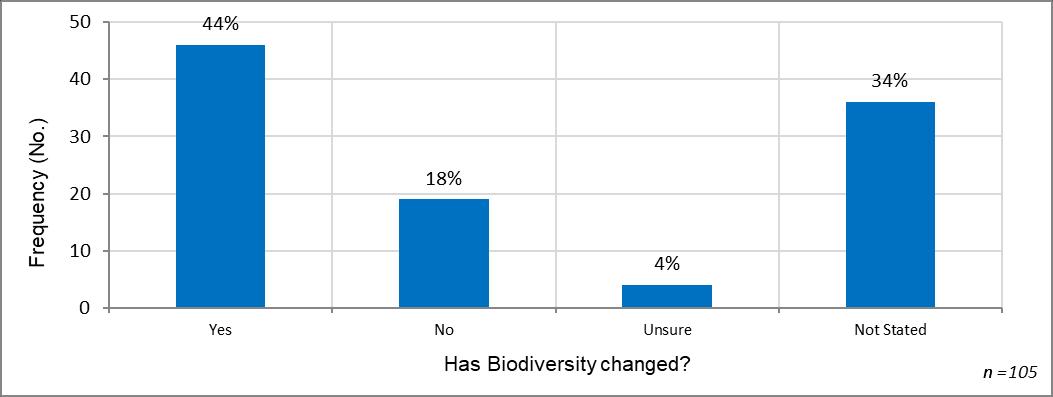
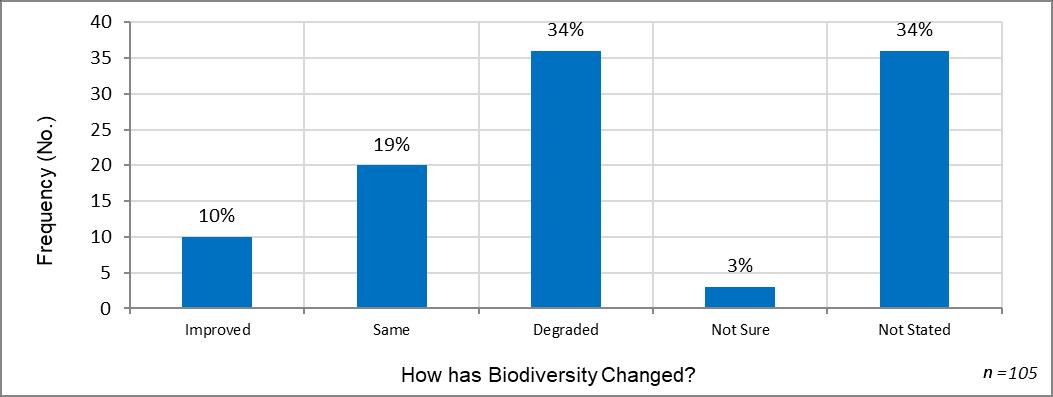
On the question of Biodiversity, the trend was more clear, with more than 40% indicating that they had perceived a change in their local biodiversity (Figure 3.14). Some 35% went on to indicate they thought that biodiversity had degraded (Figure 3 15). A third of participants indicated that biodiversity was about the same or had improved, and several noted the increase in water points available through the region (See Section 4) expanded the range of fauna. In relation to biodiversity, many Study Participants spoke about the increase in weeds and woody thickening.
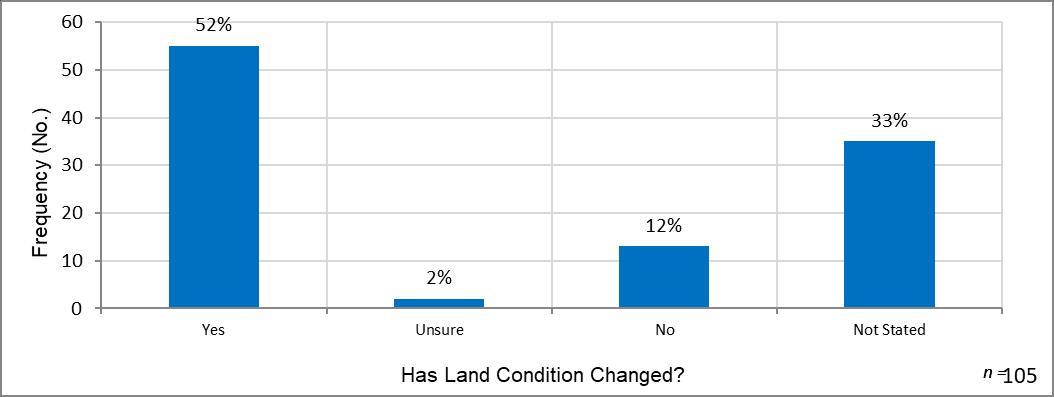
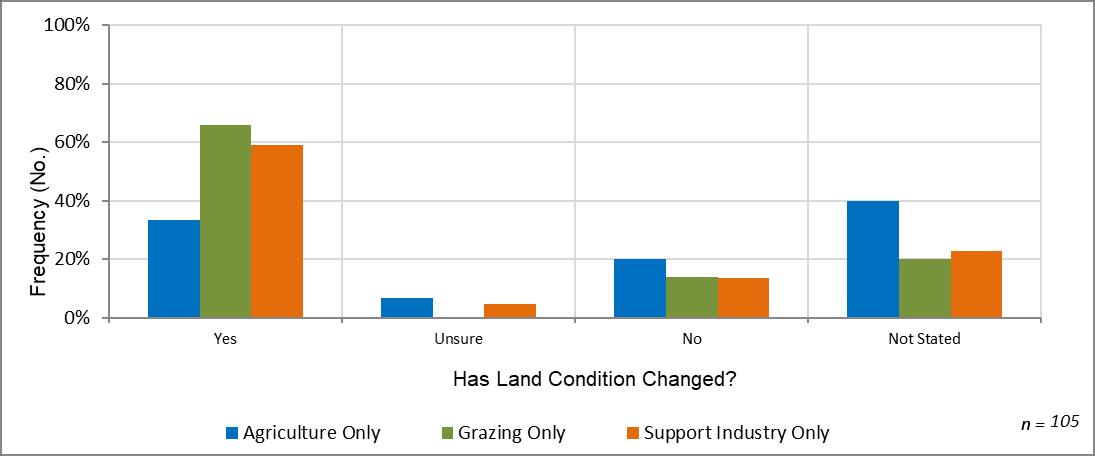
The Study Participants were clear that they perceived that Land Condition had changed, with a clear majority indicting a change (Figure 3.16). This was relatively consistent perception across
People have noticed a real difference in the carrying capacity over their lifetime. The distribution of water is the main contributing factor to the stocking rate.


There has been a change in land management as my generation are moving on and the next generation are taking over. They are much more reactive, they look at how much leaf they have on the ground, and they react, moving cattle on, shifting cattle. They don’t bugger about.
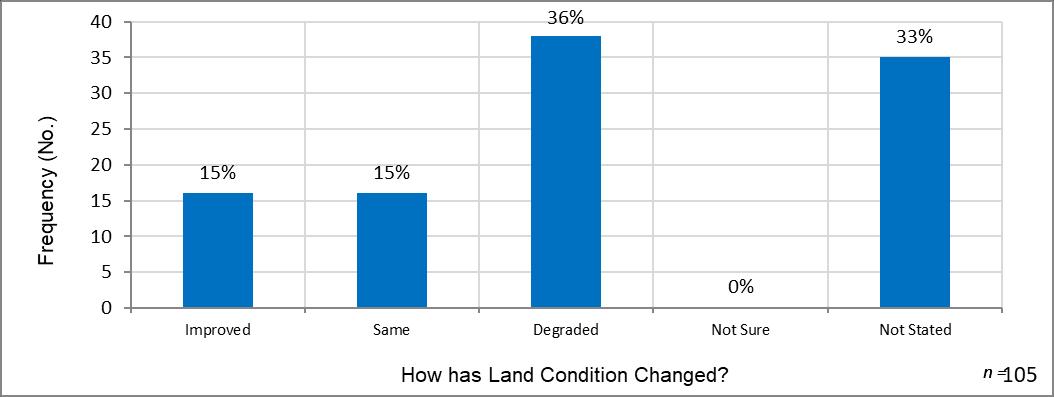
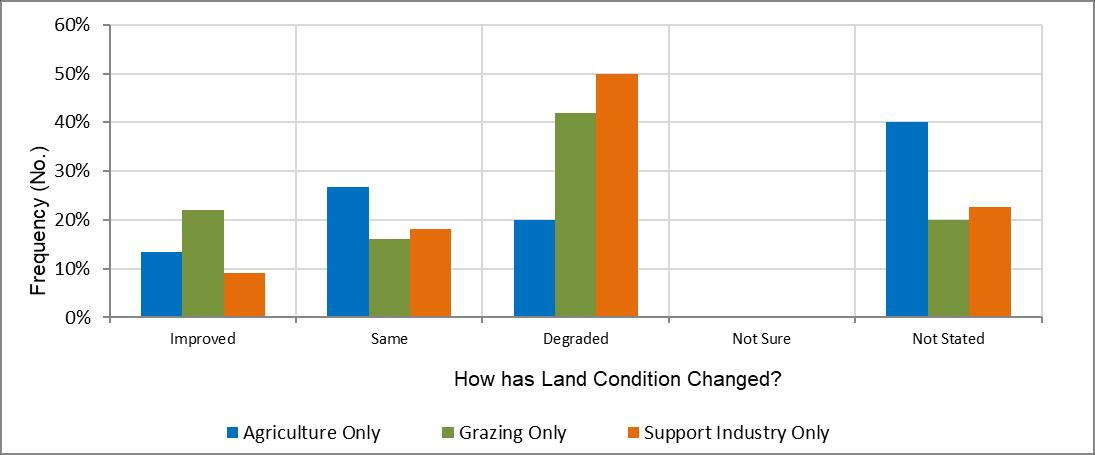
the Sector the Study Participant was most associated with (Figure 3 17). How that change had been manifested was slightly less clear, with ~30% indicating it was the same or better, and 36% indicating it had degraded (Figure 3.18). This
“After the big wet in 1974, the whole country just seemed to grow suckers. They came up bloody everywhere.”

was also reasonably consistent across Sector (Figure 3.19).

“We put our first water point in 1968, and didn’t have a year thereafter where we don’t put more in.”

“On IStation(EtheridgeShire), we used to be able to see 400yards along the river country. By 1980’s, we couldn’t see 50yrds due to breadfruit.”
Changes in fire regime, over grazing and increased woody weeds, thickening (often referred to as Suckers) was common comment in relation to perceived changes in land condition.
Key Statements were noted during interview from participants. These are statements which relate to the four key areas (Climate, Land Condition, Biodiversity and Future Needs) and point to an issue which has direct relevance for Gulf Savannah NRM understanding our operating environment, understanding current trends from past influences or determining future needs to support regional stakeholders.
001 Biodiversity
002 Biodiversity
There are less snakes visible on roads now and more roadkill proportional to higher traffic volumes. There were no biodiversity studies across whole Gulf region before 1980’s, when CSIRO started work.
Large drops in snake numbers were noted with the arrival of cane toads in Southern Gulf (E Station (Burketown Region)) in 1980’s, with complete loss of several goanna species. This have recovered somewhat to 2010’s, but nowhere near original numbers or diversity.
Sooty Grunter were introduced above Herbert River falls by Manager of Glen Ruth. 12 fish were carried up, 9 seen to survive. Suggested all Sooty Grunter above Falls arise from these fish – genetics. This occurred ~ 1920.
Koala was recorded at Weatherby (Mt Molloy) in 1952. This was recorded in Weatherby Station record book.
Lower density of reptiles noted since 1980’s. ALA records
003 Biodiversity
004 Biodiversity
Koala recorded at Irvinebank and Stannery Hills
Emu and Freshwater crocodile occurred in Emu Creek area of Dimbulah prior to 1940’s.
Crocodile were shot out by miners in area by 1950’s.
005 Biodiversity
006 Biodiversity
Genetics of Sooty Grunter above Herbert River Falls Genetics
Additional datapoint for previous distribution. ALA Records, QM records
Additional datapoint for previous distribution. ALA Records, QM records
Study Participant reported finding multiple aboriginal grinding stones around waterholes which were used for grinding Nardoo (aquatic plant) seeds. Nardoo doesn’t occur in these waterholes anymore due to grazing. Indicator of Charge
Spotted Gudgeon (Mogurnda mogurnda?) and Garfish (Freshwater Longtom Strongylura krefftii?) and River Prawns (Macrobrachium spp?) were common in the Walsh River up to the 1960-1970’s. These species are now not seen.
Indicator of habitat change, possible key species indicator of success ALA Records, QM records
007 Biodiversity
008 Biodiversity
Very few native fish now in waterway at Irvinebank. This is possibly related to acidic drainage from the Aloma mine impacting water quality.
In Julatten, areas were cleared for in 1960’s. High biomass grasses were introduced (Hamil (Grader) Grass, Pangola, Paragrass, Guinea, Kikuya (failed), various Stylos, Molasses Grass.
009 Biodiversity
010 Biodiversity
011 Biodiversity
Guinea Grass was brought up from the coast to grow along watercourse around Mt Molloy as feed for horses in 1940’s.
Callotropis procera has invaded frontal dunes along Gulf Coast, south of Normanton almost to Bourketown. This was rare in 1980, but heavy coverage by 2003
Feral pig numbers in Mitchell Catchment (D Station, Kowanyama region) are significantly less now due to active control (baiting, shooting, trapping). 30-40 yrs ago, there was little management and numbers were significantly higher.
Northen Nailtail wallaby numbers in Mitchell have significantly decreased in last 30-40yrs.
012 Biodiversity
013 Biodiversity
Large changes in Bettong numbers on Cape which relates to changes in grasses (introduced) and structure of vegetation.
Excessive burning around Irvinebank has changed the species composition. Small ground mammals are scarce, Pumpkin Gum is in low numbers and several endangered plants (Purple Wattle and Hakea) have reduced.
Cross
Sources for rehabilitation or habitat improvement.
Indicator of habitat change. ALA Records, QM records. DME records of mine drainage.
Dates for larger scale introduction of non-native grasses which were intentionally planted. DAF Records
History of weed spread. DAF records.
Indicator of Change Herbarium. Aerial Images
Historical numbers of ferals, and landscape responses
Indicator of habitat change, possible indicator for rehabilitation or improvement. ALA Records, QM records
Indicator of habitat change. ALA Records, QM records
014 Biodiversity
015 Biodiversity
Crocodile numbers and distribution has significantly increased since the 50’s and 60’s. This is due to the absence of aboriginal people living more traditional lifestyle and eating eggs. In Gulf stock camps, aboriginal stockman used to seek and eat crocodile eggs in the early part of the year. Crocodile numbers were also increased by the development/clearing of waterholes with excavators/loaders to provide more permanent water sources for stock.
Freshwater crocodile numbers have dramatically increased in river systems in Georgetown region. Study Participant noted that when flying over river systems, there are as many croc tracks as cattle tracks. Increases relative to 1950’s to 1970’s. Attributed increases to rapid decline in harvests for skins as a supplementary income for station workers and/or professionals. Study Participant attributed a decline in fish numbers in waterholes due to increased crocodile predation.
There were records of saltwater crocodiles in Roth Creek in 1960’s.
016 Biodiversity
017 Biodiversity
018 Biodiversity
There are more sharks and crocodiles in the waterways on the Cape than 50 years ago.
Wallaby (Agile) numbers have significantly increased as a result of water points, dog control and reduced Aboriginal take. Study Participant suggested regulation on harvest has put this out of reach of property workers using harvest as a secondary income, reducing take through commercial harvest.
Wallaby (Agile) numbers have increased significantly in last 10 years in Georgetown. Irreparable damage especially to river frontage (over grazing and erosion).
The development of water points across the Gulf Savannah region since the 1960’s has led to an increase in native fauna around these water points.
Indicator of changes in crocodile numbers. ALA Records, QM records
Indicators of biodiversity change. ALA, QM
019 Biodiversity
Indicator of change QM, ALA
Indicator of changes in macropod numbers. ALA Records, QM records
Understanding of changes in biodiversity Link to BoM records of better seasons reflecting change
Indicator of biodiversity and understanding changes. Aerial images to determine increase in water points, possible historical ALA Records, QM records.
020 Biodiversity
021 Biodiversity
Increase in Echidna and Blue tongue lizards on N Station (Etheridge Shire). Study Participant indicated it was a novelty to see as a child, now sightings are quite common. Attributed the increase to due to managing wild dogs and increased ground cover.
Increased occurrence of rabbits in river system about Georgetown where habitat is suitable in last 10 years. Study Participant attributed this to increased ground cover (weeds, paperbarks) in river system. Indicated that this was causing damage (erosion) as rabbit numbers were sufficient to eat out stabilising ground cover.
Torres Strait Pigeon numbers have reduced in last 30 years. Birds (TIPs) are also not migrating, and staying in region (around Mareeba) year round.
Indicators of biodiversity change. ALA, QM
Indicators of emerging problem
Biodiversity changes BirdLife Australia database.
022 Biodiversity
023 Biodiversity
024 Biodiversity
025 Biodiversity
026 Biodiversity
027 Biodiversity
028 Biodiversity
Study Participant suggested that this species were a significant vector of seeds, especially along rivers. The lower numbers reduces seedlings in waterways.
Study Participant indicated that there have been noticeably less Rainbow Lorikeets in last 5 years on Cape York.
In Mitchell River on Cape York numbers of Red Claw have decreased, and numbers of Cherabin have increased in previous ~10 years.
In 1940, publican brought “half a sugar bag” of cane toads back to Chillagoe with him from Cairns.
Bushfires at night are devasting for birds as they are disoriented and cannot react. Death rates are higher.
Large flocks of Gouldian Finches were noted in Mt Molloy area in 1930’s and 1940’s.
There are less Bettongs and Quolls in Mareeba area relative to the 1970’s and 1980’s. There are more ferals cats.
029 Biodiversity Noted rabbits in Mareeba area for the first time in recent years.
030 Biodiversity
Totem of Mbarbaram aboriginal people is Emu, but this doesn’t occur now on their traditional country. Study Participant didn’t recall seeing in last 60 years, so suggested must have occurred before
Indicator of change BirdLife Australia database.
Indicator of change QM database, ALA
Indicator of change Papers on the rate of spread of toads. QM, ALA records
Possible implication for fire planning.
Indicator of Change QM, ALA
Indicator of change QM, ALA
Indicator of change QM, ALA
Indicator of change QM, ALA
031 Biodiversity
032 Biodiversity
Sawfish were common in Gregory River in 1990’s (including E Station (Burketown Region) outstation). Fish over 3m were noted. Historical records indicate Sawfish occurred as far inland as Lawnhill and Richmond. All sawfish are now rare, and big sawfish very rare. Study Participant indicated that major impacts were gill net fisheries and especially barriers on waterways preventing juvenile access to highproductivity areas.
Saratoga have significantly decreased in numbers and extent, especially in Nicholson River. Study Participant suggested that this may be related to loss of overhanging and streamside vegetation as a result of land management (grazing, unmanaged access to waterways) reducing food sources.
There have been significant changes in migratory timing of fauna. Northern hemisphere species (e.g. waders) arrive weeks earlier than they did 40 years ago. Changes in behaviours have also been observed in moulting of Victoria’s Riflebird, now 3-5 weeks earlier than 2000.
Indicator of change QM, ALA, SARA
033 Climate
034 Climate
Location changes have been noted in species, especially mid-altitude species like Green Ringtail Possum and Tree Kangaroo. These were rare at locations like Hypipamee Crater, where consistent spotlighting surveys have been completed. In last 20 years, and especially last 10, they have become common.
Tobacco crops were often devastated by hail. Now, hail storms are very rare. Have not seen since 1980’s. Frosts occurred in Dimbulah in 1974 were last big frosts.
Indicator of Change QM, ALA
035 Climate
036 Climate
037 Climate
In Julatten, used to get 120” of rain in a year, and this used to continue right through to August, lots of drizzle and wet days. Now rain is significantly less, and this was associated with extensive clearing in 1960’s and 1970’s. Used to get significant and consecutive frosts, now these are very rare/don’t occur.
In Mareeba used to get severe storms in September and October up to 1980’s, 1990. These don’t occur as yet. These also included widespread hail storms, which impacted large farm and crop areas.
Break of Season (Green date) for W Station (Etheridge Shire) used to be November, now its January.
Evidence of climate change impacting natural systems in Gulf Savannah.
Pointer for past changes in other species, forecast of future changes.
Prof. Steve Williams has published multiple papers on this, and has long term data sets (Williams, et al., 2003).
Indicator of subtle changes in weather patterns BoM
Indicator of changes in climate. BoM rainfall records, and cross correlation with clearing
Indicator of change BoM, media reports of widespread hail damage.
Indicator of change BoM Records
038 Climate
039 Climate
At Irvinebank, now have more trees with cessation of mining. Now get more temps over 40oC and don’t have frosts. Last was late 1980’s. Winds start earlier, used to start in May.
Wet seasons are not as long now (relative to 1950-1070’s), and there is not the winter rain. Used to get light rain in winter, which was enough to refresh country and keep grass going and late season fires down.
040 Climate Large droughts on Cape in 1968 and 1972.
During the 1960’s and 1970’s, the labour force on Gulf Savannah properties changed dramatically. Properties went from employing multiple people, including aboriginal stockmen, to being run by families and contracting work (mustering, fencing) as required.
Indicators of climate changes. BoM
Indicator of climate changes, influencing land management BoM data
History of climate BoM
041 Land Management
This included the results of the Equal Pay decision, the 1967 referendum and the cattle price slump of the 1970’s. This influenced many Aboriginal people being moved off stations.
This had important implications as people often didn’t have labour to undertake management burns on a regular basis. Also people engaged had less continuity of knowledge with a property, and less likely to make decisions based on local knowledge and skills.
Prior to ~1957, there were a lot of Aboriginal people working on properties around Croydon and living in Croydon. Now there are very few.
Fire started to be absent from the extensive grazing property about this time. This may have contributed to land degradation, especially woody thickening.
The 1967 Referendum: History and Myths Census data
042 Land Management
043 Land Management
The early to mid 1990’s saw the last of the tobacco industry in the Mareeba Dimbulah Irrigation Area. Tobacco was a profitable crop, and properties had the
Changes in connection related
to changes in land condition and management, such as fire management.
Large percentage reduction in remnant bushland
Census noting Aboriginal people were not included in census until after 1967 referendum.
Aerial images pre and post end of tobacco
044 Land Management
best of their place used, the rest was often retained as bushland, perhaps with light grazing.
The transition to other crops (such as tree crops like avocado and citrus) or cane was less profitable per unit area, so people often extended cropping operations across all the property, clearing remaining bushland.
DPI did extensive work to look at alternative crops suitable for the MDIA through 1980’s and 1990’s.
The story of development in Northern Australia has been more wire and more water, as people try and develop water within ~3km of all grazing.
Possible Uses
across MDIA. This could correlate to reductions in fauna, changes in water quality or increases in salinity as natural vegetation was removed.
Possible Cross Reference Data Sources
industry to examine changes in land use.
Water quality data from systems in region to examine decline.
Long term ground water bore data.
Look in changes of grazing pressure due to development of water sources. DNRM records/permits for dams. Landsat data and automated image analysis to identify water sources.
045 Land Management
From 1960’s, there was a large increase in water points across the Gulf.
Study Participant on A Station (Etheridge Shire), “Put our first water point in 1968, and didn’t have a year thereafter where we don’t put more in.”
046 Land Management
Cattle ticks were introduced about 1915 via buffalo into Darwin. Fire was major tool to manage ticks, but as cattle species were changed (Brahman), the reason for fire was reduced. Combined with use of lick, fire use decreased significantly by 1980’s. As there has been several generations since fire was used, current generations are less comfortable with fire use.
Weatherby Station history refers to testimony of Ted Henery of tick plague in 1897 where 90% of cattle died.
Changes in fire use as land management tool
Changes would have been
047 Land Management
Fire has been reduced as a management tool in combination with the increase in licks and supplements 30-40yrs. Fires were not required as cattle need roughage when on licks to stay alive.
Link between use of supplements and Fire records.
048 Land Management
BTEC program was a significant change in production systems across the Cape and Gulf Savannah, 1970s-1980’s. This saw a change from red to grey (Brahman) cattle, and the introduction of more wire and water. That saw big increase in grazing pressure (~3km halo) and more continuous grazing. Fire was reduced/removed as feed was needed and grazed such that it reduced the fuel below a sustainable fire. Combined with the introduction of supplements, these factors dramatically changed the face of grazing in North Australia.
The land south of Laura is currently a heavily wooded, closed ecosystem. This was an open grassland with scattered trees (Savannah) in late 1980’s/early 1990’s. Study Participant suggested this was due to QPWS overly cautious of fires escaping to adjoining properties who don’t want to burn. The reduced fire frequency, or use of cool fires has led to woody thickening.
reduction in fire use.
049 Land Management
Lakefield National Park. In 1950’s Breeza Plains to Bizanth was an open plain. By 1995, this was covered completely with Teatree. There is a large Plain called Nifold Plain. You can see the tree line in distance and small suckers coming up in foreground – recent growth.
Lack of hot fires on Cape has resulted in significant regrowth/thickening.
Woody thickening is significant in the Mitchell. More cattle, more wire exposes much more country to intensive and continuous grazing. Could ride through areas on D Station (Kowanyama region), now very thick.
Changes in Lakelands from Laura to closed woodland. NAFI, Vegetation mapping, aerial images.
Indicator of change Aerial images
050 Land Management
Laura to Musgrave was a combination of extensive grassy plains, separated by gullies with waterways. It’s now a forest.
Woody thickening has been very significant on P Station (Laura Region)
In 1960’s, Walsh River used to be clear of trees, and you could see of miles. Now the river channel is full of trees.
Indicator of habitat change, possible indicator for rehabilitation or improvement. Aerial images, Herbarium records
051 Land Management
Oaks River - Trees are growing in waterways and blocking the flows, changing the direction of the watercourse by pushing flows onto banks.
Indicator of habitat change, possible indicator for rehabilitation or improvement. Aerial images (since 1940’s)
052 Land Management
Following flood events, some tree species establish quickly such as paperbarks. More important to be onto fire management to control these events, and especially years post-floods.
Woody thickening is noticeable after flood years where “suckers” (Eucalyptus?) come up. Was especially evident after 1974 floods.
Couch Grass was major weed in agriculture through 1940’s. With advent of specific herbicides, this grass is not an issue.
Possible indicator of importance of management postflood. Aerial imagery
053 Land Management
Hyptis can be controlled with fire and managed grazing pressure, especially storm burns.
Indicator of habitat change, possible indicator for rehabilitation or improvement. DAF records
054 Land Management
055 Land Management
Hyptis can be controlled with hot fires in control burns. Large difference in last 40 years when burns haven’t been used, or have been cool burns. Has increased woody weeds.
There has been a decline in land condition, which had led to a decline in carrying capacity across the Gulf Savannah region. Kangaroo grass was common and land condition was good, but the main driver is distance from water.
Evidence of Hyptis control with fire, as well as another incentive to burn appropriately. Littleton NP records, previous 7 years of management.
Control mechanism
056 Land Management
057 Land Management
Post 1991, M Station (Mount Surprise region) did not burn. They had lots of Grader Grass, but this gradually disappeared and was replaced by Kangaroo Grass with changed fire regime.
Examine link between development of water points, land condition and productivity as indicator of change in management.
Aerial images, land condition assessments, DAFF paper.
Possible link between fire use and control of grader grass. Aerial images or sat imagery (hyperspectral) of property pre 1991 to 2000’s?
058 Land Management
The introduction/enforcement of the fire permit system has decreased the use of fire. People find the permit system too restrictive and used to burn without permits as conditions suited at the moment. They know that NAFI can now pinpoint where fires started for prosecution and/or possible litigation if fires travel off their property.
Understanding limiting factor for fire implementation. NAFI for fire incidence, but possible future survey question on why fire is less.
059 Land Management
The Gilbert River (and Mitchell) has silted up with ~2m of sand over 50 years. Waterholes have disappeared. There were big waterholes, but now not. This is due to development and runoff. Stocking rates of Gilbert River system has doubled in last 50years.
Indicator of changes in sediment dynamics. Aerial Photography
060 Land Management
The Palmer River on B Station (Mt Carbine region) used to have fishing holes that could fish in in 1970’s. By 1990’s/2000’s the river was completely sand and you could drive a 4wd along the base. There is little/no surface water now into the dry as the water sinks under the sand.
061 Land Management Granite Creek above the weir. In 1960’s, used to water ski above weir, later (1990’s) can stand up above the weir. High siltation.
062 Land Management
Land condition has been measured at ~250 sites across the Gulf region, and showed to be continuing to decline in response to land management.
Indicator of Change Aerial Images
063 Land Management
In 1960’s and 70’s there were few producers using supplements and the yearly cyclic nature of weight gain/weight loss was much more pronounced. This was especially true before the transition to Braham cattle. There were big cattle losses in drought, but numbers took longer to recover in good year so country got a spell.
With supplements, it was possible to wean calves earlier. Combined with multiple musters (driven by more wire and water) the smaller calves could be separated in August additional muster. If the season was poor, you could keep the small calf AND the mother alive, leading to increased production.
Indicator of Change aerial images
Indicator of intervention requirement in land management. DAFF longitudinal study
Changes in stock management, translating to land management. Sales numbers
064 Land Management
Losing the battle in managing woody thickening, esp Wattles and Eucalypts. Loamy soils 30% increase in Eucalypts. Better in control in red duplex soils. This is due to a number of factors.
Indicator of Change Aerial Photography
065 Land Management
066 Land Management
Increase in Rubbervine in river channels. In 80’s and 90’s when mining was active, amount of sediment coming down Gilbert River dramatically increased. Lots of more sediments. This has coupled with increased growth within the river corridor. After 1974 in Ross and Gilbert rivers, the system went from wide open rivers to many weeds, forming islands. Changed character of river system.
Woody thickening esp along rivers has dramatically changed. Profound changes. Used to be able to see cattle along river, now cannot see 50m.
Woody thickening, E Station (Croydon region). Left property in 1978 and it was open forest country – very open sections and flats. Visited same country in 2013 and it was now a wattle thicket so thick you couldn’t even drive cattle through it.
Understanding river dynamics and drivers. Aerial Photography
067 Land Management
M Station (Normanton region) – In 1970’s the country was open right to the Flinders River. Country was flogged, no grass to burn and trees got away. Now so thick cannot drive cattle through it.
Through late 1960 and 1970’s, feral horses were a big issue. Shot 2,000+ off A Station (Etheridge Shire).
Indicator of change Aerial images
068 Land Management
069 Land Management
Cattle properties tend to be just cattle. Agriculture, especially in the MDIA, tend to have diverse range of crops. The lack of diversity in grazing leaves the business exposed to all risk. Smaller family farms (agricultural) especially have the ability to be flexible and change small areas to alternative crops quickly.
Indicator of previous feral issue. Sale of horse hair –was used for saddles and paint brushes and source of income.
Understanding business risk ABARES data
070 Land Management
Land prices have significantly increased in previous 5-10 years. This is both a significant blocker on new people coming into the agricultural industry (they cannot get enough capital to borrow against, or cannot have a good enough business case to justify purchase) and has reduced on-farm margins – bigger percentage of farm income (which hasn’t changed significantly) spent on servicing loans. This increase in pressure may result in less appetite for change in land management, or willingness to push country harder.
Understanding business drivers.
ABARES data
071 Land Management B Station – Sicklepod is now on the station following 2006 floods. Was brought down Mitchell River system from catchment.
Indicator of change
072 Land Management
“There is still a serious issue in the semi-arid areas with people not knowing how many cattle they've got. No one counts their breeders (or very few). People just count their calves and so you just get these breeder paddocks which are just flogged. That's where a lot of the tree thickening is coming from, because no one burns anymore.”
Indicator of land management practice which needs improvement Aerial Images, NAFI
073 Land Management
Fires on Western Cape York are more intensive and extensive, and extending into areas which generally didn’t burn. In 2006, witnessed fires burning into wetlands due to extended dry seasons.
Indicator of Charge NAFI
074 Land Management
Extensive surface erosion from 1990’s to 2005 in Southern Gulf. This included complete loss of emergent macrophytes around wetlands. Suggestion was this related to changes grazing pressure around development in 1970’s and 1980’s. More water and wire.
Also mentioned finding aboriginal grinding stones around waterholes which were used for grinding Nardoo (aquatic plant) seeds. Nardoo doesn’t occur in these waterholes anymore due to grazing.
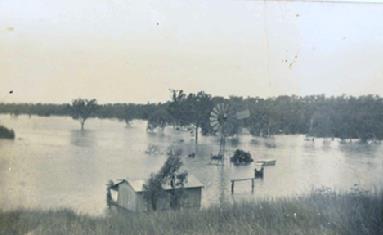
Changes to people’s viewpoint is an excellent indicator to land change, and a good way to engage people in discussions. People will often say “When I was a kid, I could see down to the dam 400m away, now I cannot see past the yard due to trees.”
This underscores the value of historical images that could evidence the widescale change across region.
Indicator of Charge Discussion was Gutta-percha tree root bolls were 0.5m above ground.
075 Future
Basis for project to seek images from pastoralists and get them to re-take photos. Project would provide evidence not available at likely timescales of images available (early 1900’s?) and engage people in the discussion. It would also
NA
076 Future
077 Future
There is very little monitoring or targeted research across the Study Region, especially spatially or temporally extensive work. Don’t know what fauna/flora is where and in what numbers, so cannot detect changes.
“You cannot manage what you cannot measure.” Need more, focused monitoring across region to help understand what’s occurring and then manage the resource. That investment needs to be strategic to be efficient and effective.
No environmental restrictions on graziers like there are on other businesses e.g. mining, fishing. Land management in the grazing industry is not regulated –anyone who can afford it can buy a property and overgraze it.
demonstrate the value of the practice, and encourage photo monitoring.
monitoring to detect changes and implement monitoring
078 Future
079 Future
The Herbarium has a series of site images for each of their collection points, and these would extend back to at least the 1960’s. These have location details and could be used as photo monitoring baselines.
Green date (date where 35mm of rain is received and dry breaks) is a useful land management measure. Graziers with managed joining aim to have calves feeding on green pick. Suggest this hasn’t changed at Mt Molloy over 100 years.
Potential examination of regulatory framework.
Baseline data for comparison with current condition.
BoM. Use rainfall records to examine Green date shift over years across region BoM records.
080 Future
081 Future
082 Future
Rehabilitation of previous mining damage in Mitchell catchment needs to be undertaken, and followed up long term. Start at top of catchment and work downstream.
Planning needs to see solar projects go onto poorer grazing country, and not see them sterilise good grazing land.
Planning needs to consider Nature Refuges in river corridors in Gulf Savannah. With large floods, they are wiped clean every (say) 10 years. If they are not
Review reserves (Nature Refuges, National Parks) to Tenure reserves.
083 Future
084 Future
connected to upland areas, there’s no population to re-establish. While they seem to provide a benefit, they are a path to continual decline.
examine what are outside complete flood area to ensure recruitment is possible.
085 Future
Croydon – need to support ranger program to both keep cultural connection as well as care for country.
Workshops that are two days and intensive for all topics are preferrable. Catch up with lots of people, catch up on multiple topics and can plan into busy schedule.
Workshops focusing on sustainable Farming for producers selling direct to markets is an opportunity. Focus is for people making a living off their land, and explain the regulations that need to be followed, marketing, packaging, farm management. Whole-of-business in sustainable framework - If you want people to have sustainable farm practices then you need to teach us how to integrate it all together.
Encourage younger generation to keep up with industry changes, what’s going on and the latest technologies.
engagement projects.
086 Future
087 Future
Understand and use the ABC land condition assessments and cost out actions before implementation. Have tools to make decision.
Grower Collectives have several advantages in guiding the crops grown, quantity and ability to leverage for a price for the product. They also reduce the risk of producers growing the same crop harvested at the same time and causing a glut in the market, crashing prices. Growers work with each other rather than individuals working against each other. These may have benefits in that they would stabilise production and allow certainty for producers, which would flow into investment back into land management and better outcomes
Increasing certainty and reducing risk, improving returns which could translate into a better investment into land management
088 Future
More management and implementation of fire across region, including getting younger generations of aboriginal people involved.
089 Future
090 Future
091 Future
Rain occurs on or around full moon. Study Participant indicated that they undertake difficult or complex controlled burns on full moon with expectation of rain to control.
Inclusion in fire planning and management. Subsequent review of scientific papers indicates there is a very minor impact of the gravitational force changing air pressure, not significant.
Need to improve cattle husbandry though education. Understanding breeding, handling, biosecurity issues.
Building resilience into grazing properties in face of climate change impacts forecast. This could include managing grazing pressure of sensitive areas, identifying and protecting aquatic refuges.
092 Future
093 Future
Climate change will act though an existing pressure, such as fire management, weed management, grazing management. As such, it won’t be a change in these aspects, but driving their importance.
Gulf Savannah NRM needs to stay engaged with, and act on, social issues. This is both as an avenue to the management of natural resources, but also because Gulf Savannah NRM is in a unique position across the region with oversight across multiple sectors and areas. Very few other bodies have this viewpoint. Also there is no-one else doing this work in the region, which really needs assistance.
The Study produced a range of results, and several common themes were evident from interviews. In summary :
• There were significant changes in the Grazing Industry through the 1960’s and 1970’s. The BTEC program saw a change to more Brahman dominated cattle, with increased tick and drought resistance. This also saw the advent of fenced paddocks to control stock.
• This period also saw significant changes in employment on grazing properties, from multiple people employed, including indigenous stockman, to a very small core labour force (often direct family) and contractors brought in as required (e.g mustering, fencing). There was a perception that contractors had a less long-term and nuanced understanding of a property.
• Water points (largely dams and troughs, but including “improvement” of natural waterholes) were extensively developed from the 1960’s and machinery with sufficient power became available, paddocks were fenced and investment in the industry, including foreign investment. Development of water points every 6-10km with the aim to provide distance-to-grazing to access total paddock.
• Supplements and lick became more widely used in the 1970’s, seeing stock utilise dry-season roughage as feed. Losses due to drought decreased.
• As feed was retained in paddocks and supplements made this a viable/necessary dry-season feed, the use of fire was reduced. Many older Study Participants noted that fire was a common practice into the 1970’s.

“In our early years on the property, we didn’t burn because father in-law didn’t believe in it, but our sort of country needs burning to control regrowth. Due to no burning early on, Breadfruit took over our river flat country. Later we started burning in the better seasons.”

There is a European-centric fear of fire. People used to smell smoke and think people are getting their burns in, now people smell smoke and are frightened.

“You’ve got to have fire. Different fire, and different places you don’t burn as often, but you have got to have fire. Australia evolved with fire. You have got to have fire in country. Yet they don’t want to use it, they go round talking silly. They’ve lost the art.”

“When we first got into that country [Cape York, 1950’s], we used to burn in June to get green pick to draw the cattle in and make them easy to muster. However, we didn’t realise what we were doing to the country. There’s now 4-6 times the amount of timber in that country than when we first went there. Late burning, if it’s done right, is good.”

“Fire was one of the very few management practices that cost virtually nothing, but it was so important in terms of the outcome for your country on how you managed the fire. Fire is less used now, and less understood as a management tool. Its gone out of fashion. Burning is more important the further north you go where the wet season, dry season is more pronounced.”

“We used to muster along Camp Oven [Creek] early in the year in June, July or something like that. When we were there, we’d burn it. All we did was destroy it. We burnt at the wrong time of year. We used to drive cattle down along there as it was open country. In the end, it was so closed in you couldn’t get cattle through it. I can tell you that [damaged] that country. Fire at the wrong time of year just helps the tree suckers to strike.”
The net impact seems to have been a significant increase in grazing pressure across the landscape both in terms of spatial extent and intensity/duration and less use of fire.
Across the grazing sector, these multiple influences had two key impacts, a general increase in grazing pressure across the landscape and a reduction in the use of fire. Many Study Participants had a perception of a significant increase in woody growth, and commensurate decline in pasture.
Study Participants did note an improvement in land management across the Study Area, and older participants spoke of a generational change bringing improvements to the industry, especially with the adoption of technology.
Horns are off the cattle now and people are paying attention to stocking rates and what the market wants. People on the land are becoming more aware of what the markets want; better, humane treatment of animals and looking after country.”


There was a boost in education around the 1970s and 1980s with extension officers sharing knowledge about property management planning and growing appropriate varieties of stock feed.
In terms of Agricultural sector within the Study Area, significant changes were noted about the 1980’s and 1990’s with the end of the tobacco industry and shifts to other crops, including sugar cane and tree crops. This led to an expansion of cropping area on properties as more production was required for these less profitable crops. It also saw a drop in on-farm labour, which had significant implications for supporting regional centres like Dimbulah. Once vibrant and activity communities shrank considerably.
The advances in technology in the agricultural sector were often noted, such as improvements in crop breeds for pest resistance and productivity, availability of powerful farm machines and pumps, as well as advances in pesticides and herbicides. In a more modern context, producers spoke of the uptake of technology, and positive changes in land management across the region.

“Good land managers look ahead, poor land managers just go with the flow.”
The perception of Study Participants is interesting and complex. It is important to note that during the interviews, participants were not asked directly their perceptions of three key areas (Climate, Land Condition, Biodiversity), but these were assessed in the interview summary. The perceptions should be treated as a guide only.
In general, no clear picture of participants’ perception if their local climate had changed came forward. The question seemed to have been often associated if participants believed in climate change as a bigger issue and sometimes generated some passionate responses in that light In a more nuanced understanding, participants indicated that their own lifespan was too short to confidently see changes, but many people spoke of long-term cycles and confidence that the base condition remained. Interestingly, no respondents suggested that their local climate was now colder, and several respondents, especially from the agricultural sector, spoke of previous significant frosts (1980’s and 1990’s) which were now rare or non-existent. There was an interesting split in participants associated with agriculture were more likely to have perceived a change in their local climate than those associated with the grazing industry.
“These days the pressures of economics, it’s hard for everyone. And it’s particularly hard for farmers because you can’t afford not to get a result. You can’t take the risk, so it’s really, really hard to transition into trying something else.”

Interestingly, there was a general understanding that land condition, reflecting land management practices, had degraded, especially in relation to grazing areas. Participants comments often related to increases in woody thickening and loss of preferred grass species or grass cover.
The time and resources to undertake this study were significant. The Study provided a more nuanced understanding of the history and activities within the Northern Gulf NRM region, and important understandings of the subtext of some of today’s more important management challenges. It has provided a large body of evidence that supports the general understanding of the region, and significant list of points for further investigation and cross-checking (Table 3.2).
• Selection of participants should be controlled are far as possible to reduce study bias. The use of existing contacts database in this study was a potential source of bias in that these were people that were already engaged with Gulf Savannah NRM in some format, often issues surrounding land management. In future studies, it would be useful to record the source of the contact and previous engagement accurately such that the data analysis could tease out possible differences.
• Similarly, 70%+ of participants were male in this study, whereas the demographic of the target age group (60+) across the Study Area is approximately 48% female, 52% Male. Whilst this bias likely reflects the historical perception of “land manager” across the region, it would be instructive to target a representative proportion of males and females, and then tease out the differences in perception.
• Participants generally demonstrated a preference for audio recording of the interview over video. This was easier to complete during the interviews and get a solid result (noting technical challenges of recording quality video). Participants found this less intrusive, and seemed to be less self-conscious, potentially improving interview outcomes. Video was included in the study as the preferred option with the aim of potentially providing material into the State or National Archives. However, given the relatively narrow study focus, it is considered that the additional issues with accurately recording video added little value, and future works could focus just on accurate audio recording of interviews for subsequent review.
• Consider the inclusion of more quantifiable, closed questions along with free-form questions These might ask the participant specific questions of interest such as “Has your local climate changed?” and provide specific responses. These questions might allow the introduction of a topic to delve into further with the free-form questions, as well as providing a framework for the direct interpretation of summary statistics.
• Better control on script and focus of interview. Multiple interviewers on this project were required due to the large spatial and temporal coverage of the project. However, this did lead to subtle changes in approach and different focus of interview, which impacted meaningful data interpretation. Adherence to a more defined script, balanced with the free-form nature of questions would assist consistency.
• An interesting observation was that a small percentage (~5%) of participants invited to join the project expressed mistrust about the subsequent use of the information. They were either disinclined to participate or were not prepared to be recorded during the interviews. They cited that they didn’t want the material used against them by the NRM or government bodies in the future. This factor might point to a factor of trust for Gulf Savannah NRM and/or an issue to be more carefully addressed and explored in push-type engagement exercises. It is difficult to determine if the exclusion of this group in favour of those prepared to volunteer their time and information would bias the results.
• Consideration should be given to using independent contractors for future studies. There is a potential that NRM staff could unintentionally bias the results through existing relationships. Gulf Savannah NRM works in small communities.
• There was a focus by Interviewers on obtaining climate data (especially rainfall), possibly because this was specifically mentioned in the guidance notes. Several sets of rainfall records were obtained, however these are of limited value. In a broad scale of the study area, these add little to the existing verified records, they are intermittent, irregular and not from a calibrated source. They don’t contain temperature records.
More value could be gained from other sources, such as historical images from known locations that could be repeated. Future studies may benefit from a more detailed review of possible data of use and prioritise these during interviews, including photographs
Harvey, D. & Riley, M., 2005. Country stories: the use of oral histories of the countryside to challenge the sciences of the past and future.. Interdisciplinary Science Reviews, Volume 30.
Lankester, A., 2006. Landholder experiences and perceptions of the extent, onset and causes of woody vegetation change: Northern Gulf scoping study, Townsville: Tropical Savannas CRC.
Lankester, A., 2012. Self-perceived Roles in Life and Achieving Sustainability on Family Farms in North-eastern Australia. Australian Geographer, pp. 43:3, 233-251.
Olson, J. & da Silva, P., 2024. MEANING ACROSS CONTEXT:ORAL HISTORIES, BIG DATA, AND CLIMATE CHANGE. Weather, Climate, and Society.
Preece, N. & Fitzsimons, J., 2022. Gaps in Monitoring Leave Northern Australian Mammal Fauna with Uncertain Futures. Diversity, 14(158).
Williams, S. E., Bolitho, E. E. & Fox, S., 2003. Climate change in Australian tropical rainforests: an impending environmental catastrophe. Proc. R. Soc. Lond., Volume 270, pp. 1887-1892.
The purpose of the interview is to collect information that will provide a clearer picture of land Management practices, land condition, biodiversity and community concerns from the past and at present across the Gulf Savannah NRM region.
We’re doing these interviews to understand the changes in the land you have seen over time, and to get a sense of the issues that are important to you now and into the future. We recognise that long-time residents, Elders, and land managers have a wealth of knowledge – and a unique spark and resilience – that is often not represented in the reports written for National and State departments that help allocate resources to this region.
The interview will cover five topics: your background, local climate, land use, plants and animals, and future needs relating to land management. To prepare, start thinking about:
• Your stories of the land, plants and animals; of hardship and adversity.
• Times spent with friends or family members, or things they told you.
• Family photographs that may show land condition and/or land management practices, rainfall records or diary entries. For much of the region, accurate rainfall and land condition records do not exist.
It is entirely up to you which records and stories you decide to share or keep to yourself. We understand the ways of the past may be different to today, and we won’t be making judgements of events and attitudes that happened then. It’s important for us to gather a frank and truthful picture to help inform future directions. Your decision to participate is entirely voluntary and will have no adverse effect on your future relationship with Gulf Savannah NRM.
What happens with the information I provide in my interview?
With your consent, the information and evidence you provide will be used to produce:
• A State of the Region report (for Queensland Government)
• A community-focused summary report (for the public)
• Social media posts
• Traditional media products (e.g. Gulf Croaker articles, radio segments, etc.)
• Possible inclusion in State Library of Queensland collections.
The information and knowledge of the past are yours and remain yours. You will be acknowledged for any knowledge you choose to share in the project’s outputs. Interviews may be transcribed using software to aid analysis.
You can withdraw from the project at any time before, during or after the interview by contacting Gulf Savannah NRM. If you choose to withdraw, the information you have provided will be removed from our dataset and reporting.
Where & when

The interview will be conducted at a time and place convenient to you. It will take about 60-90 minutes. We will need to make an audio and/or video recording of the interview for our analysis, but excerpts will only be shared with the consent you give on the consent form.
This project has received funding from the Queensland Government Natural Resources Recovery Program. For information about this project please contact Natarsha Bell at the Gulf Savannah office in Mareeba: (07) 4092 1088 or natarsha.bell@gulfsavannahnrm.org, mobile 0474634562.
As stated in the Participant Information Sheet, the purpose of the interview is to collect information that will provide a clearer picture, across the Gulf Savannah NRM region, of land Management practices, Land condition, climate, biodiversity and community concerns from the past and present.
REQUIRED: I have read the Participant Information Sheet and had the chance to ask questions
I consent to a video recording being made
I consent to an audio recording being made
I consent to photos being taken of me
I consent to photos being taken of my property
I consent for notes to be taken by the interviewer.
I wish to remain anonymous (only say Y if no identifying information is being collected)
REQUIRED: I consent to all recorded material and notes being retained by Gulf Savannah NRM
I consent to an edited audio and/or video clips being used in reports and/or promotional material by Gulf Savannah NRM or the Queensland Government in social or traditional media.
I consent for photos being used in reports and/or promotional material by Gulf Savannah NRM or the Queensland Government.
I consent to quotes from the interview being used in reports and/or promotional material by Gulf Savannah NRM or the Queensland Government.
I consent to the full audio and/or video recording being made available to the State Library of Qld
I would like to receive a copy of my photos/video/audio
I continue to give consent for the above activities in the event of my passing (if N, provide details)
I nominate the following person to discuss the use of recorded material after my passing: (name and contact details):
Y/N
Y/N
I understand that the data collected from my participation will be used in a report to the Queensland Government and publicly available for anyone interested in historical information from this region. Excerpts of this report may also be used on websites and in future reports.
Signed: ______________________
Name: ______________________
Witness: _________________
Name: ___________________
Date: Date: ___________________
The Gulf Savannah Story – Interview checklist and notes
Pre-Interview Checklist Recruitment.
• Please use the spreadsheet on Teams (under 0107-NRRP/Communications) to coordinate who has already been contacted, interviewed, lined up to interview, or not interested.
• Choose people with either breadth or depth of knowledge. Long-term memories are great, but so are detailed observations (even if they are more recent).
• Try to recruit a diverse range of perspectives, experiences and locations.
• Contact and secure participants early so there are more scheduling opportunities to meet.
• Ask people to suggest other possible participants
Days before the interview.
• Make a 10 minute phone call to outline expectations, consent, answer questions, and get them prepared and thinking about what stories, photos or records to share.
• Choose a location that is quiet, private and free of interruptions
• Schedule 2 hours for the interview (setup, pack-down, pre- and post- recording pleasantries)
• Send information and consent sheet beforehand, if possible
• Be familiar with the questions.
At the interview location.
• Put people at ease and make comfortable at all times. Be conversational! Break the ice!
• Go over information sheet. Make sure consent form is understood and signed.
• Set up equipment in a suitable (quiet, well-lit, quiet, distraction-free) location.
• Explain that you may be taking notes, or otherwise appear distracted, but you are still being very attentive to what they are saying.
During the interview
• Build trust and rapport as you go.
• Don’t worry about silences or gaps.
• Don’t talk over them – even when agreeing in active listening (mmhm, aaa, ok!). Try not to interrupt when the interviewee is talking freely.
• Be attentive, use eye contact, head nodding and other non-verbal forms of active listening.
• Remember you are helping them tell a story for people who are not currently present.
• To dig deeper, ask follow-up questions like where & when, or “How do you know that?”
After the interview
• Take photos of participants and their environment (with consent)
• Take photos of any documents, photos or records shared.
• Write up notes ASAP
• Follow up on anything you said you would, in order to maintain trust
• Return audio/video files, consent form and summary notes to Mareeba office ASAP
Interviewee Name
Contact details (phone/email)
Organisation, Position
And/or area of expertise
Current residential address
Interview Date & Location
Type of interview (circle all that apply)
Information sheet sent & read
Consent form/s completed
Interview format
Evidence collected (photos, records, etc)
File name/location
Interviewer name
Other important details
Phone/In-person/Individual/Couple/Parent-Sibling/Group
Video/audio/notes only
IMPORTANT. Throughout the interview, ALWAYS clarify WHERE & WHEN things happened (who, why and how are also good to ask as probing questions). Clarify as much as possible, because people listening to the interview might not know what you’re talking about.
Introduction & overview
• We will cover five main topics. I want to hear your stories, opinions and insights about each topic in your own words.
• I might then ask you some follow-up questions to learn as much about a topic as I can.
• This should be a free-flowing conversation, even if I’m doing my best to remain silent for the recording. There are no wrong answers. Just be yourself.
• It should take about an hour.
Demographics:
• Age or age bracket of participants: ____
• Family has been here for ____ generations and/or since the year: ____
• Locations/name of stations/properties/communities/towns likely to be discussed in interview (confirm at end of interview):
General life:
• What is your interest in being part of this project? What would you like to see happen with the shared information?
• 70-80 years ago, what do you think life was like on this station/property/community/town? You could consider what was the main form of transport, what was sold, education availability, working with Aboriginal People, station owners, Government departments.
• What did the house look like? When was there electricity, phone, roads? What was life like? What have others told you about this place?
Origin story:
• Have you got a story about where your land comes from? It could be traditional, spiritual, or to do with your family history.
Intro: There are lots of private records for temperature and rainfall around the Gulf Savannah Region. This private data often covers areas where there are no official records. So, we are interested in local weather data and memories of the overall climate in your local area. This means rainfall, or lack of it; runs of hot or cold days; numbers of frosts. If you know of years that had terrible dust storms it would be great to hear about them.
1. Tell me about the climate of the past.
a. What sort of changes in the climate have you noticed over time?
b. Is the wet or dry season moving a bit earlier or later?
c. Do you notice any flowers or birds earlier or later than they used to be.
d. Are you able to share any historical rainfall records with me?
2. Can you tell me which years were particularly wet or dry?
3. Do you have records of how long nearby creaks/rivers ran or held water?
4. Can you tell me about fire management or natural fires that burned over the decades?
Intro: This covers any grazing or cropping activities that have happened in the past. You may know of programs or trials that were run or if there was a style of land management, e.g. organic or minimum till. It also includes any mining or mineral exploration that may have happened.
1. What have been the main uses of land in the place(s) we are discussing?
2. Tell me about a significant event that meant things changed with stocking or crops. E.g.: stock sold off unexpectedly; crops planted or harvested differently to planned
3. What weeds and feral animals have you have to deal with? How did you manage them?
a. What was the result of having the weeds or feral animals?
b. What happened to the vegetation?
c. Do you have any photos you would like to show me?
4. How have you seen the vegetation type and cover change over the decades? E.g.:20% trees; 70% grasslands; 10% bare dirt
5. Are you aware of traditional or other, uses of the land? What kind of plants and animals were used or consumed?
6. River conditions: Which waterways have you observed? Did the water run clean or brown? Was there erosion? What plants were on the banks? Were there snags in the stream or did it fill with sediment (eg. Swimming holes became shallower)? Did flood levels/behaviour change? – WHEN did you notice changes in these observations?
Intro: Let’s talk about the plants and animals that were and are here. You might have heard or read in an old diary that certain plants or animals were used, eaten or just seen. You may have done some surveys on a particular species, or a group or organisation may have done one for you. Are the plants and animals present today different to in the past?
7. What are some common wild plants and animals that you see on the land today? Have you noticed any disappear over the years? When was it last seen?
8. If we were sitting around a fire now, remembering times out mustering, checking waters or walking the land, what were different areas of your place like? Were there a lot of birds or native animals using the trees, troughs, or fences? Were kids finding more lizards under rocks and rubbish than today? Were there more edible plants or medicine?
9. Can you tell me about some of the practices that may have affected native birds and animals (for better or worse)?
10. Can you tell me about some of the practices that may have affected native vegetation (for better or worse)?
11. What species of fish/crabs/prawns/etc. did you catch in the rivers? Have any disappeared?
12. For the places we’ve talked about today, what do you think needs to be done so they’ll be in good condition in the coming decades?
13. What would you like to see or have more information or training on? You may wish to know more about:
• new market opportunities and how to access them
• linking with industry bodies
• property planning or management
• learning more about soils, pasture species
• weed and feral animal management and coordination
• water run-off or water quality
• plants found only in this region
• birds, mammals, frogs, tree-dwelling animals, insects found only in this region.
14. Is there anything else you would like me to follow up for you within Gulf Savannah NRM?
Summary – which locations were discussed in this interview?
Summary – what themes or topics came up in conversation?
Summary – Key quotes/important things
Follow-up actions
Before the interview:
● Research the location you are going (ask others or look on files for eg) this will help you build rapport when you are there.
● Plan time at the location or before for a preliminary conversation. Plan time at the location for preinterview conversation, a possible mid-interview break and post-interview pleasantries. During the interview:
● Your interview will essentially follow this structure:
1. Introduction and explanations about the project
2. Begin hearing narrative answers
3. Questioning (then repeat step 2 & 3 for each of the sections)
4. Conclusion – finish the interview and explain the next steps
● You should take any recording equipment with you, but not have them out on the table not set up during the pre-interview chat. Be clear when you are starting the recording, so nothing is assumed recorded (and then possibly missed) before you start. You can be getting it organised but say that you’ll let them know when you are recording and starting the interview.
● Guard against making promises you may not be able to fulfill.
● It’s a conversation, not an interrogation! Be genuinely interested in what your participant has to say about a topic. Avoid interrupting. Be an active listener; use eye contact when culturally appropriate, smile, nod or hmmm to encourage. You have committed this much time and effort, only say what you need to say to get them to share their point of view or story. Only in a relaxed interview will they feel at ease to relate personal views and experiences.
● Work to achieve a balance between the objectives of the project and the perspectives of the participant. Be sensitive to the diversity of social and cultural experiences and to the implications of race, gender, class, ethnicity, age, religion, and sexual orientation.
● When interviewing, interruptions (of other people and things) should be avoided. It is your responsibility to make certain that your participant understands that interruptions from other people or phones disrupt the interview and decrease the value of their contribution. Having said that, it is important to read your participant’s body language and to take comfort breaks as needed. We want your participant to feel at ease.
● Use the list of topics and sub-topics as a guide through your interview so you can respond to what is being said and ask more in-depth questions about what they are saying and be listening to what they are telling you. For each section, lead your participant in with the topic and questioning paragraph provided and let them go. After they have told you what they want to say then ask a couple of questions like:
o What happened after/before…
o Can you say a bit more about…
o How do you know that…
● Encourage participants to respond in their own style and language and to address issues that reflect their concerns.
● Respect the right of the participant to refuse to discuss certain subjects.
● Use the participant’s name early on in the interview so the recording is always identifiable. ASAP after the interview label files with name, date, location.
● During the interview take notes, even if it is being recorded. This might help you ask follow-up questions and will help with your notes after the interview.
● You may also remember to write down the time during the first section (or even better at the start) of your interview. Later, if there is a good quote or section you wish to write exactly what was said you can then write the time on your notes page there too and if will be easier to find later.
● Don’t worry about moments of silence. Assure your participant to also not worry if there is a silence or they would like to collect their thoughts. We are not broadcasting the interview live, we are recording their memories and can edit all we like later! Their considered information is what is important to us.
● Don’t worry about the grammar or spelling in the notes you take during the interview. You will have a chance to improve them with a spell checker and find out how to spell names later. After you have finished the interview, you could glance back through your notes and check something with your participant if you are worried about something like getting someone’s name recorded correctly.
● As soon as possible after the interview, upload the named interview to the work server in a folder for that person. Don’t touch that recording again ��
● You can then listen back using your initial recording on your portable device for your notetaking and quote finding. When you’ve finished that person’s summary sheet, delete the recording from the recording device you take with you to interviews.
● You will not need to do any editing of the recording.
● Aim to do this as soon as possible after the interview. (You will more likely be able to read your notes if you can still remember what was said) Aim to type up the notes the next day.
● First, just type your notes where they fit into the categories. Get everything written up that you wrote during the interview.
● Next, read through your typed notes and do any “fixing” for clarification. Use [brackets] if you need to add 1-2 words to explain what was implied but not said, eg [around Croydon} if the participant said around town and they live/d at Croydon.
● If you have found an interesting, lovely, or media-worthy quote, find it in your recording and type it up as a quote. Add it at the end in the section in Key quotes/important messages.
● Ponder, read your notes or listen to the recording to identify 1-2 dot points from each of the sections. These will be the points drawn out for reporting and then your earlier notes will be used for reference and context. Add the dot points in bold at the end of each section. If there are overarching things you wish to highlight, put these in “Key quotes/in important messages”.
● It will be very valuable to the project if you are able to write down on the summary sheet:
o The tone of the interview- were they optimistic, pessimistic?
o What social, cultural and political issues were raised? Significance of these statements?
• Speech to text software is being investigated. There is no need to type a whole transcript.
● Save the Interview Summary in a folder with the audio recording, photos and any scans you have including the consent form.
Time commitment
• Roughly, for each interview allow 7+ hours of time per interview.
o 0.25hr Phone call and initial chat
o xx Travel
o 0.5hr Polite chat and set up
o 1-1.5hr Interview
o 0.5hr Photos and chat
o 0.75hr Upload/download
o 3.5hr Typing
How to capture photos and videos
• Take multiple photos at every interview. This includes of people, the landscape, the homestead, nice details.
• Take photos in both landscape mode and portrait mode.
• Avoid using the zoom on your device. Instead, move closer to the object before you take a photo/video. Using the zoom will make the image/video more pixelated and reduce the quality.
• For photos of people, ask them to stand on a slight angle from the camera – this can be more flattering. Some tips here: https://www.kellymcphail.com/blogroll/how-to-pose-7-simple-ways-to-look-better-inphotos
• Take at least 3 photos at one time of the person to capture their most natural smile.
• Look for and remove foreground or background distractions like water bottles in front, trees or poles out of heads, shadows that may look odd.
• On your phone, set your photo up ready to take then touch the screen in different areas to adjust the light. You may be able to see a + - slide bar to adjust the light too.
• Whenever possible, get photos of people in a rural landscape or setting – on the farm, in the bush, in front of the homestead.
• Natural light is best, and have the person facing the light. Some lighting tips: https://simplyrootedfamily.com/2019/09/23/dramatically-transform-your-photography-with-these-5simple-lighting-rules/
• Use a separate microphone to record the audio while you take a video with another device. This means we can meet the recording standard of State Library of Queensland. If we follow this standard the recording will be of a high standard and be useful for multiple purposes. It also means you will have a backup if the video recording fails.
• Start the recording with a loud, quick noise, like a clap. This will make it easy to match up the audio and video later. Do this once you press record, but before you start the interview.
• Just like with photos, DO NOT use the zoom in function when recording video. Move closer to the person/object before you start recording, if you need to. The video can be cropped later if needed, but using the zoom will reduce the quality.
• Introduce yourself and the participant at the start of the recording.
• If you can, get some short bits of video footage of livestock, the countryside, a nice sunset – you don’t need audio for this, but it will be useful for creating comms products later. Just look out for anything that grabs your eye.
● Interview: SurnameFirstInitial_Interview_290423_Yoursurname
● Interview Summary: InterviewSummary_SurnameFirstInitial_290423_Yoursurname
● Scanned Consent Form: ConsentForm _SurnameFirstInitial_290423_Yoursurname
● Photos: SurnameFirstInitialForEachPersonInOrder_290423_Yoursurname