PLACEMAKING FOR IMMIGRANT COMMUNITIES GUIDE MATTERLAB DECEMBER 2023 PRODUCED BY: ALONDRA LUNA & JAVIER GUILLEN

1 CONTENTS WHY IT MATTERS ...................................................................................... 2-3 CASE STUDY RESEARCH .......................................................................... 4-8 KEY FACTS ................................................................................................................. 5 DEMOGRAPHICS ........................................................................................................ 6-8 SITE VISITS 1 + 2 ..................................................................................... 9-13 SITE VISIT 1 ............................................................................................................... 10-11 SITE VISIT 2 ............................................................................................................... 12-13 NEW DESIGN CONCEPT ............................................................................ 14-16 DESIGN PRINCIPLES .................................................................................................. 15 PRECEDENTS ............................................................................................................. 16 IMAGINING .............................................................................................. 17-25 DESIGN CONCEPT 1 (MEANDERING PLAZA) ............................................................... 18-21 DESIGN CONCEPT 2 (FORMAL PLAZA) ....................................................................... 22-25 TESTING THE DESIGN .............................................................................. 26-27 SITE VISIT 3 .................................................................................................................2 7 RESULTS ................................................................................................. 28 WHICH DESIGN DO YOU PREFER? ............................................................................ 29-31 CONCLUSION ........................................................................................... 32-33 DESIGN RESOURCES ................................................................................ 34-40
SECTION ONE
Why it Matters?
PLACEMAKING FOR IMMIGRANT COMMUNITIES

2
WHY IT MATTERS?
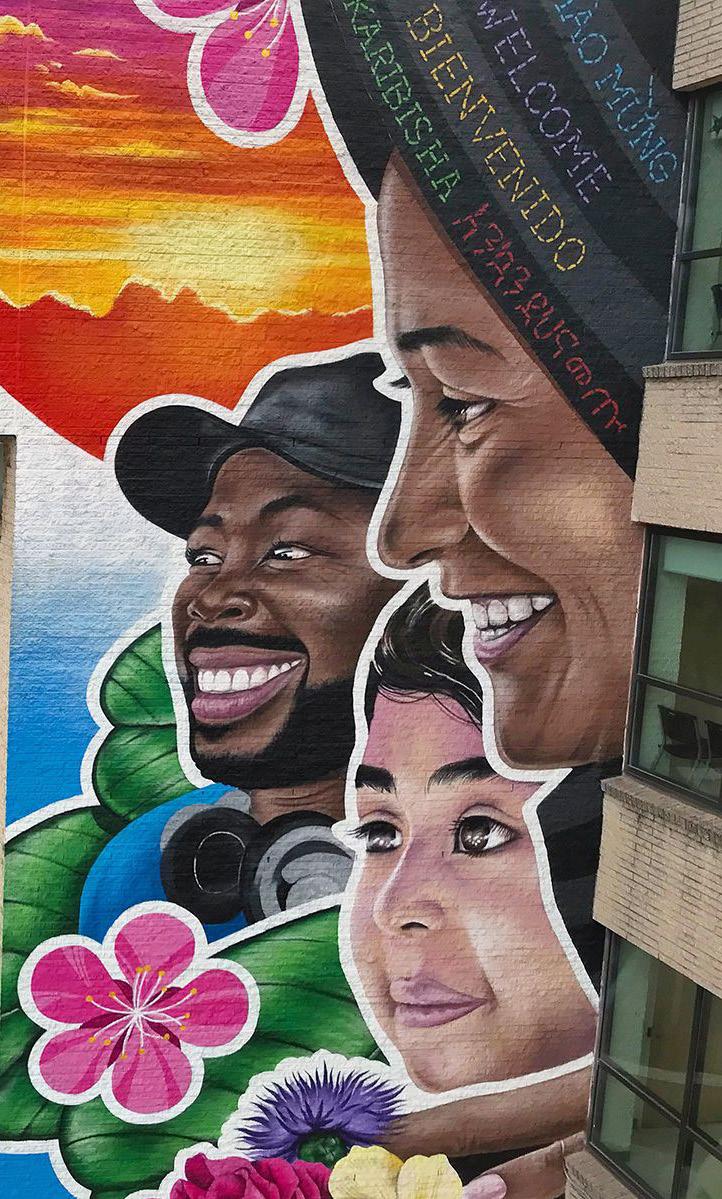
Communities across the United States are beautifully diverse, and shaped by immigrants from around the world. These communities engage with the built environment in unique ways, redefining the use of open spaces based on their distinct CULTURES AND EXPERIENCES. We aim is to explore how placemaking can be harnessed to forge STRONGER CONNECTIONS between immigrant communities and their surroundings.
Drawing from our immersion in immigrant communities and cultures, we possess firsthand knowledge of the complexities that arise when CULTURE AND SPACE intersect. As designers, our mission is to bridge the divide between design and place, ultimately strengthening the profound sense of belonging that people seek. In doing so, we aspire to create spaces that are universally enjoyed, transcending cultural boundaries and WELCOMING everyone, regardless of their origin.

3
SECTION TWO
Case Study Research (Data)
4
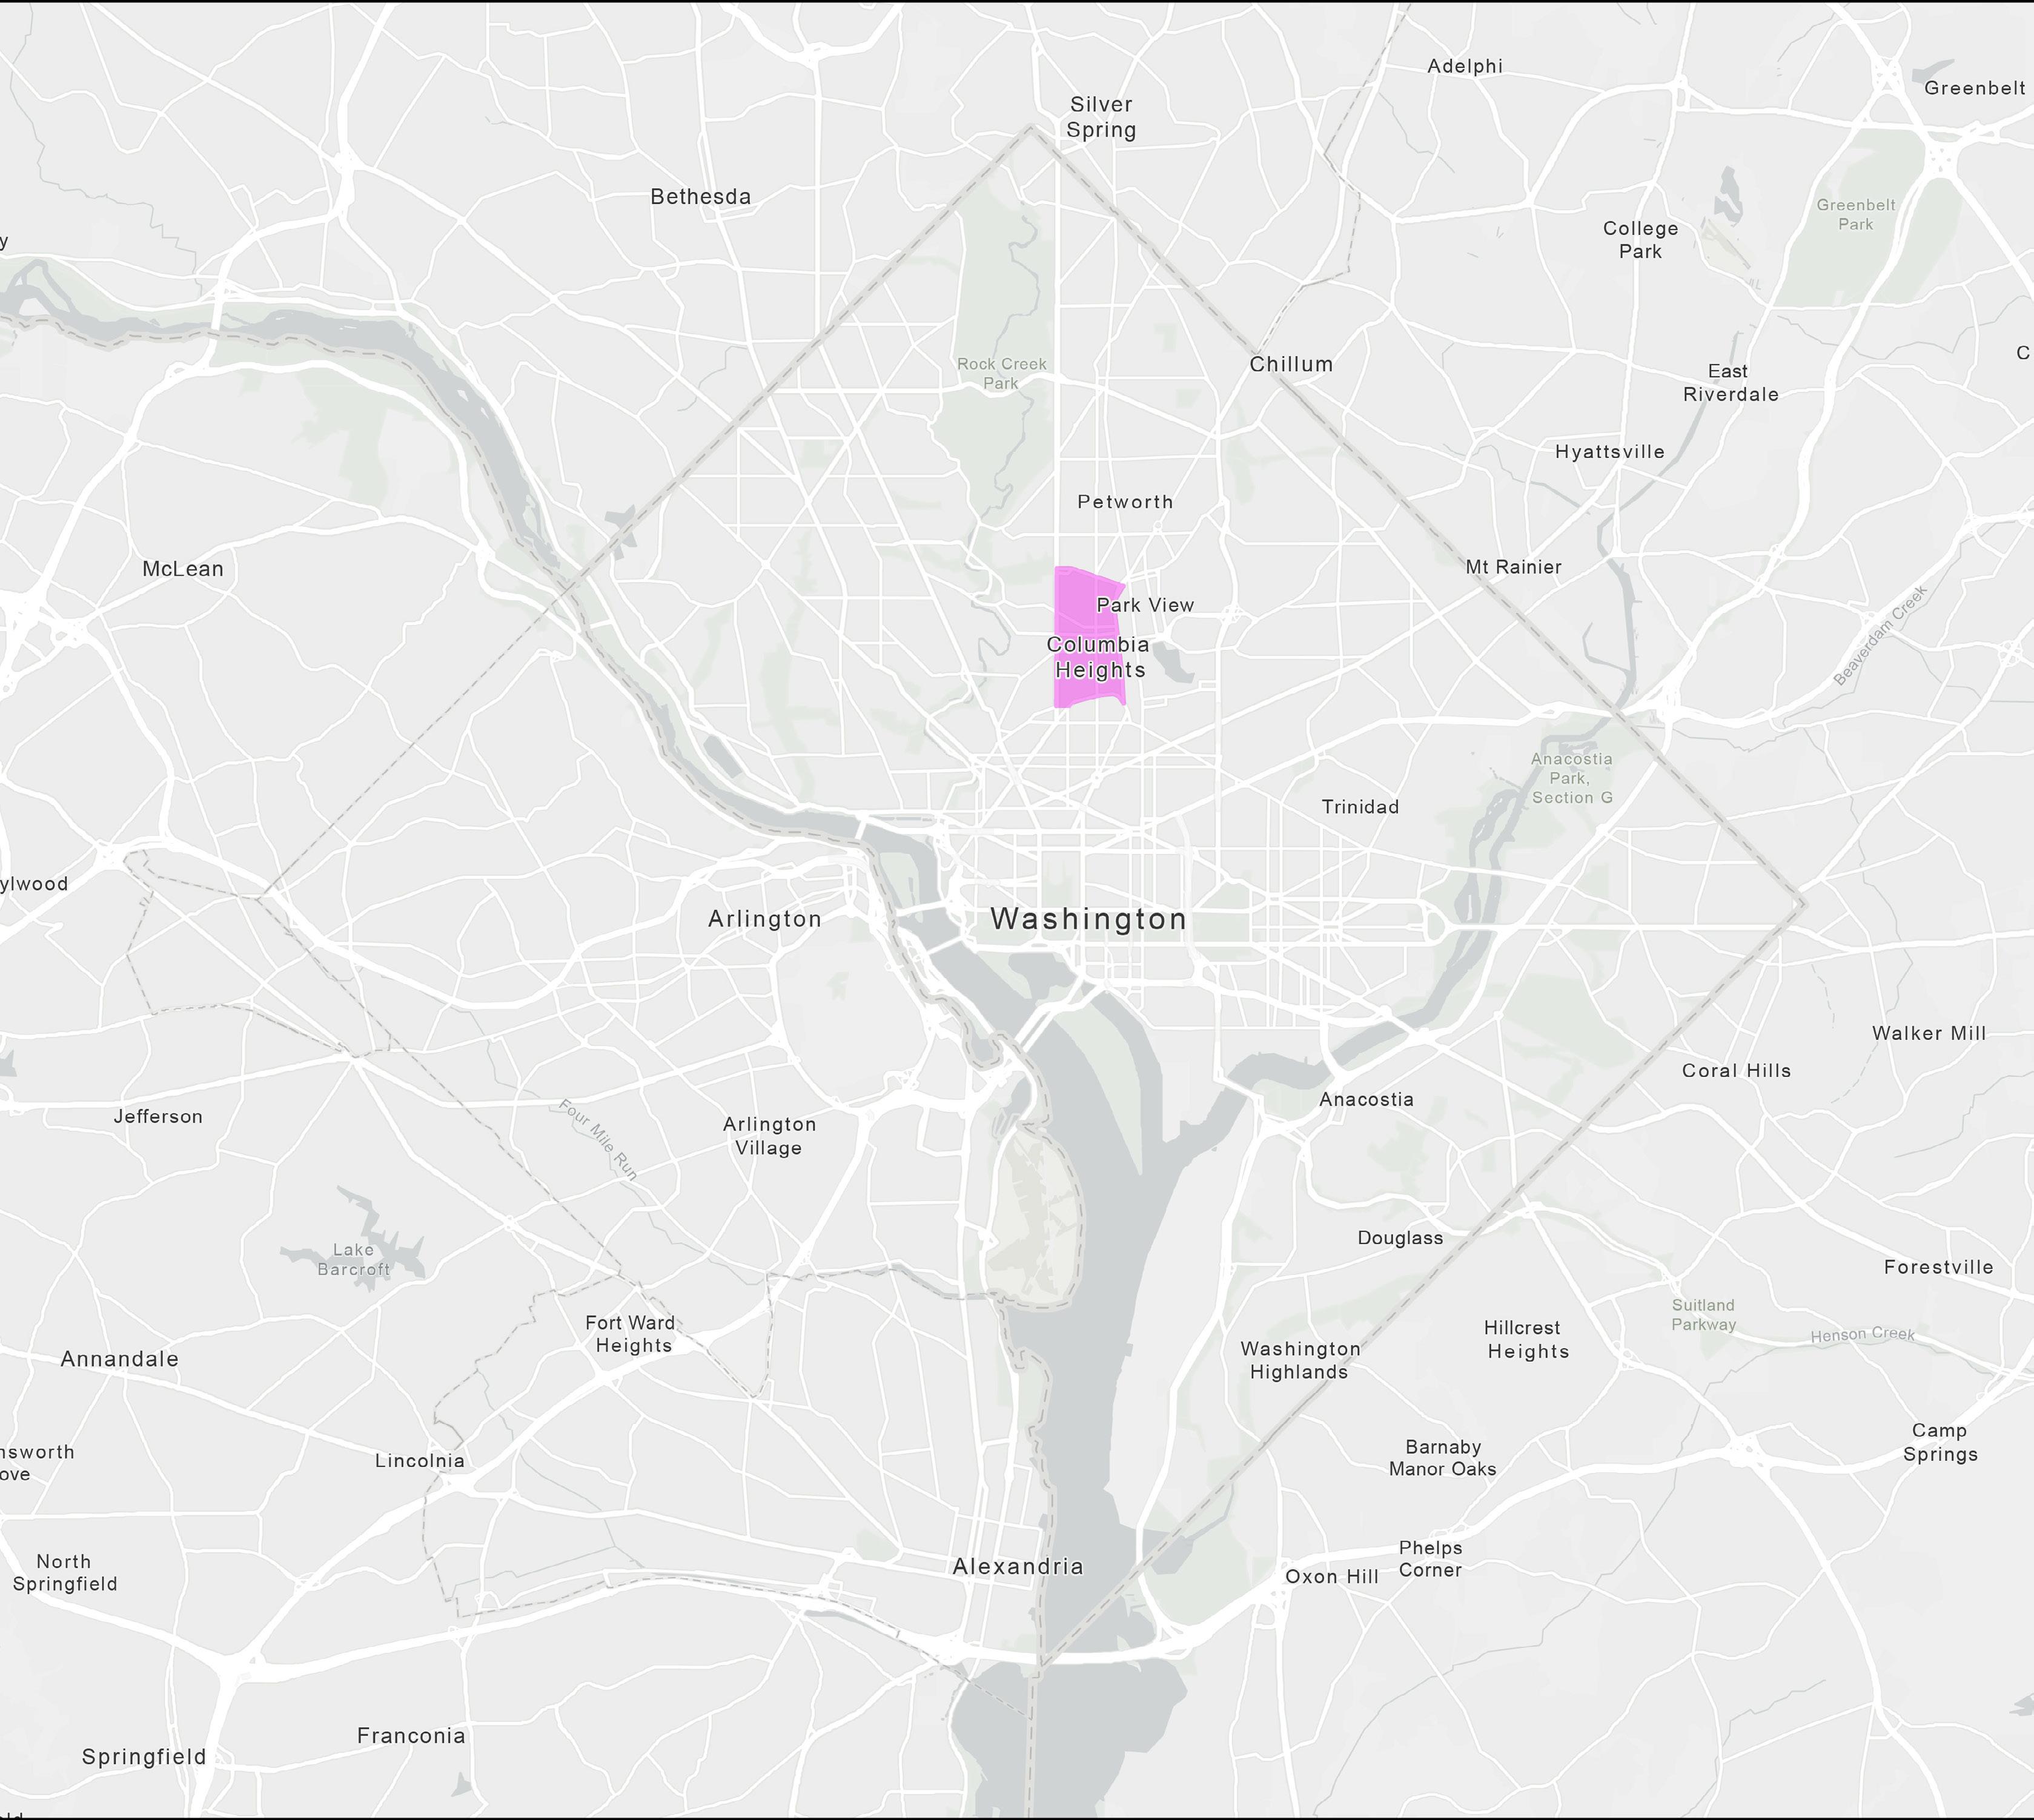
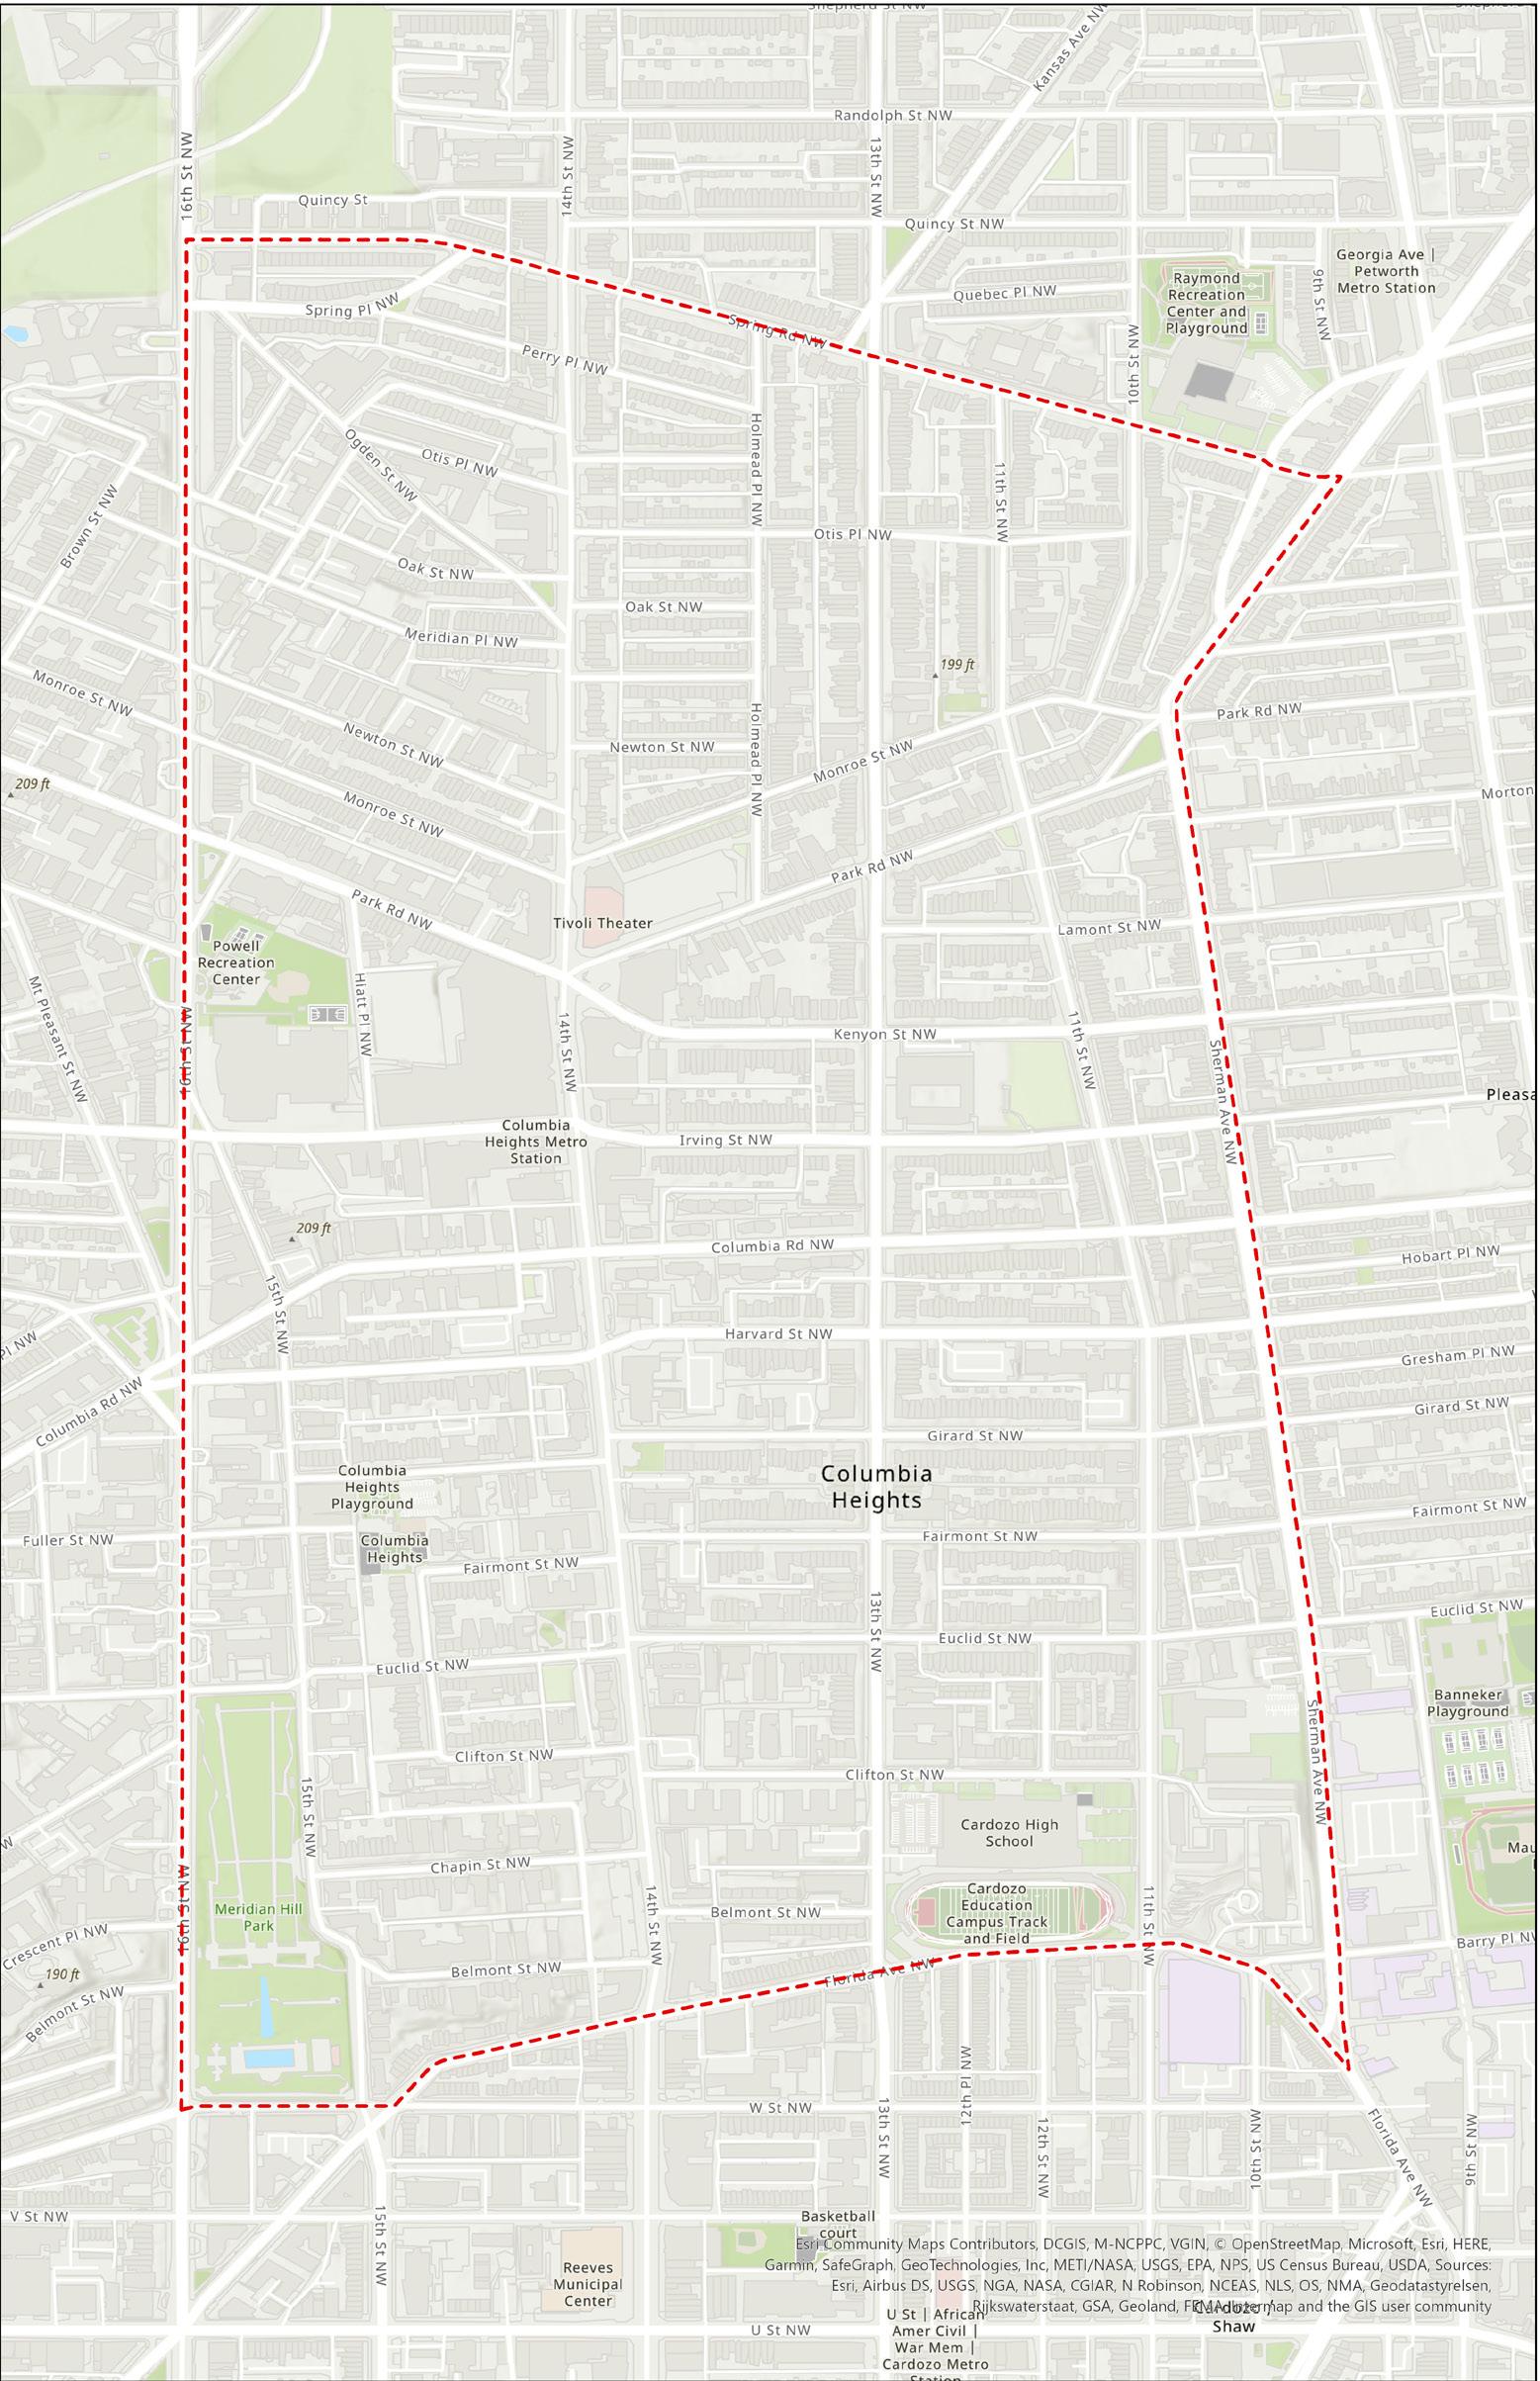
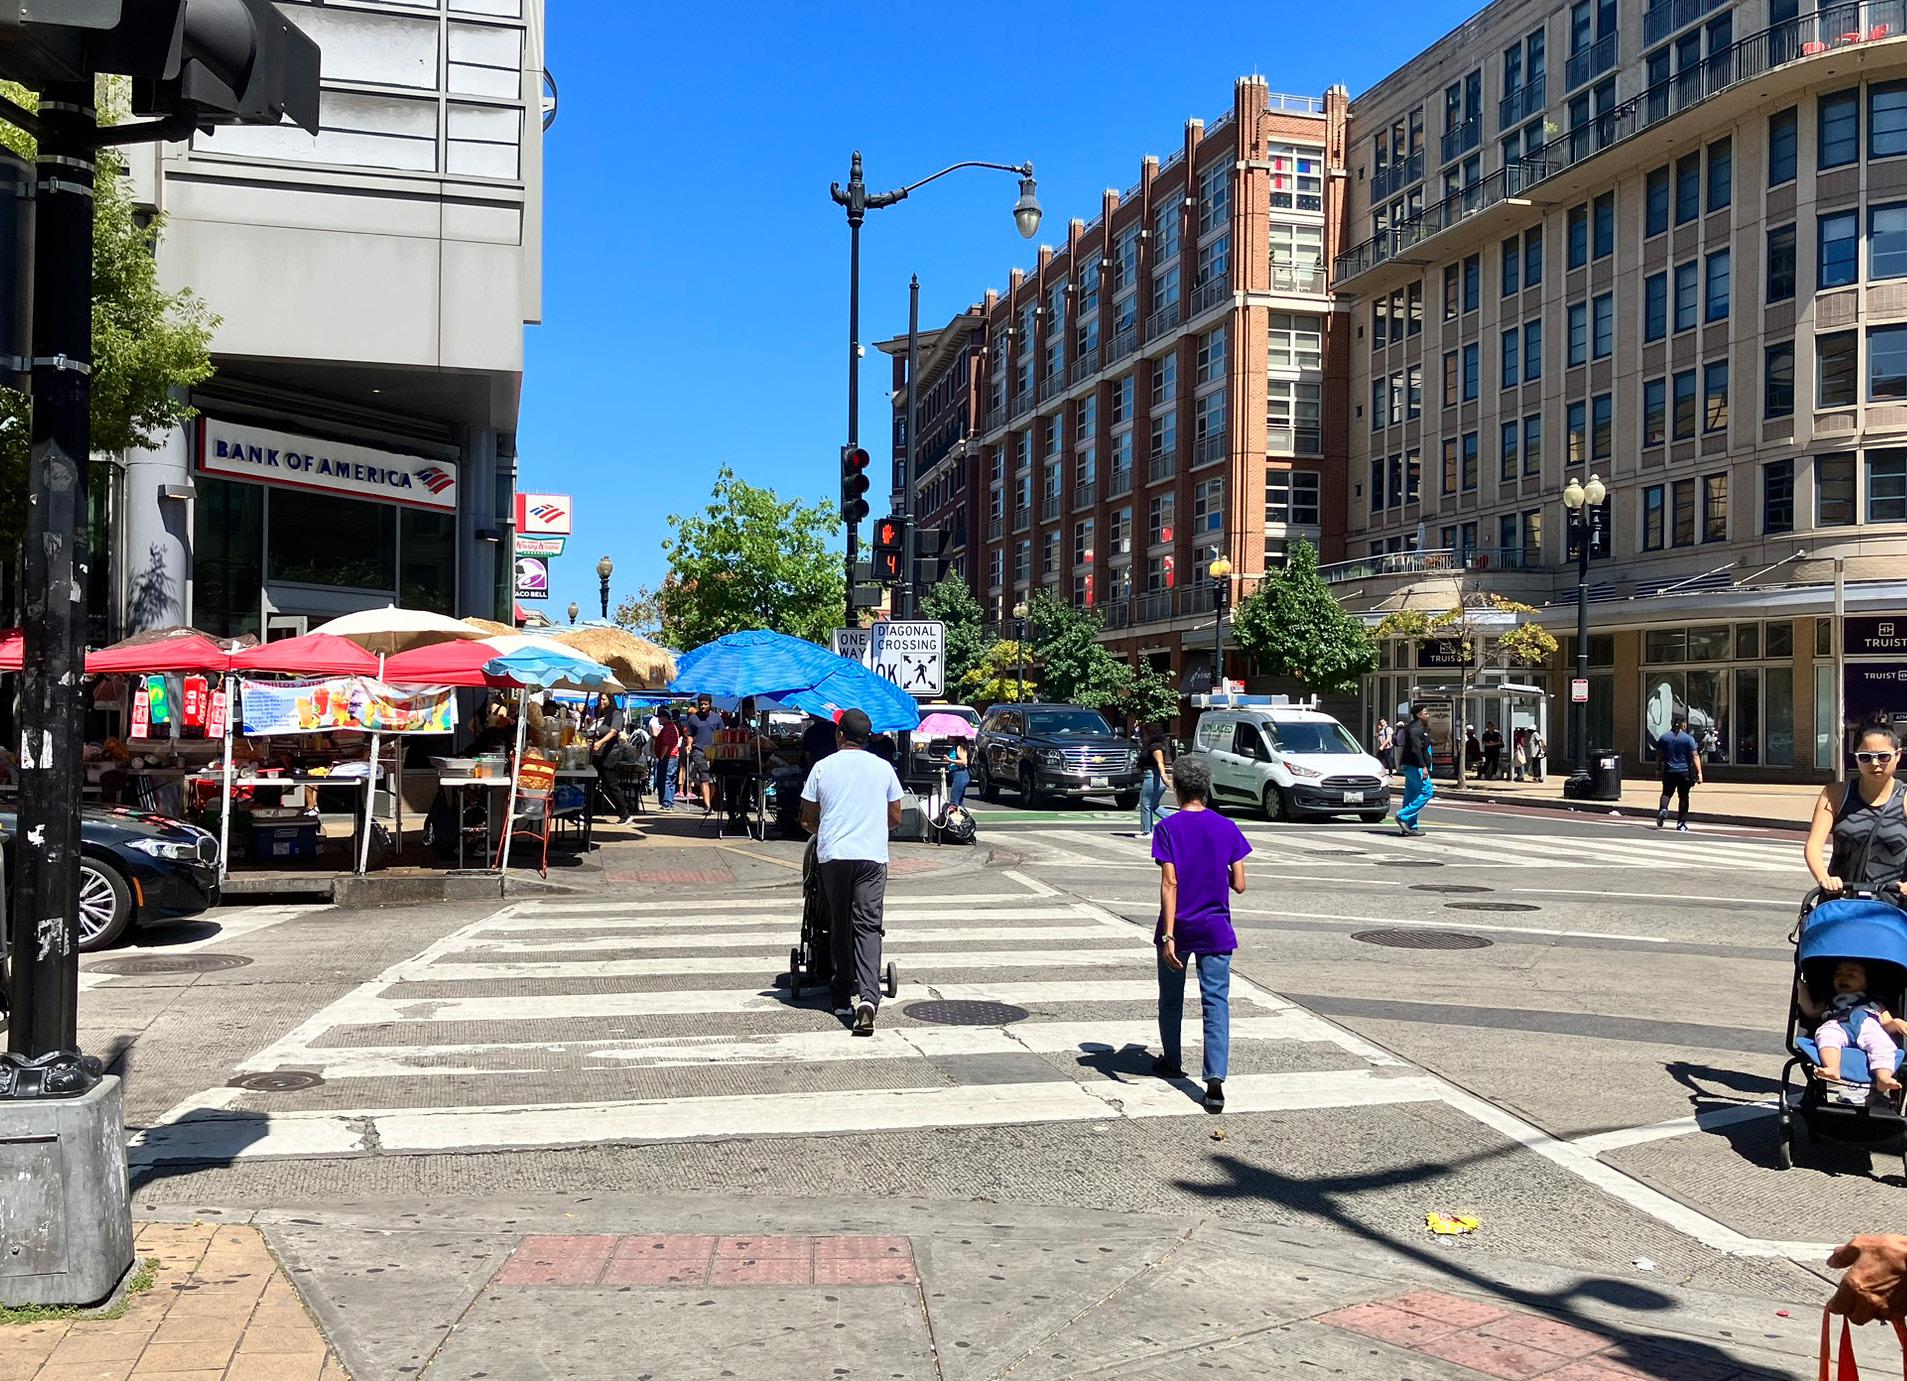
COLUMBIA HEIGHTS
Key Facts:
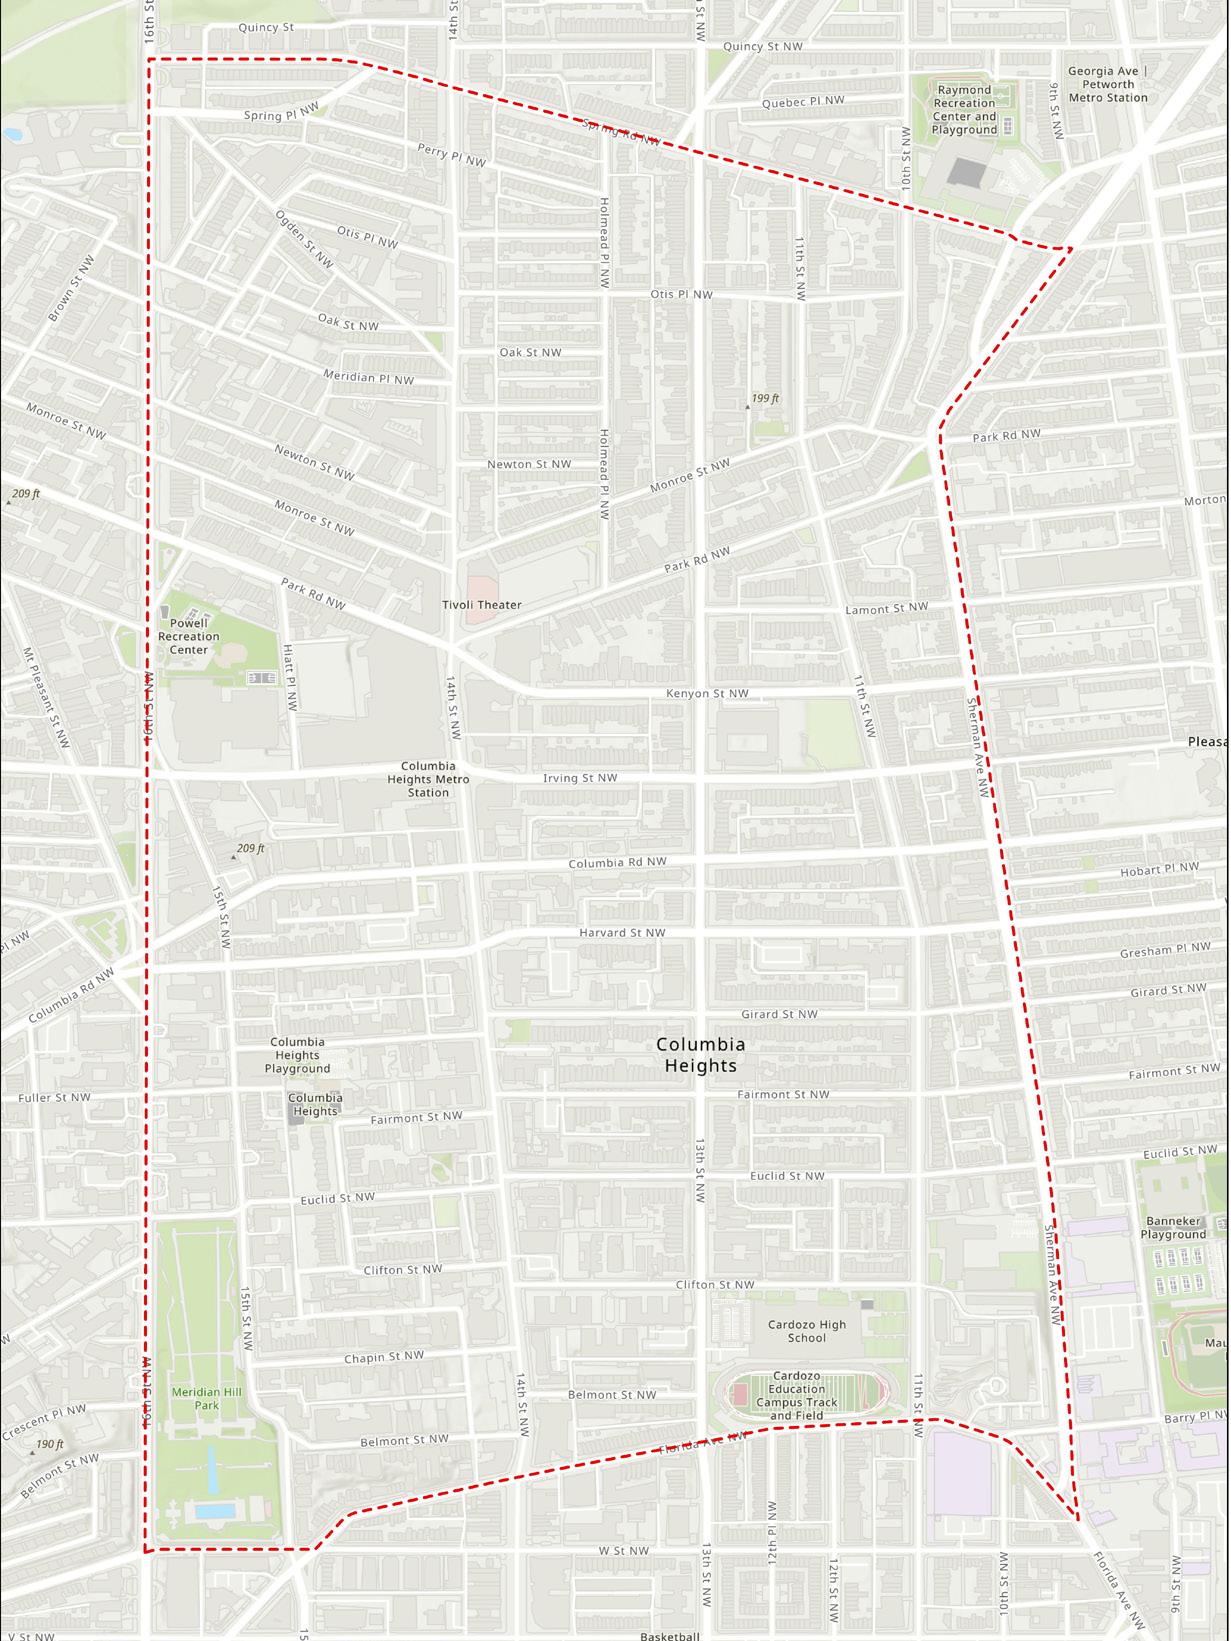
Focus area: Columbia Heights, DC
Acres: 410
Total Population: 29,772
Median Age: 33.6
Households: 13,963
Average Household size: 2.07
Took Public Transportation to work: 37.9
LandDesign Office

5
16,000’ 8,000’ 4000’ 4000’ 0

ONE IN SEVEN DC RESIDENTS IS AN IMMIGRANT (14% OF THE POPULATION) 2010
LARGEST IMMIGRANT POPULATIONS IN DC
11% EL SALVADOR
7% ETHIOPIA
3% MEXICO
13% EL SALVADOR 6% INDIA 5% KOREA
6
SITE ANALYSISDC DEMOGRAPHICS
2020
Source: American Immigration council, “Immigrants in the District of Columbia,” 2020
Place of Birth


7
PLACE OF BIRTH
LATIN AMERICA 58% EUROPE 12% ASIA 16% AFRICA 13% NORTH AMERICA (1%) Source: ACS Places of Birth Variables - Boundaries, 2022
Latin America Europe Asia Africa North America
PREFERRED FAMILY LANGUAGE SPOKEN AT HOME
Language Spoken at Home
ASIAN & PACIFIC ISLANDER (2%) OTHER (2%)
INDO-EUROPEAN (4%)
Who only speak English at home
Who speak Spanish at home
Source: ACS Language Spoken at Home - Boundaries, 2022
Who speak another Indo-European at home
8
ENGLISH 72% SPANISH 20%
SECTION THREE
Case Study (Site Visits)
9
FRIDAY, SEPTEMBER 01, 2023 AT 2:00 PM
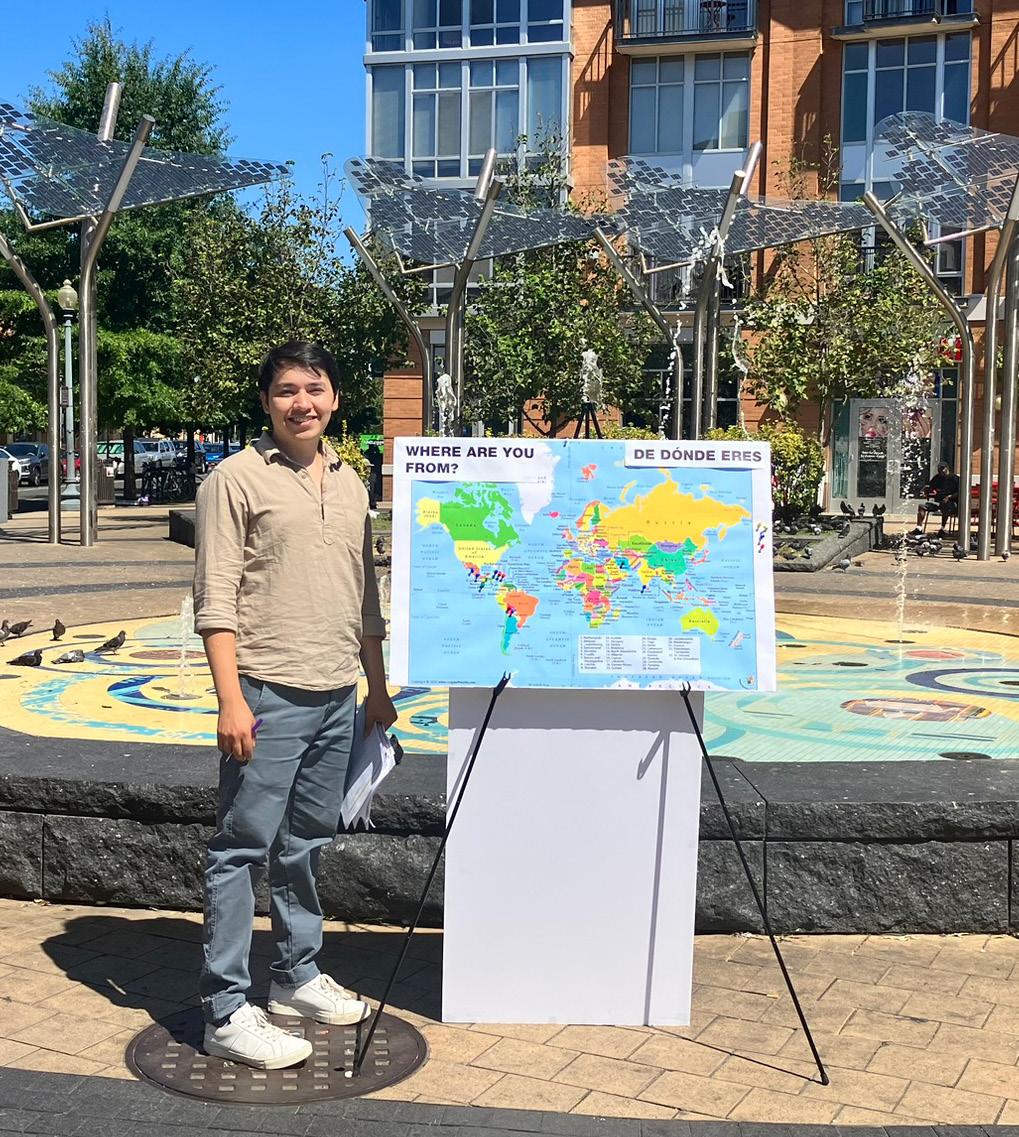
10 SITE VISIT 1 - (QUANTITATIVE-
WHERE ARE THEY FROM?)
SURVEY 1 - RESULTS
2 MEXICO
GUATEMALA 1
3 EL SALVADOR
1 NICARAGUA
2 BOLIVIA
CUBA 1
HAITI
JAMAICA 1 1
CYPRESS 1
1 IRAN
1 INDIA
11
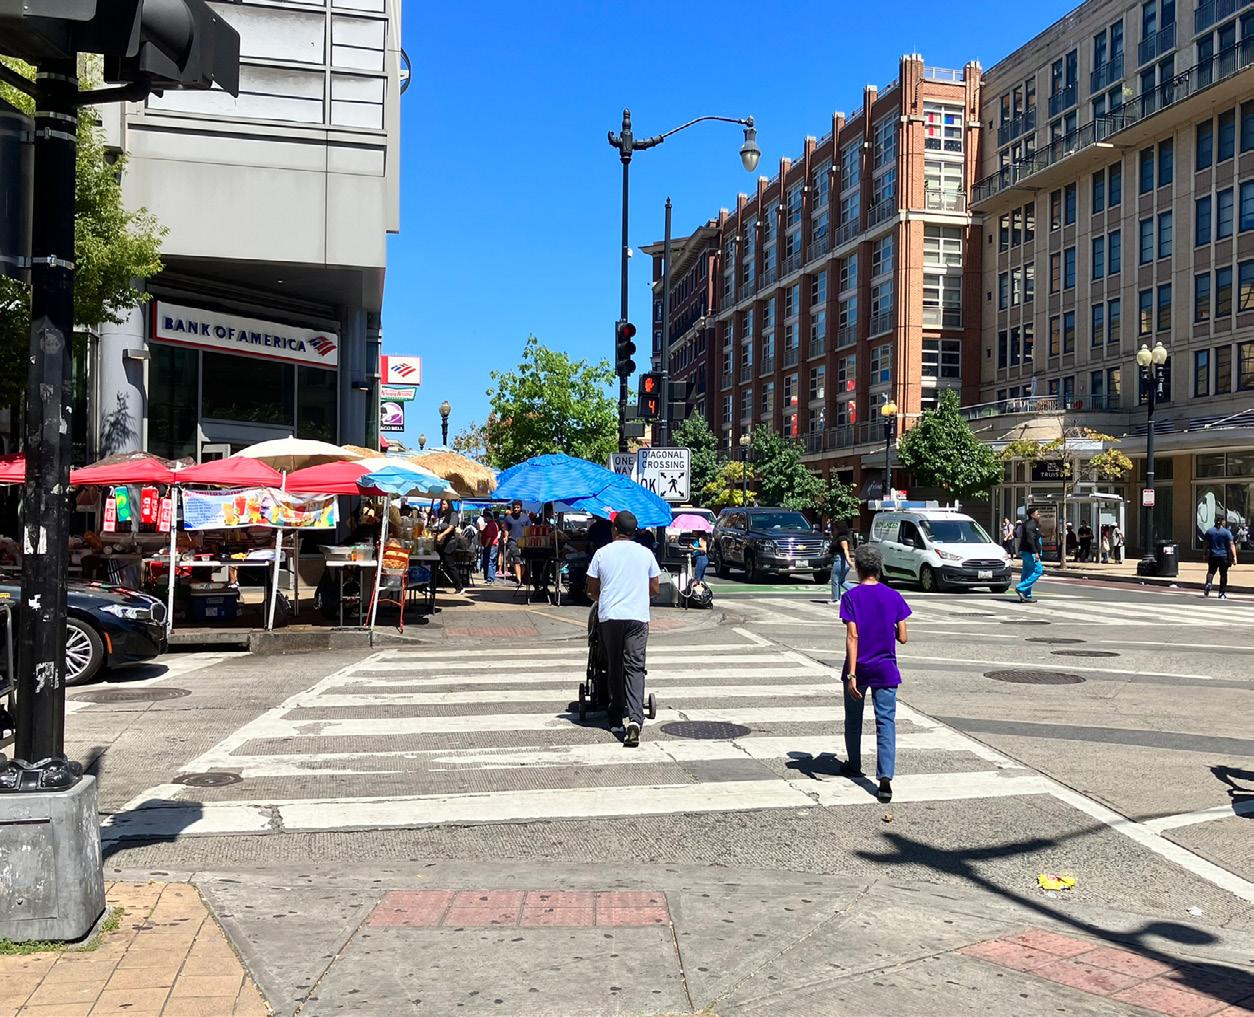
FRIDAY, SEPTEMBER 08, 2023 AT 12:00 PM
12
VISIT
SITE INVENTORY) 1 4 2 3 5 1 4 2 3 5
SITE
2 - (QUALITATIVE-
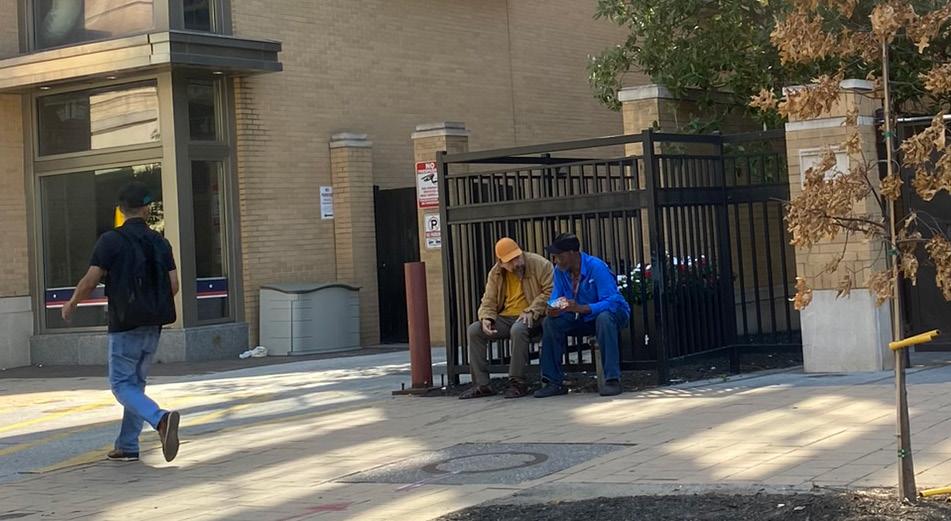
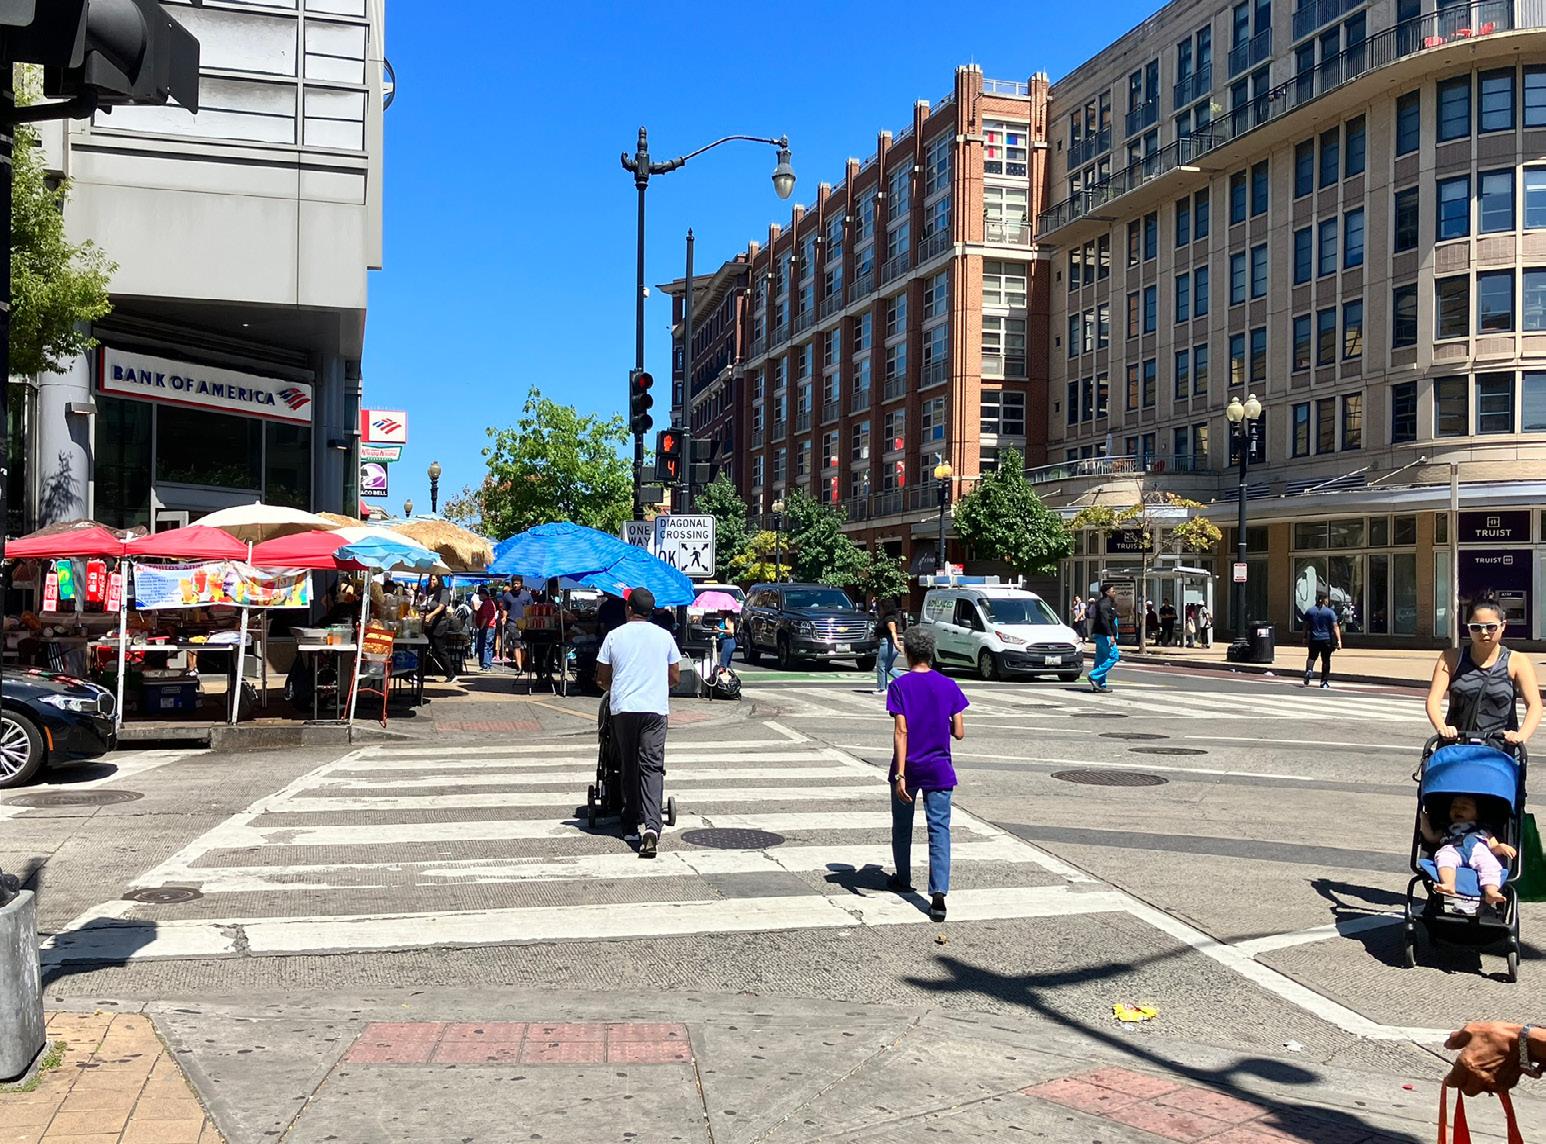
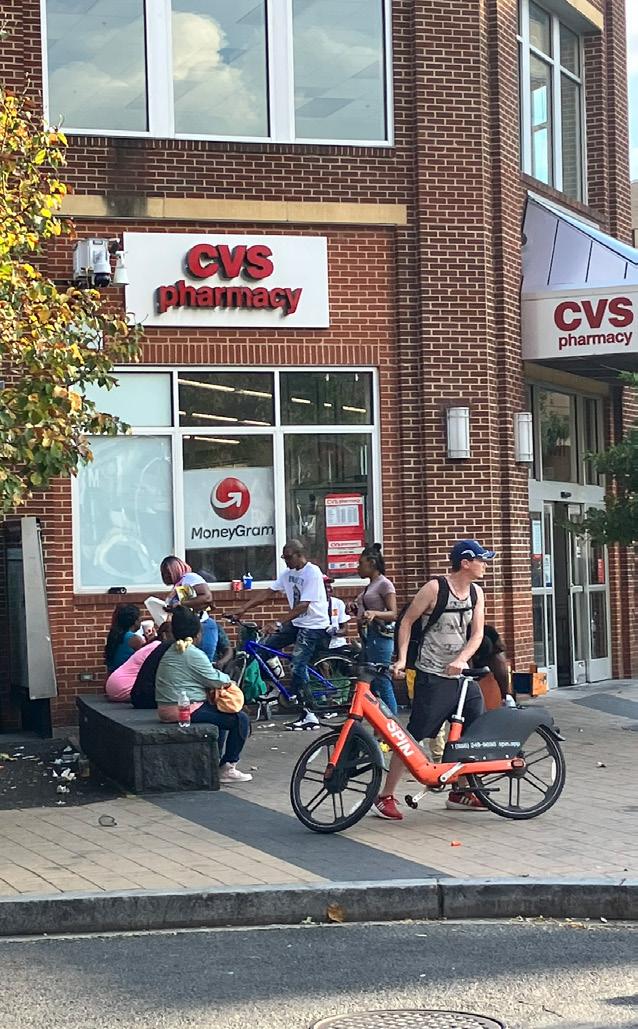
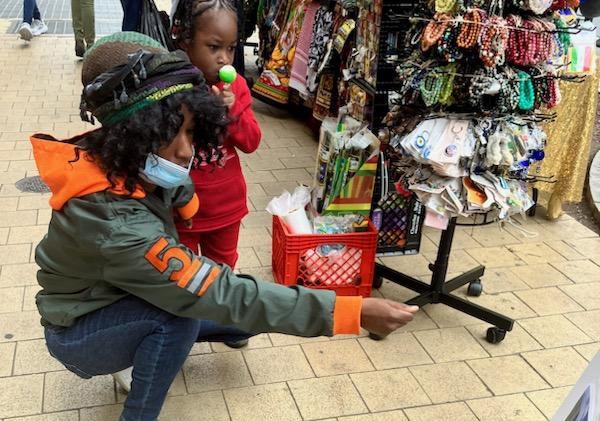
Local Streetscape Vendor Area
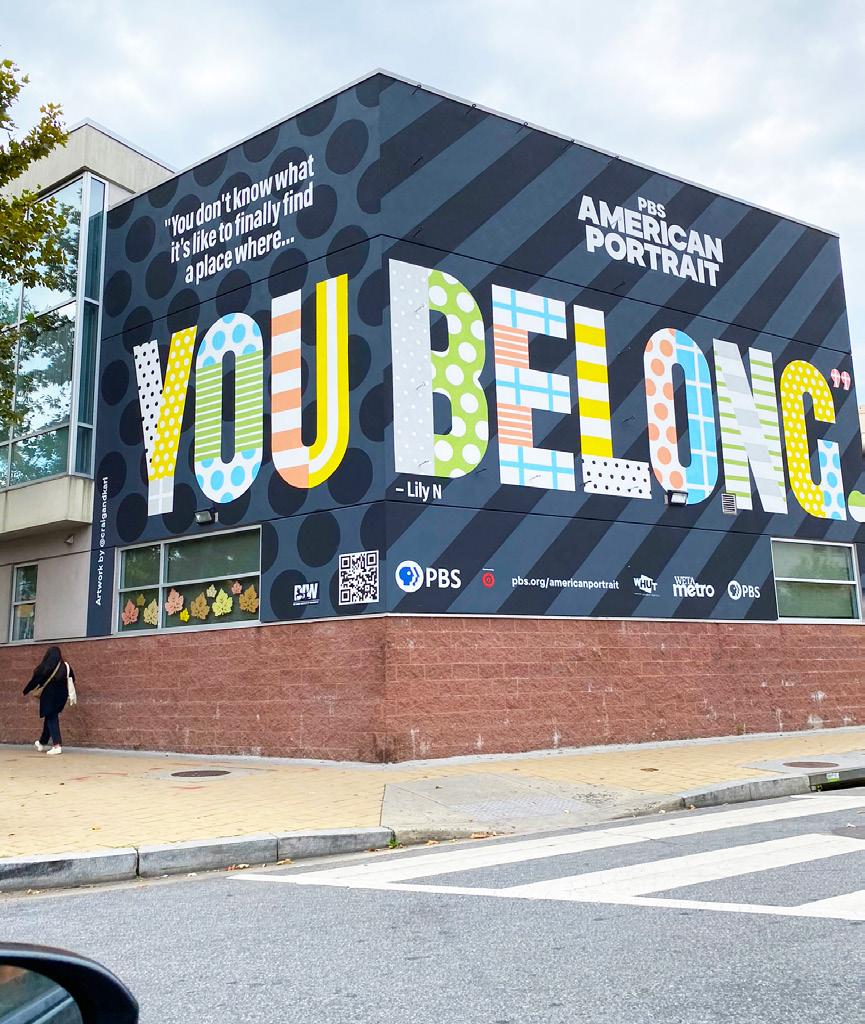
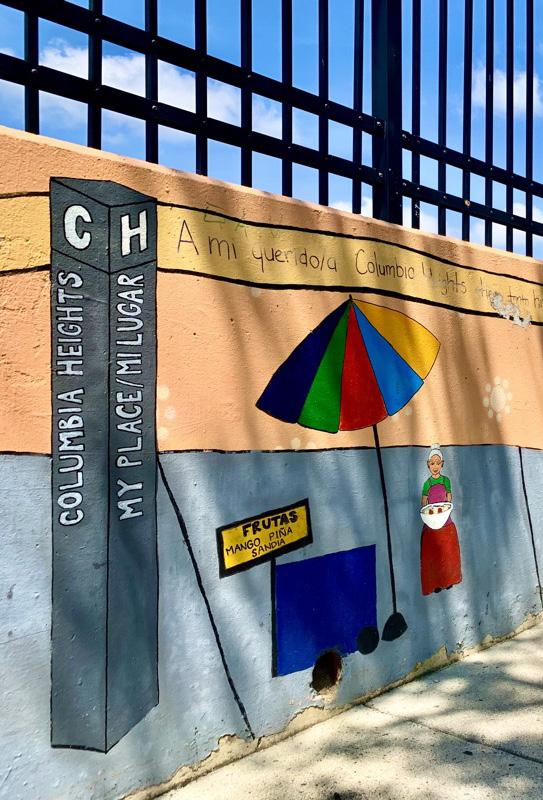
Storytelling Community Mural
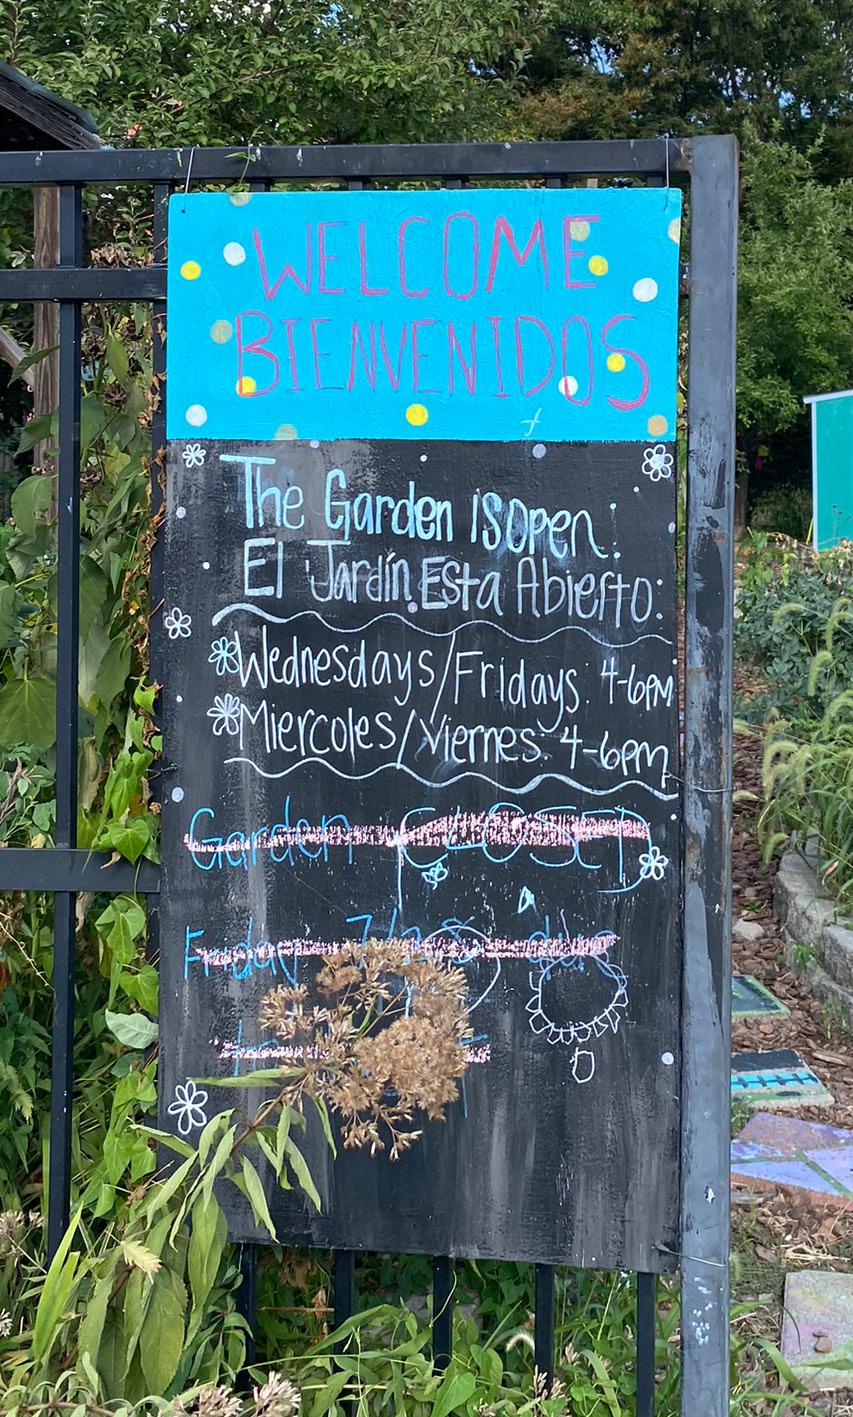
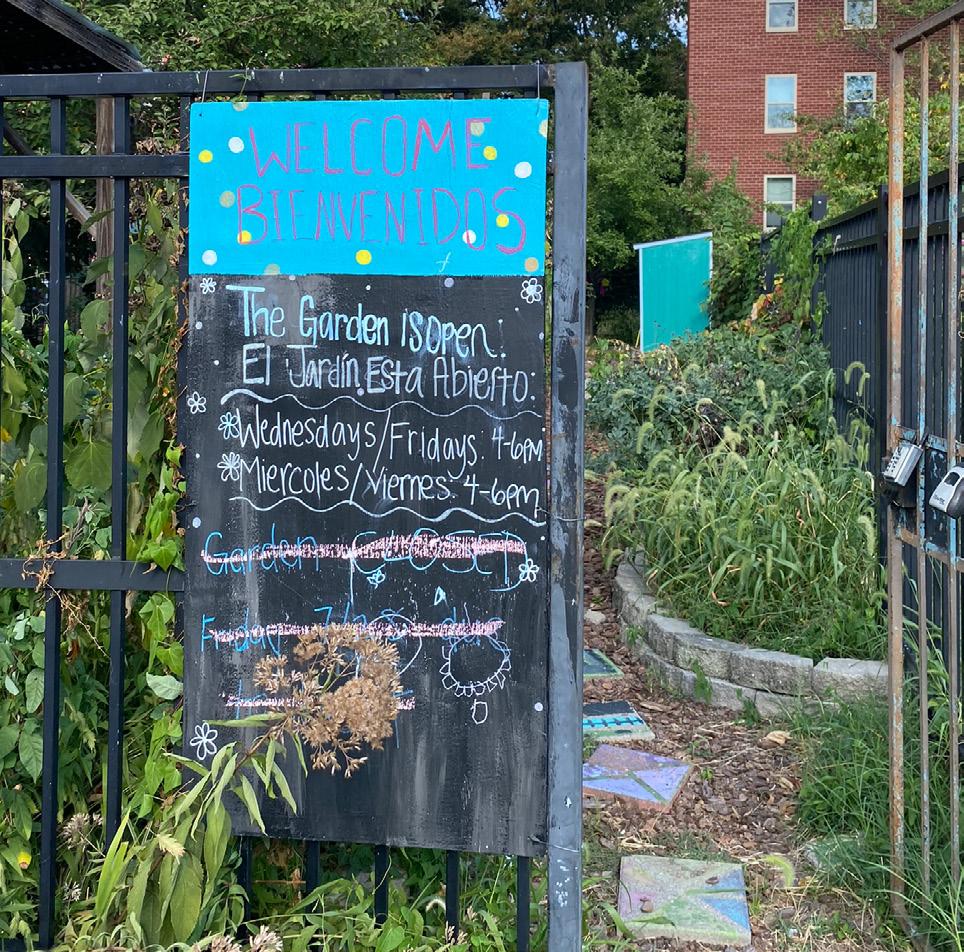
Bilingual Community Garden
Inadequate Seating
Unexpected Pockets of Seating
LACK OF SHADE
ABSENCE OF LANDSCAPE
UNFLEXIBLE SEATING
EXTENSIVE PAVEMENT
ABSENCE OF SEATING
SHORTAGE OF CAFE SEATING
13
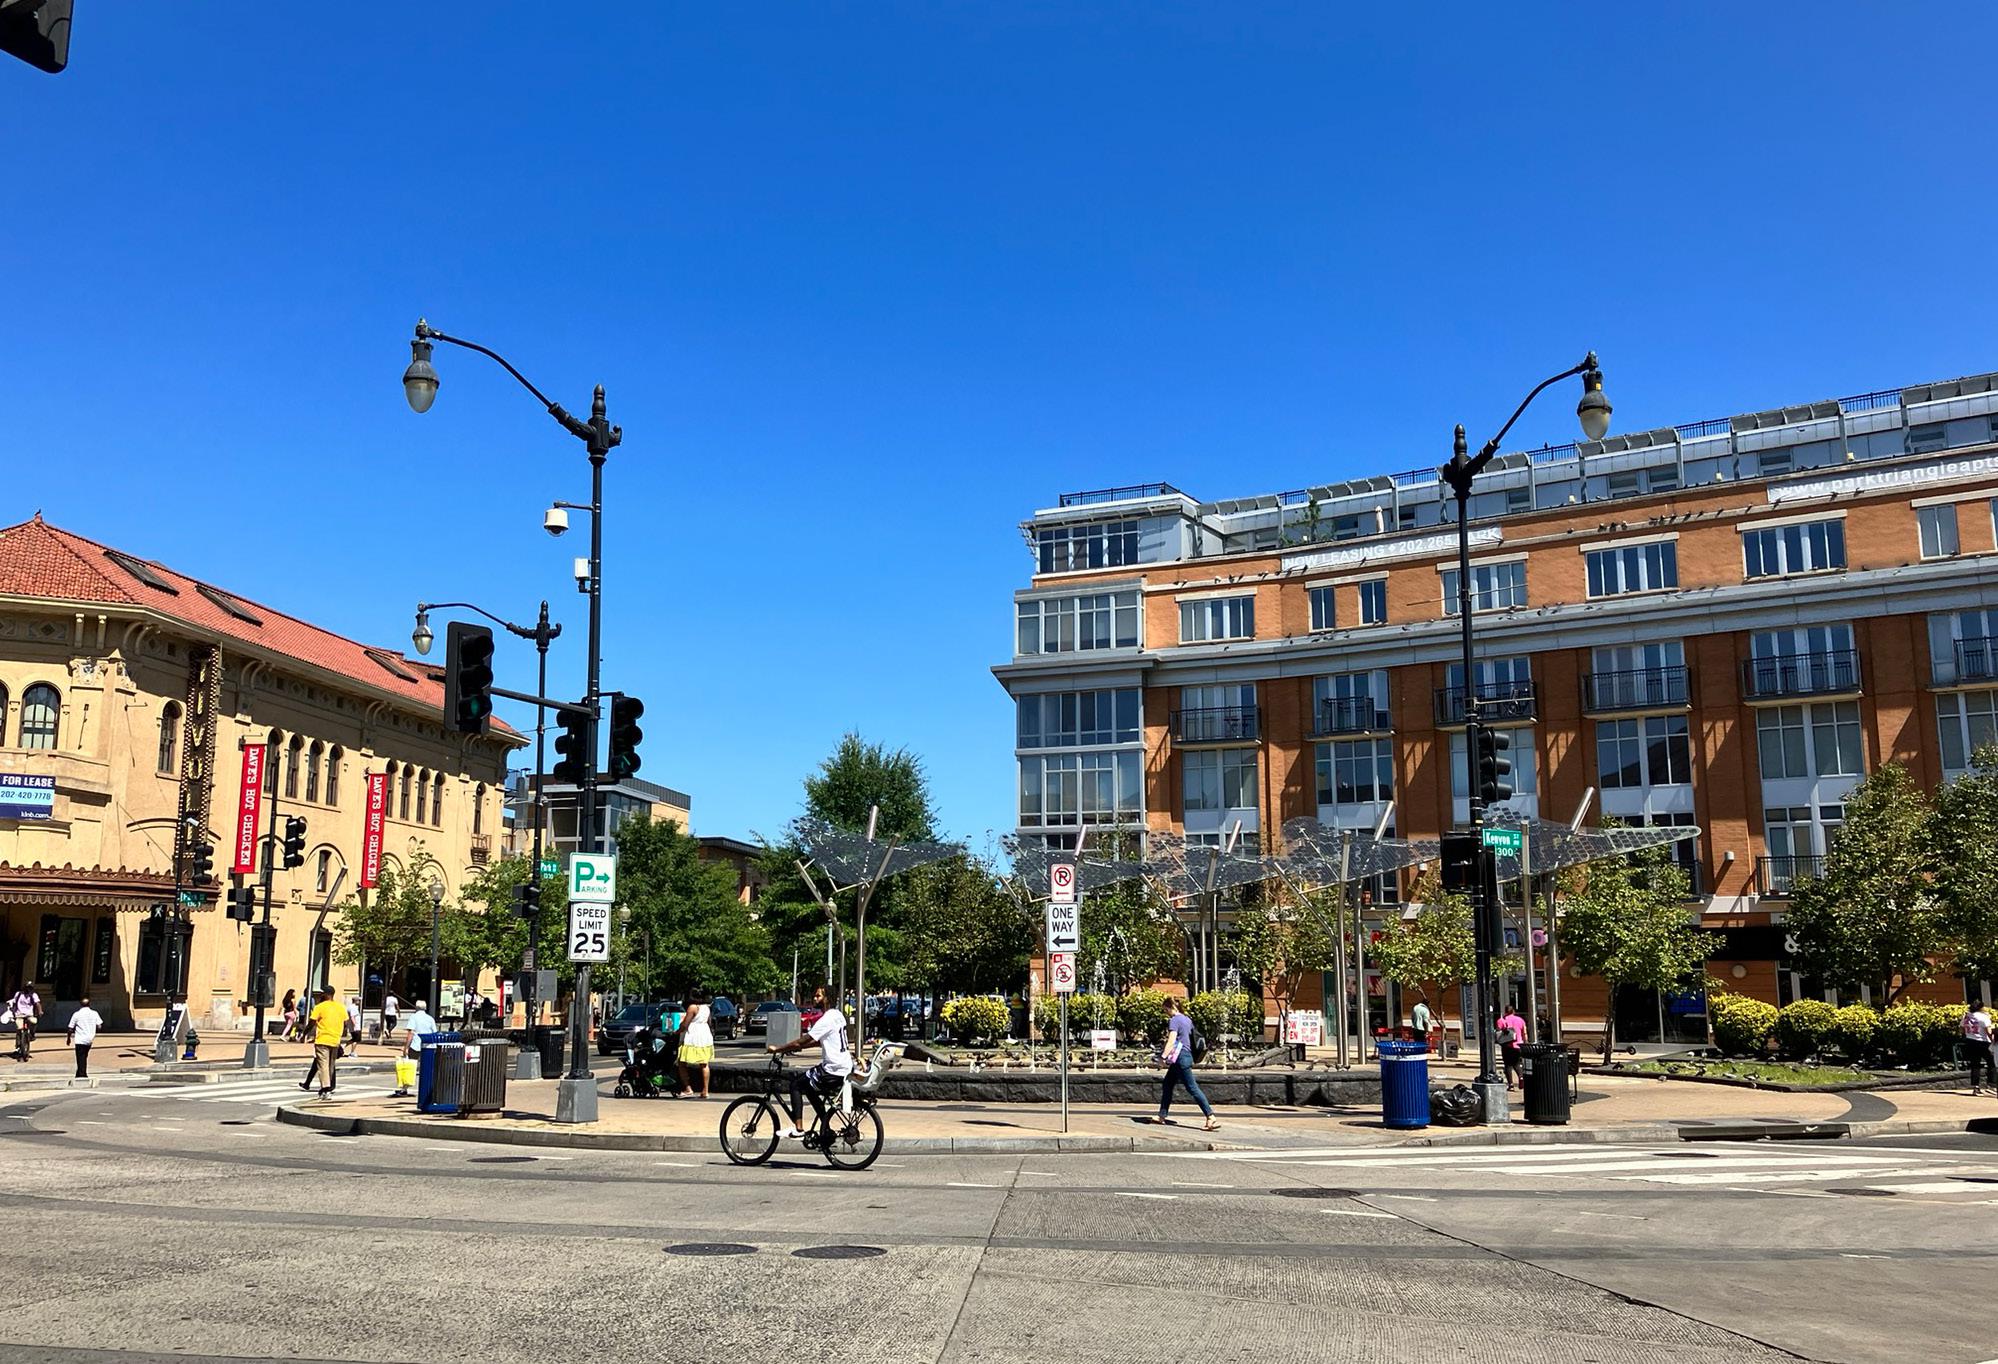
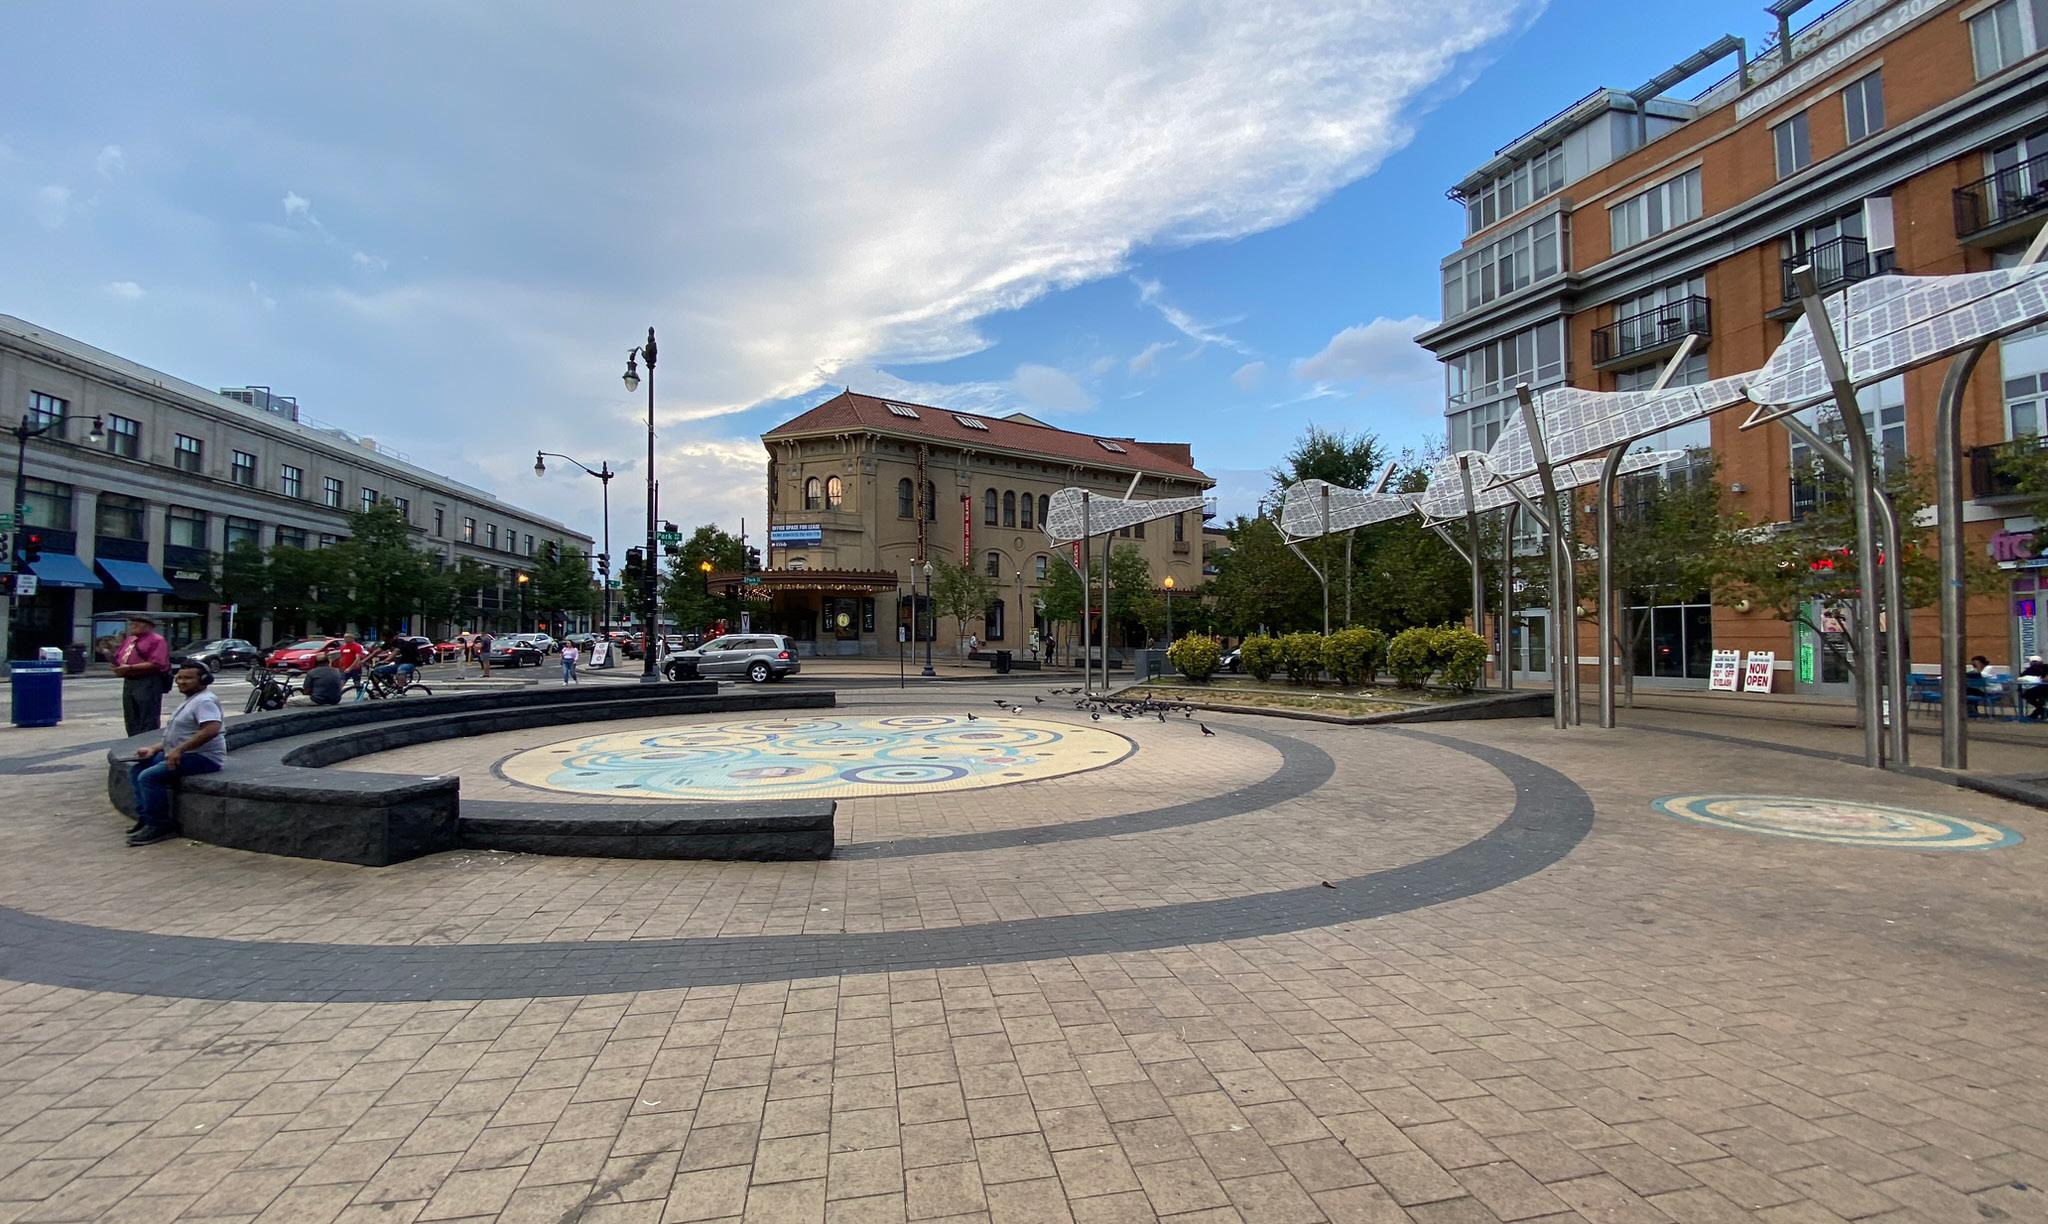
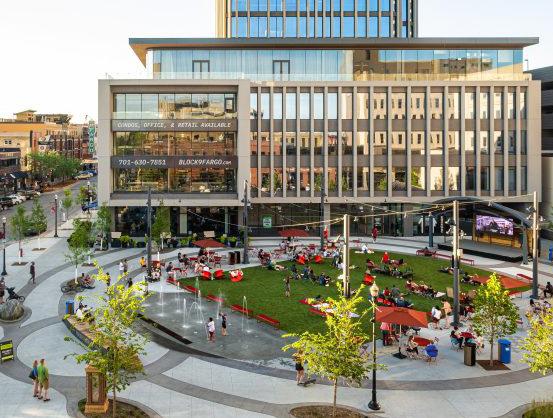
CIVIC PLAZA, COLUMBIA HEIGHTS, WASHINGTON, DC
SITE VISIT 2 - (QUALITATIVE- SITE INVENTORY)
SECTION FOUR
New Design Concept
14
DESIGN PRINCIPLES
MISSION STATEMENT
To create a WELCOMING AND SAFE community with an ABUNDANCE OF FLEXIBLE SPACES that connect people to place.
Residents are brought together to SOCIALIZE AND ACTIVATE THE PLAZA .
15
INCLUSIVE FLEXIBLE COMMUNITY-DRIVEN
SOCIABLE
COLUMBIA HEIGHTS ADAPTABLE
PRECEDENTS
LEGEND INCLUSIVE
ADAPTABLE FLEXIBLE COMMUNITY-DRIVEN SOCIABLE
MEANDERING PATHS
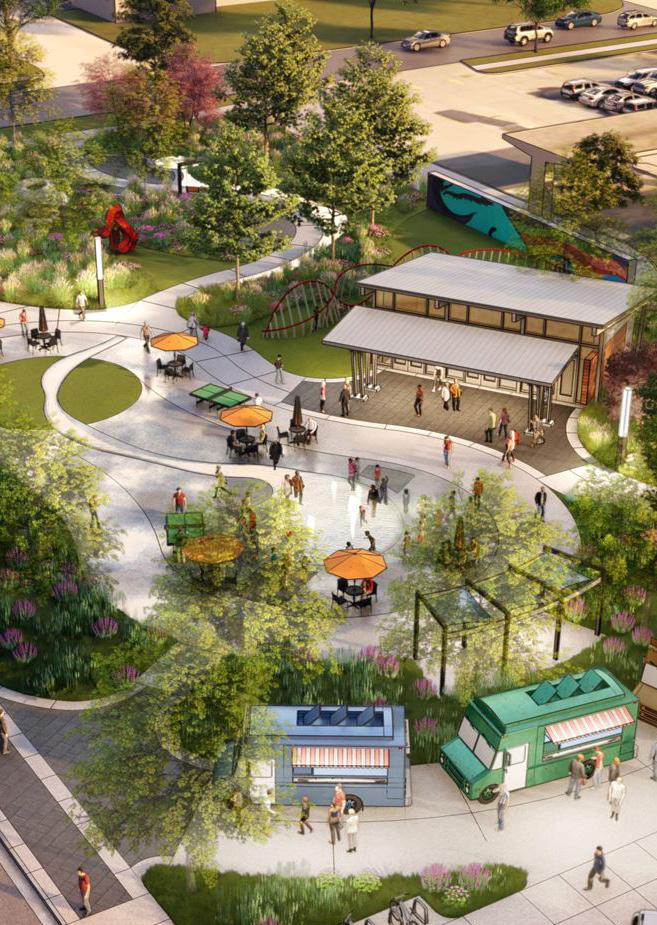
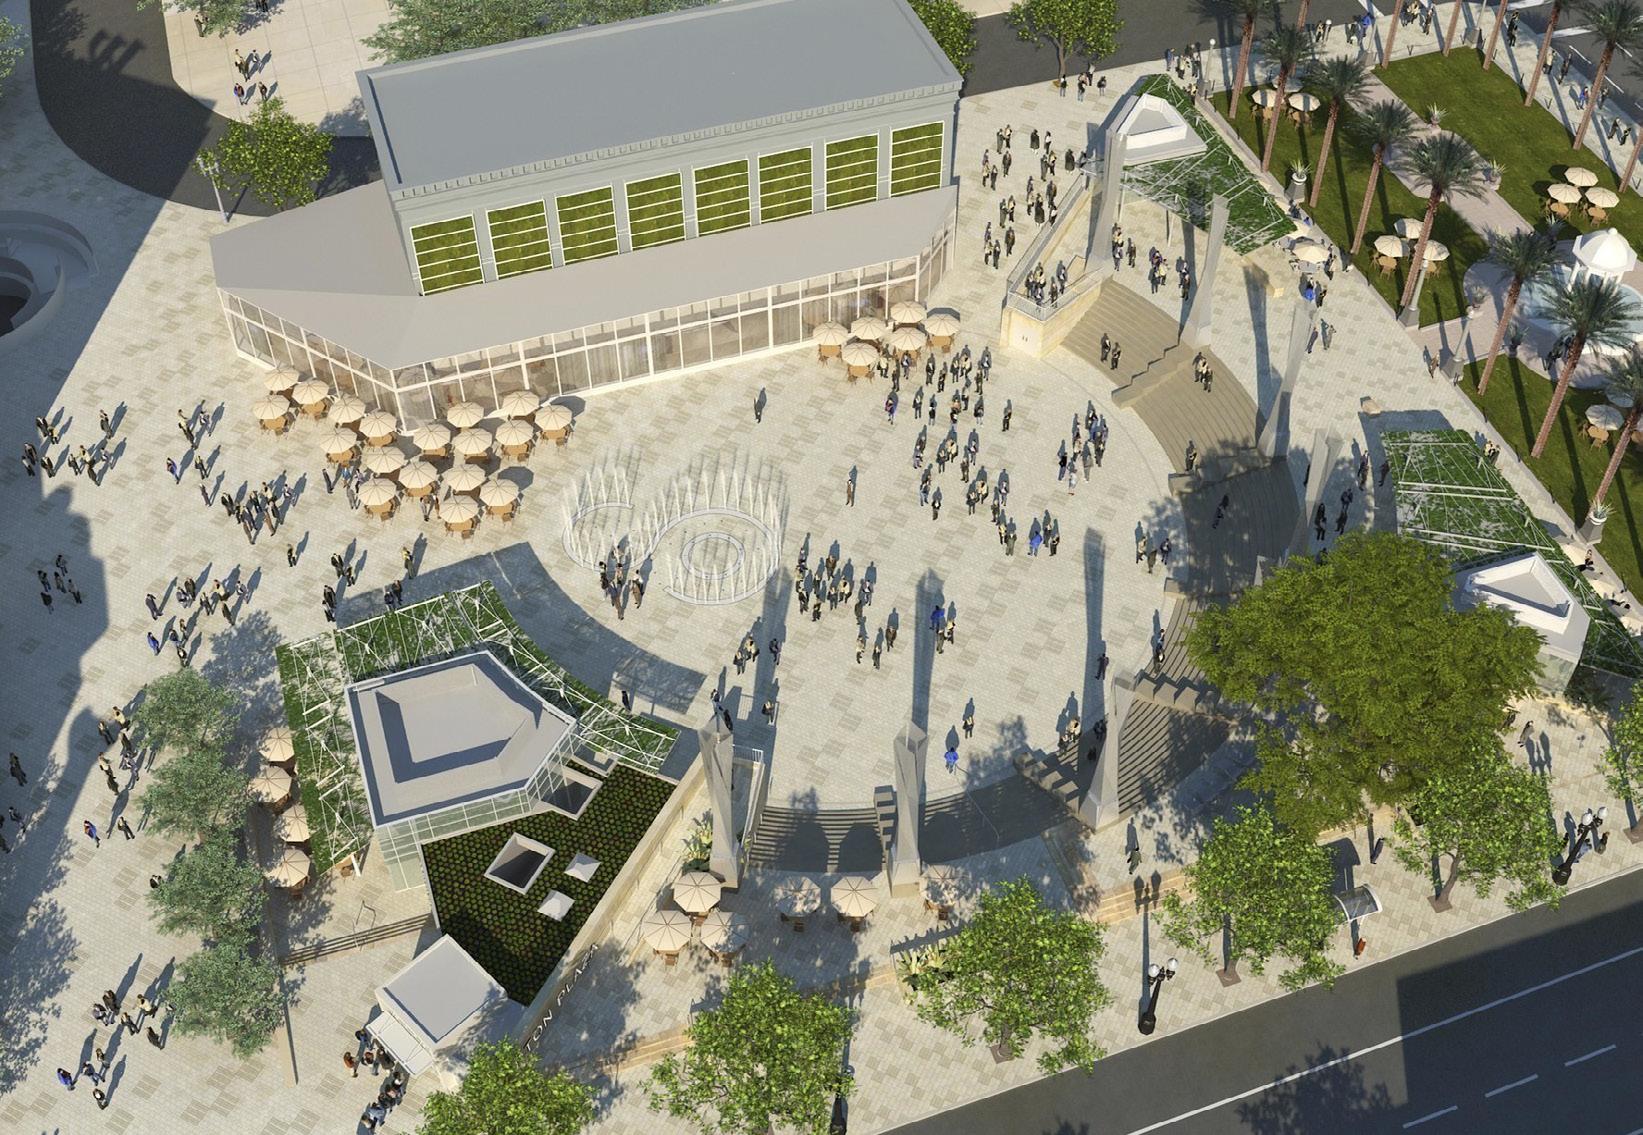
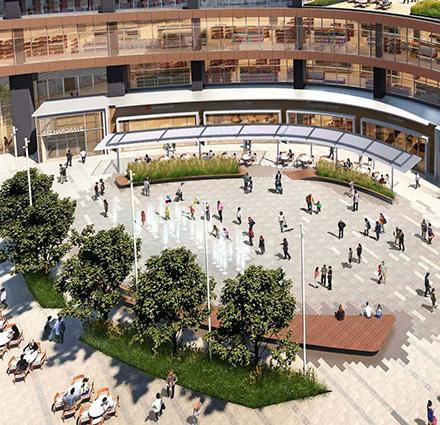
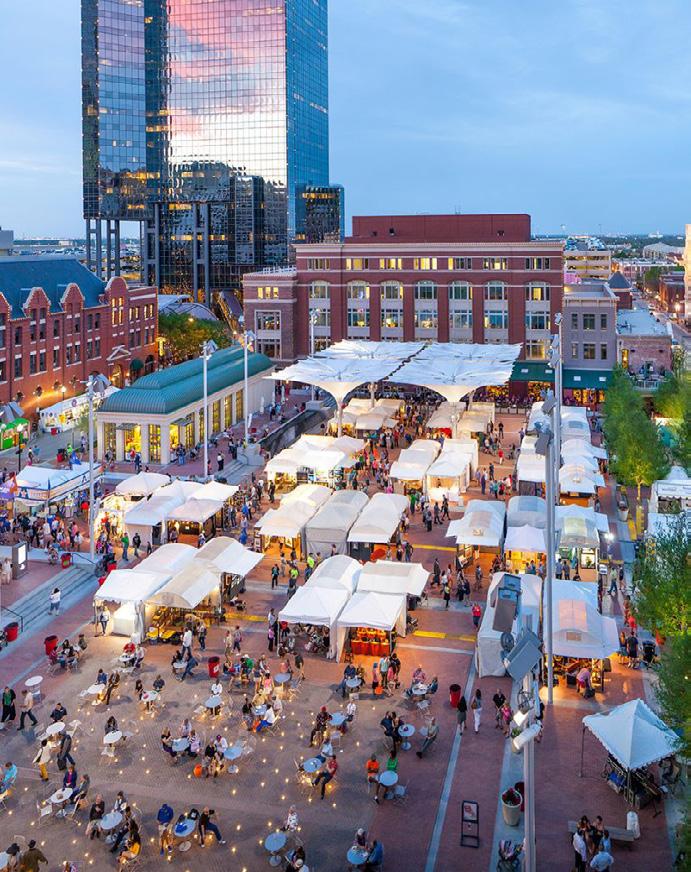
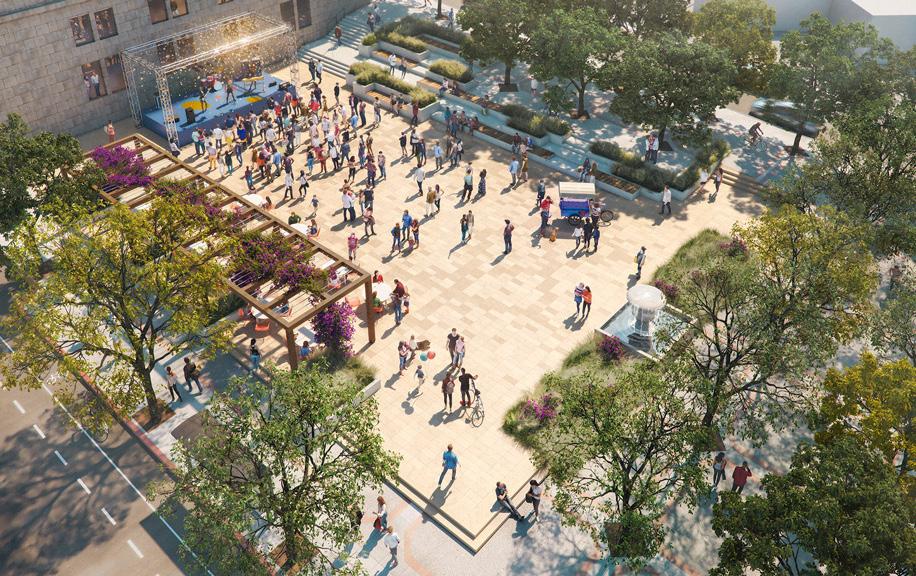
ACTIVE PLAZA
ATTRACTIVE STRUCTURES + COLORFUL LANDSCAPE
16
FLEXIBLE LAWN
LIVELY PROGRAMMING
True North Sqaure, Manitoba
San Pedro Plaza, Los Angeles
Boardway Sqaure, Fargo
Sundance Square Plaza, Fort Worth
Horton Plaza Park, San Diego
Steven L. Schainker Plaza, Ames
SECTION FIVE
Imagining
17
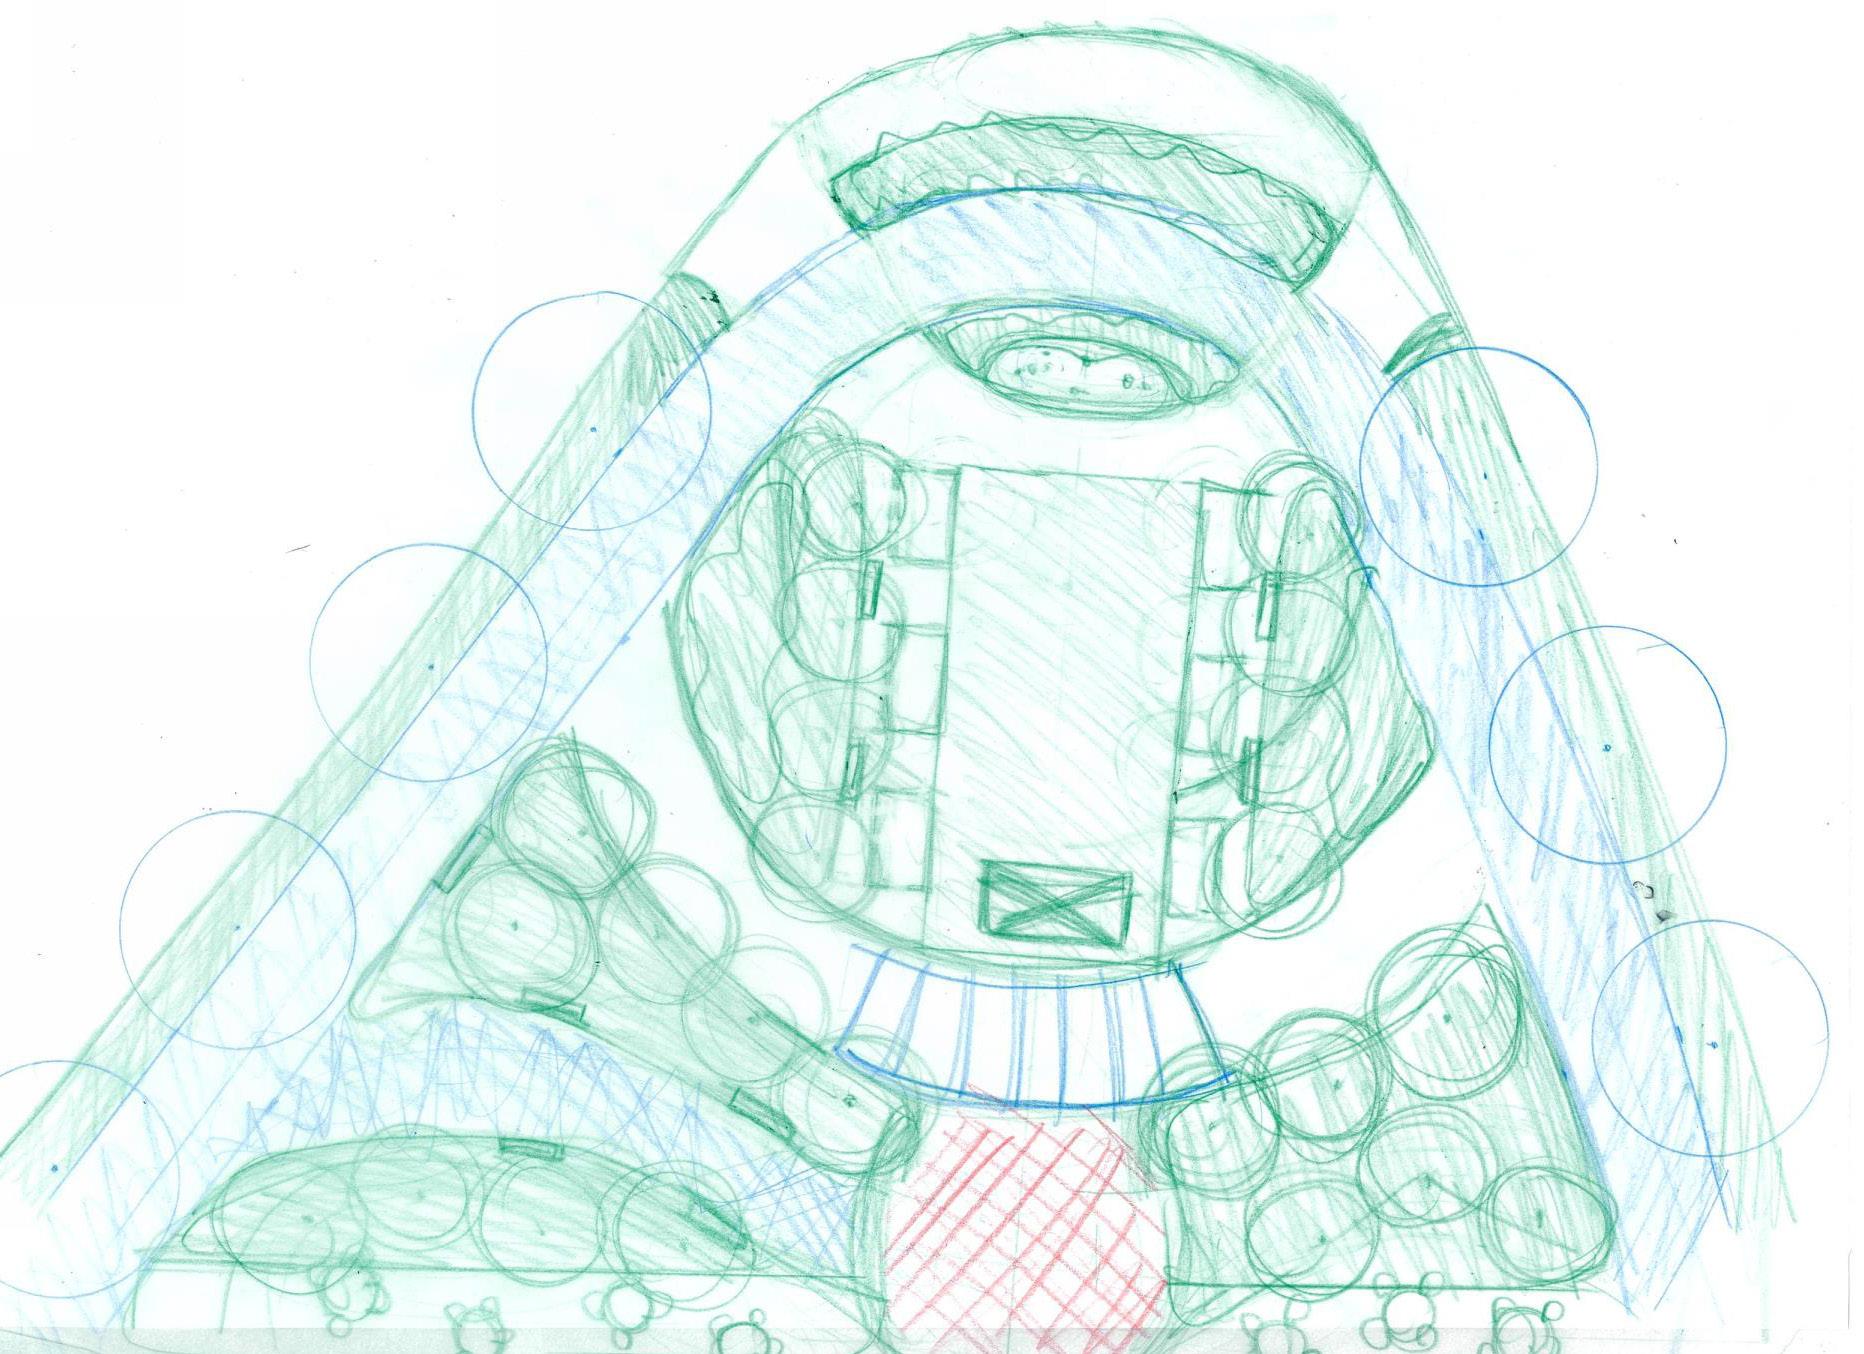
DESIGN 1 - BLUELINE SKETCH (MEANDERING PLAZA)
LEGEND
GATHERING SPACE
SEATING AREA
OUTDOOR DINNING
LANDMARK LANDSCAPE
STREET TREES
SEATING
GATHERING
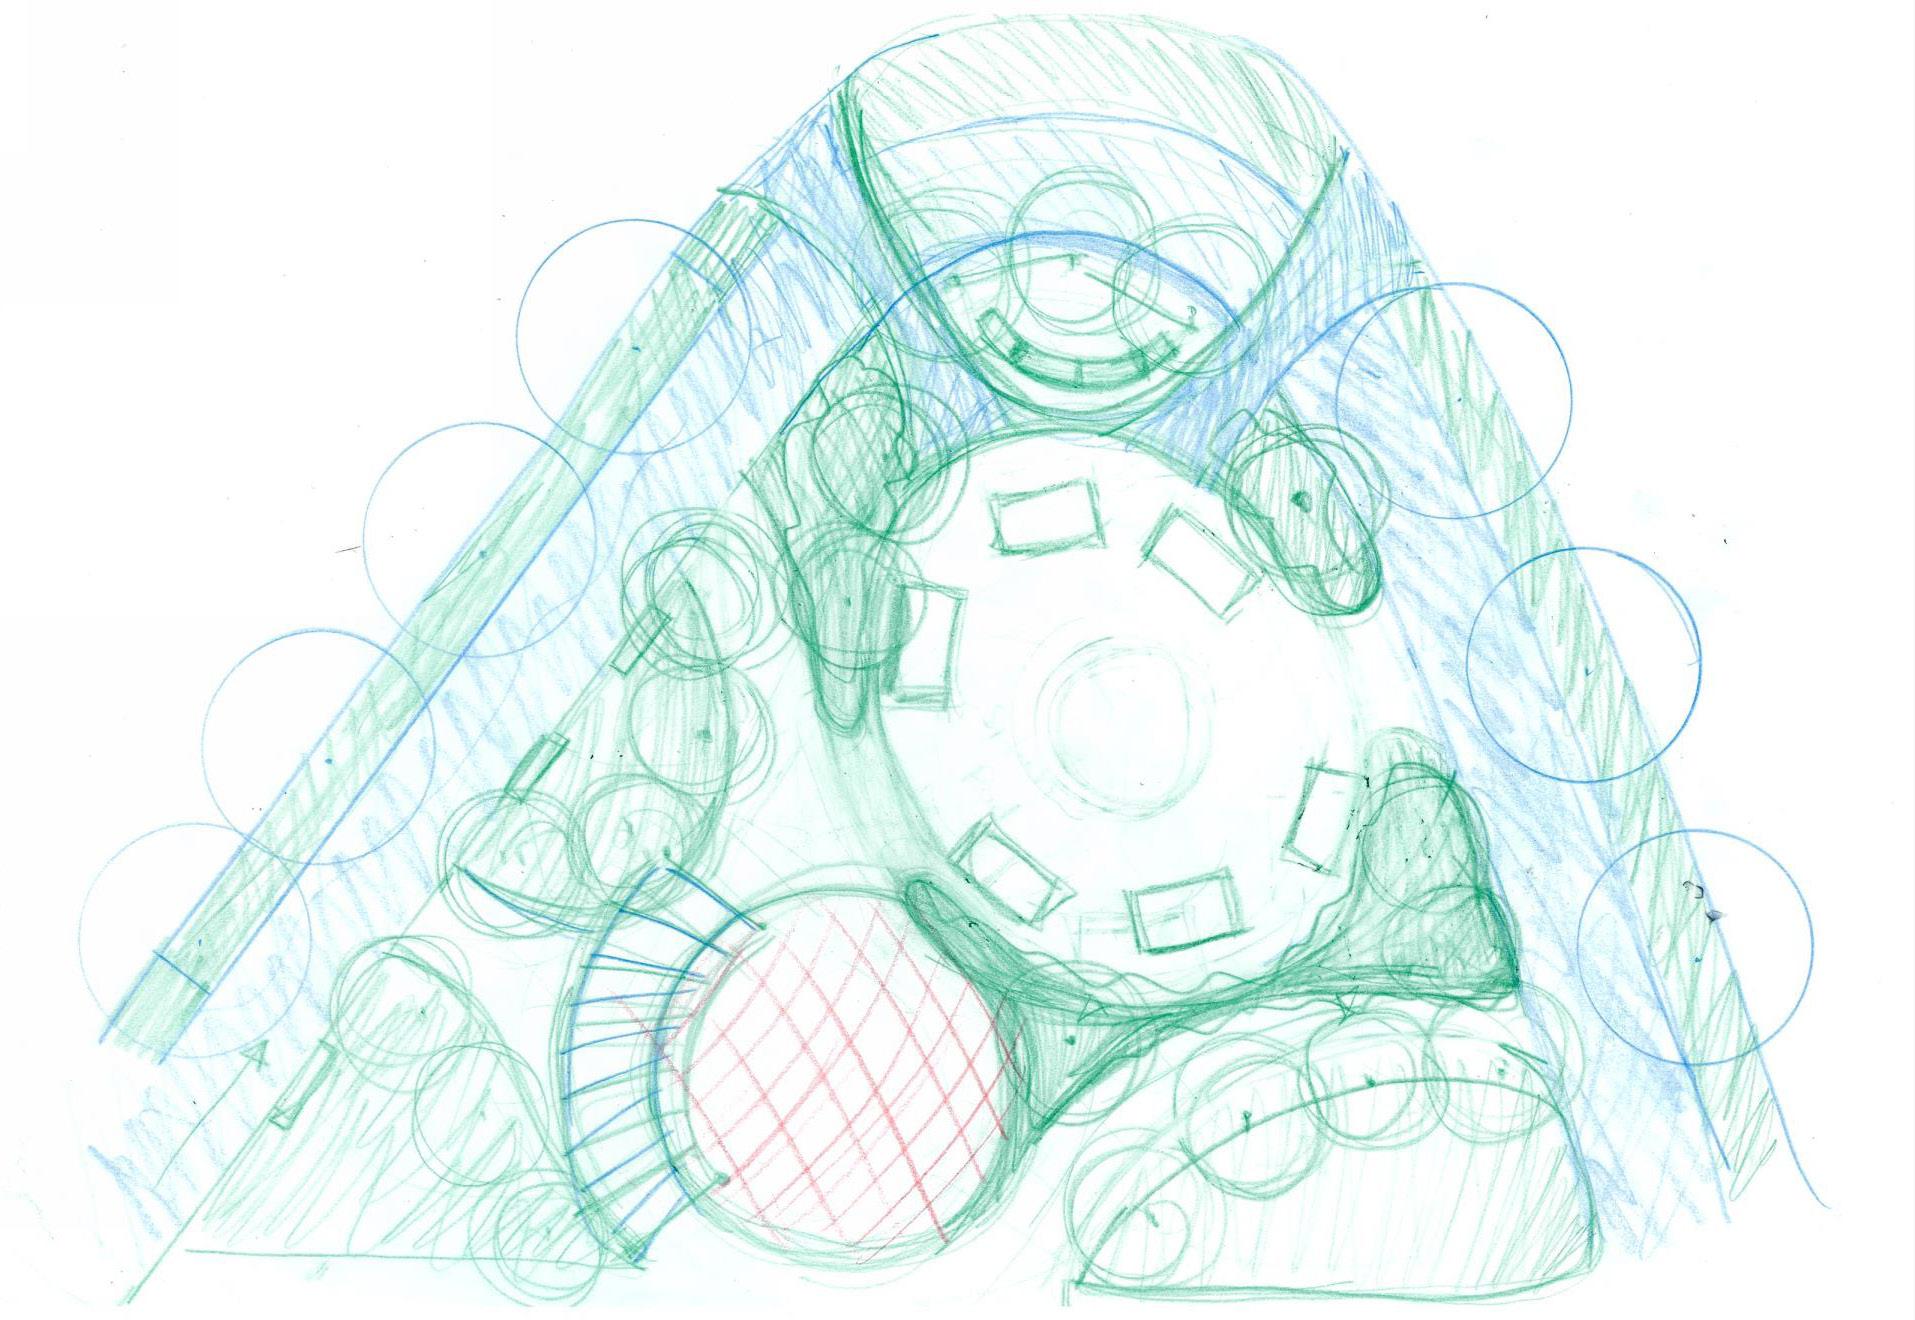
LOW LANDSCAPE
VENDORS
LOW LANDSCAPE
18
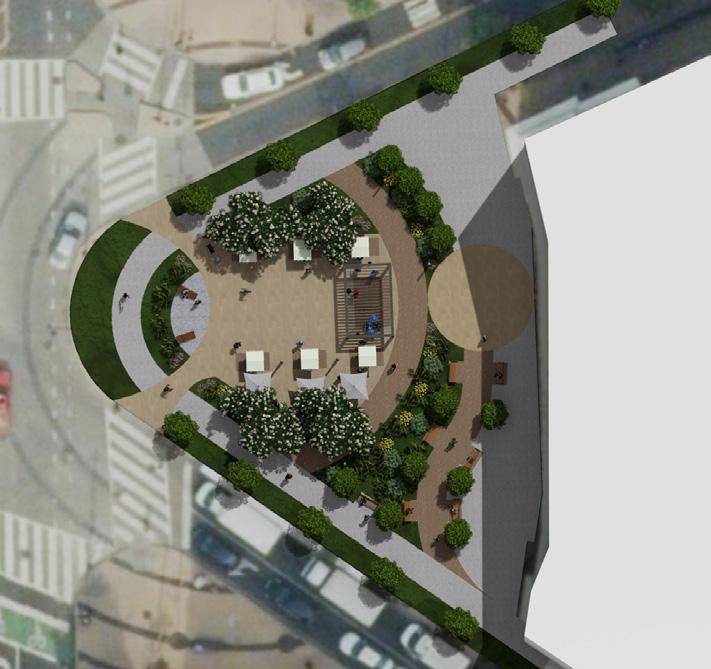
PLAZA
KENYONSTNW PARK RD NW
14TH ST NW
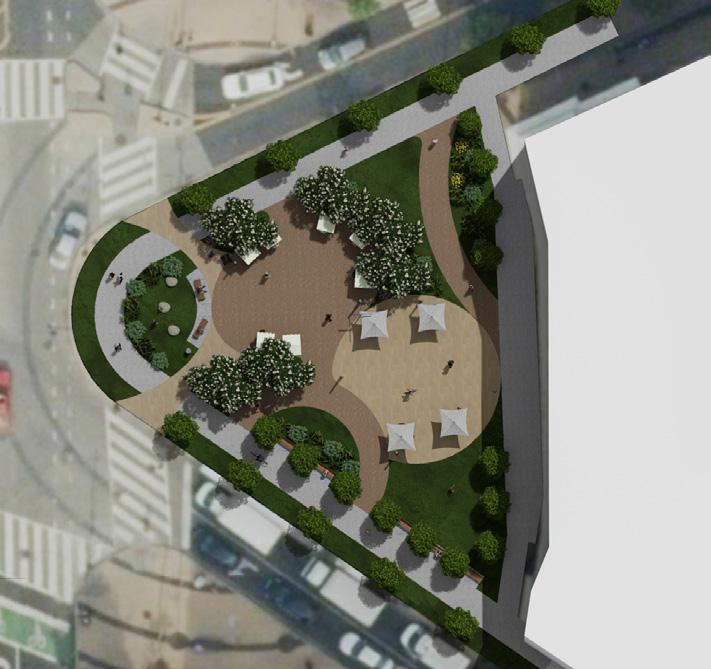
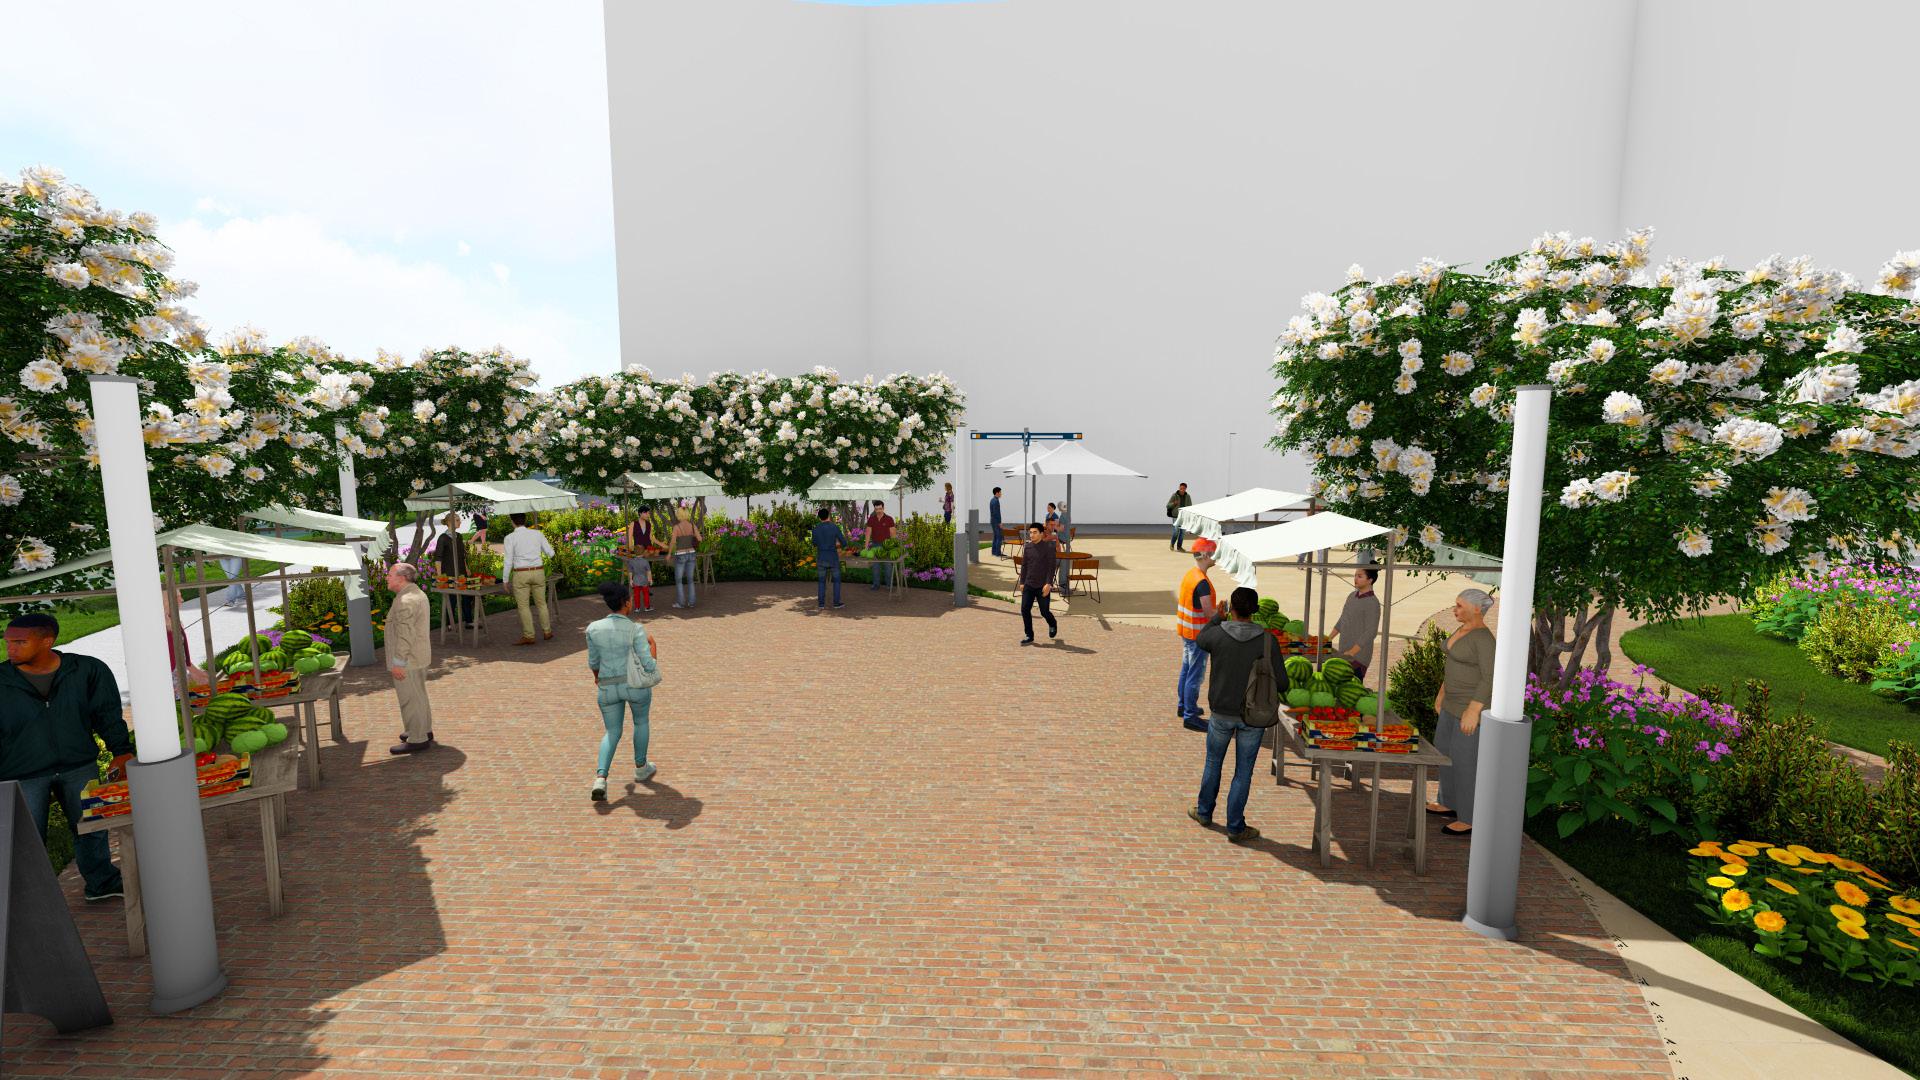
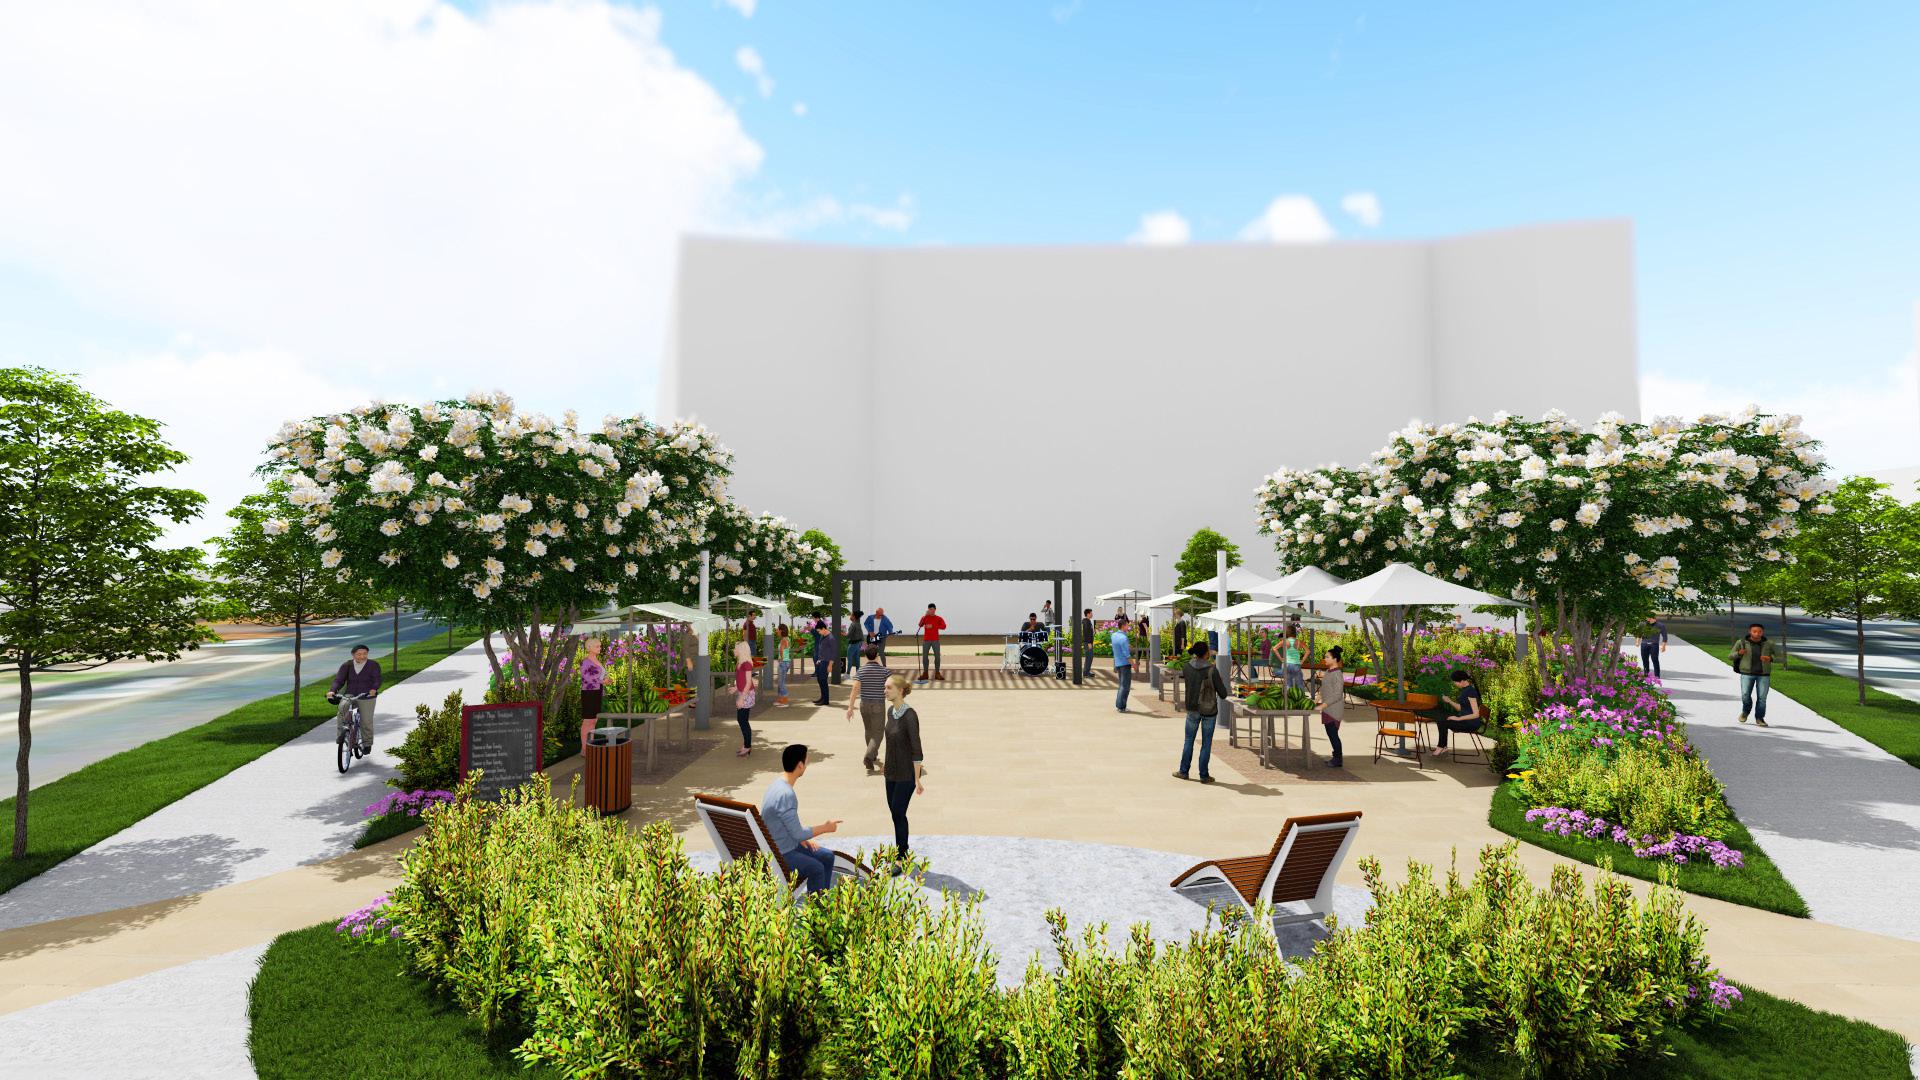
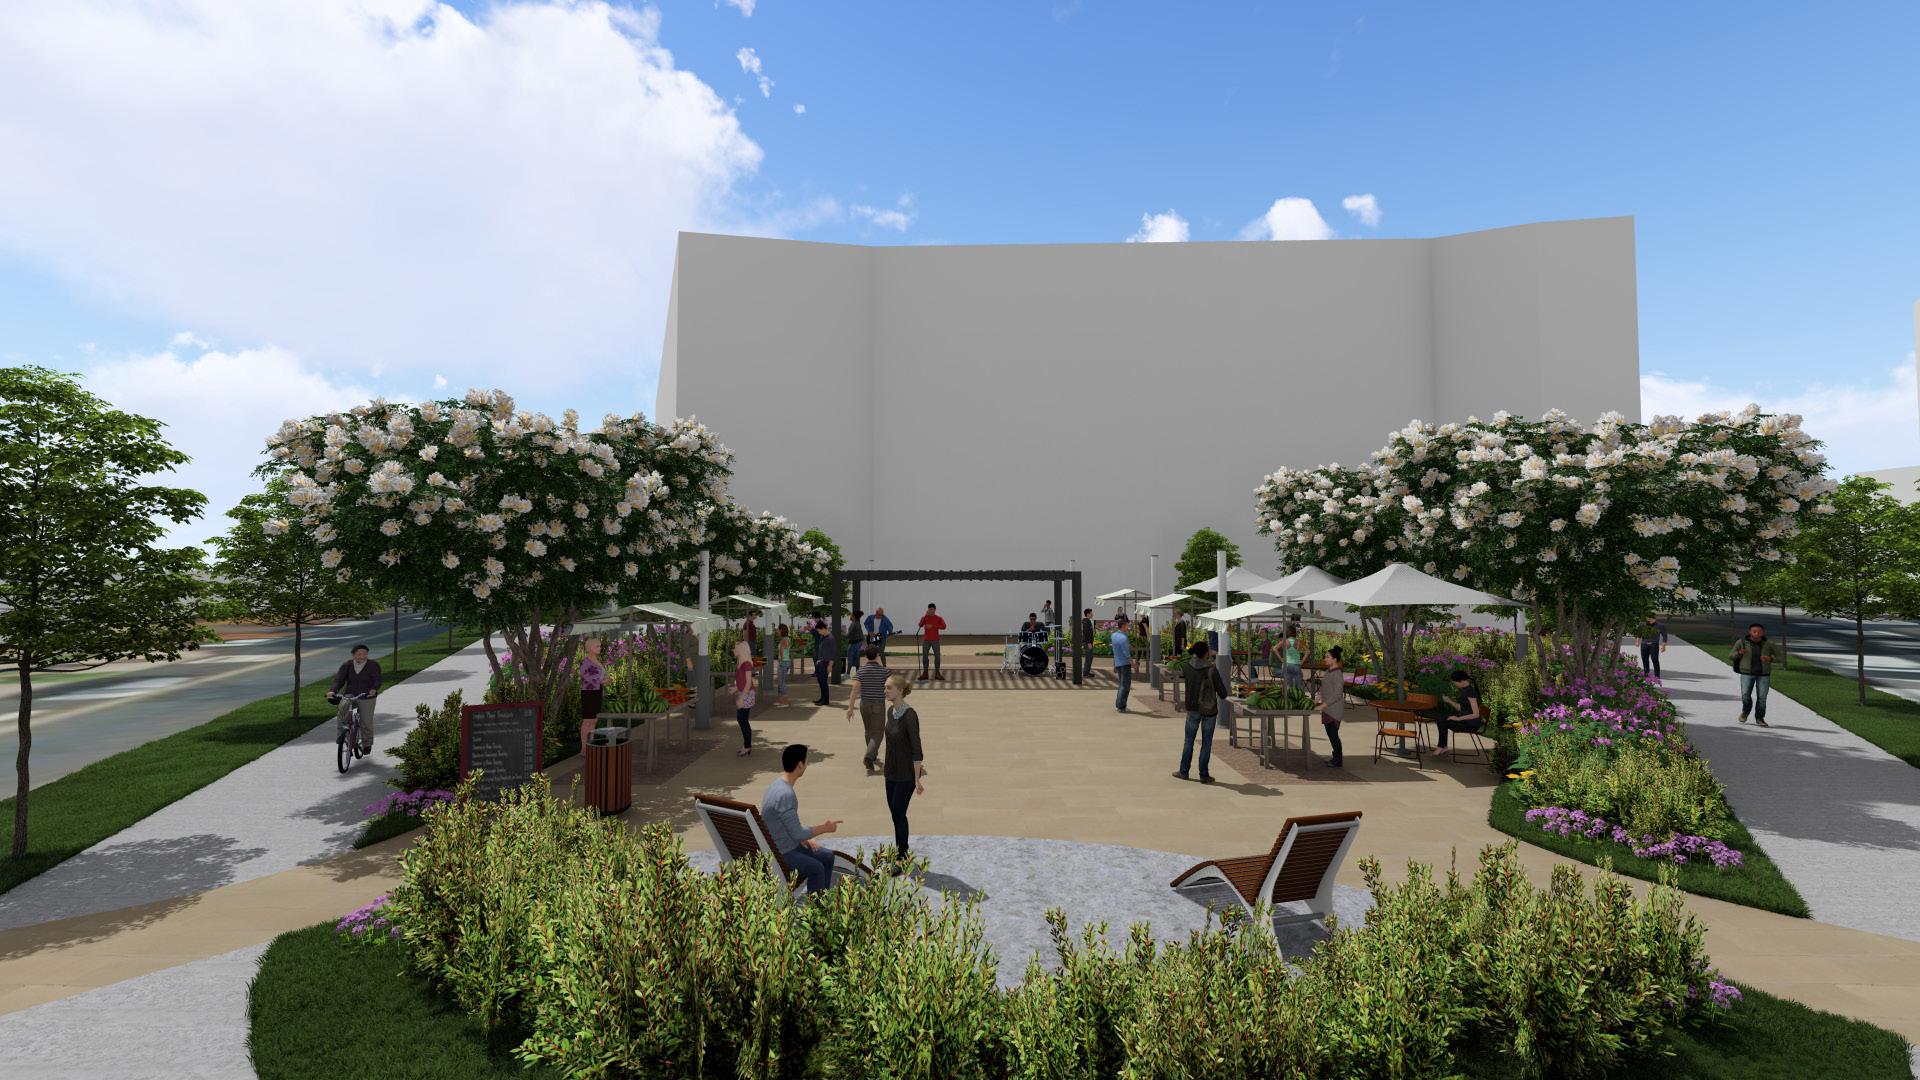
MEANDERING PLAZA - ILLUSTRATIVE 1
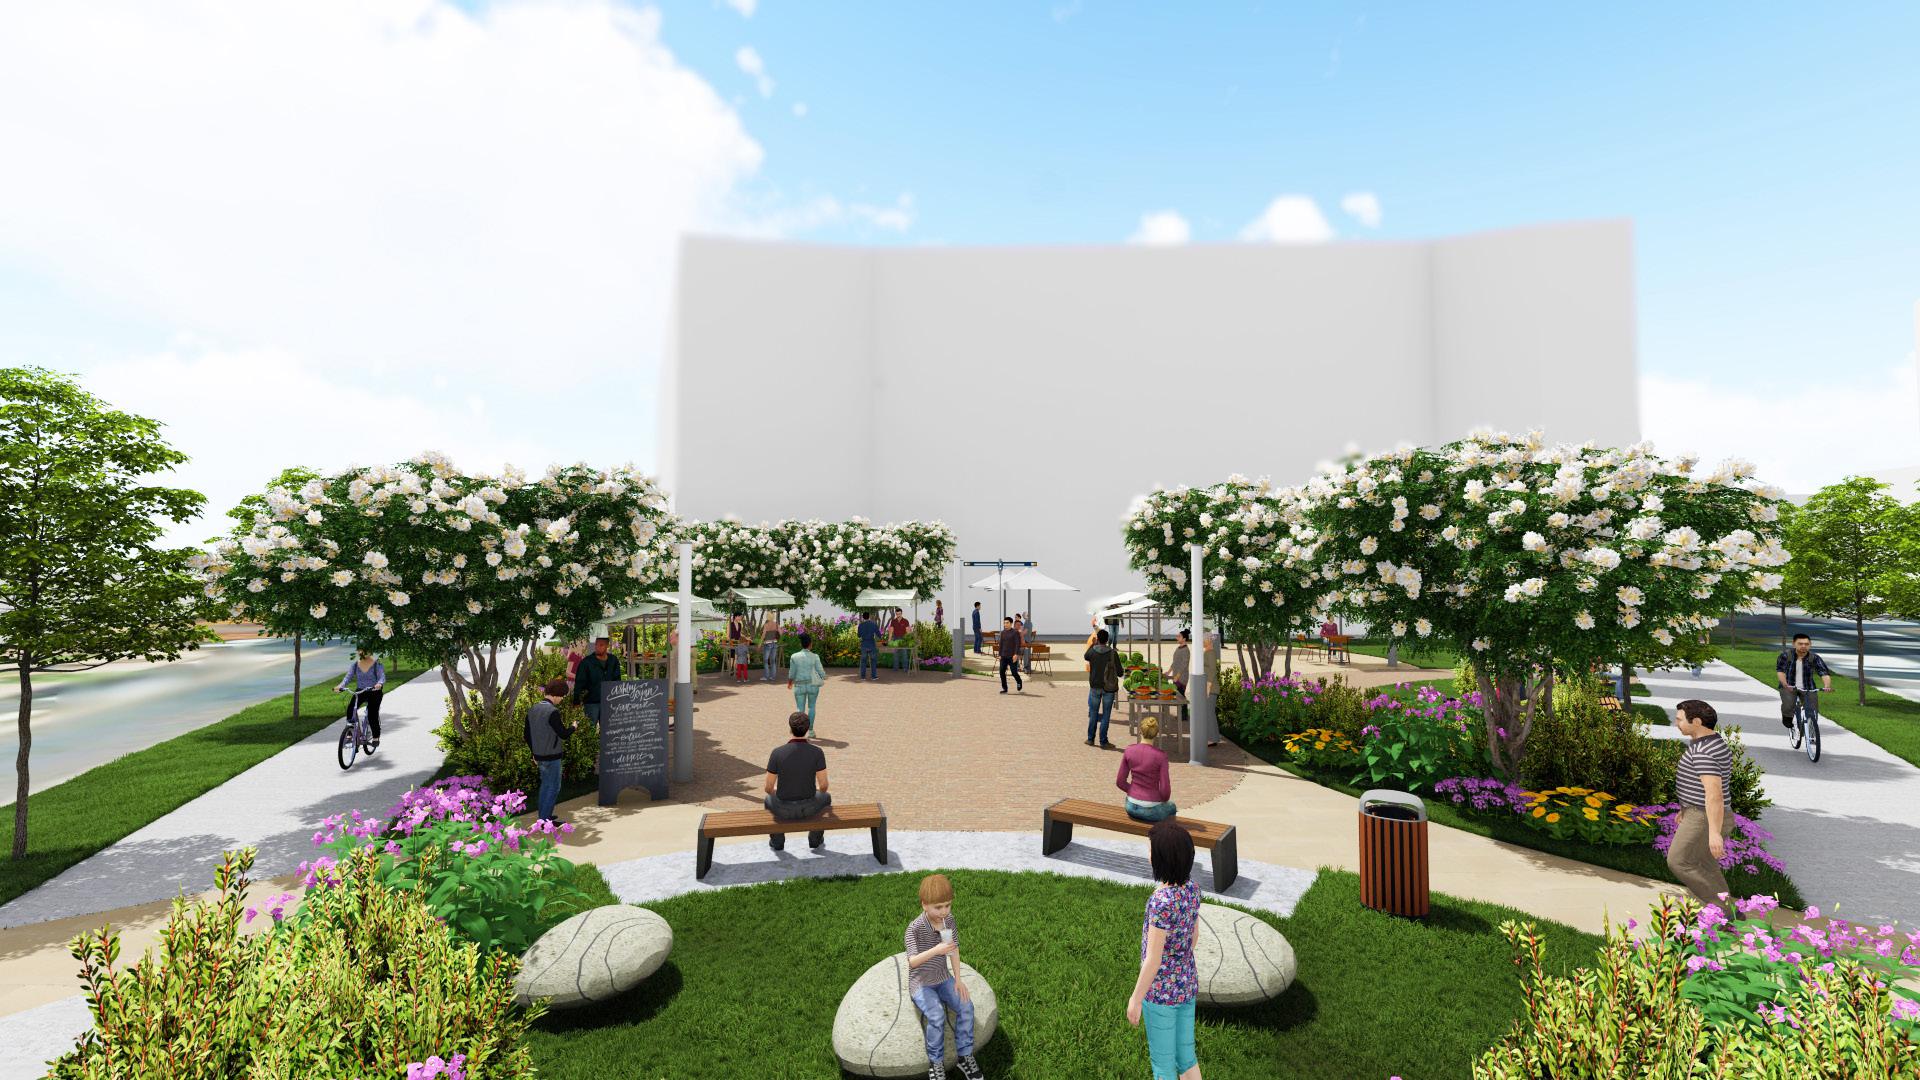
19
KEY MAP
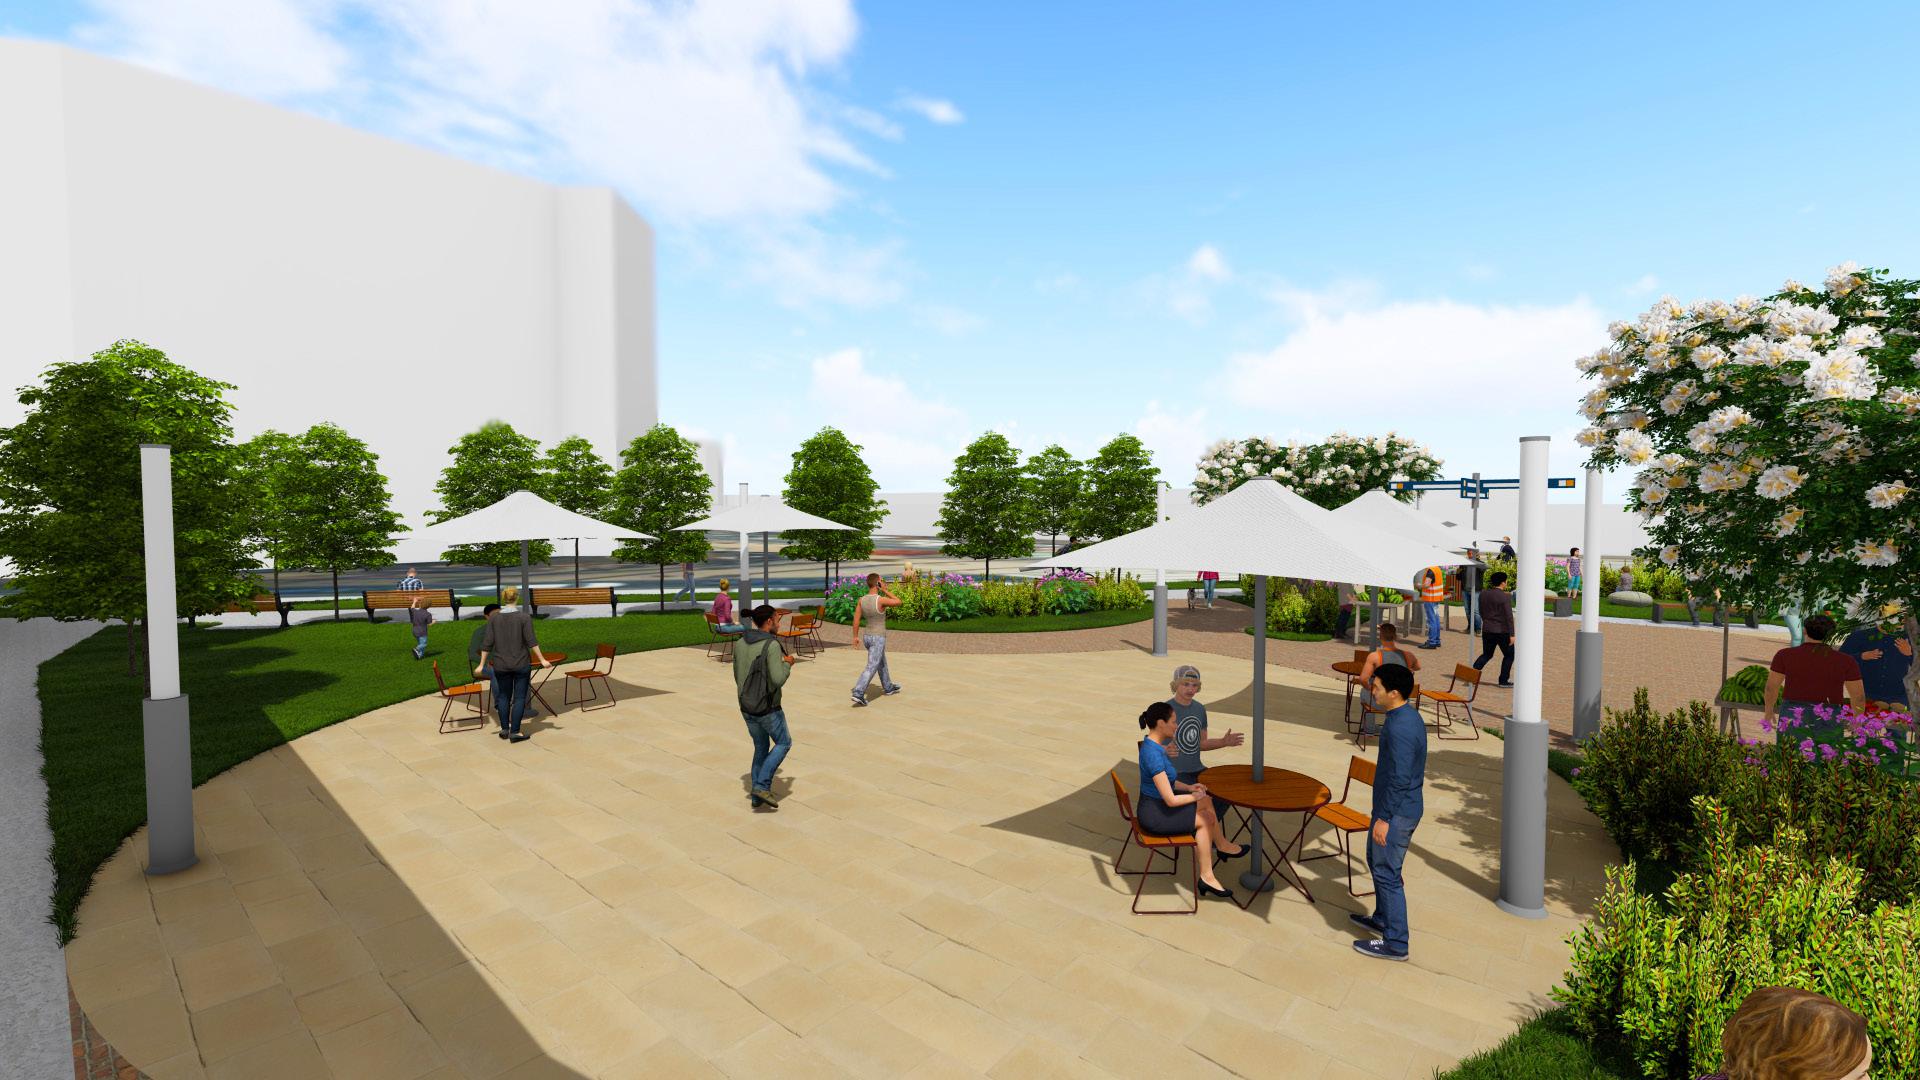
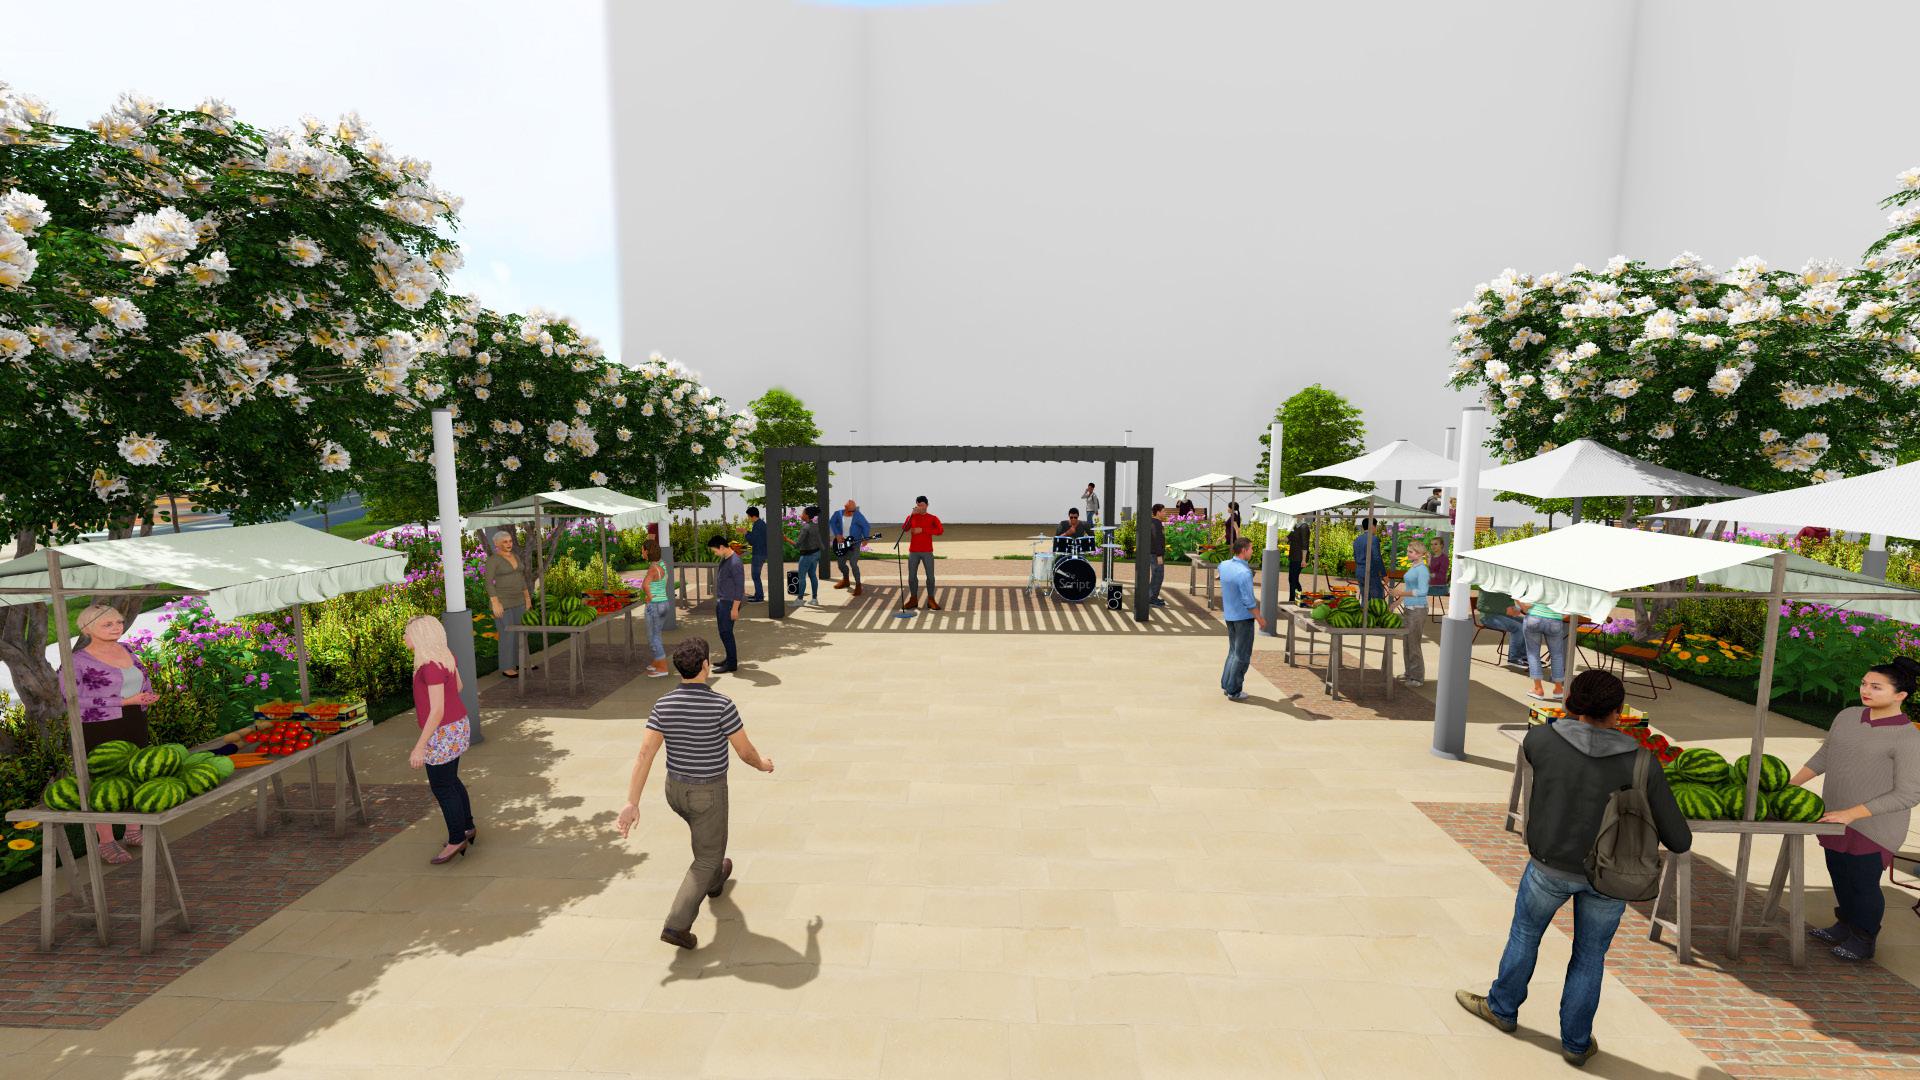
MEANDERING PLAZA - ILLUSTRATIVE 2
20
KEY MAP
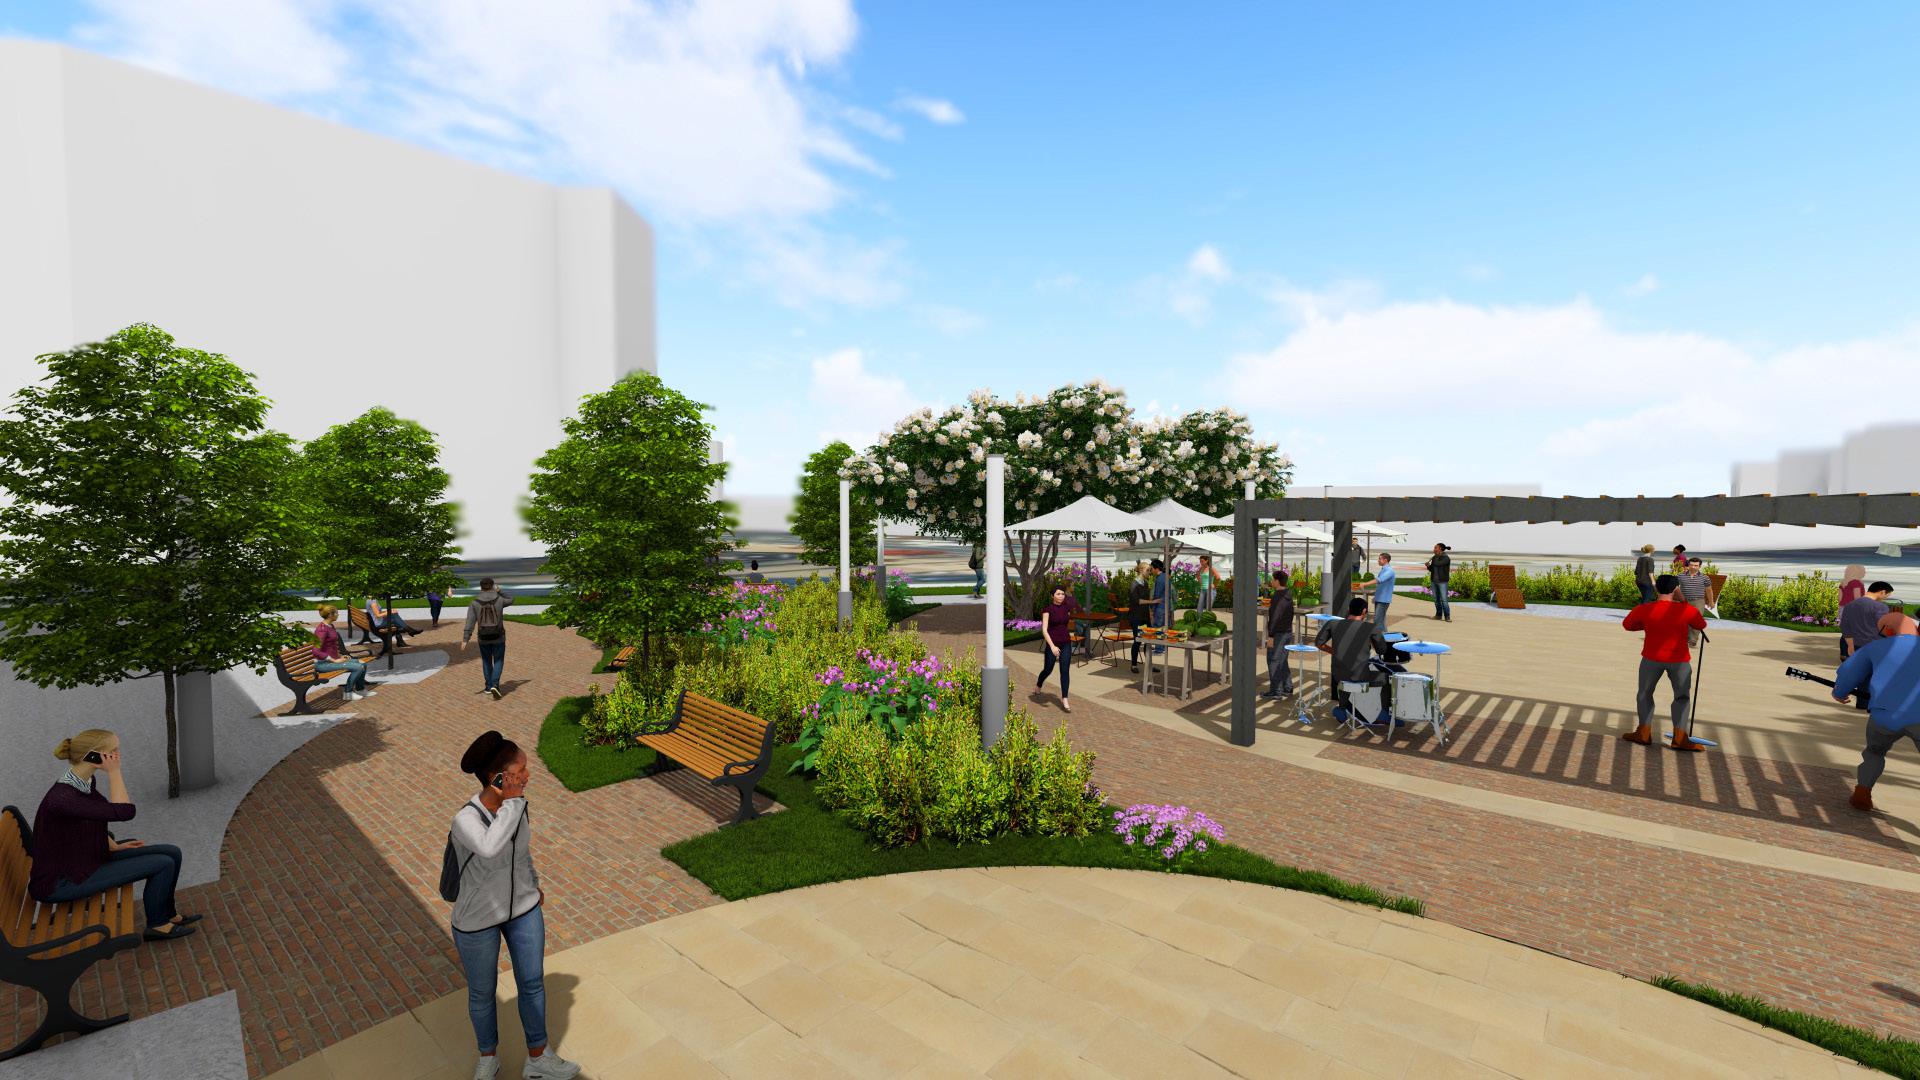
MEANDERING PLAZA - ILLUSTRATIVE 3
21
KEY MAP
DESIGN 2 - BLUELINE SKETCH (FORMAL PLAZA)
LEGEND
GATHERING SPACE
SEATING AREA
OUTDOOR DINNING
LANDMARK LANDSCAPE
STREET TREES
SEATING
GATHERING
LOW LANDSCAPE
VENDORS
FLEXIBLE PROGRAMMING
GATHERING
22
PLAZA
KENYONSTNW PARK RD
NW 14TH ST NW
23
FORMAL PLAZA - ILLUSTRATIVE 1 KEY MAP
24
FORMAL PLAZA - ILLUSTRATIVE 2 KEY MAP
25
FORMAL PLAZA - ILLUSTRATIVE 3 KEY MAP
SECTION SIX
Testing the Design
26
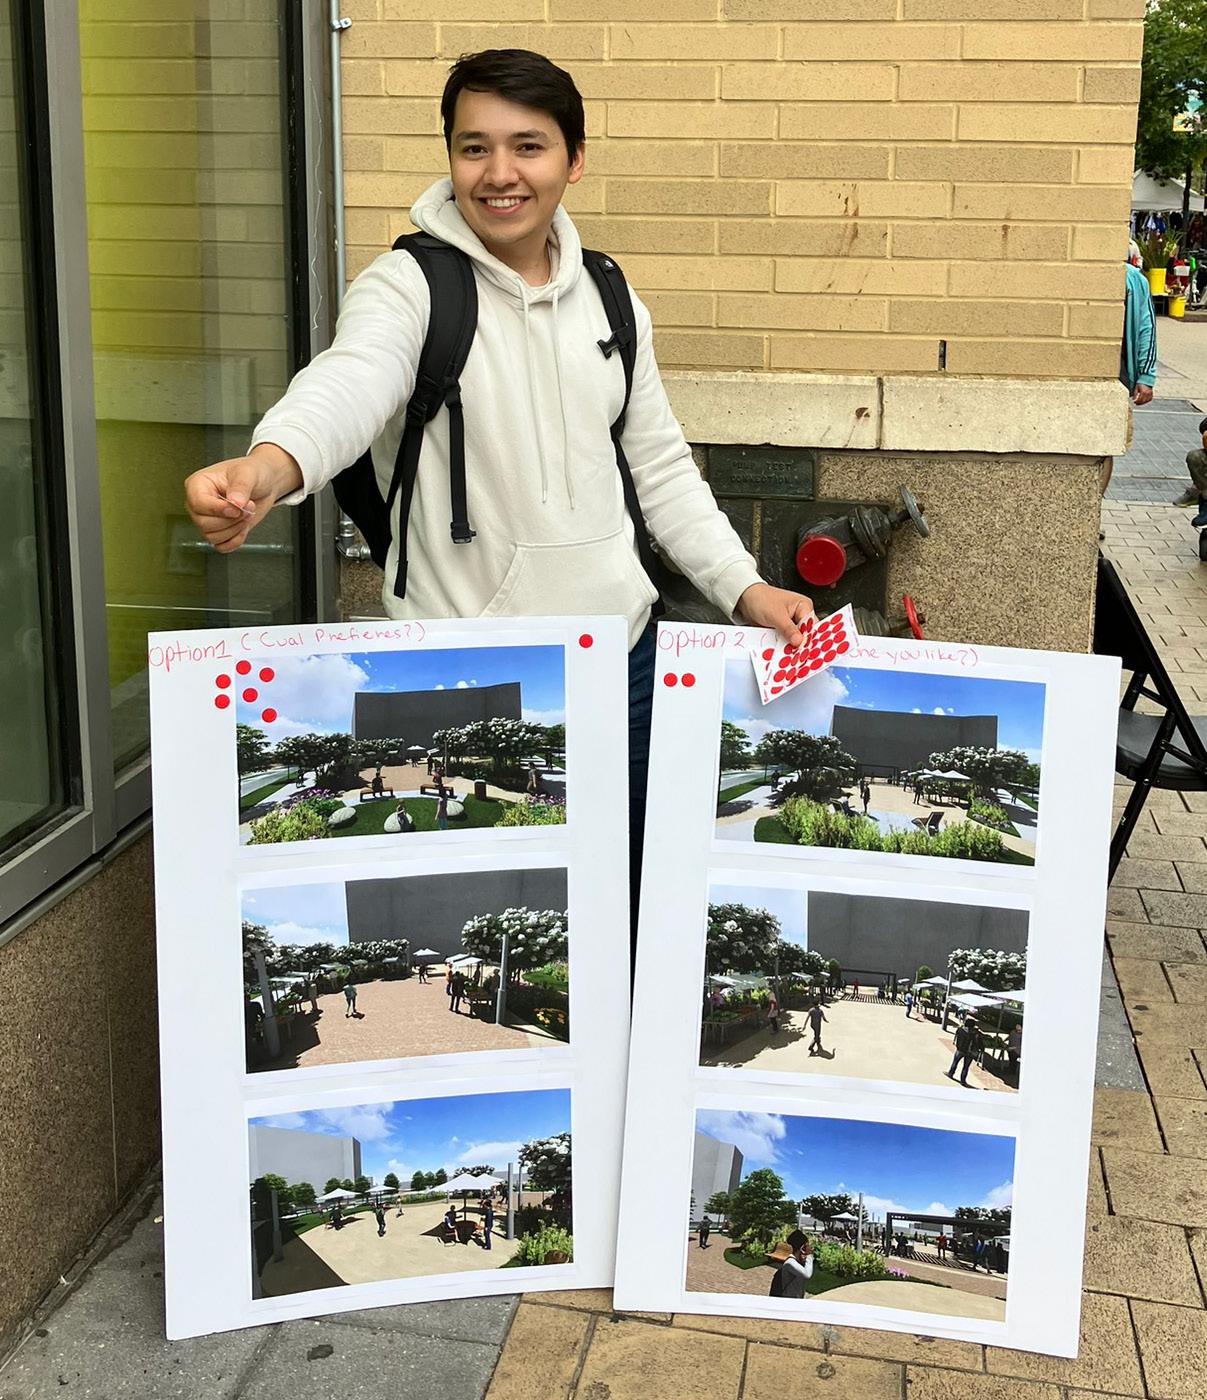
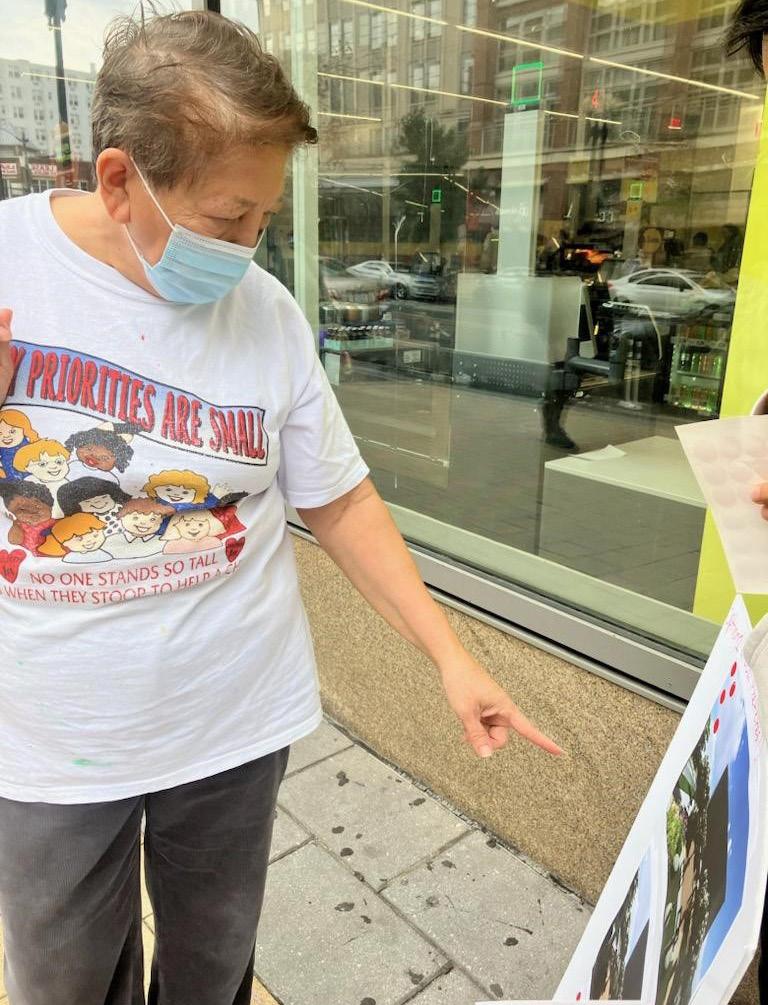
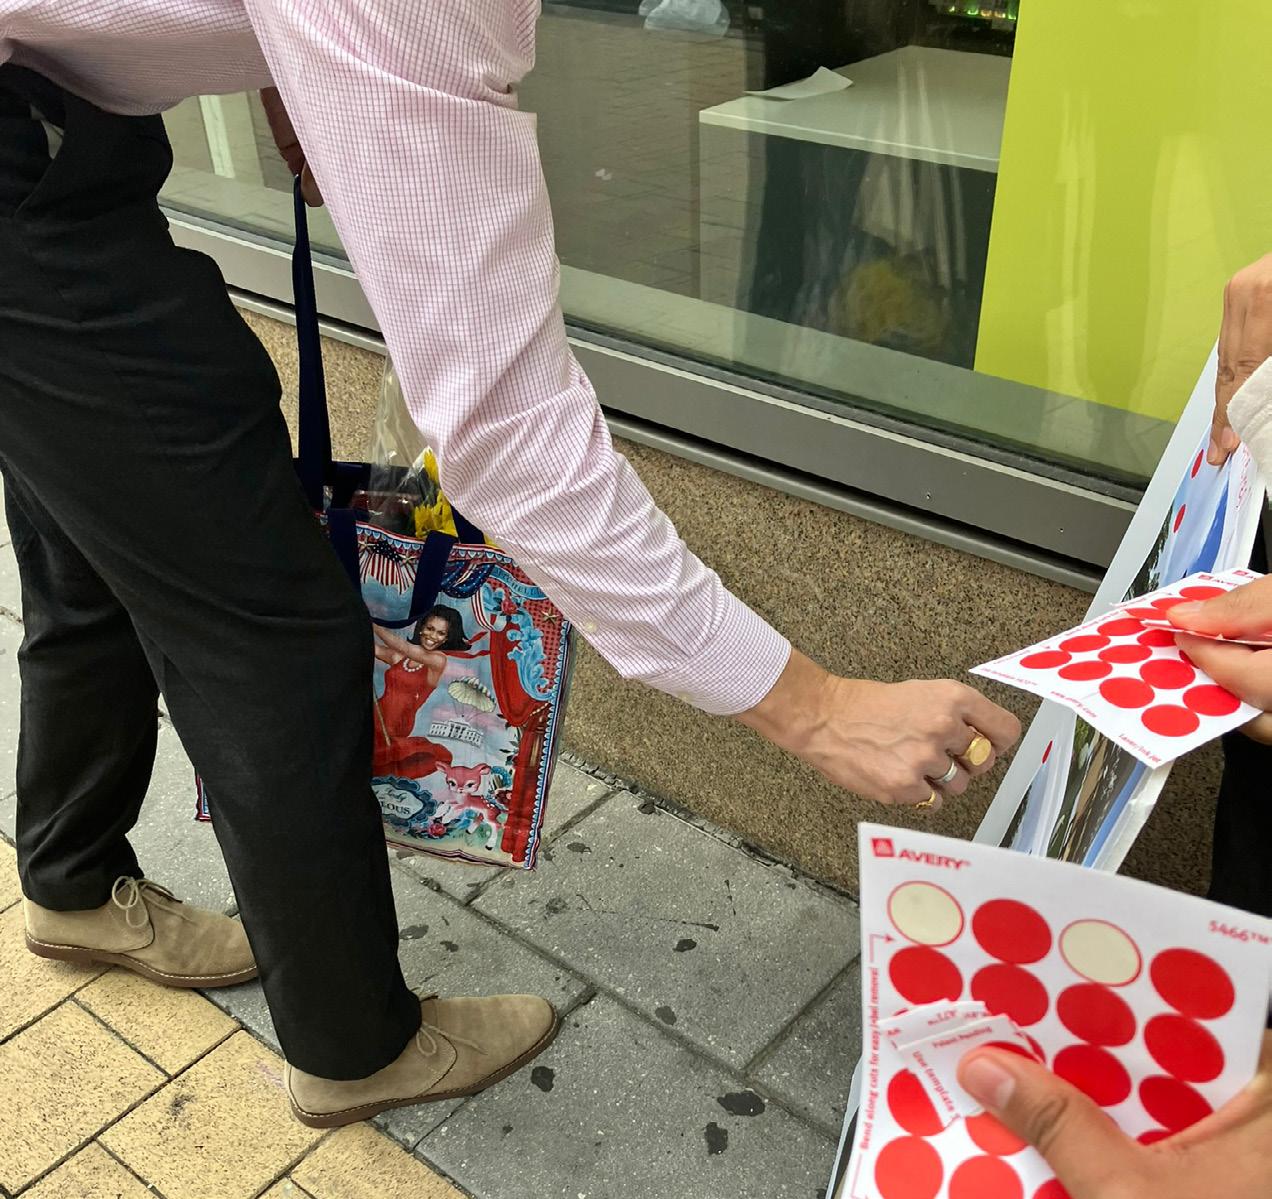
SITE VISIT 3 - (QUANTITATIVEWHICH DESIGN DO YOU PREFER?)
FRIDAY, OCTOBER 20, 2023 AT 1:00 PM
27
SECTION SEVEN Results
28
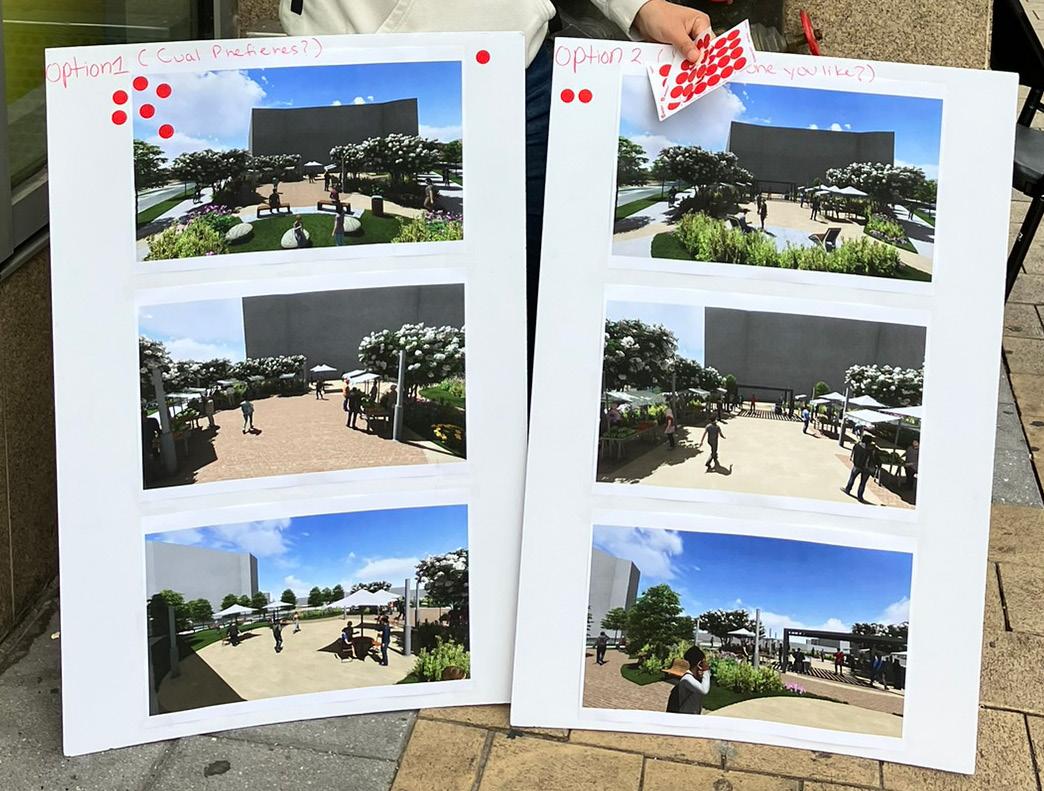
SURVEY 3 - RESULTS
WHICH DESIGN OPTION DO YOU PREFER FOR COLUMBIA HEIGHTS CIVIC PLAZA?
SURVEY PREFERENCES
MEANDERING PLAZA FORMAL PLAZA
69%
WHAT WOULD YOU LIKE TO SEE MORE FOR COLUMBIA HEIGHTS CIVIC PLAZA?
PRIORITIES
1. VENDOR SPACE
2. SHADE
3. SEATING
4. CULTURAL EVENTS
31%
29
SURVEY 3 - RESULTS
WHICH DESIGN OPTION DO YOU PREFER FOR COLUMBIA HEIGHTS CIVIC PLAZA?
SURVEY PREFERENCES
13 Responses
WHAT WOULD YOU LIKE TO SEE MORE FOR COLUMBIA HEIGHTS CIVIC PLAZA?
PRIORITIES
30
OPTION #1 OPTION #2 69% 31% 1 2 5 4 3 4 3 1
VENDOR SPACE SEATING CULTURAL EVENTS SHADE
SURVEY 3 - RESULTS
MEANDERING PLAZA
ADAPTIVE CAFE SEATING
FLEXIBLE VENDOR SPACE ATTRACTIVE WAYFINDING
ADAPTIVE PROGRAMMING
VISIBLE LIGHTING
ROBUST SEATING AREA
ORGANIC ENTRANCE
31
LUSH LANDSCAPE
LUSH LANDSCAPE
SECTION EIGHT
Conclusion
32
CONCLUSION
From our experience, we learned that people are open to being part of the design process. Finding ways to collect data INTERACTIVELY AND ENGAGINGLY with residents provides us with more insight into the needs of the community. OBSERVING how residents and visitors interact with the built environment was crucial in determining our design goal and mission statement. The community of Columbia Heights expressed their desire for a place where they could GATHER with friends and strangers alike, a place that is ADAPTIVE AND FLEXIBLE to everyday needs, a place that reminds them of home. In addition, we observed street vendors and how COMMUNITYDRIVEN the neighborhood is.
Our process made it more complex, since we had several site visits to collect data through surveys, interviews, and observations. Despite adding more complexity to the project, the results demonstrated where people have OWNERSHIP and feel like they belong. Our goal was to understand which elements create a PLACE OF BELONGING.
We learned that many design factors can help create a place of belonging, such as small gathering places, space for vendors, safety elements, flexible seating, community programming, etc. But we also learn that there is something less tangible, and maybe that could be called the “SOUL” of a place. The feeling that is created by people themselves. As designers, we should strive to determine the third element and design with the community to retain it.
For the purpose of this MATTERLAB research project, we want to give back to the Columbia Heights community as a WORK IN PROGRESS website for further research studies.
https://storymaps.arcgis.com/stories/531ce0daf5ab4256b1d7bd40ed8d66d1
(Open link in a brower)
We trust that this document can serve as a foundational resource for designers when working with complex communities, helping them better understand the intricate art of designing spaces that foster a true sense of belonging.
33
SECTION NINE
Design Resources
34
DEVELOPED
A PROJECT FRAMEWORK
1 2 3 4 5
SITE ANALYSIS
BOOKLET/STORYMAP FINAL PRESENTATION AUG DEC SEPT OCT NOV
• TIP: MIRO CAN BE AN USEFUL TOOL WHEN COLABORATING WITH MULTIPLE PEOPLE IN MULTIPLE PLACES. ( LINK )
35
SERVATIONS DESIGN
INTERVIEWS/SURVEYS/OB -
FIRST STEPS
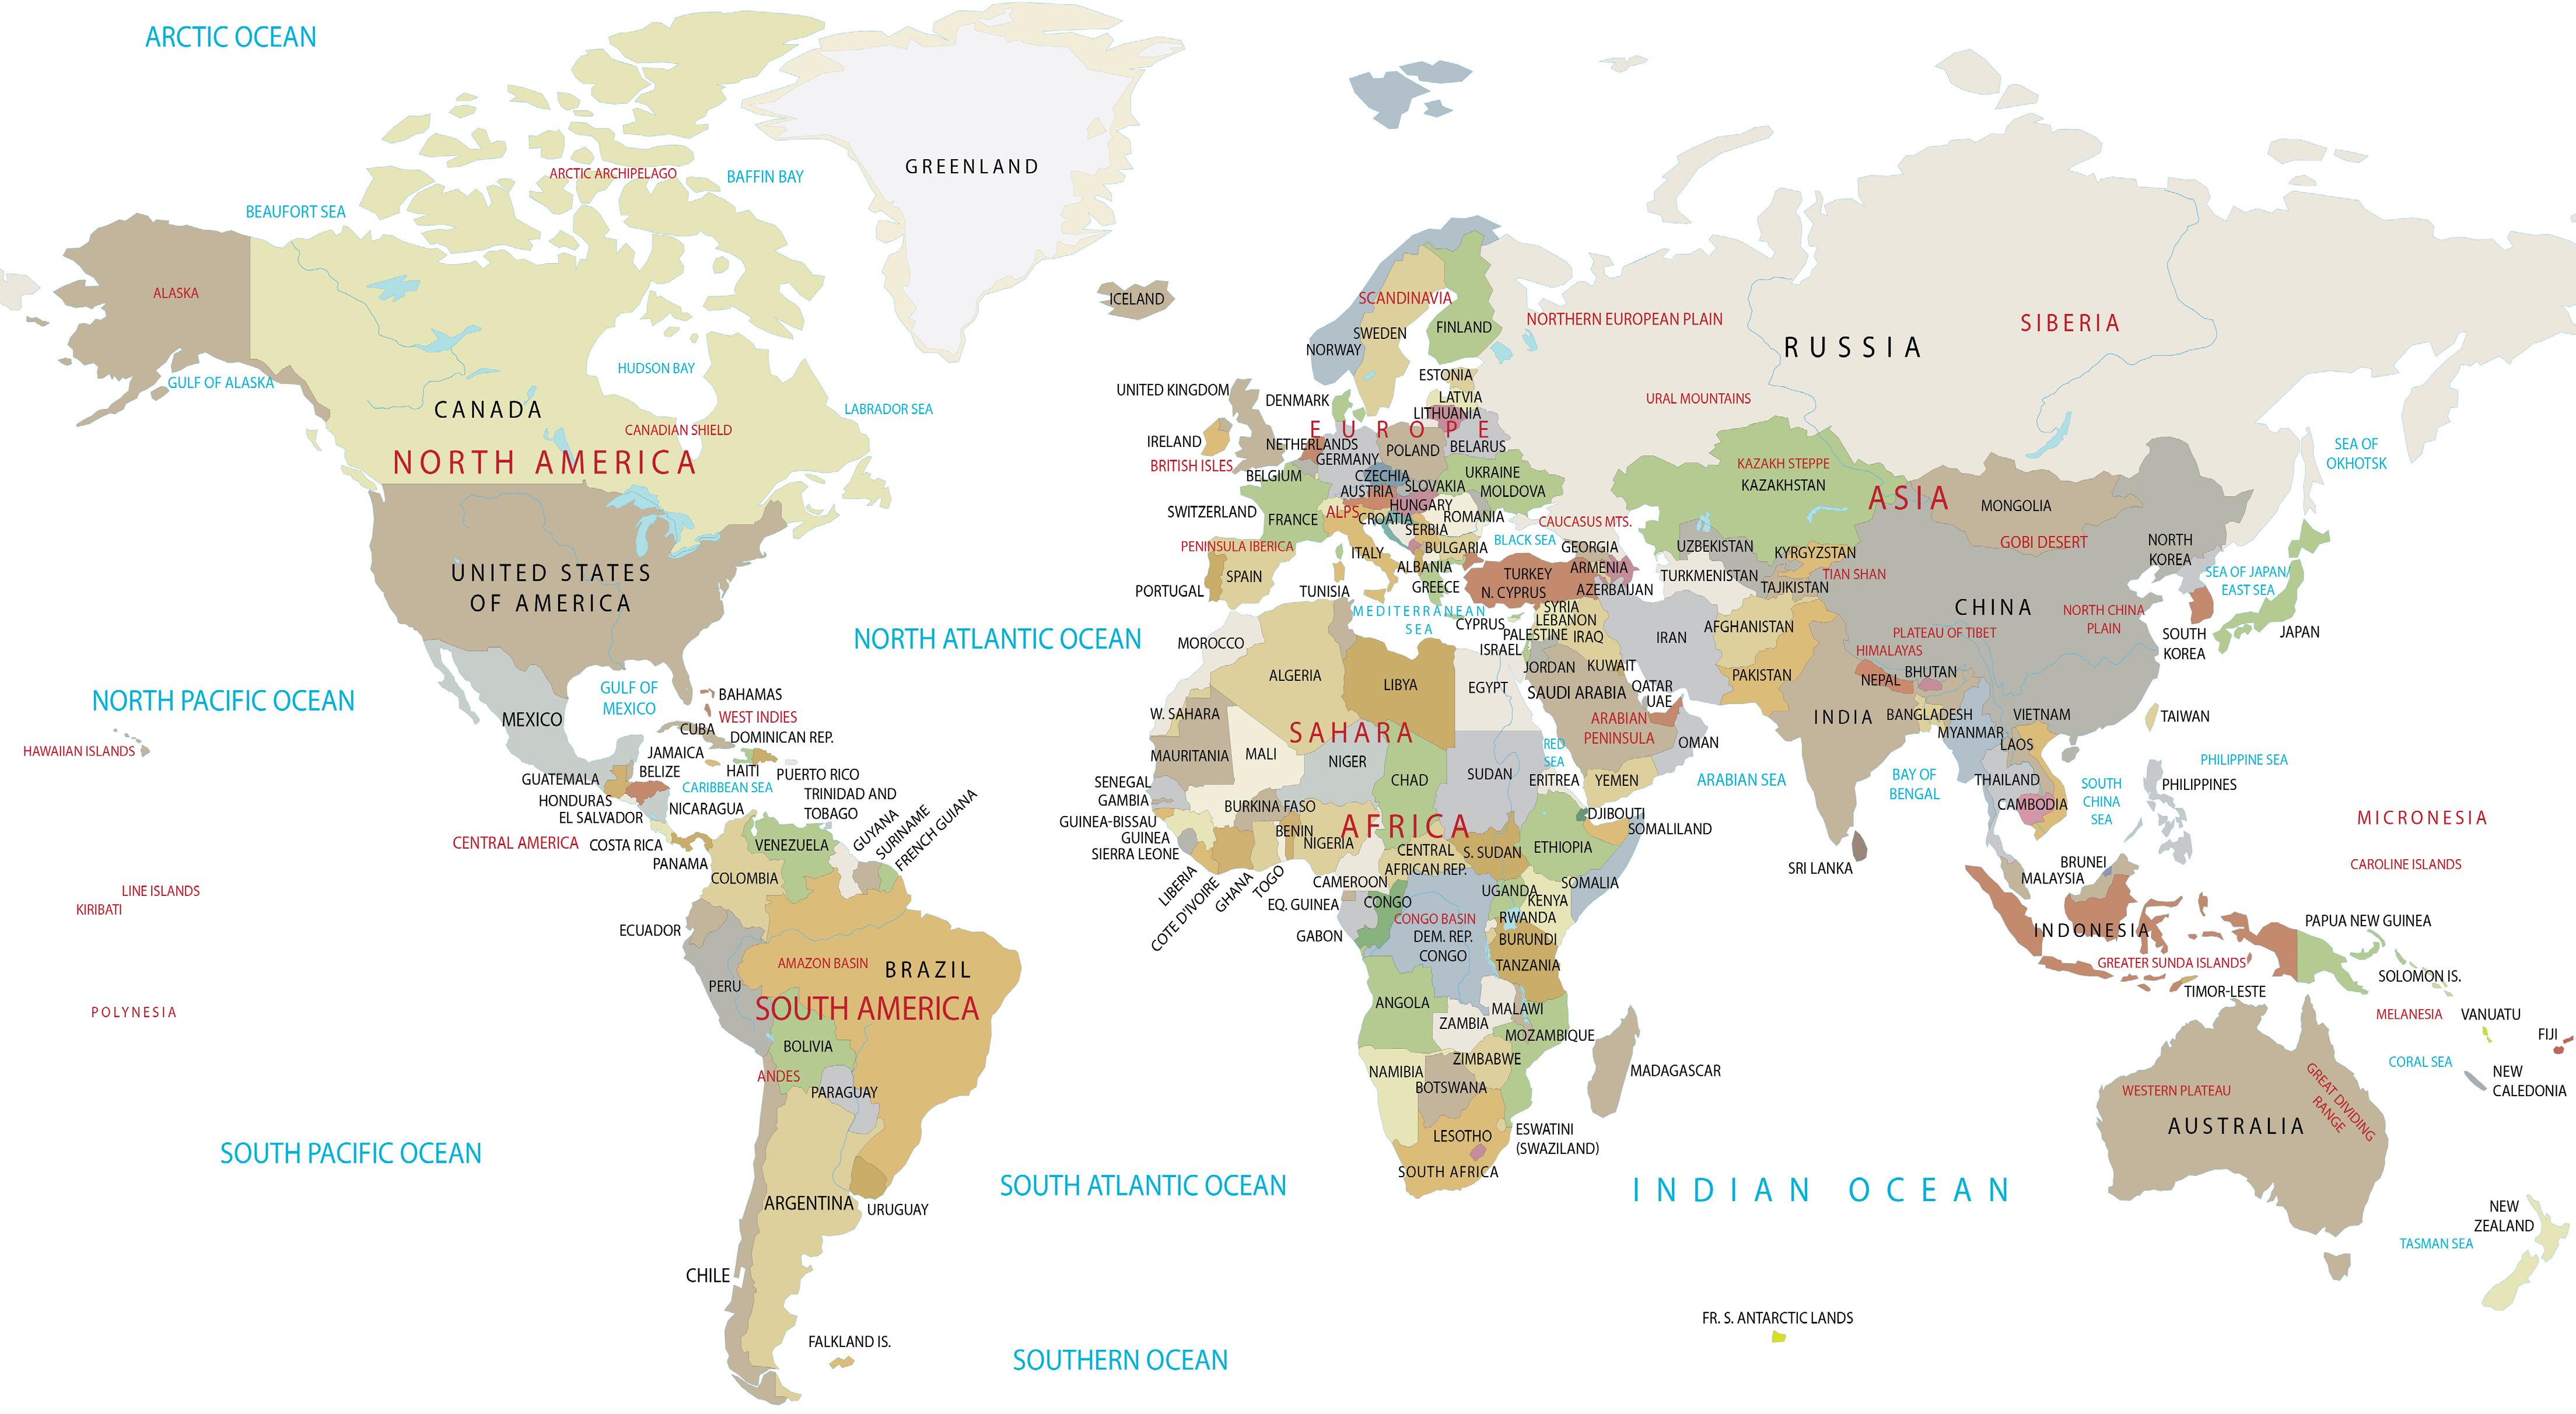
• Before embarking on data collection, it’s essential to define the specific questions you aim to address. For instance, in our case, we sought to ascertain the countries of origin for immigrants in Columbia Heights.
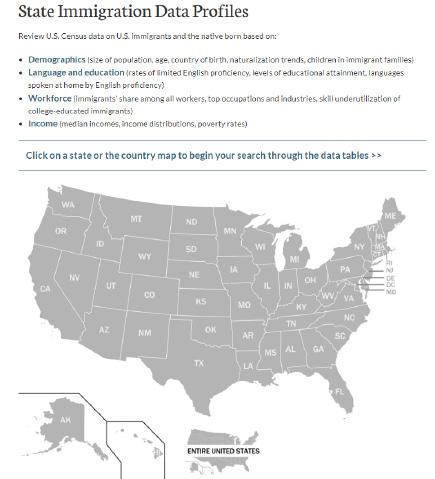
• To kickstart this process, we employed the Migration Policy Institute’s interactive map tool, accessible via the provided link. This tool enabled us to access initial demographic, language, education, workforce, and income data from the Census, categorized by state (as indicated in the image on the right). (LINK)
• In addition, the American Immigration Council proved to be a valuable resource for gathering preliminary immigrant-related information organized by state, as can be explored through the provided link. These resources equipped us with a solid foundation to answer our research questions effectively.( LINK).
ZOOMING IN
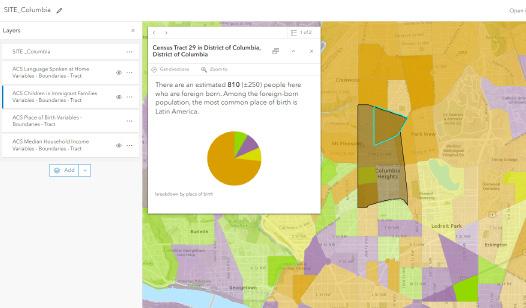
For a more granular data-driven understanding of a site, Geographic Information System (GIS) Online emerges as a powerful tool, allowing for in-depth analysis at a localized level. Instead of examining data at a broader state or county level, it enables a closer look at specific study areas.
In the context of this study, we leveraged the American Community Survey (ACS) data, which is published annually. This data can be seamlessly integrated into GIS Online for a comprehensive examination of the community (Image on the right).
The ACS data is structured by tracts, prompting us to compile data from all tracts within our site and consolidate it into an Excel file. This approach facilitates a more detailed and precise understanding of the community’s dynamics.
36
1
SITE ANALYSIS
Source: American Immigration Council, 2022
Source: ACS Data, 2020; GIS Pro, 2023
37 SITE ANALYSIS 1
(x*23%) (x*30%) PlaceofBirthByContinentTract28.01Tract28.02Tract37.02Tract37.01Tract29Tract30Tract36Tract31(23%)Tract35(30%)TOTAL Latin America 692 1251 44 448 595 640 247 138 88 4143 Europe 52 245 0 39 68 314 148 17 18901 Asia 201 414 0 84 82 64 234 12 261117 Africa 191 142 338 12 65 35 90 17 35925 North America 39 9 4 961 Oceania 9 LanguageSpokenatHomeTract28.01Tract28.02Tract37.02Tract37.01Tract29Tract30Tract36Tract31(23%)Tract35(30%)TOTAL Who only speak English at home 2285 2467 2466 1464 3115 2817 3715 507 1066 19902 Who speak Spanish at home 877 1872 71 460 814 769 323 223 1615570 Who speak another Indo-European at home 86 328 32 52 143 95 186 19 661007 Who speak Asian and Pacific Islander an at home 209 144 19 15 38 58 81 10 16590 Who speak other languages at home 223 55 61 11 79 35 165 36 43708 ChildreninImmigrantFamiliesTract28.01Tract28.02Tract37.02Tract37.01Tract29Tract30Tract36Tract31(23%)Tract35(30%)TOTAL 636 365 321 137 365 213 58 434 212305 73.70% 40.90% 38.40% 62.60% 49.40% 31.30% 18.20% 77.10% 62.00% 50.40% MediumHouseholdIncome(Past12months)Tract28.01Tract28.02Tract37.02Tract37.01Tract29Tract30Tract36Tract31(23%)Tract35(30%)TOTAL Householder <25 years $153,798 $17,089 Householder 25-44 years old $80,208 $82,276 $60,259 $36,473 $156,125 $109,792 $131,912$142,770 $95,326 $99,460 Householder 45-64 years old $63,232 $29,030 $25,815 $116,652 $141,000 $49,830 $122,778 $170,602 $79,882 Householder 65 years+ $93,080 $40,270 $86,495 $214,567 $61,090 $11,012 $27,018 $24,091$61,958
EXCEL EXAMPLE
Source: ACS Data, 2020
FIRST STEPS
Exploring the online data can be a valuable resource for gaining a more profound understanding of a community. Unfortunately, immigrant communities often harbor reservations when it comes to completing Census forms. Therefore, it becomes imperative to collect data that aids in a more comprehensive grasp of the community.
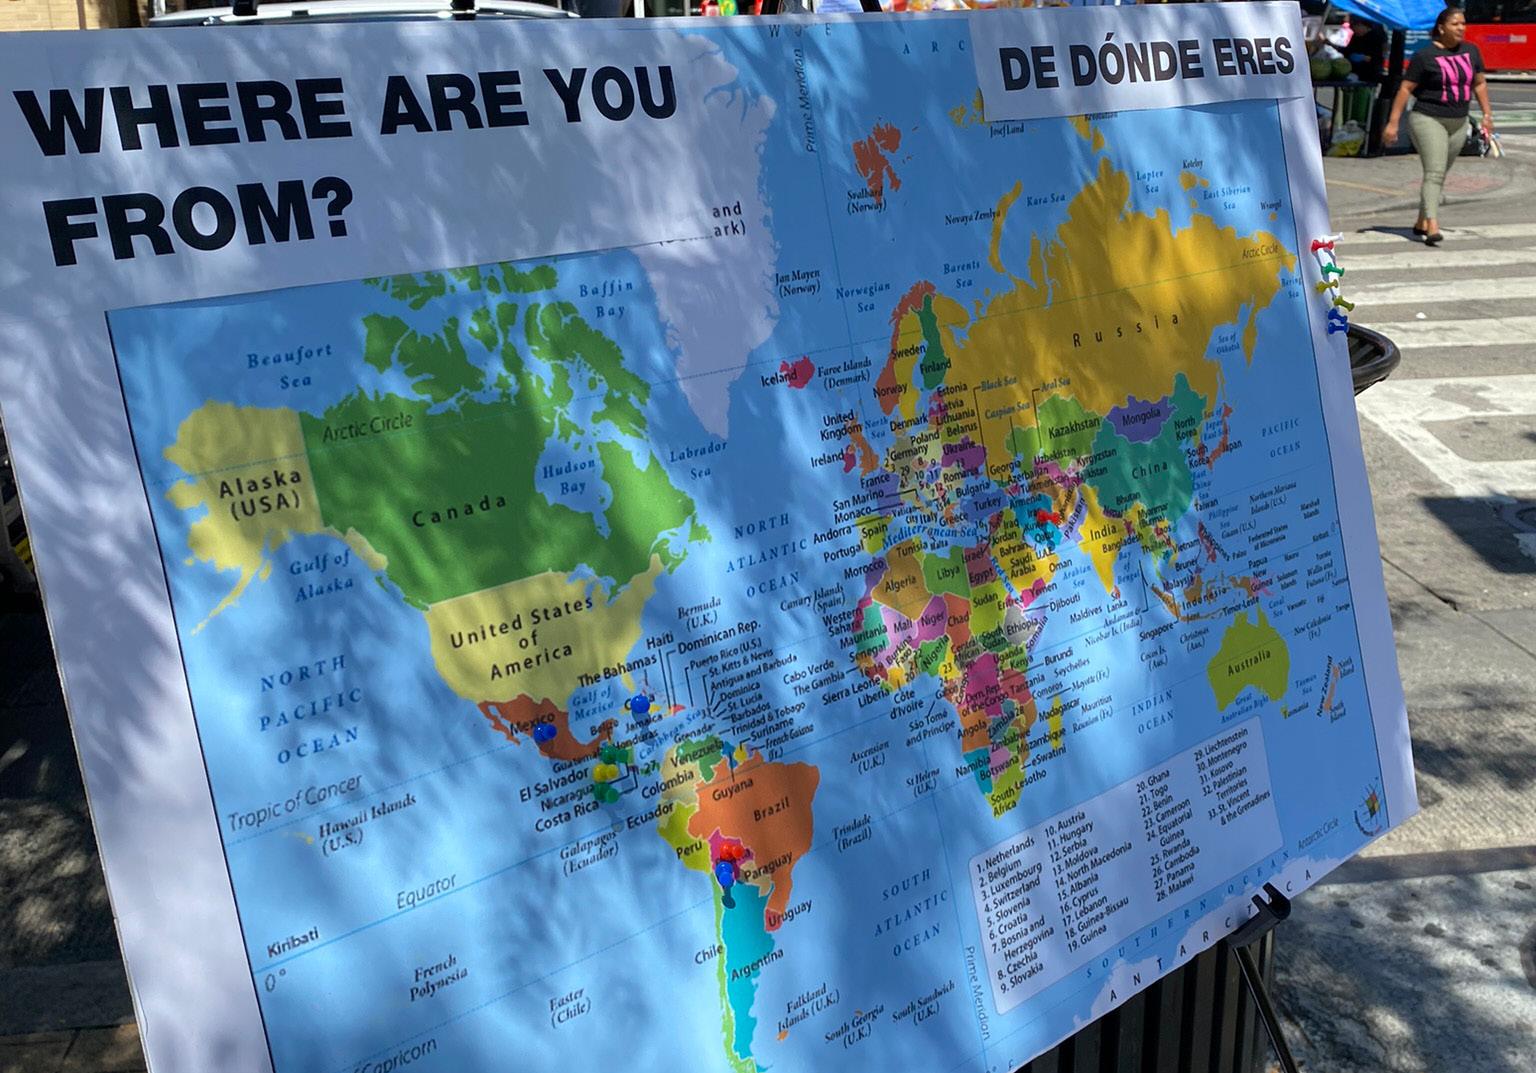
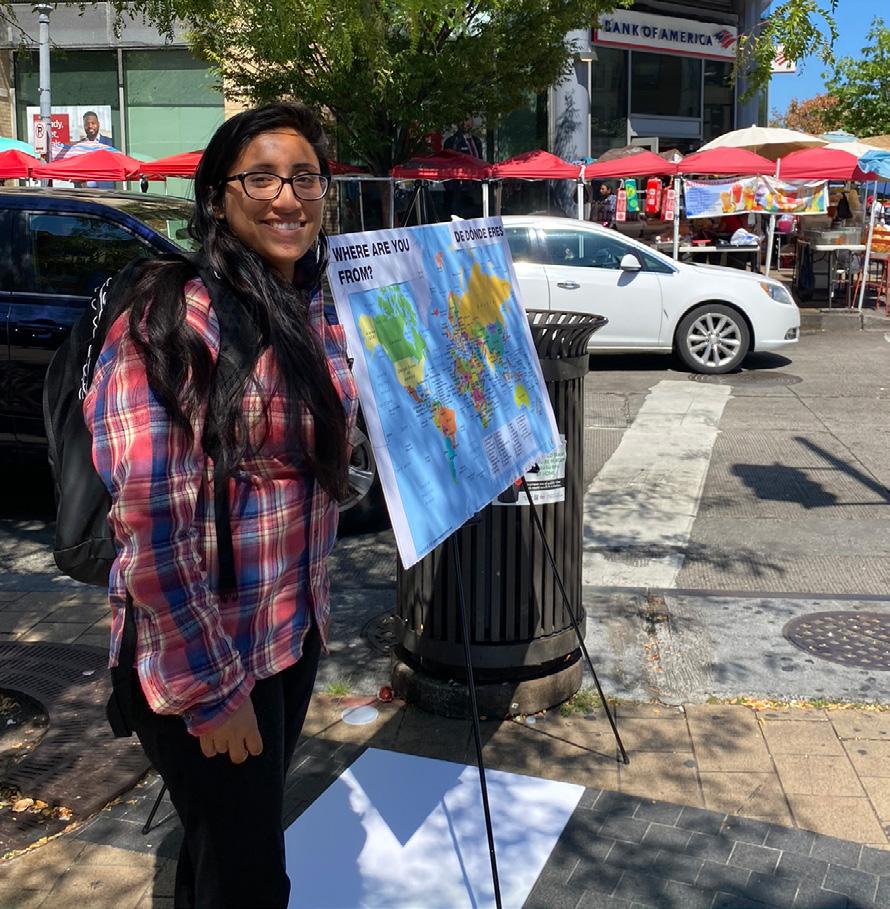
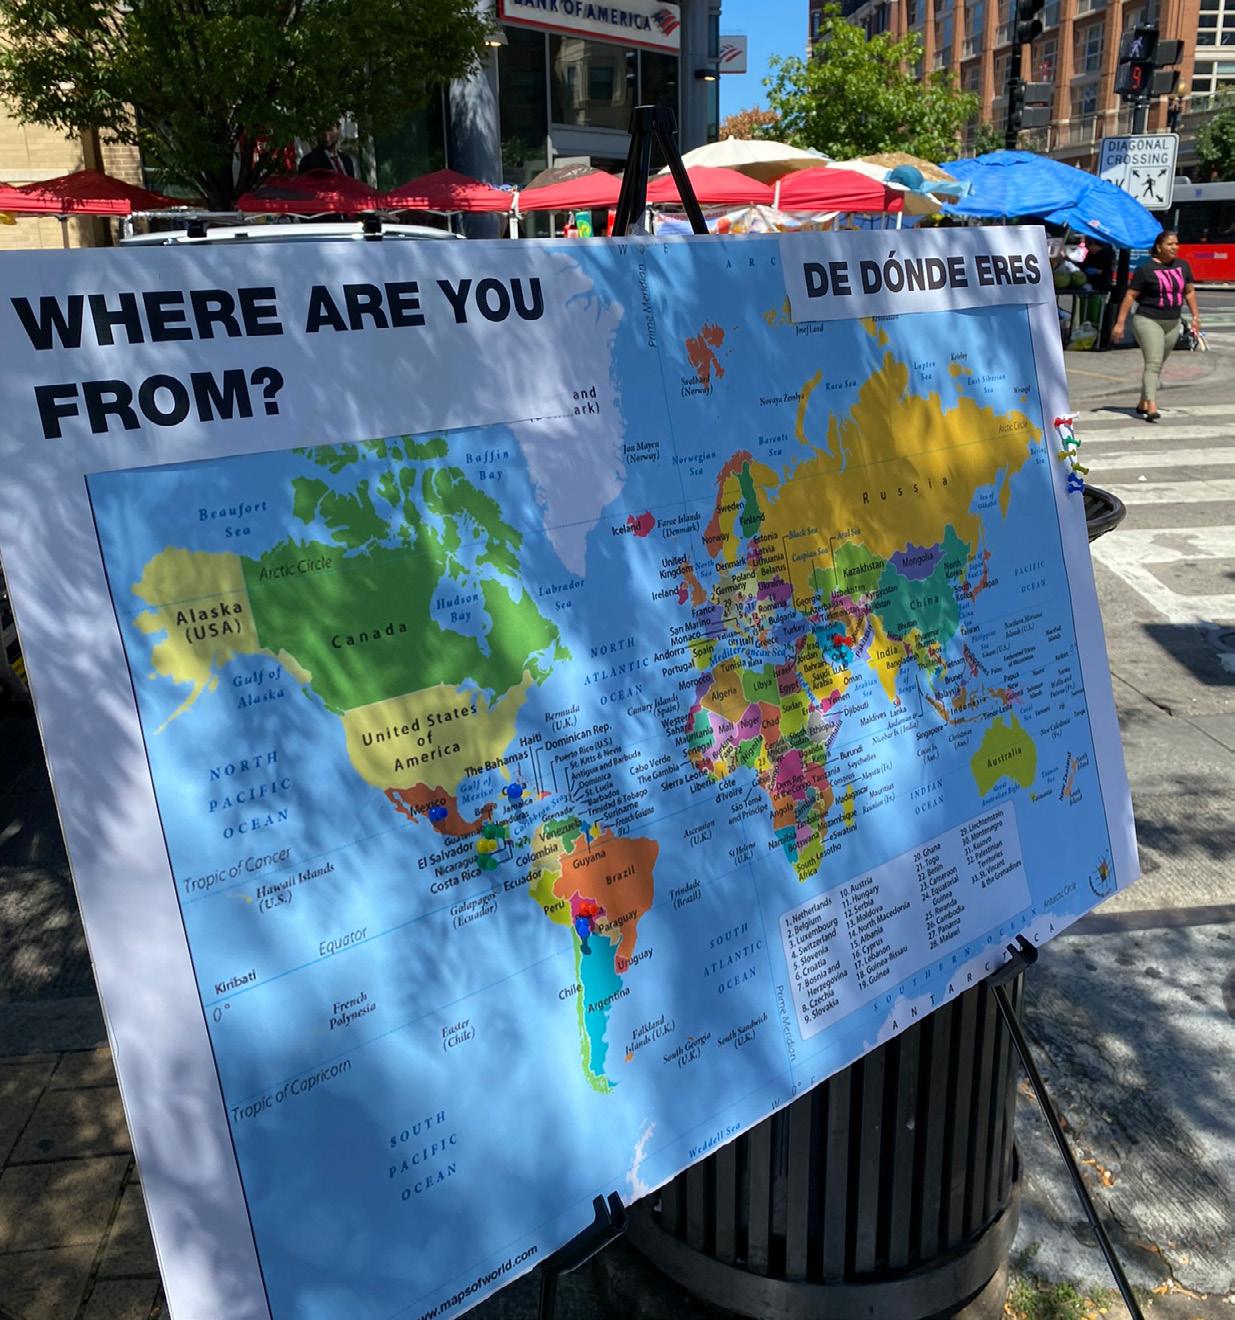
In our quest to delve deeper into the Columbia Heights community, we made three on-site visits. Our initial survey featured an interactive world map, which allowed passersby to place a pin on their place of origin. This innovative map made it accessible to people who may not be proficient in English, ensuring they could readily grasp the intent of our inquiry. While this approach serves as a noteworthy example, numerous other survey techniques are available to collect the necessary data. The key to success lies in ensuring that these methods are not only understandable but also inclusive, enabling broad community participation.
UNDERSTANDING THE SITE
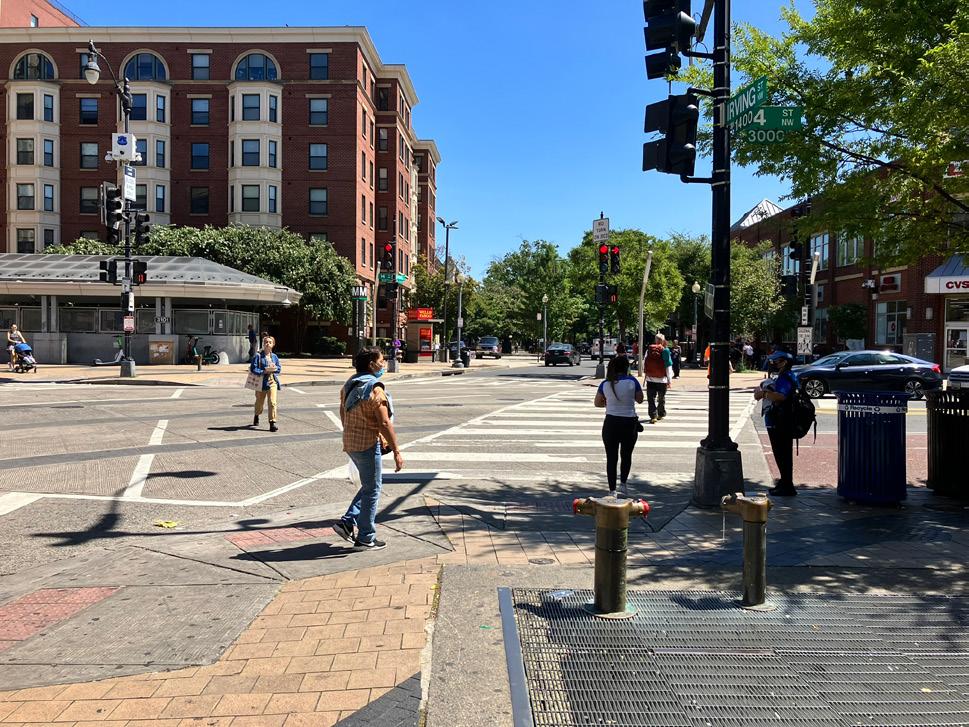
For our second site visit, we conducted an on-site walkthrough to gain a deeper insight into the location to gain qualitative data. Some of the valuable information we gathered includes:
• Identification of current place-making elements within the area.
• Observations on how people navigate and congregate within the site.
• Noting specific locations where people tend to sit, shop, rest, or wait for public transportation.
• Identifying areas where placemaking enhancements can be implemented.
• Listing community organizations in the vicinity that actively engage in community outreach events.
This hands-on exploration allowed us to gather on-the-ground insights that are crucial for a comprehensive understanding of the site and its dynamics.
38
2
INTERVIEWS/SURVEYS/ OBSERVATIONS
1
4 5
2 3
DESIGN 3
FIRST STEPS
Based on the data we collected, we made the decision to focus on enhancing a public area within our site through the integration of placemaking elements. To determine which elements would best suit our design, we distilled our approach down to five guiding principles. These principles were derived from the insights gathered through both online data and site visits. The five principles that will inform our design are:
1. Adaptable : Assures the ability to adjust changes, new ideas, and different conditions to the needs of the community.
2. Inclusive: Ensures that all residents of the community feel part of their community, giving equal access/benefit from updated design area.
3. Flexible: Provides adjustable/versatile elements to accommodate a range of activities/ uses to serve the needs of the community.
4. Community-Driven: Assures community involvement in the decision-making and active efforts, ensuring their personal input in the design process.
5. Sociable: Ensures a sense of social interaction and connection, promoting a welcoming and friendly atmosphere.
These guiding principles serve as a foundation for our project, and while every project may differ, we believe that these overarching principles will be instrumental in making the selected site more conducive to the immigrant communities in the area.
NEXT STEPS
Once we had established our guiding principles, we proceeded with the sketching phase of our project. In our case, we developed two distinct concepts, both rooted in the guiding principles but featuring different layouts. After the initial sketching, we employed CAD, Sketch-Up, and Lumion to craft 3D visualizations of these concepts.
During our final site visit, we presented both design options by placing them on separate boards. We then provided an opportunity for the residents in Columbia Heights to cast their votes and express their preferences for their favorite design. This participatory approach ensured that the final design would truly reflect the desires and needs of the local community.
COLUMBIA HEIGHTS
39
SOCIABLE INCLUSIVE FLEXIBLE COMMUNITYDRIVEN
ADAPTABLE
FIRST STEPS
When determining how to present the information, it’s crucial to consider the intended audience. In our case, we chose to create a booklet as a comprehensive document to capture the essence of our study. Additionally, we developed an online webpage using ArcGIS Online, which offers easy and convenient access to the information for the general public. You can explore the online webpage through the provided link. This multi-faceted approach ensures that the findings and insights from our study are accessible and digestible to a wide range of individuals interested in the project.
40
5
FINAL PRESENTATION