
Jan1st -Dec31st
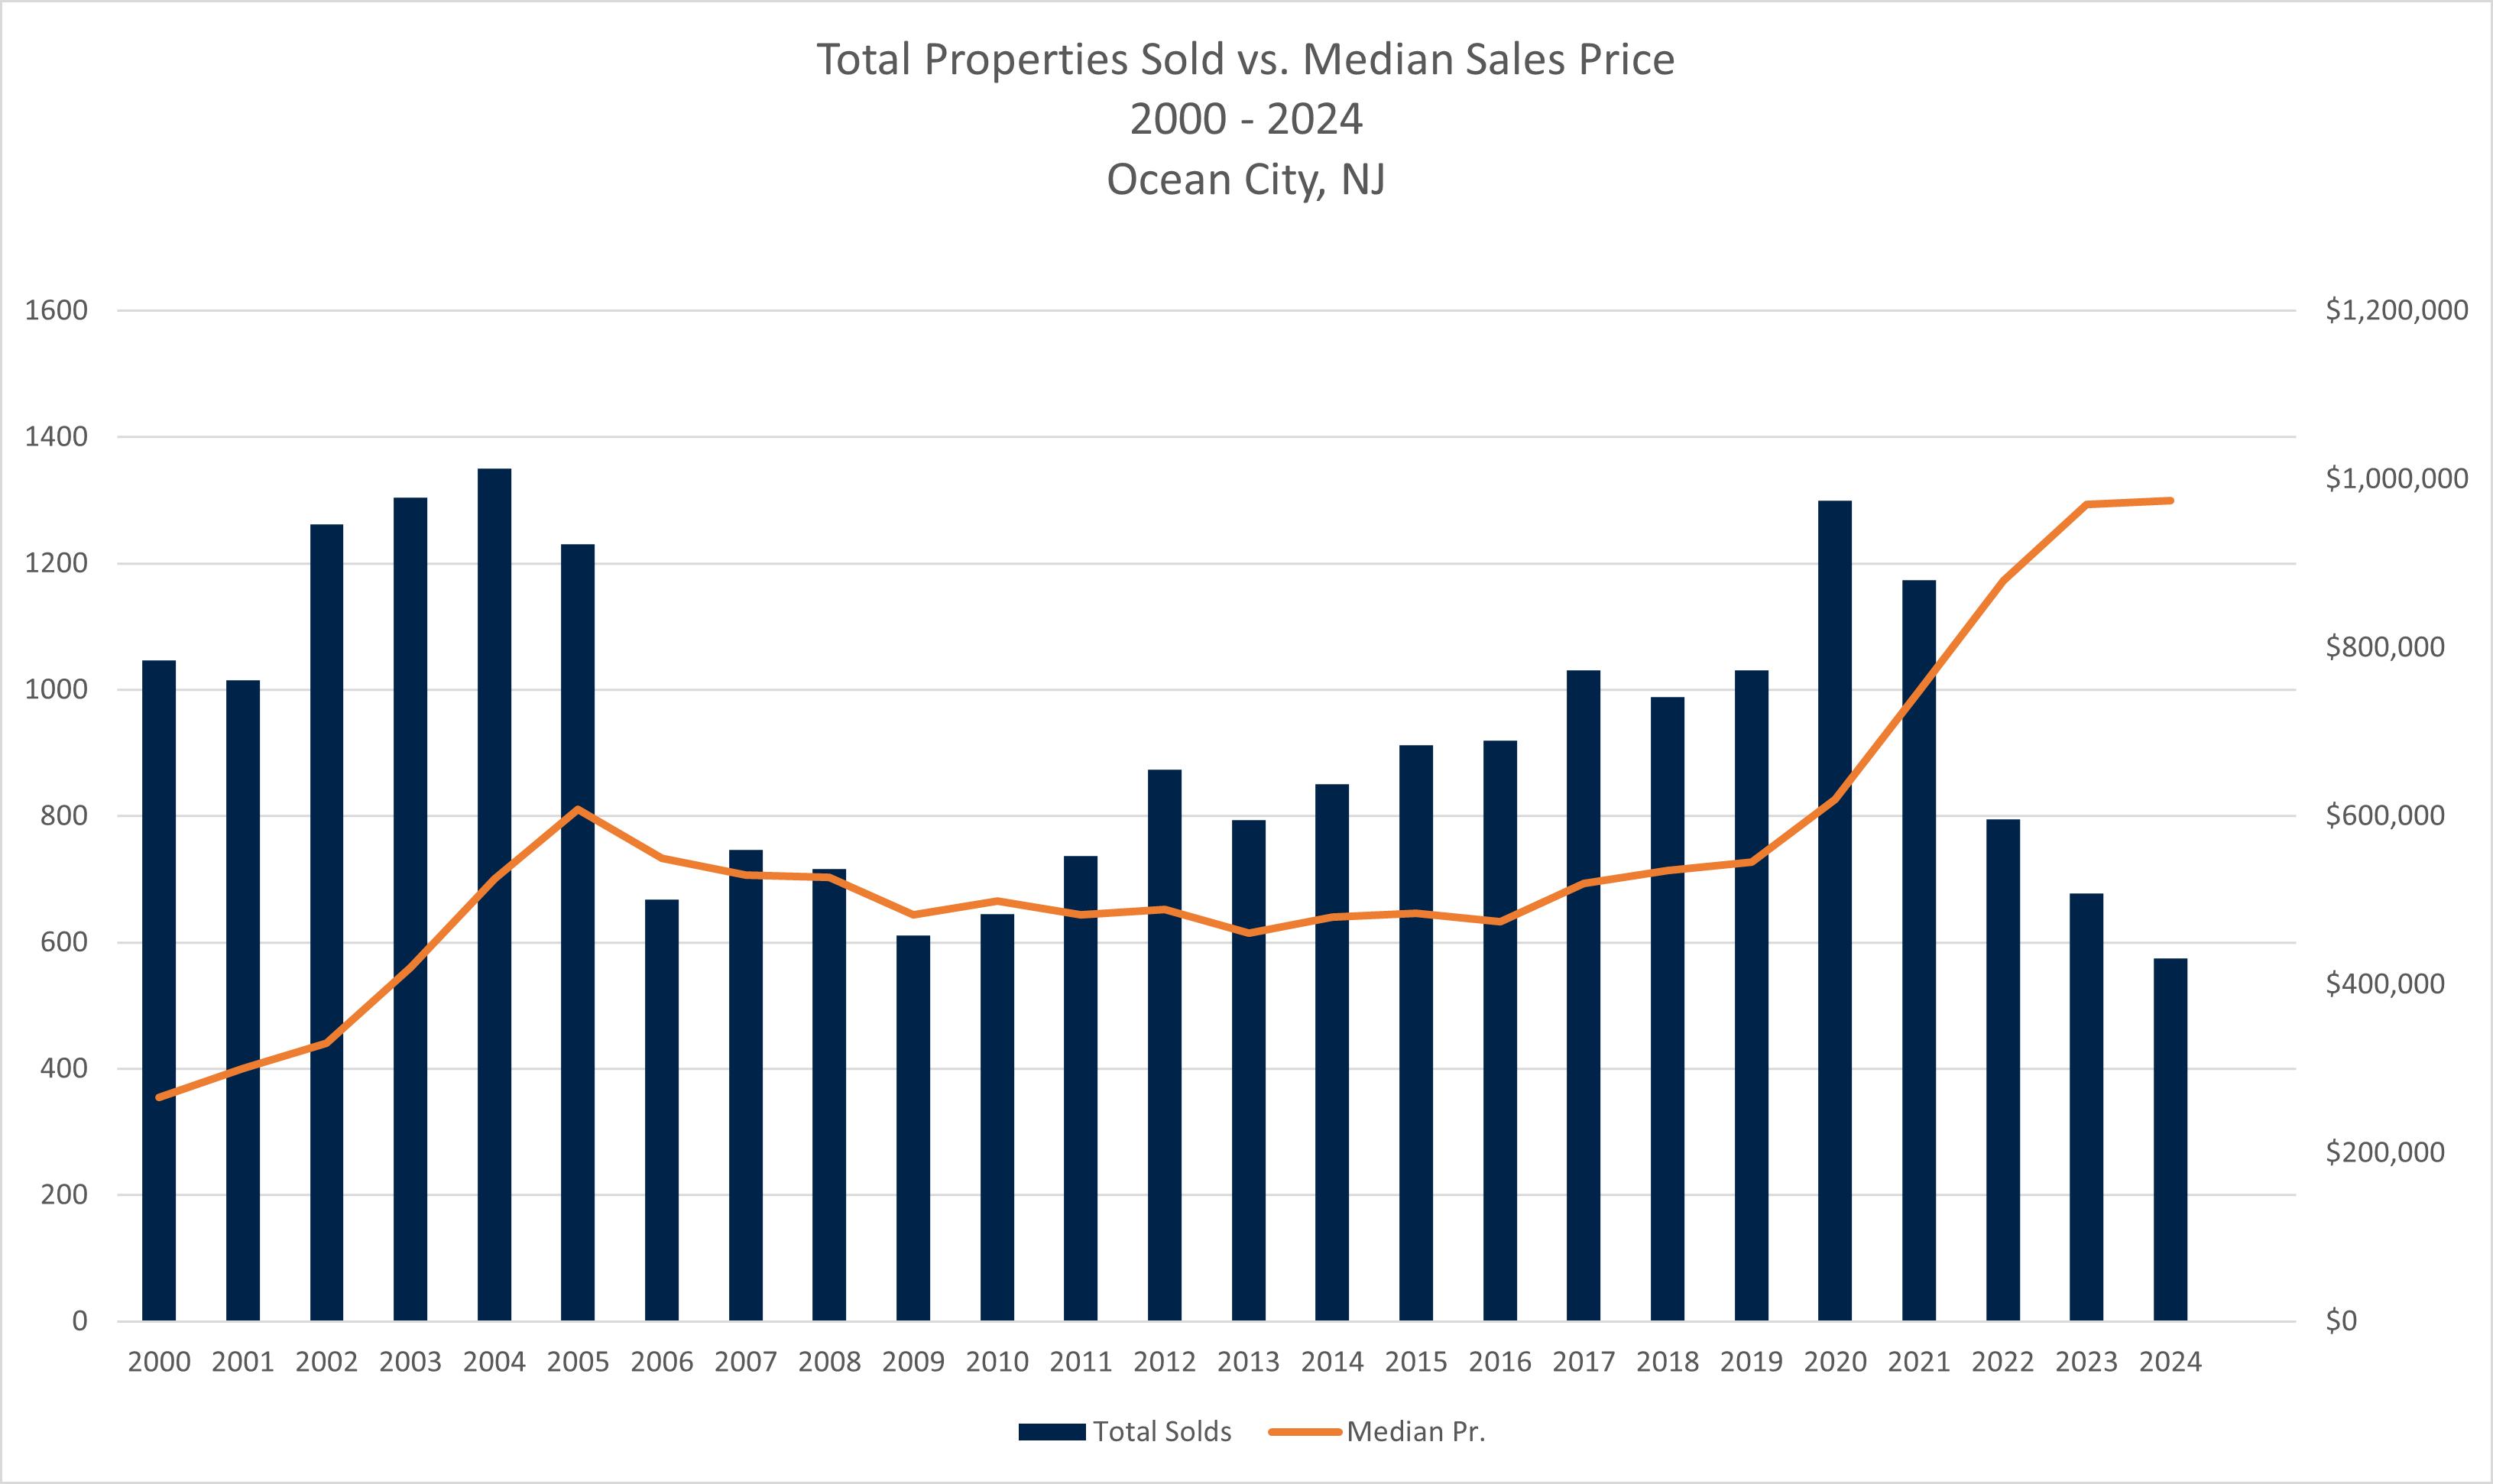
Steady list prices and a tight inventory were reflected in 2024's Total Properties Sold. There was a 15.2% reduction in total sold properties as compared to the previous year.In 2023 a total of 678 properties sold; in 2024 a total of 575 properties sold.
TheMedian SalePricereported a slight growth of 0.5% from $970,000 in 2023 to $975,000 in 2024.
The Total Sold Volume decreased by 13.7%. In 2023 the Total Sold Volume was $882,047,577; in 2024 the volumewas $709,133,654. Back to Table of Contents
2023/2024AnnualComparison Jan1
The Median Sales Price in 2024 continued a 7-year trend with an improvement over the previous year. In 2023, the overall Median Sales Price was $970,000; 2024 reported the price at $975,000, a 0.5% increase. The following chart tracks 24 years of Median Sales Price and Total Properties Sold,reflecting historically high and low figures respectively.
Oct 1-Dec31,2024
Back to Table of Contents
The fourth quarter of 2024 reported nearly no changes in Total Properties Sold, the Median Sale Priceand Total Sold Volume as compared to thesameperiod in 2023.
There was a slight drop of 1.4% in Total Properties Sold when looking at Q4 2024 versus Q4 2023. In 2024, there were 143 properties sold. In Q4 2023, the reported total properties sold was 145.
An increase in the Median Sale Price of 3% lifted the Q4 2024 price to $999,900 from Q4 2023's Median SalePriceof $970,000.
The Total Sold Volume for Q4 2024 was nearly flat as compared to Q34 2023 with a 0.1% increase. In Q4 2024 the Total Sold Volume was $170,058,197; in Q4 2023 the Total Sold Volumewas $169,911,780.
Back to Table of Contents
Jan1st -Dec31st
A total of 138 Single Family Homes sold in 2024, a 21.6% decrease from the reported sales of 176 in 2023. The Median Sale Price reported a favorable increase of 10.8% over the 12-month period of 2023. In 2024 the Median Sale Price jumped to $1,800,000 from $1,625,000 in 2023.
As expected with a reduction in homes sold, there was a 15.0% decrease in the Total Sold Volume,from $310,971,538 in 2023 to $264,174,428.
2023/2024AnnualComparison
Oct 1-Dec31,2024
Back to Table of Contents
The Q4 2024 Total Single Family Homes sold was 34 compared to 39 in the same period of 2023. This was a decrease of 12.8%Total Properties Sold in 2024.
The Median Sale Price also saw a reduction of 5 8% when comparing with Q4 2023 The Median Sale Price in 2024 was $1,531,250 as compared to $1,625,000 in 2023.
The Total Sold Volume dropped by 19 3% in Q4 2024 versus Q4 2023 The Total Sold Volume in 2024 was $56,161,398; volume in Q4 2023 was $69,607,483.
Back to Table of Contents
Jan1st -Dec31st
The 2024 total of Condominiums sold in Ocean City was 10.9% less than 2023. In 2024,total Condominiums sold was 394;in 2023 the total was 442.
Therewas a4.6% increasein the Median Sale Pricein 2024.In 2023 theMedian Sale price was $822,500. In 2024 the Median Sale Price increased to $860,000.
Keeping pace with the total properties sold, the Total Sold Volume decreased in 2024 to $385,765,476 from $412,881,331in 2023. This was a -6.6% change in Total Sold Volumefor Condominiums sold.
2023/2024AnnualComparison
Jan1st -Dec31st
Oct 1-Dec31,2024
Back to Table of Contents
Oct 1-Dec31,2024
Unlike the Single Family Home Market, Ocean City's Condominum Sales in the last quarter of 2024 reported gains The Total Properties Sold in 2024 were 98, a 5 4% increase over the 93 sold in Q4 2023.
The Median Sale Price also improved by 7.2%when comparing the fourth quarter 2024 and 2023. In 2024 the Median Sale Price was $895,000. In Q4 2023 the Median Sale Price was $835,000.
The Total Sold Volume reported a 14.0% increase in Q4 2024 over the same period in 2023. Total Sold Volume in Q4 2024 was $97,816,049 versus $85,809,997 in Q4 2023.

200 34th Street | Ocean City, NJ 08226
o: 609.399.2500 www.goldcoastsir.com
Facebook YouTube Inst agram LinkedIn
Data Source: South Jersey Shore Regional Multiple Listing Service.Information contained in this report is deemed accurate but not guaranteed.
© 2025 Sotheby?s International Realty. All Rights Reserved. Sotheby?s International Realty® is a registered trademark and used with permission. Each Sotheby?s International Realty office is independently owned and operated, except those operated by Sotheby?s International Realty, Inc
The Sotheby?s International Realty network fully supports the principles of the Fair Housing Act and the Equal Opportunity Act.