Marin County Market Report - July 2023


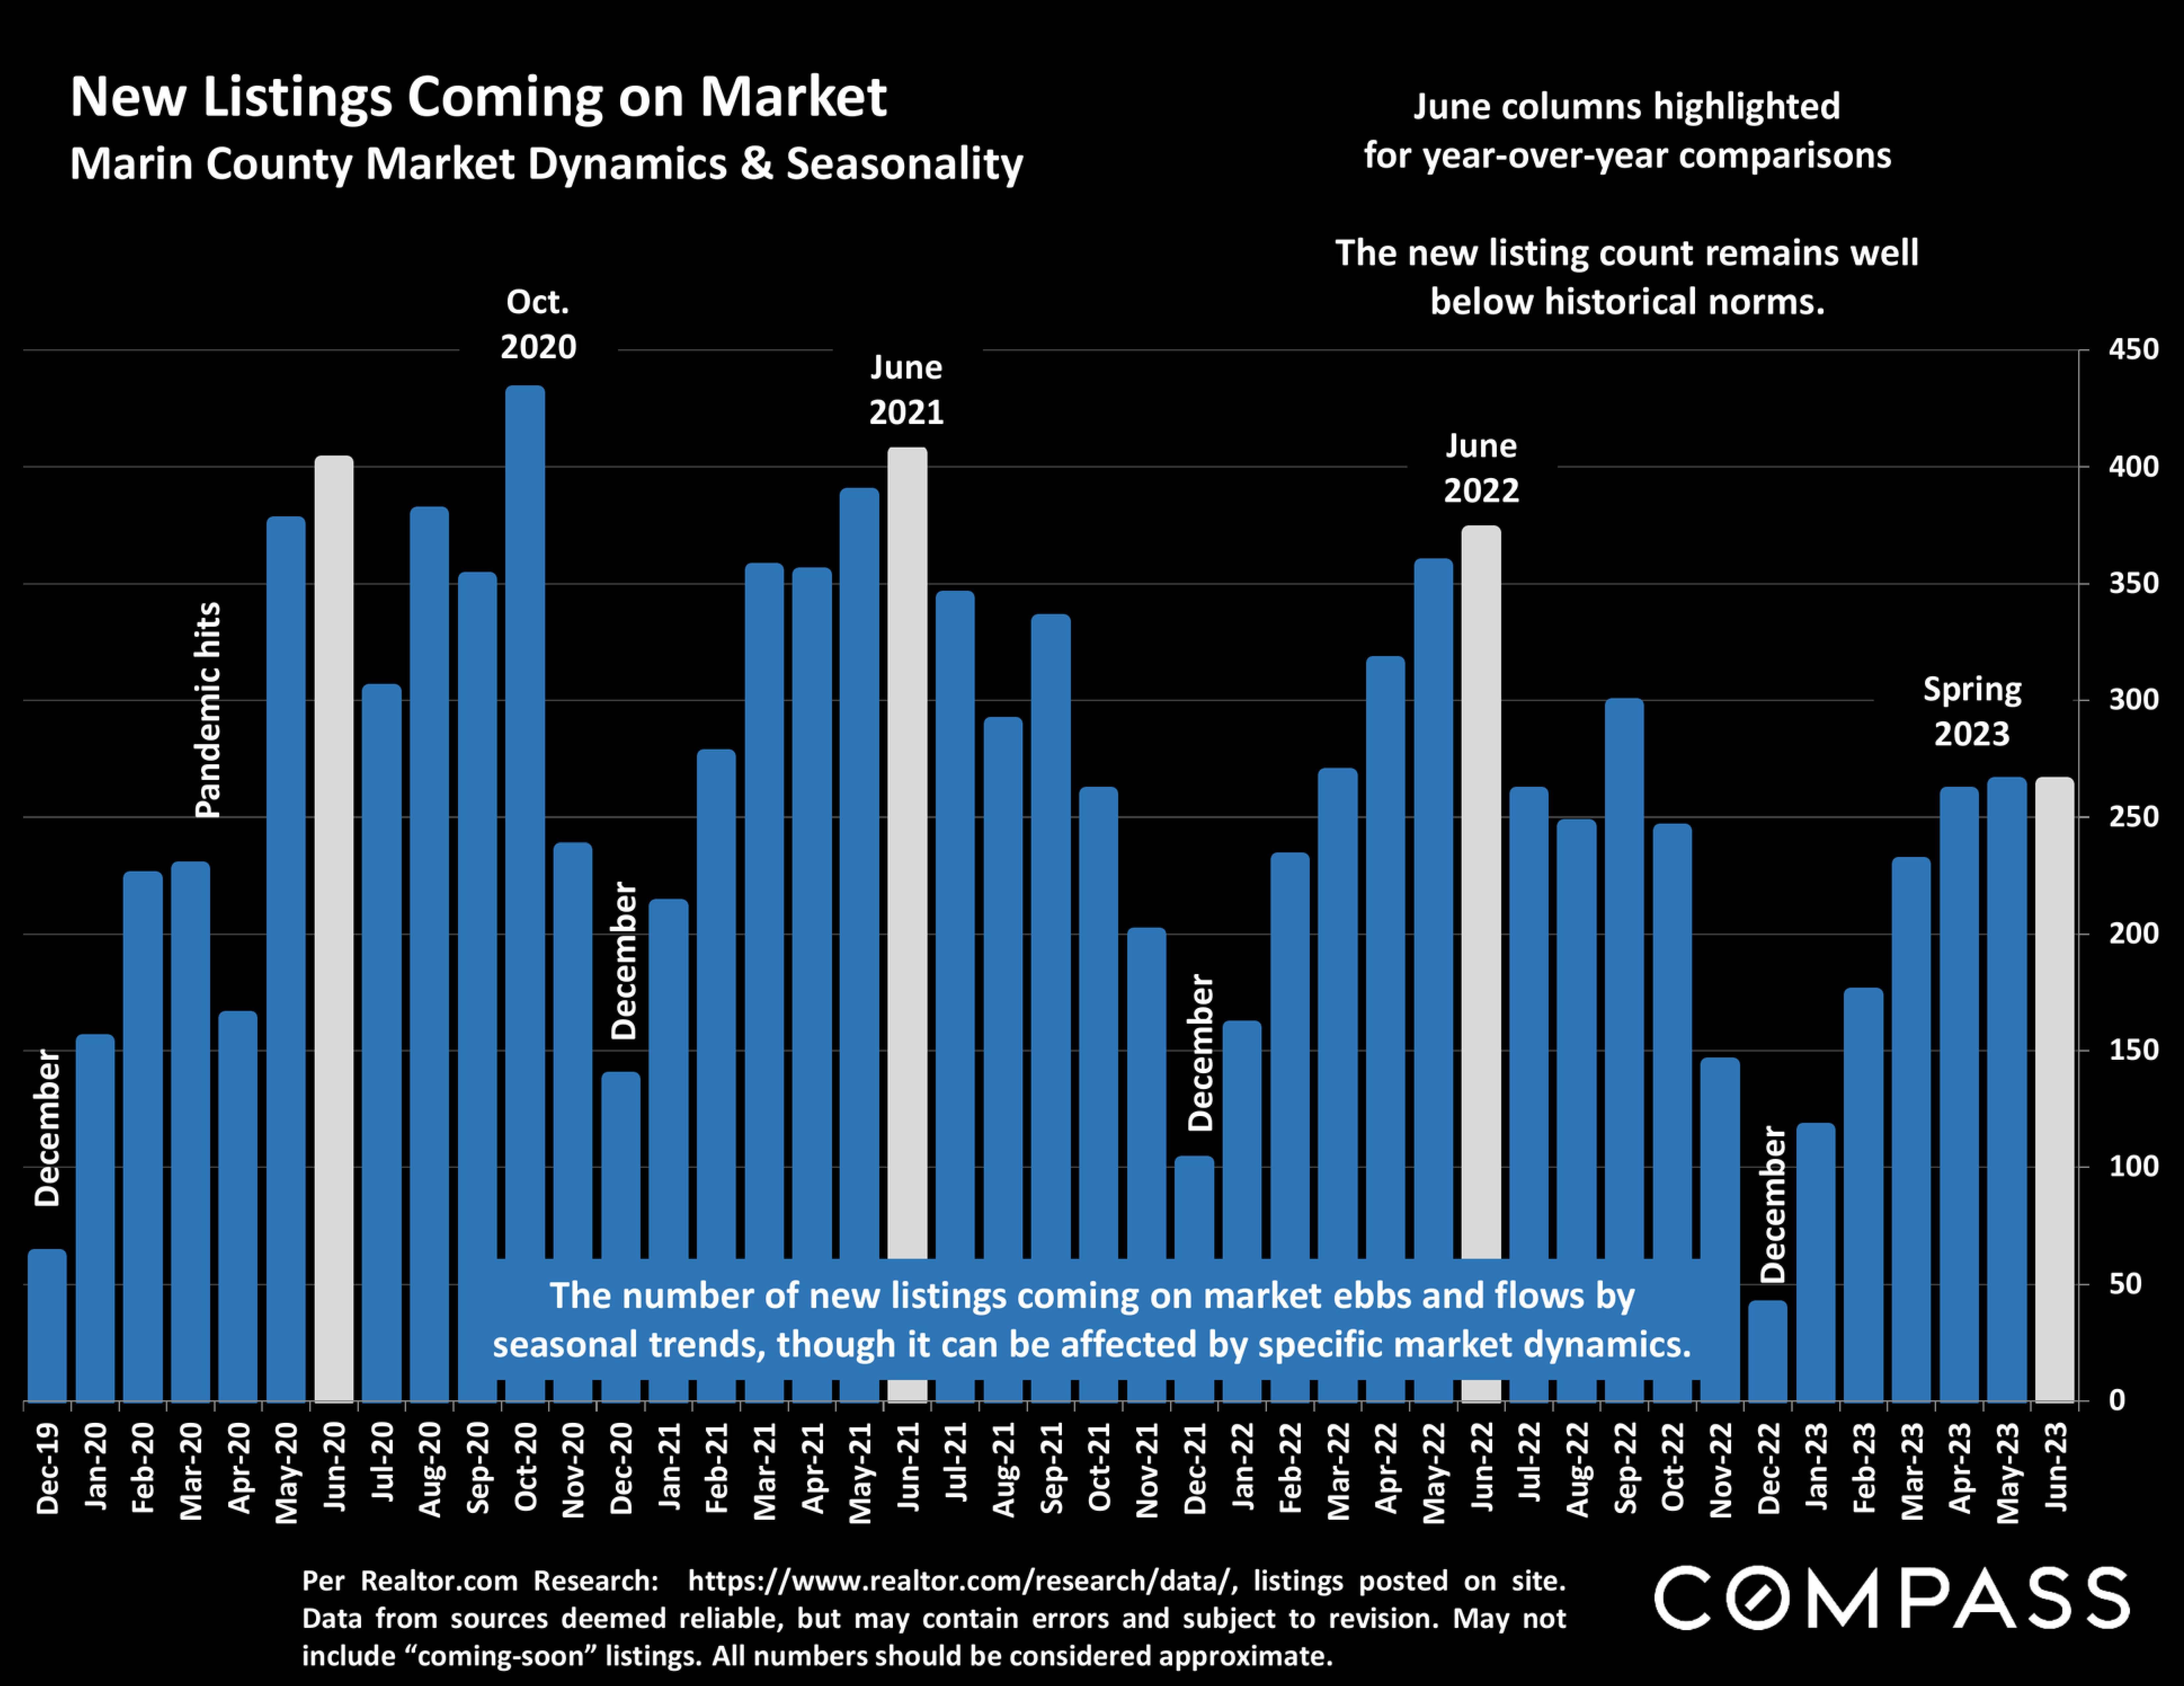
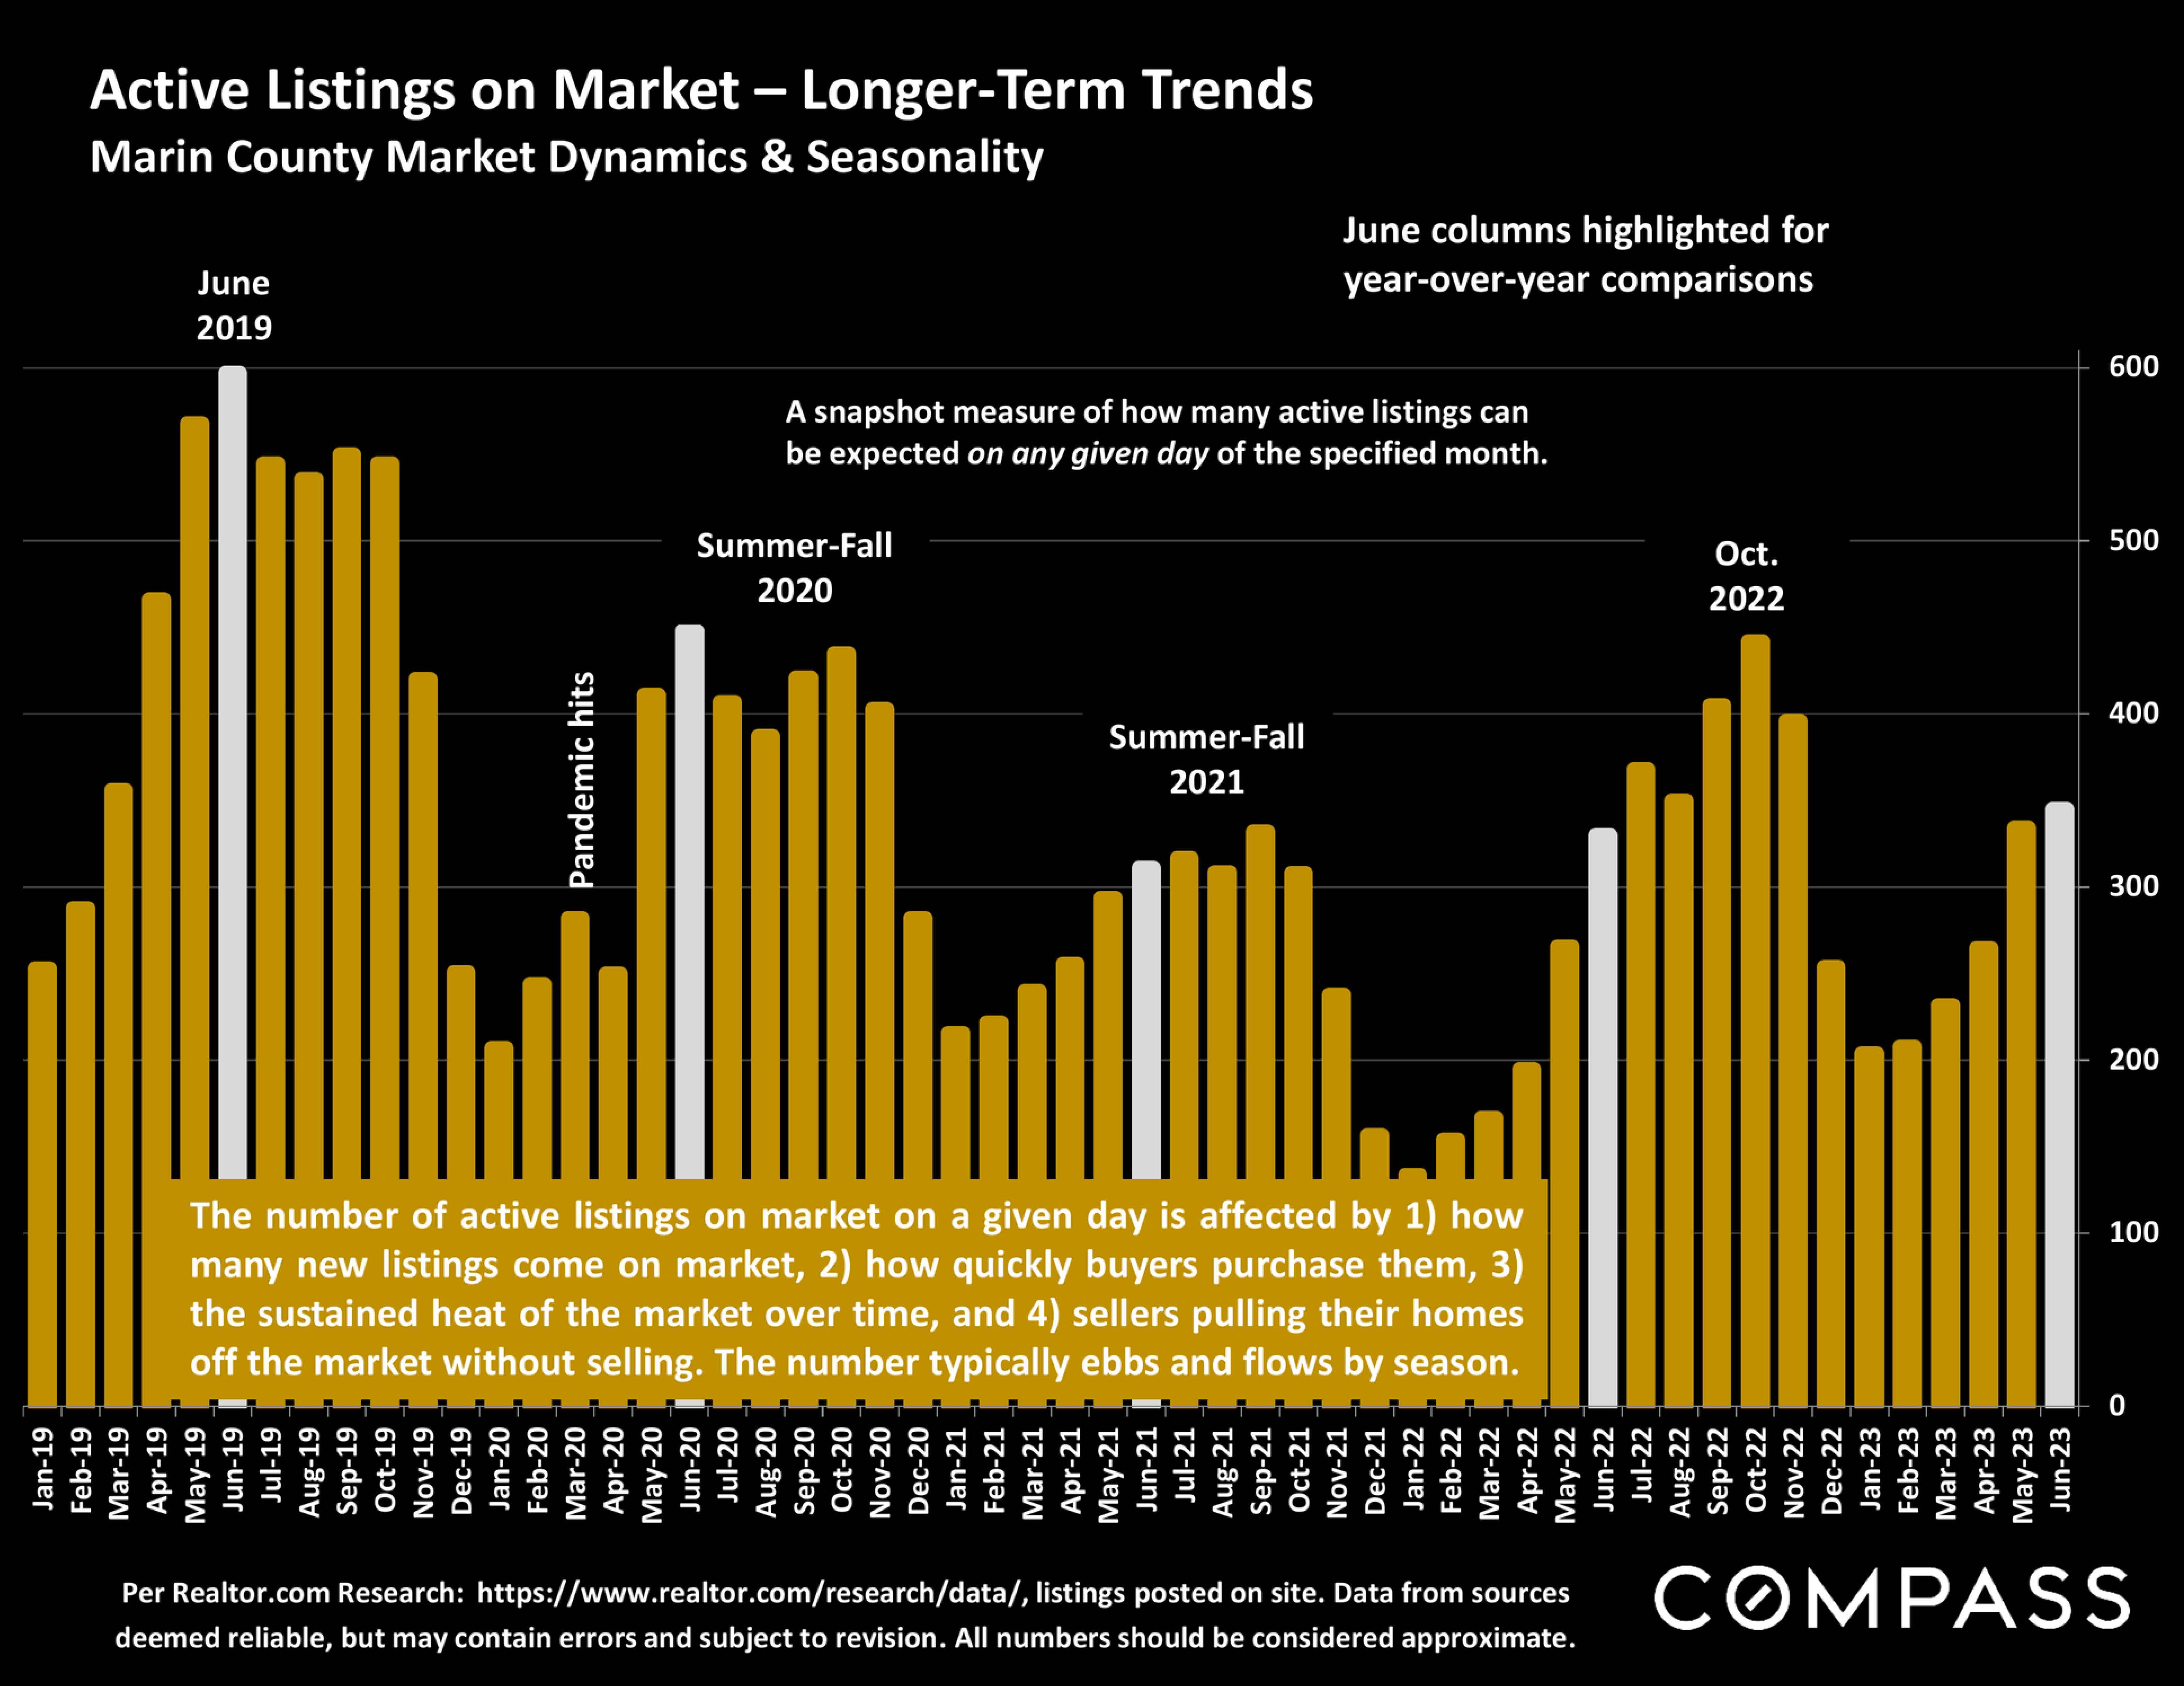
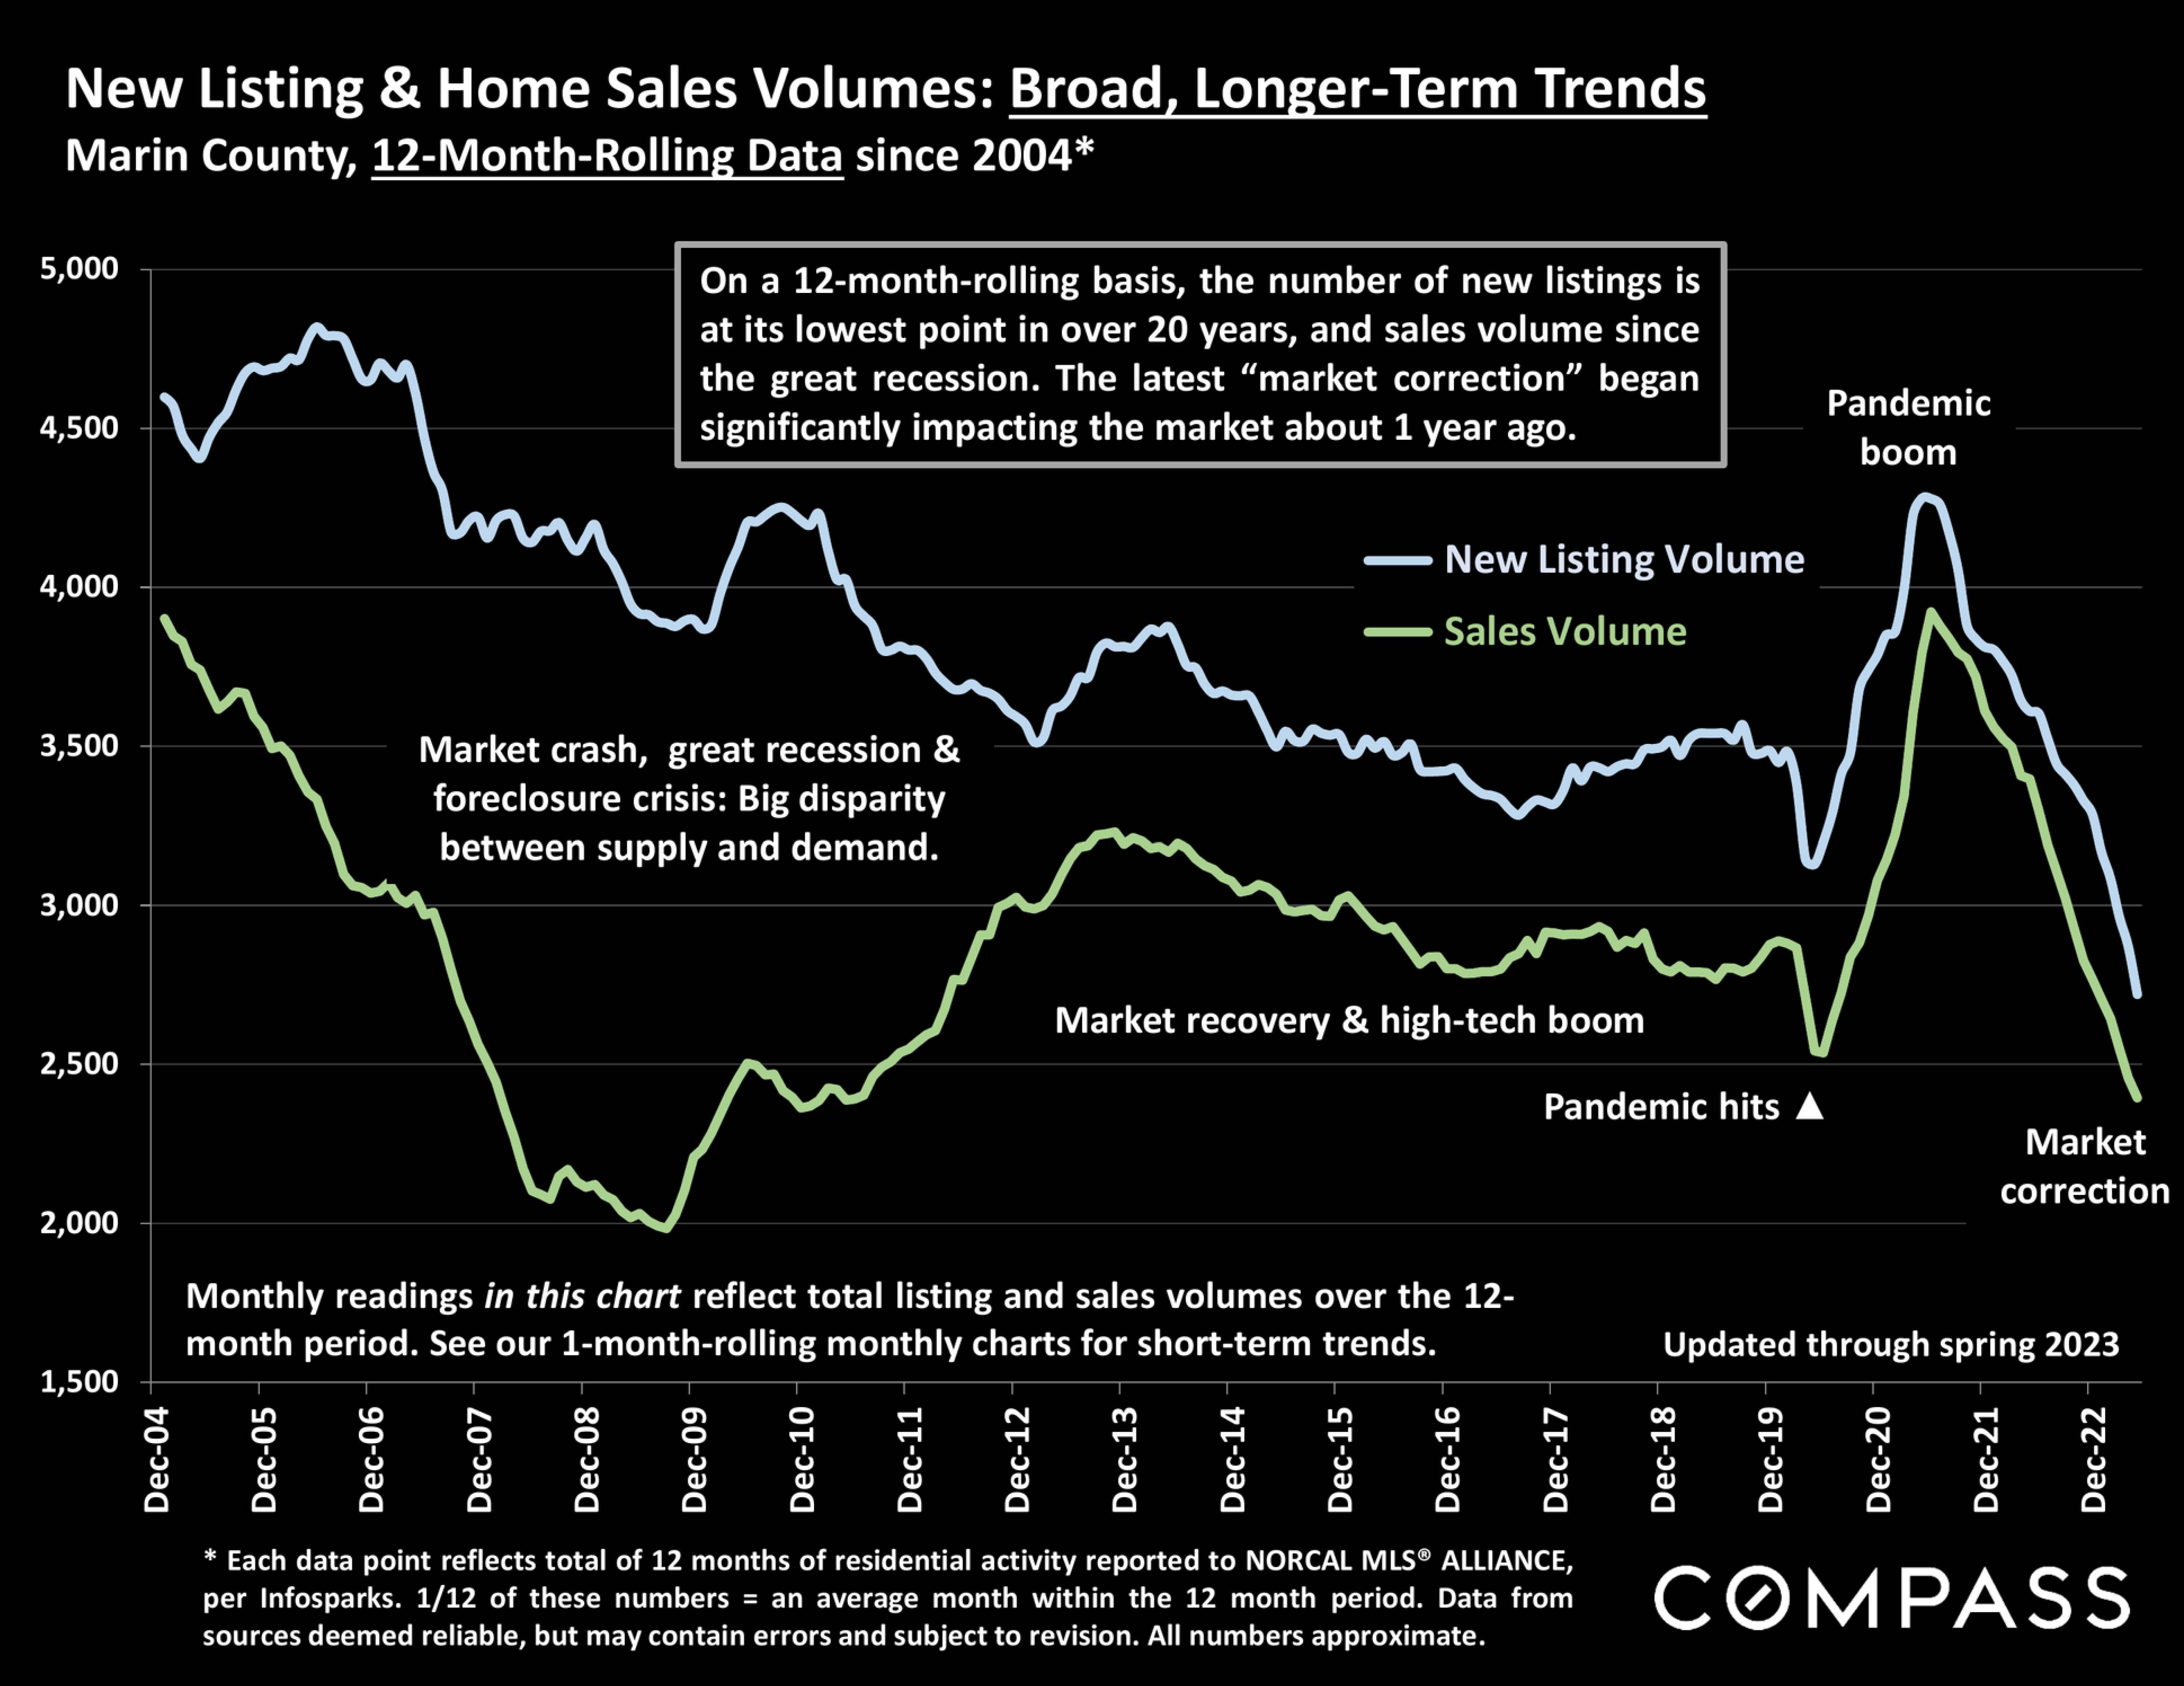
Underlying market and economic dynamics in 2023 have been a mixed bag of often contrary and volatile factors - including downward-trending inflation; interest rates bouncing between 6% and 7%; unceasing uncertainty regarding what the Fed will do next; substantial rebounds in stock markets; bank, commercial real estate and debt-default crises; international political, economic and military conflicts; high-tech layoffs amid generally strong employment statistics; and a robust recovery in buyer demand, sales activity and home prices, but all 3 remaining significantly lower than the peak of the market in spring 2022. Perhaps the biggest wild card has been severely depressed new-listing activity as potential sellers have held back - ascribed to the "mortgage lockin effect" - which not only artificially constrained the number of sales, but put upward pressure on prices as buyers, once again, competed for an inadequate supply of homes for sale.
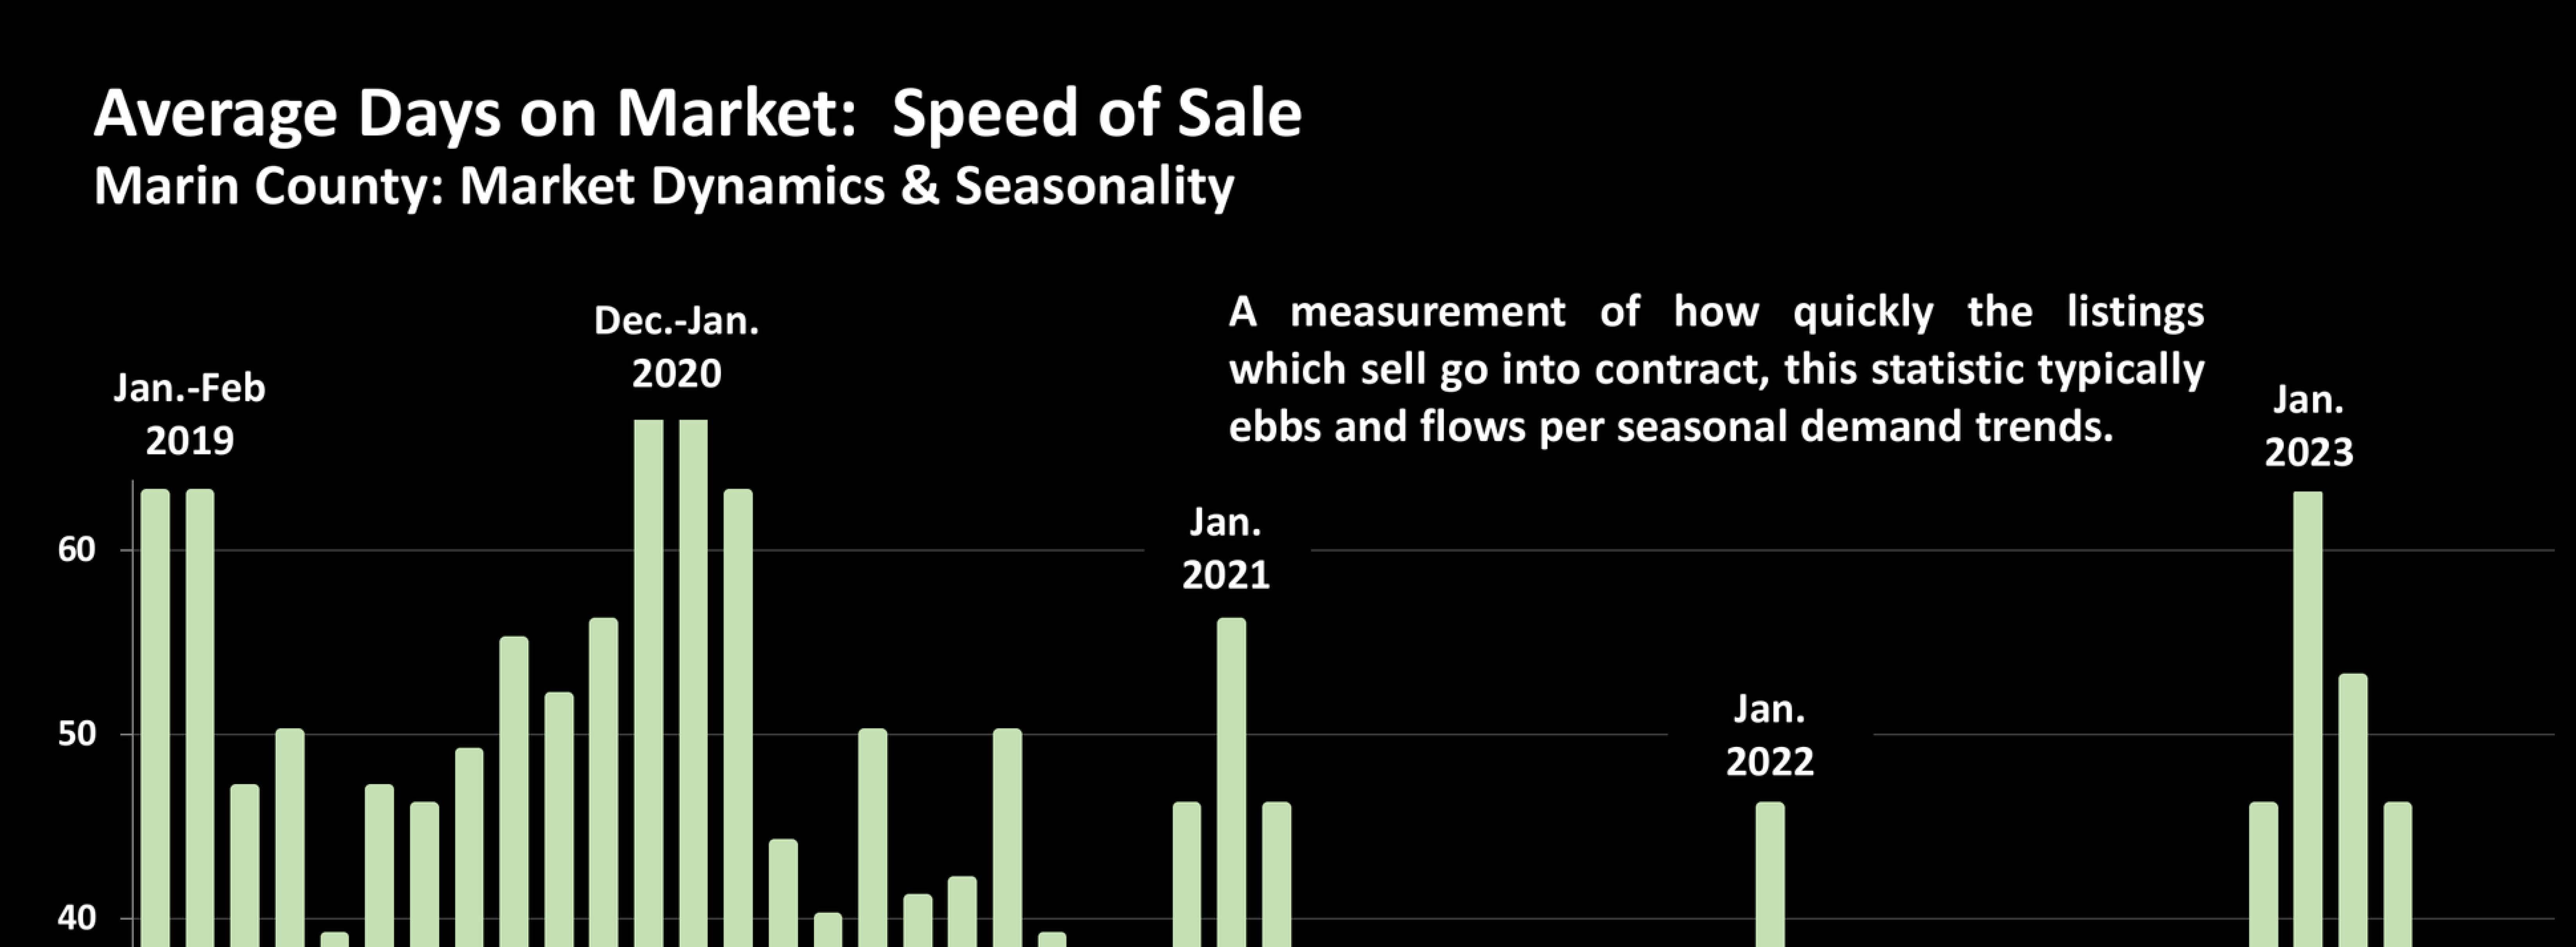
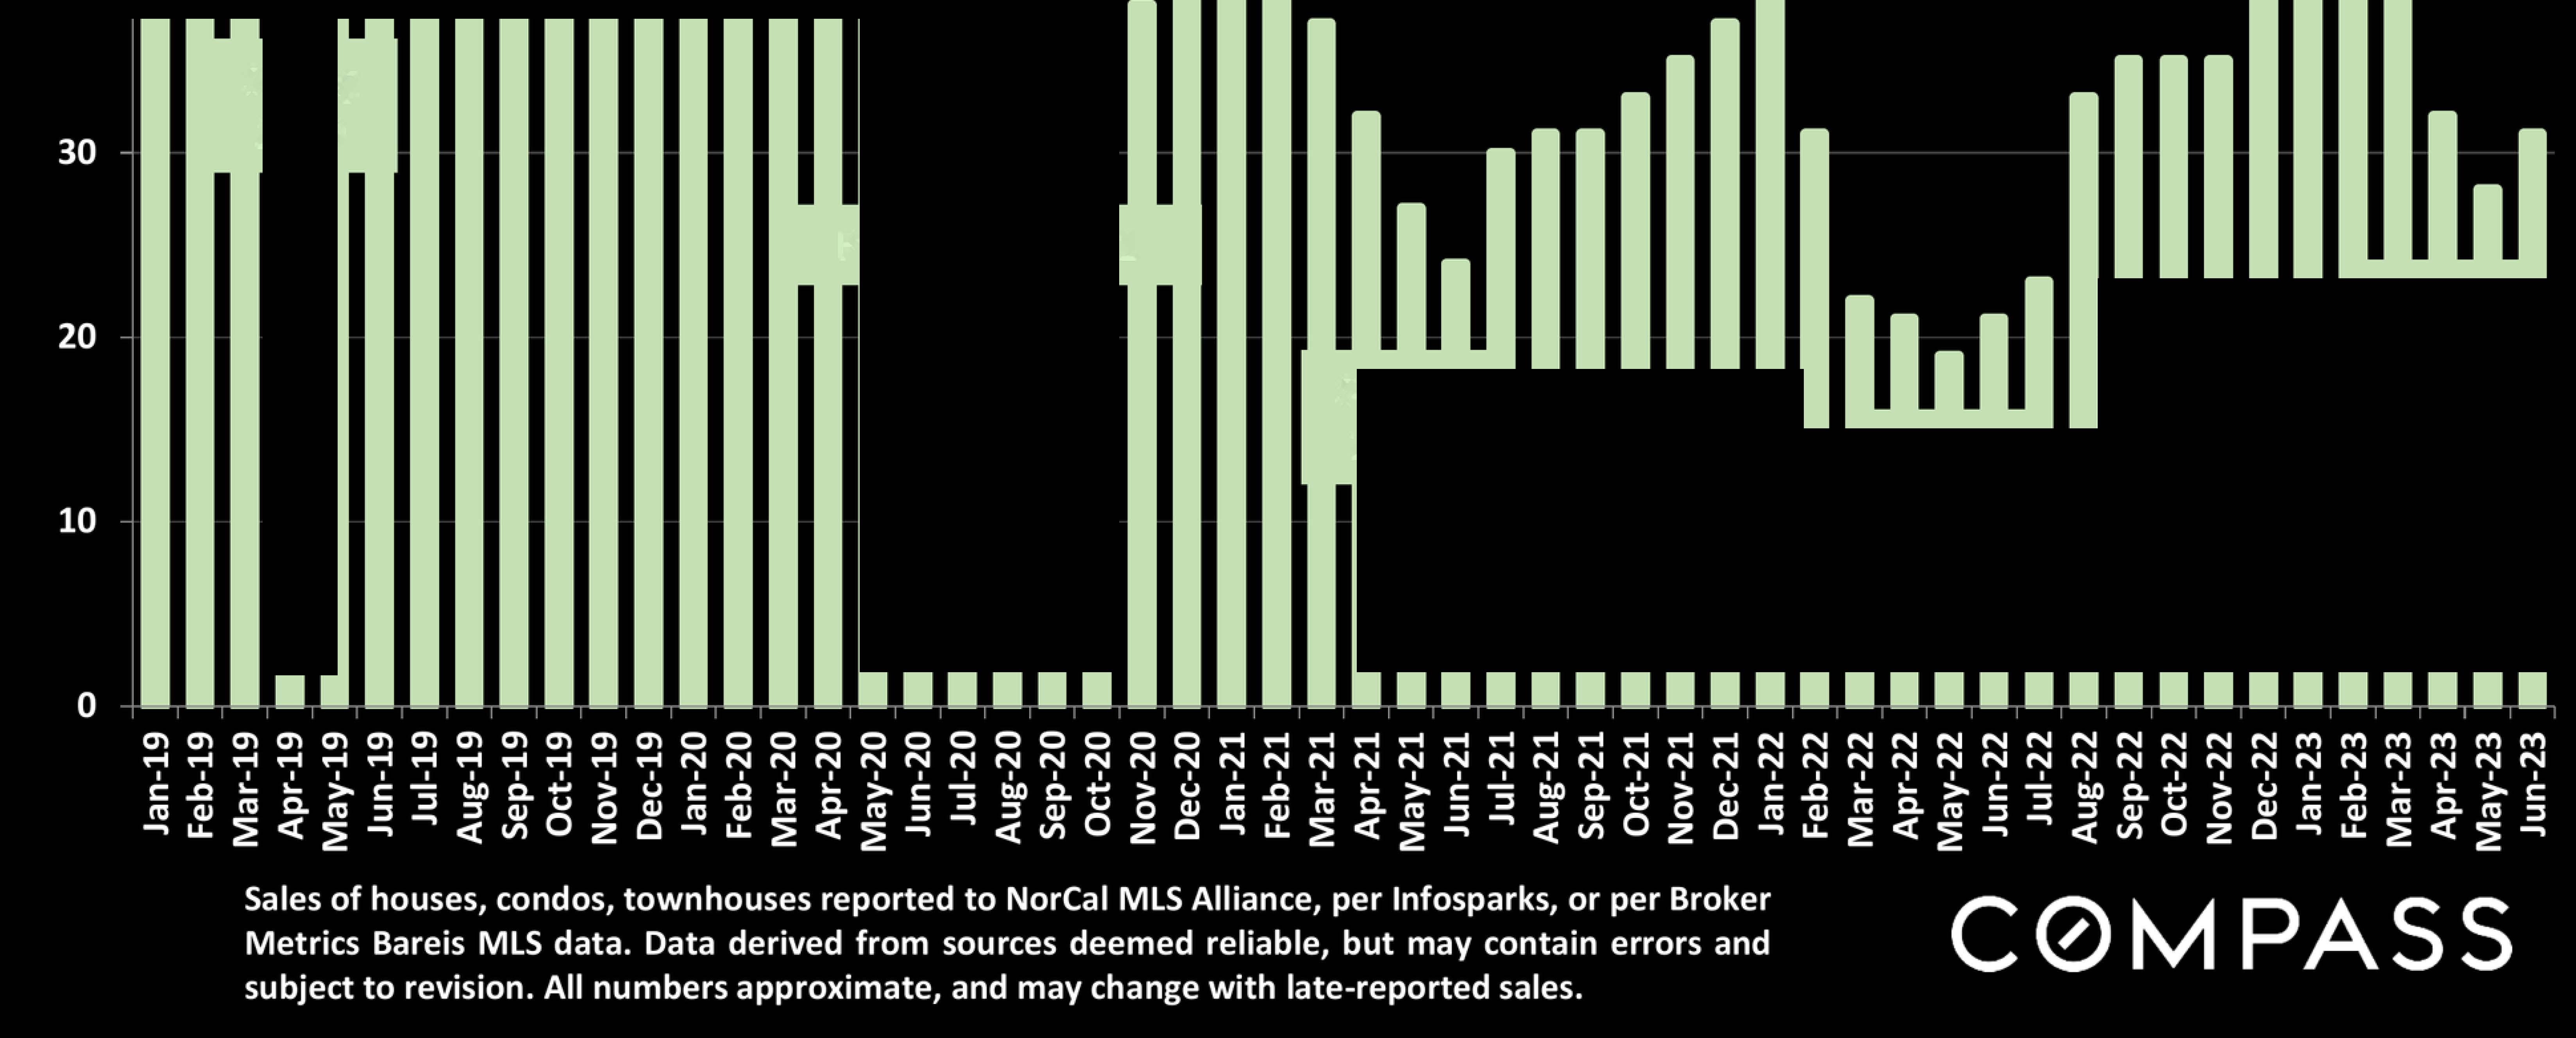
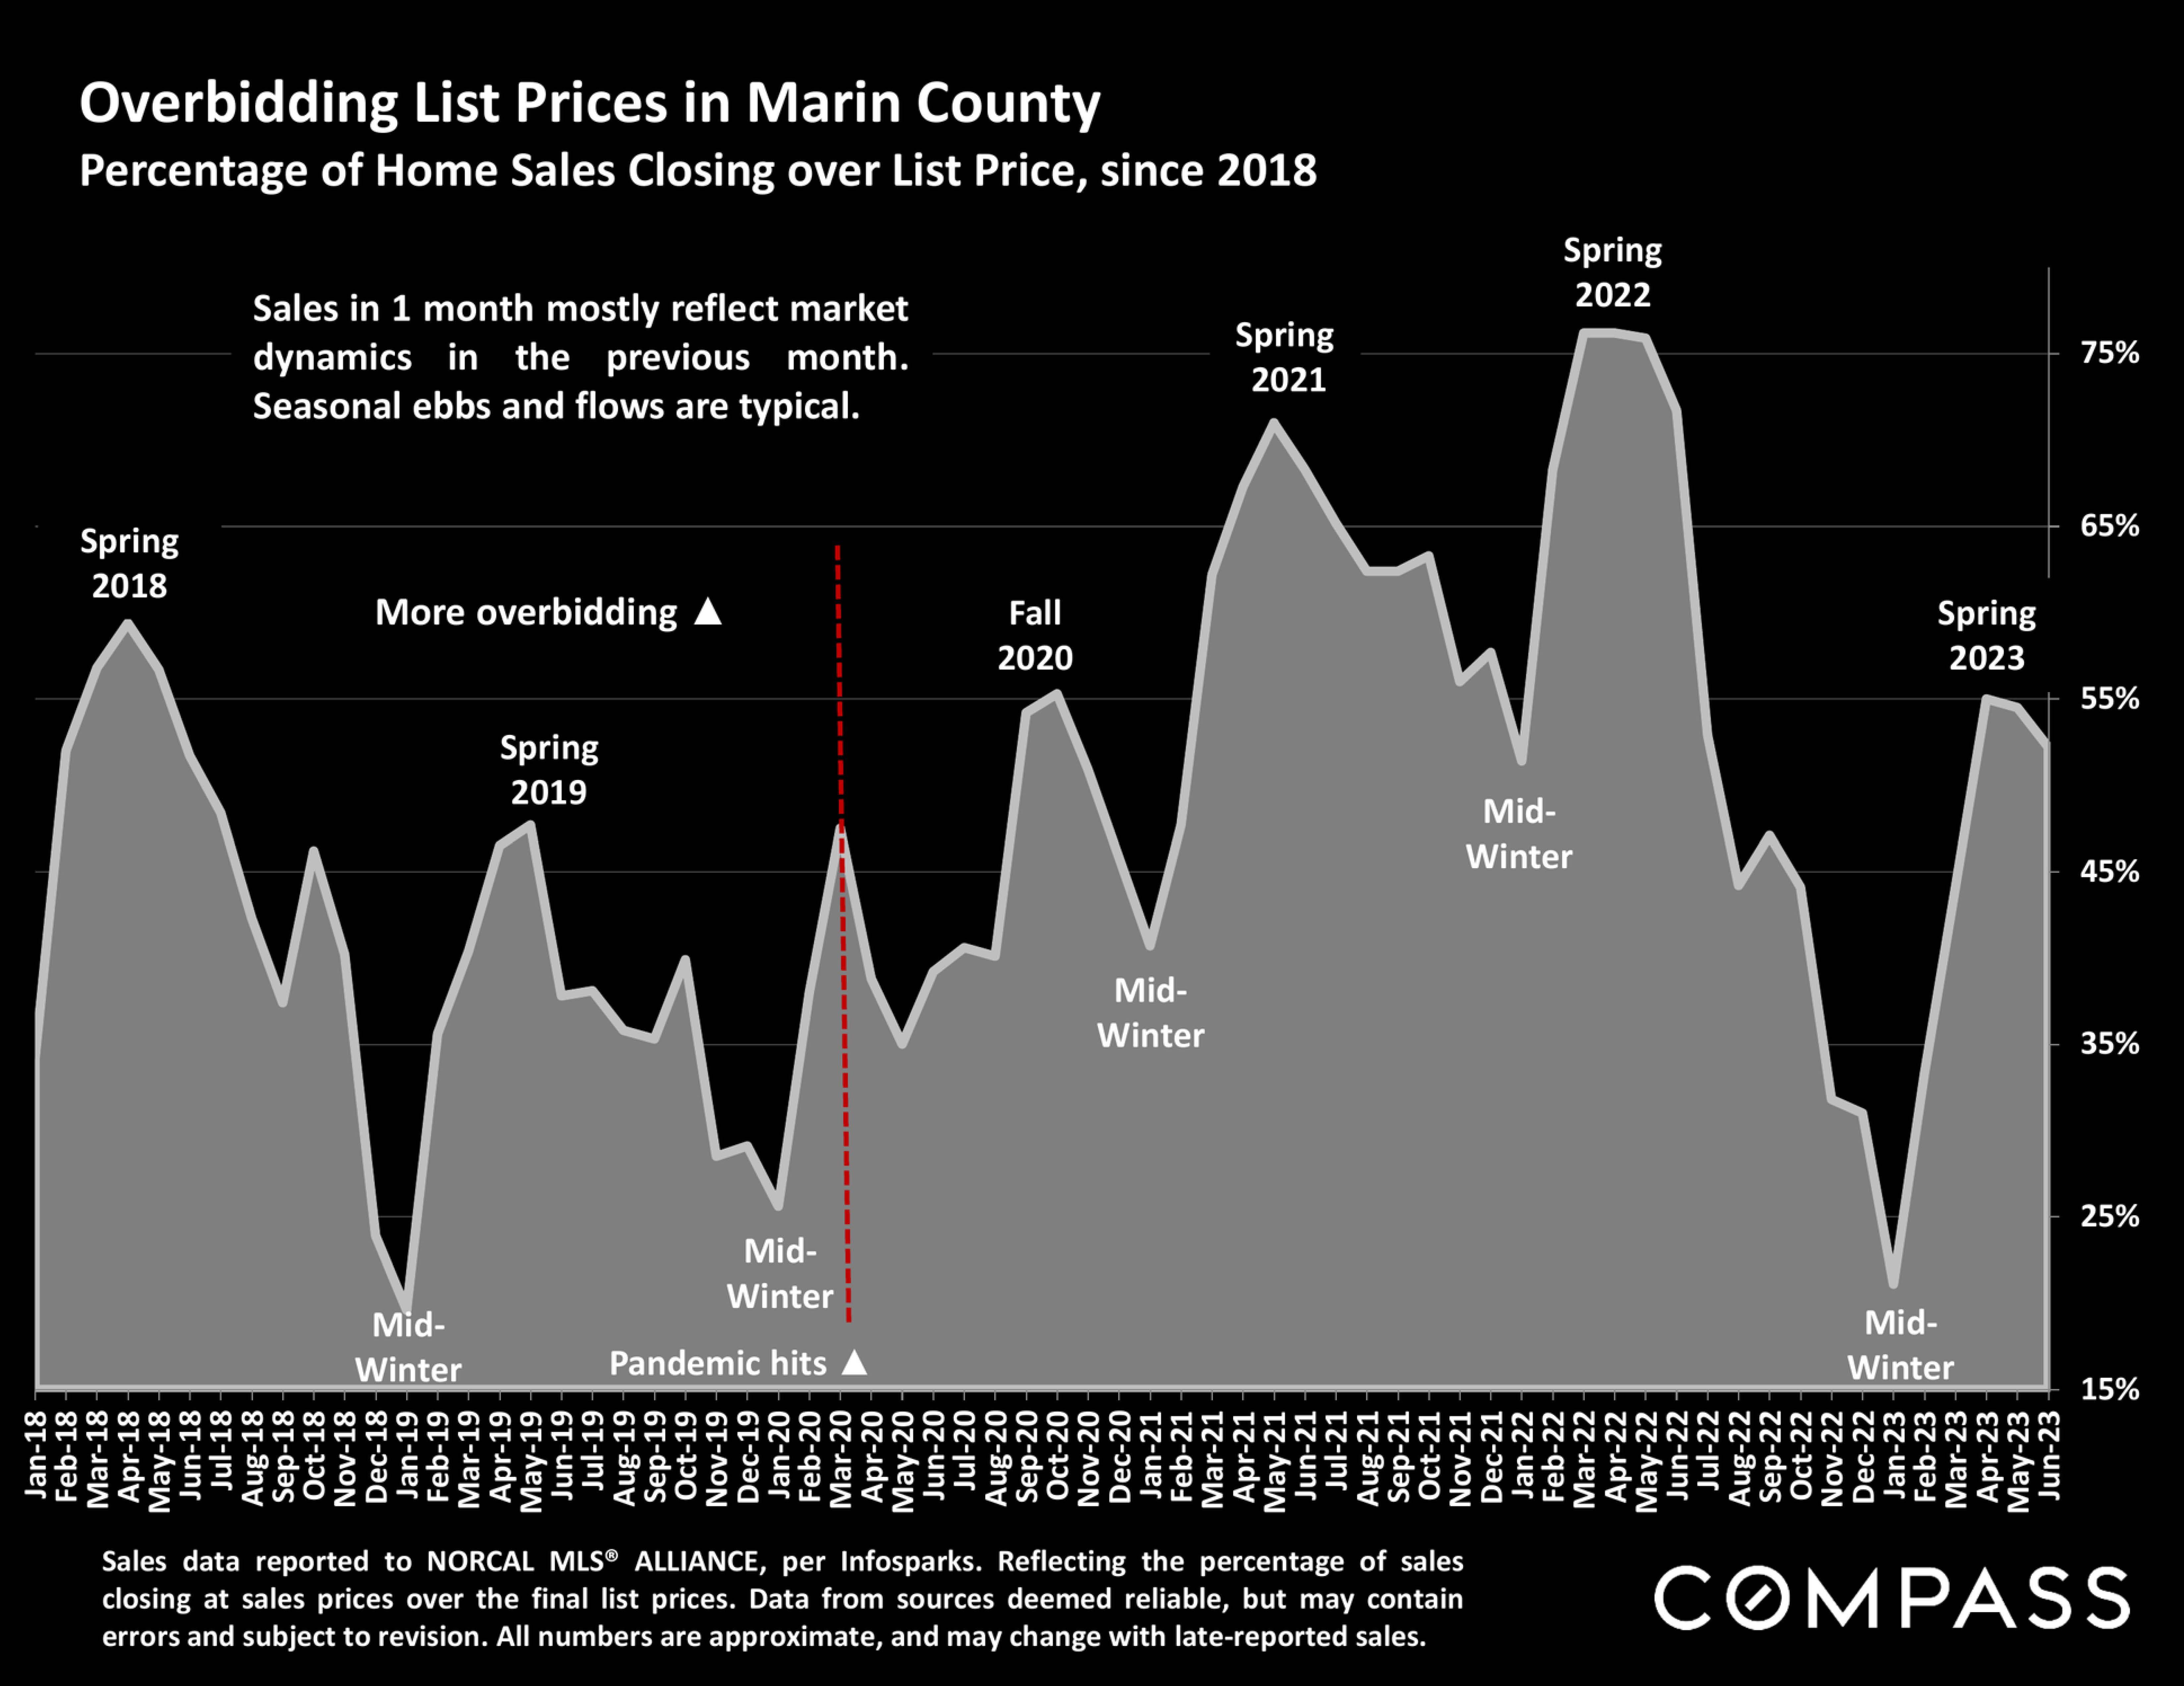
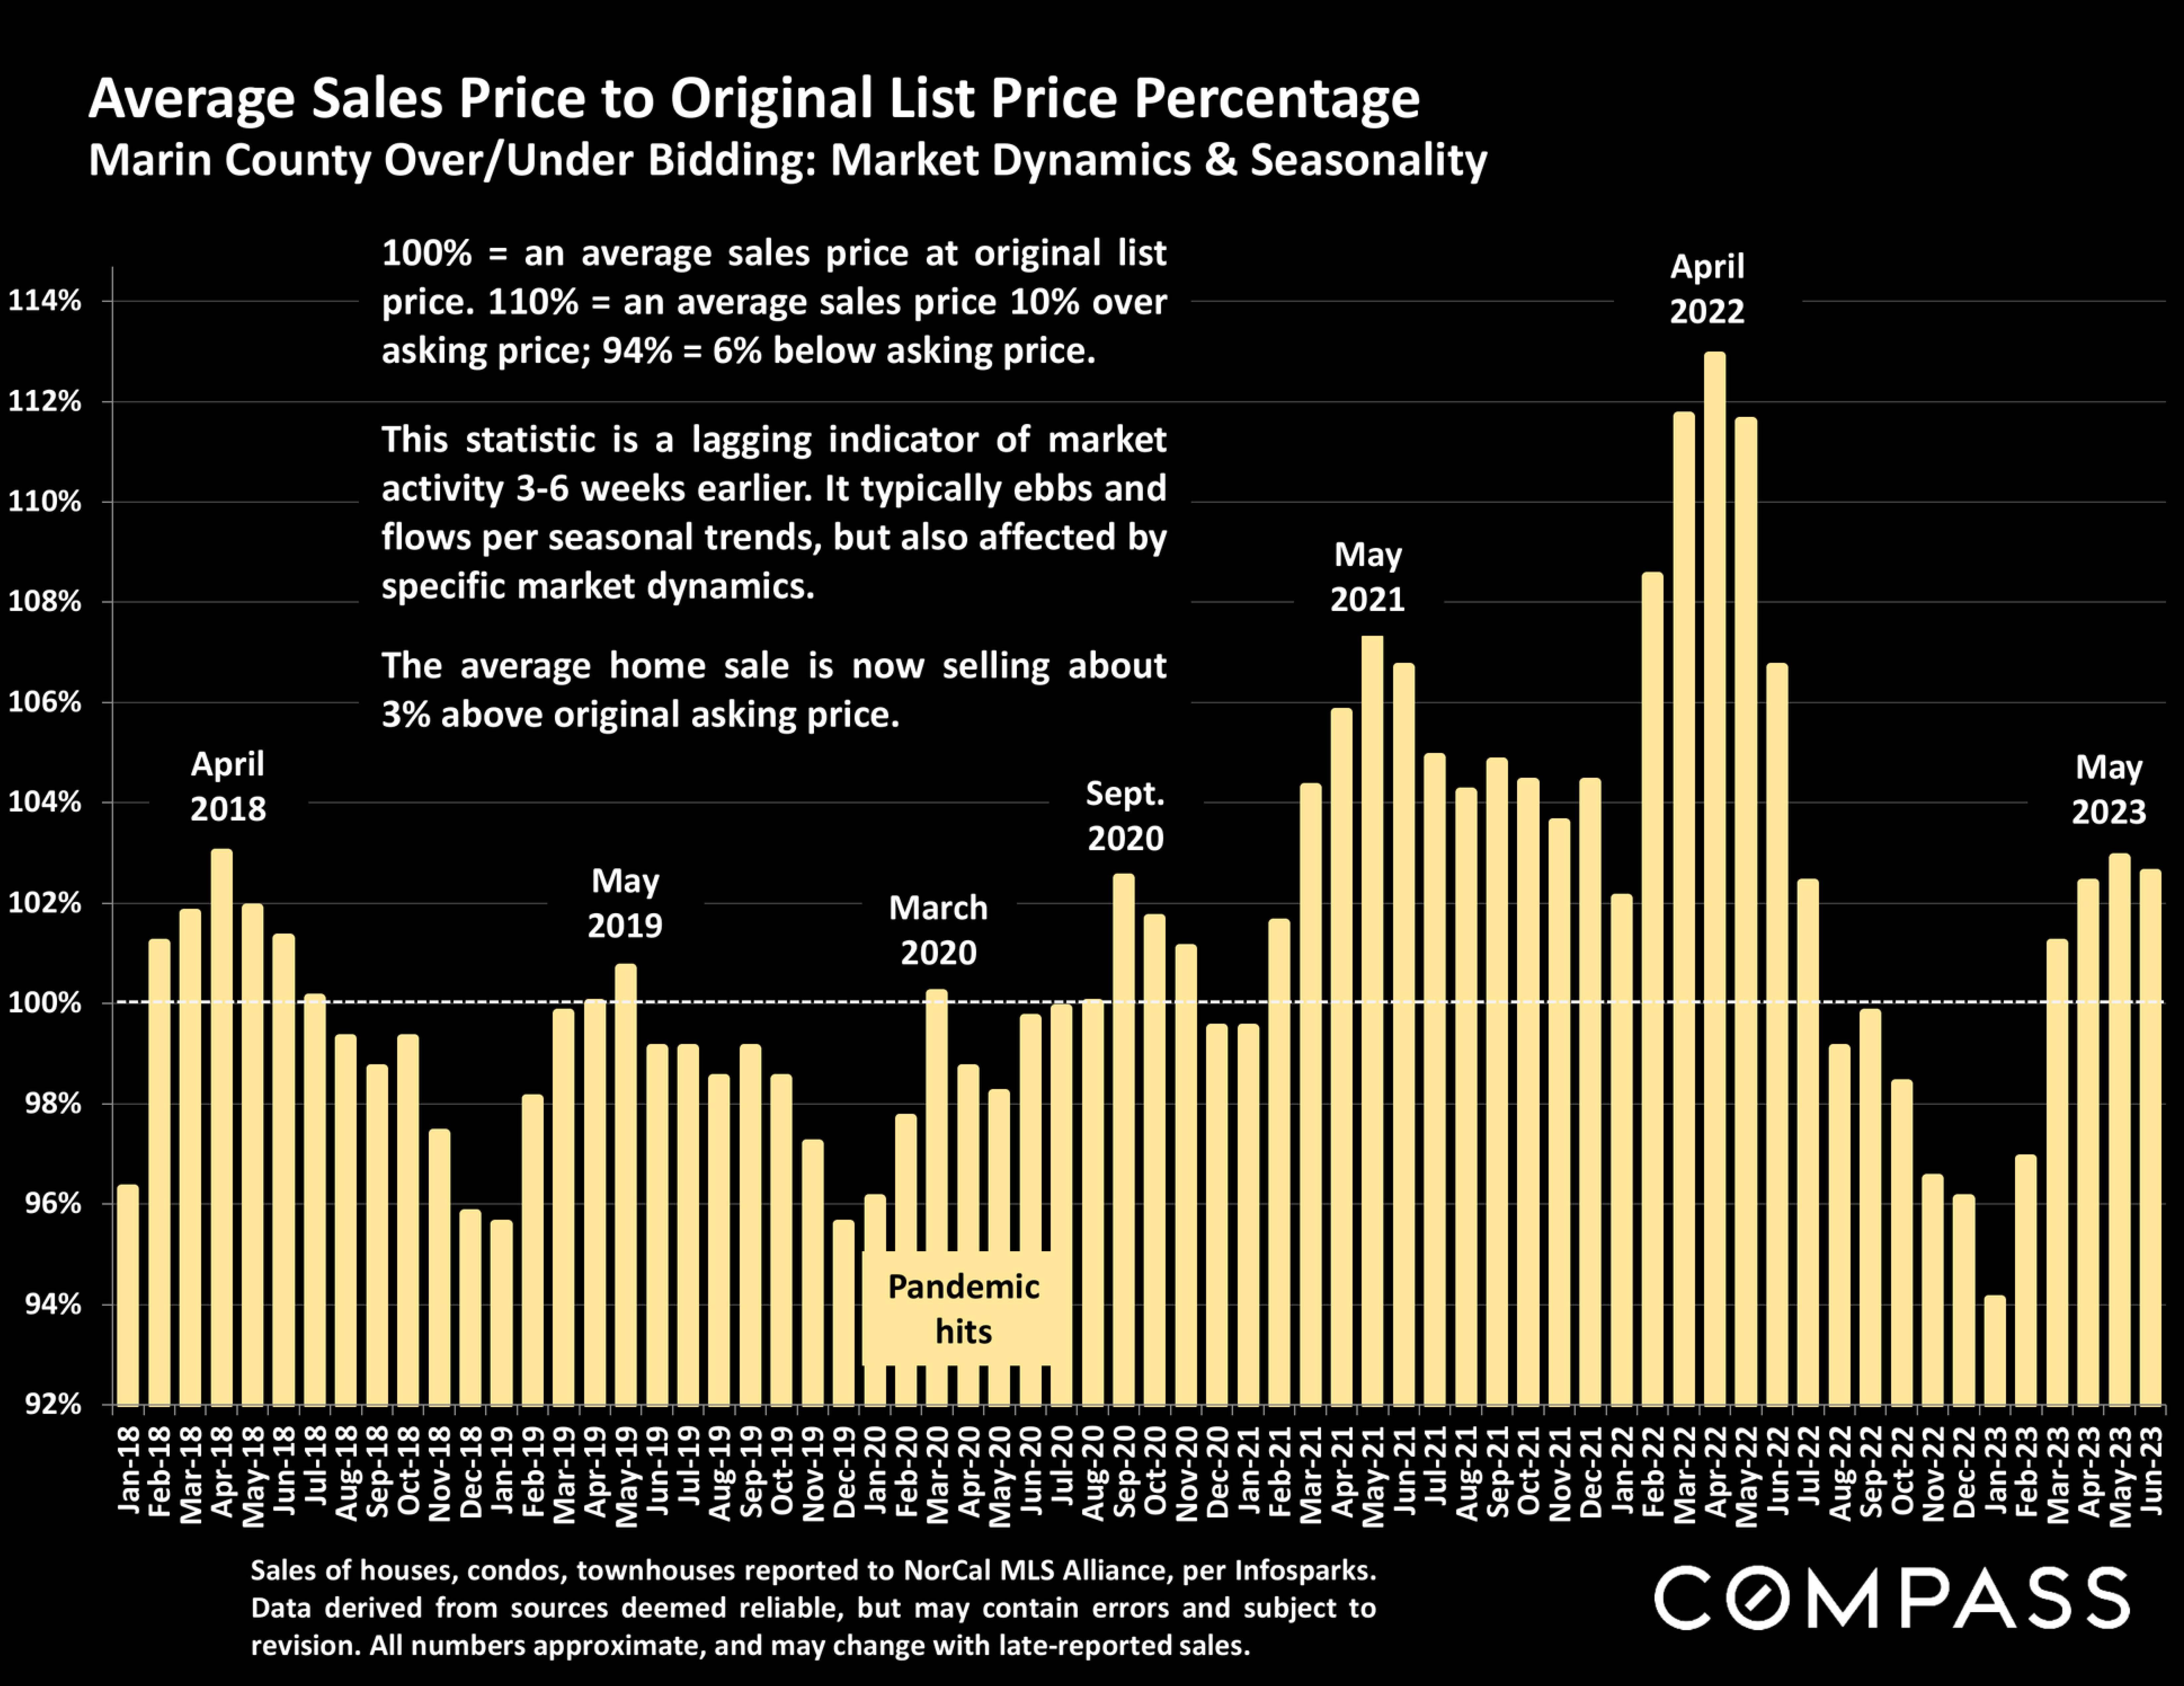
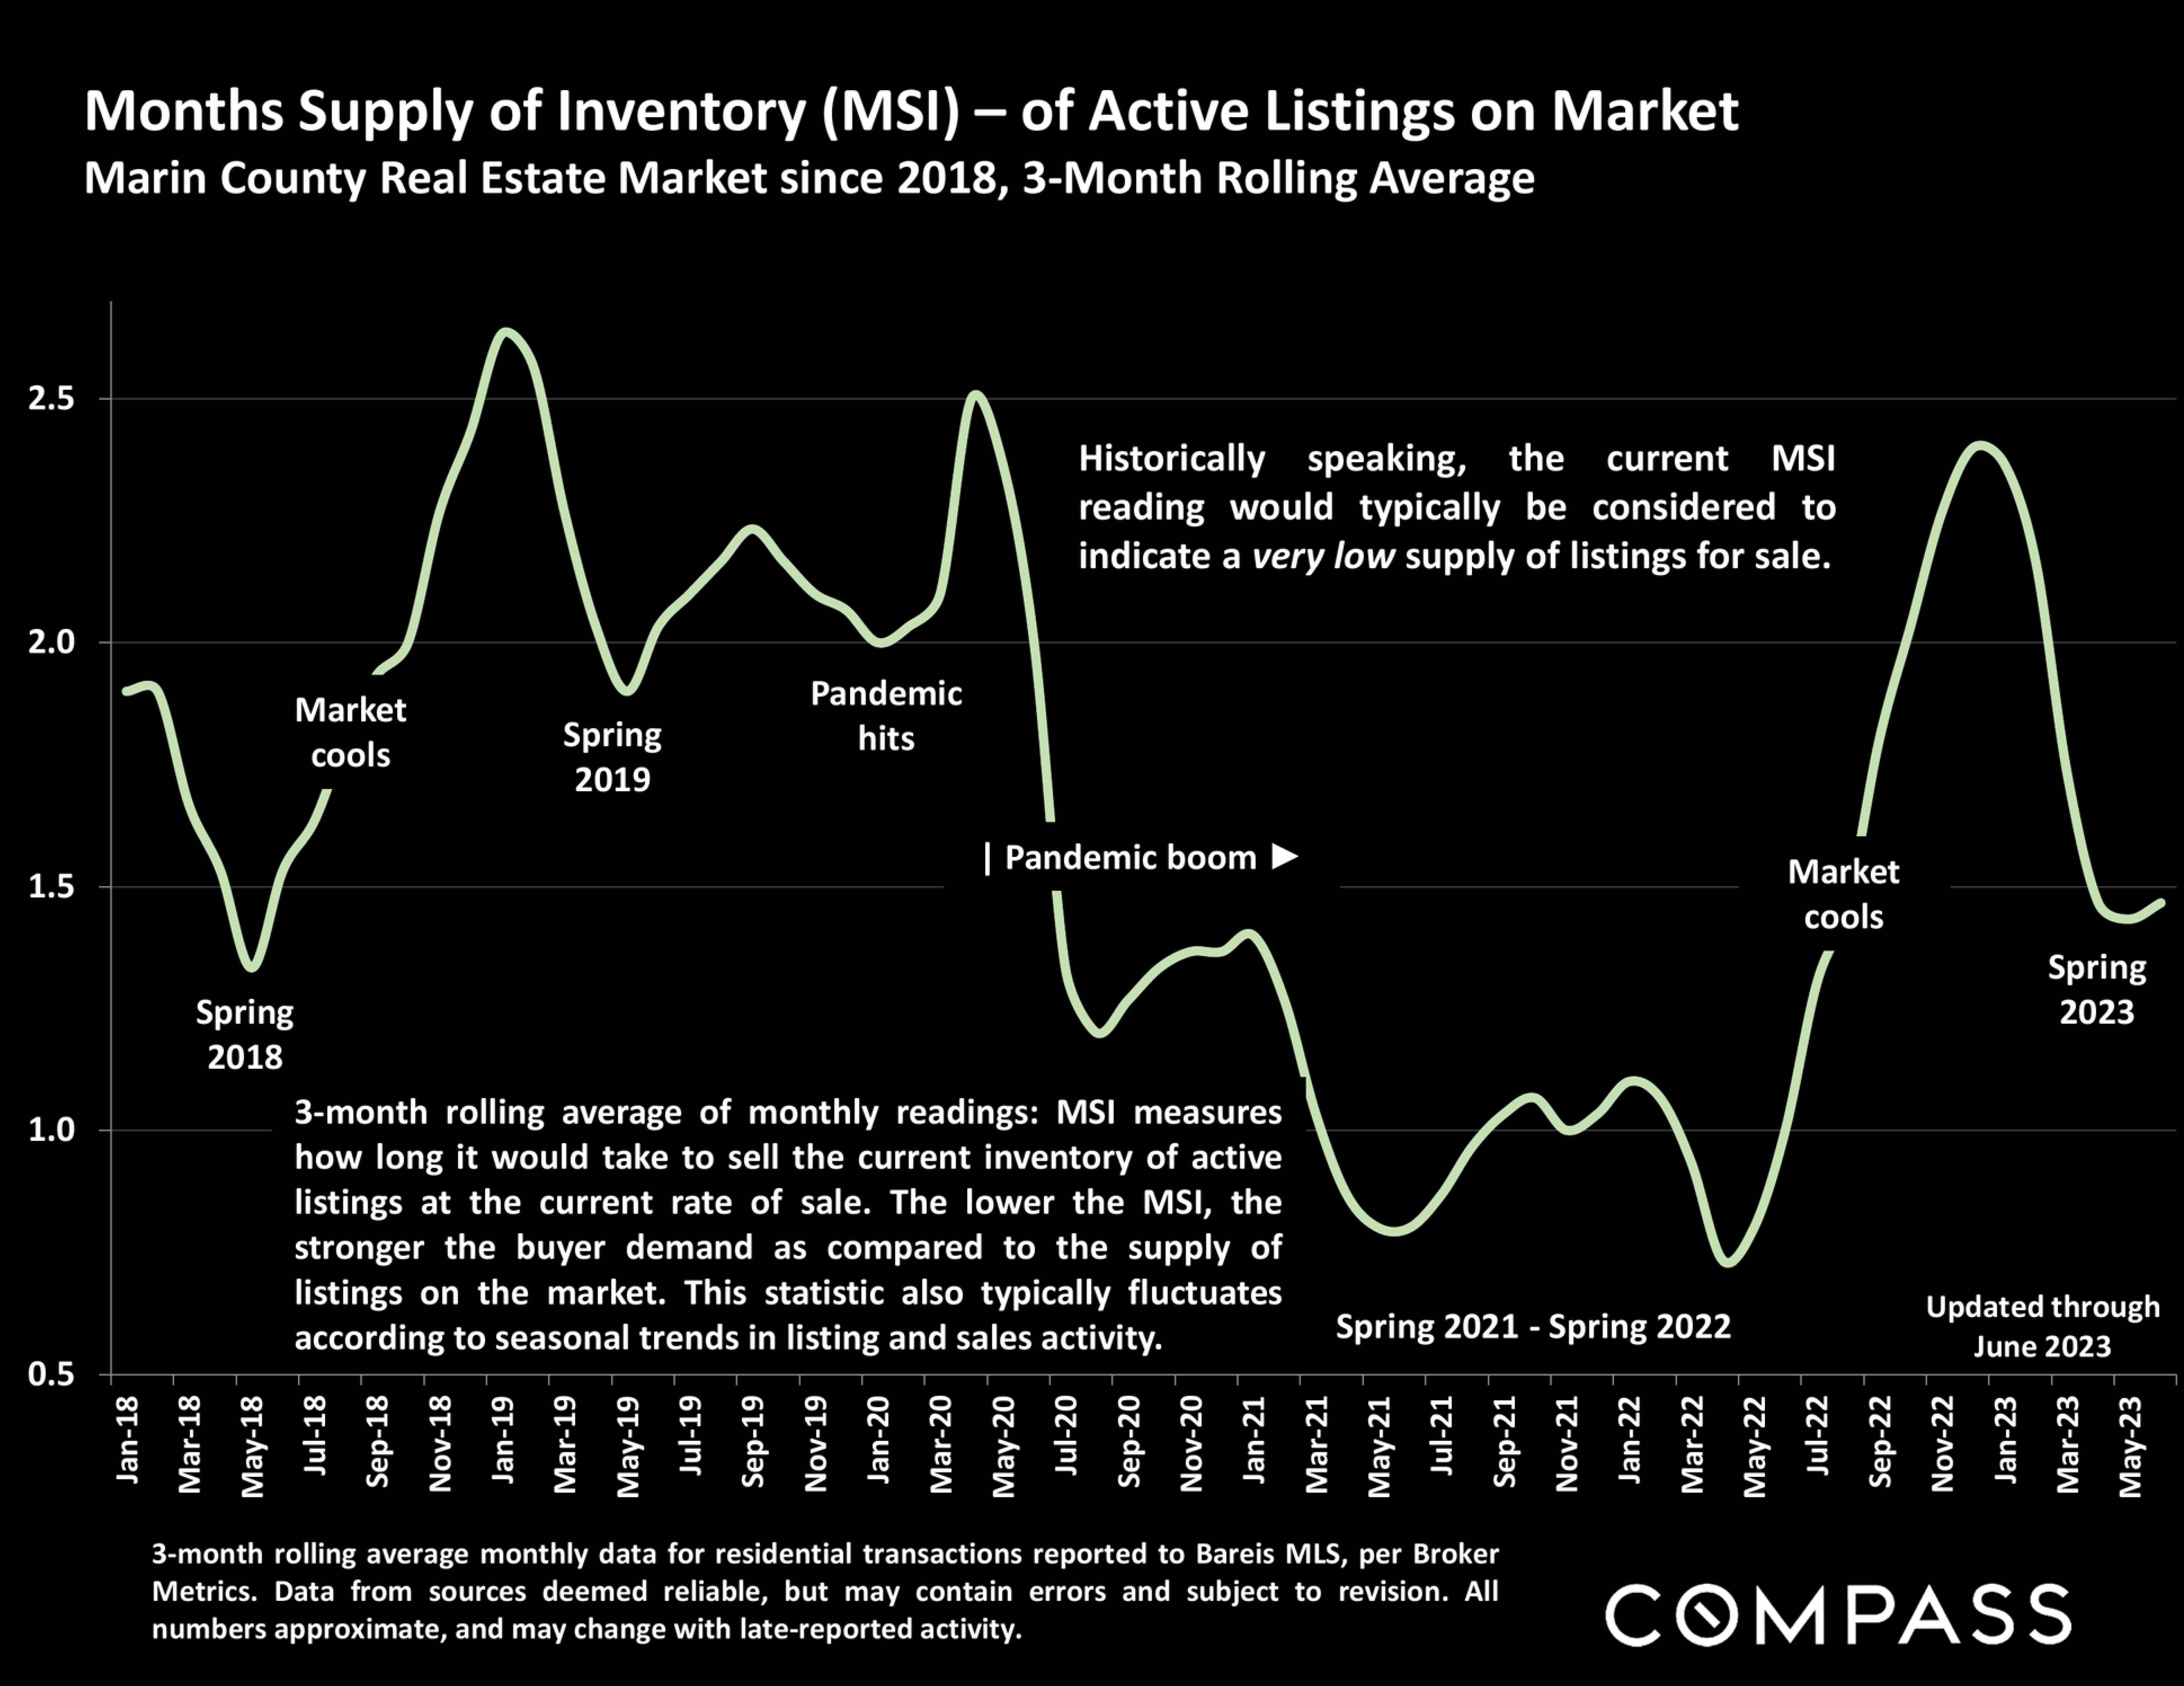
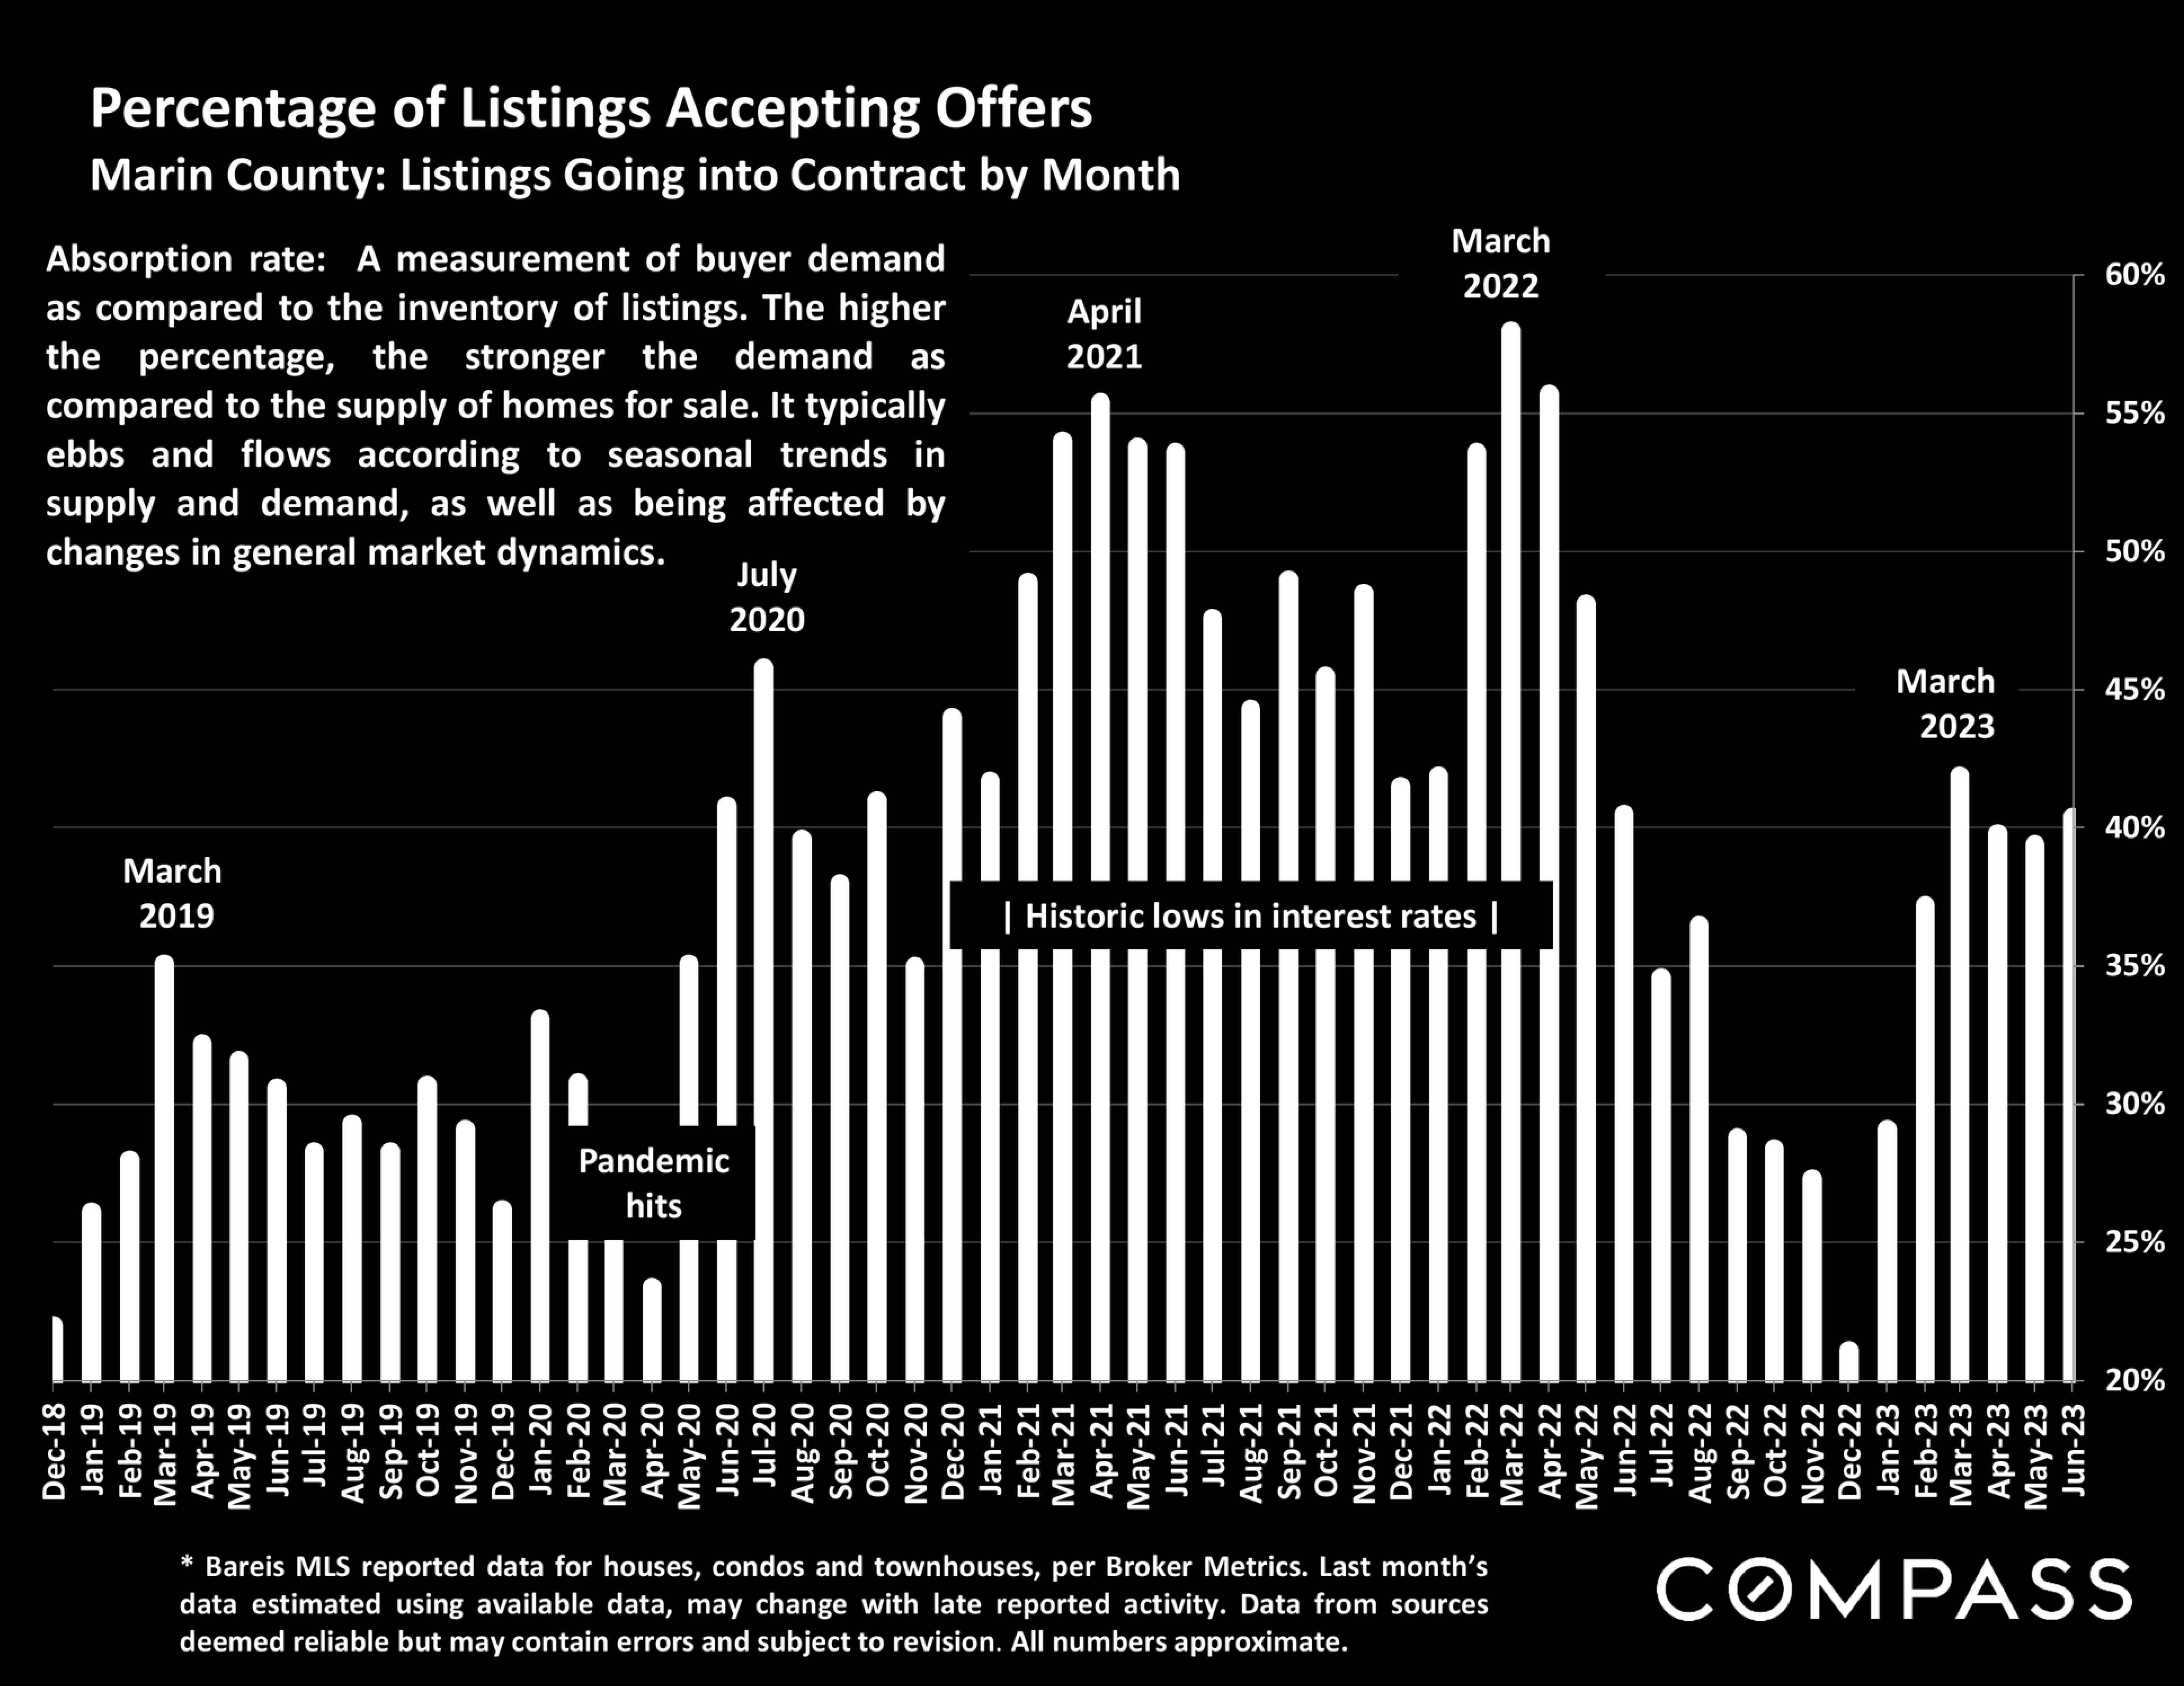
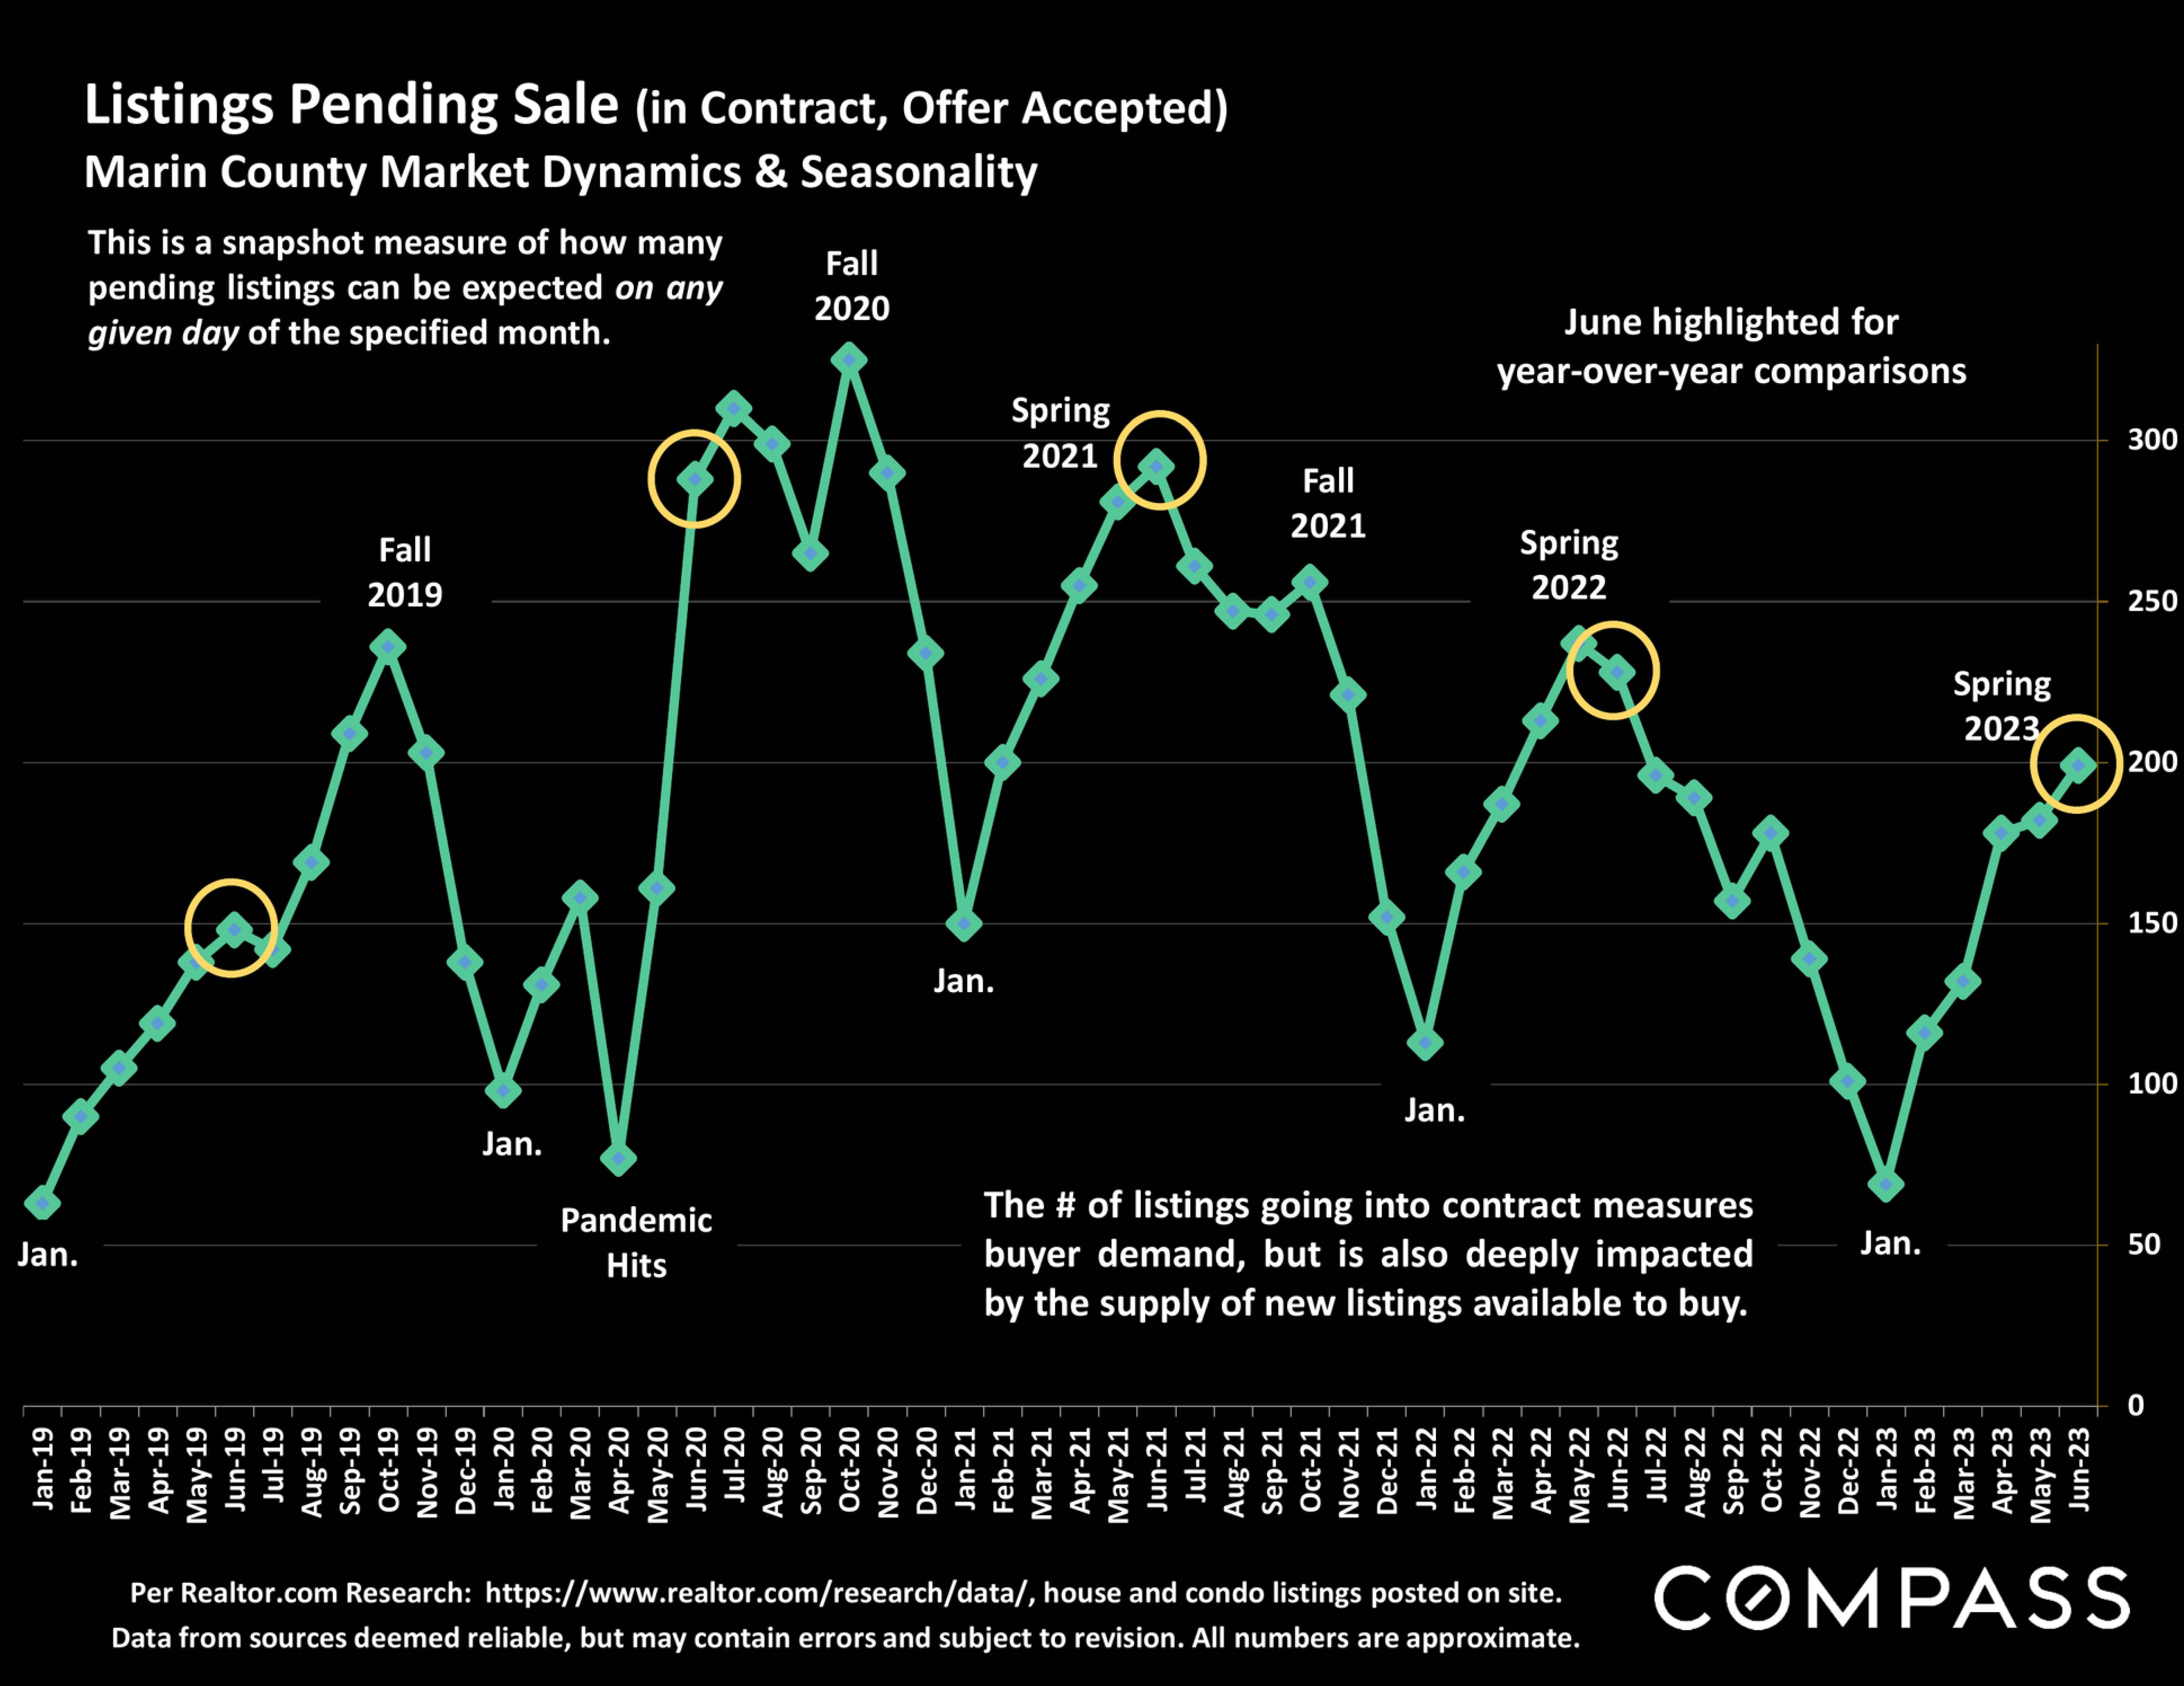
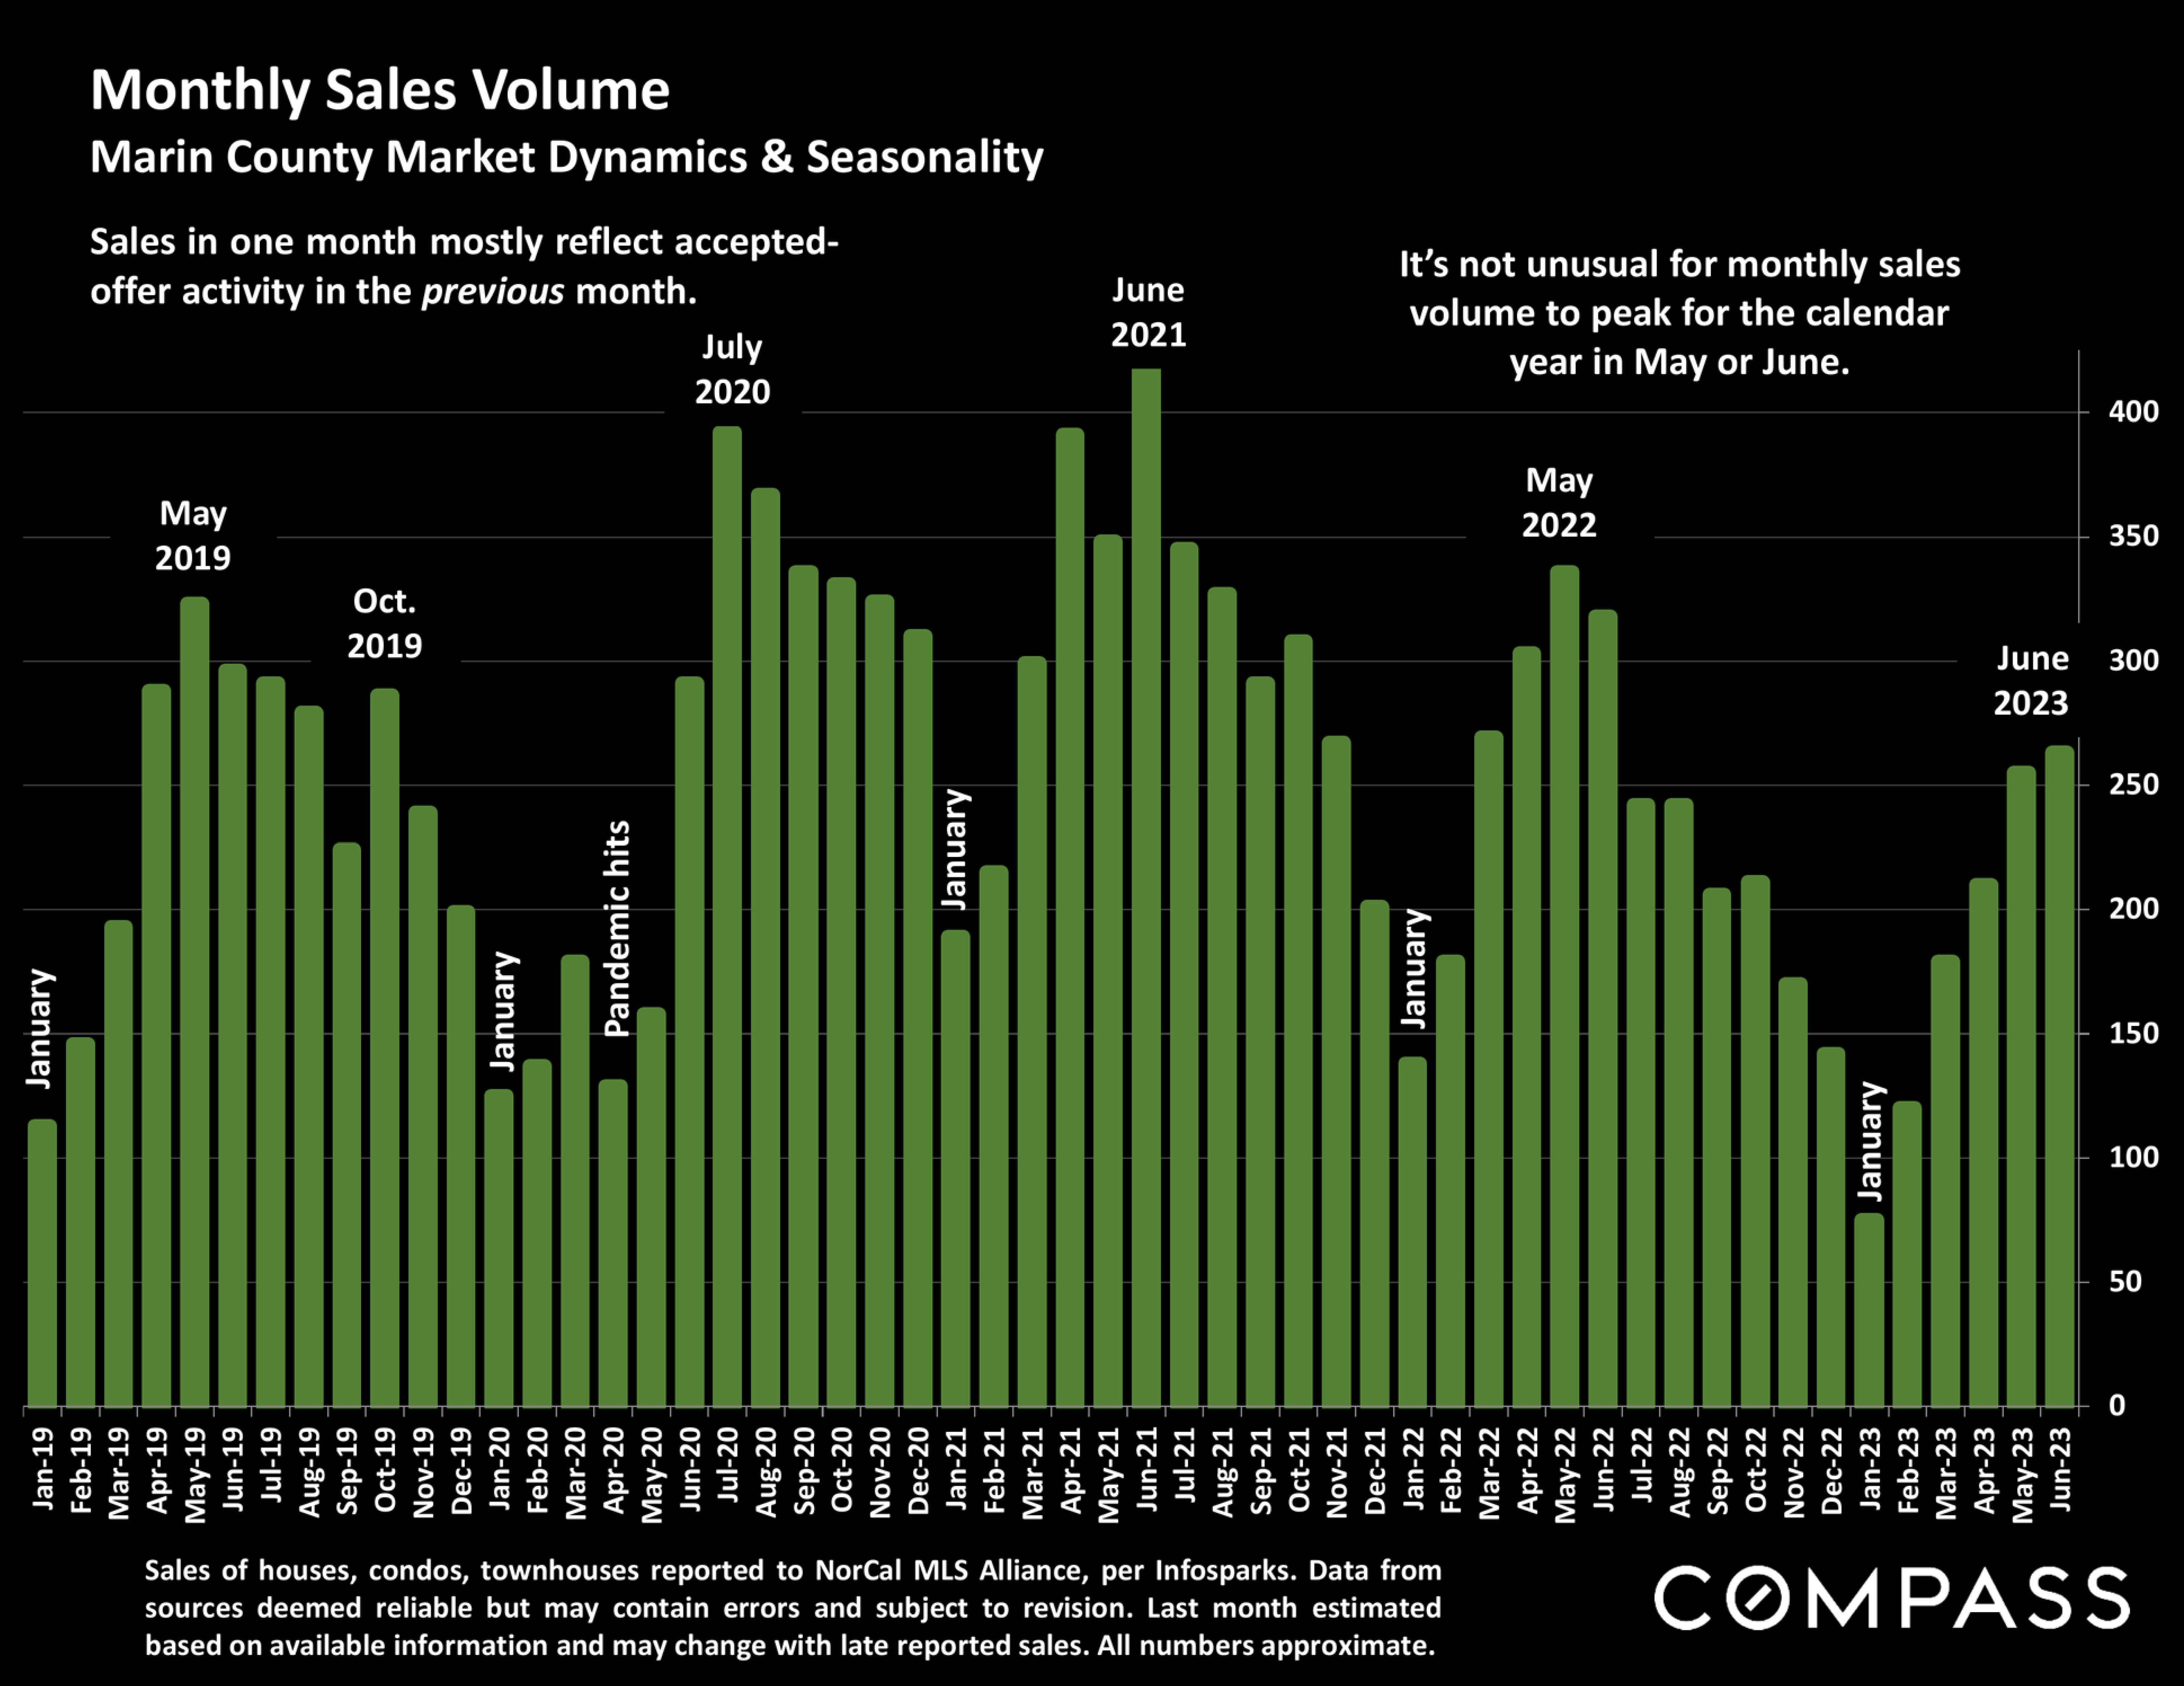
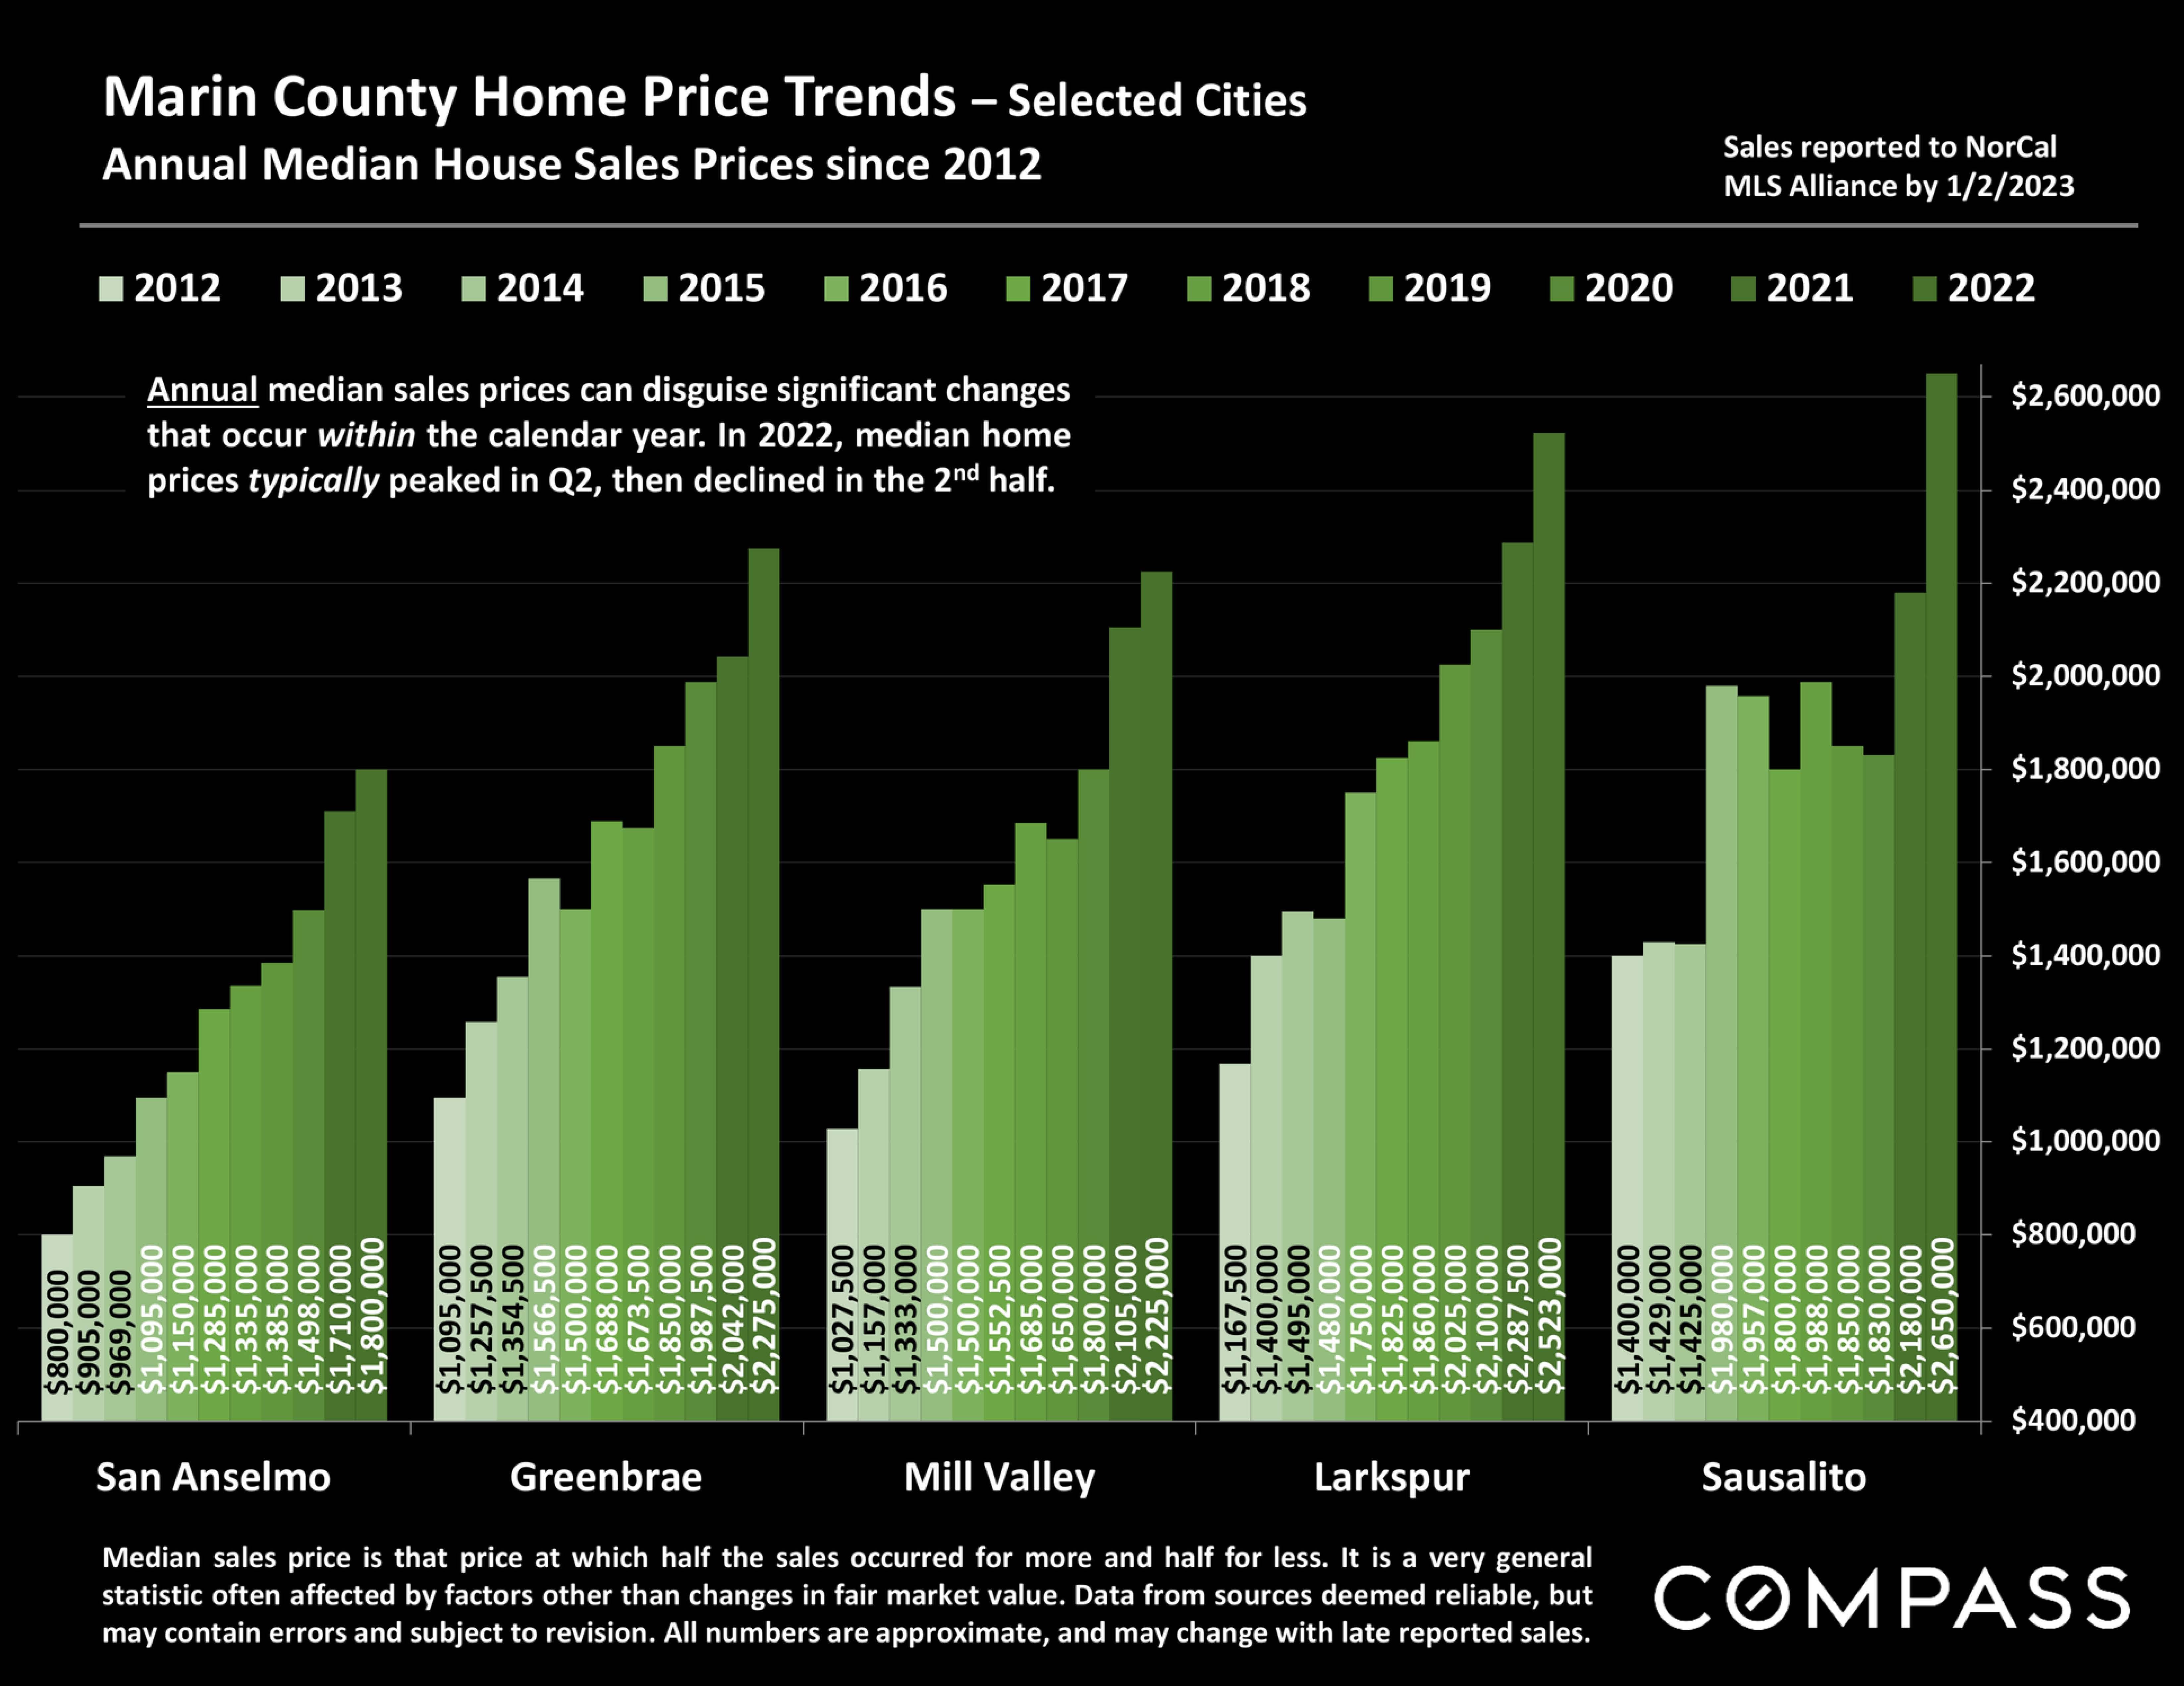
Ultimately, the market is defined by neitherjust demand nor supply, but by the balance between the two. As we've moved dee er into 2023 that balance has tilted increasin I to sellers' advanta e with homes sellin faster with more offers for hi her rices. Part of this is due to seasonal dynamics - spring is commonly the highest-demand, most active selling season of the year - but the contrast with the 2nd half of 2022, when demand and sales plunged, is more than seasonal. It also reflects a rebound in psychology, with many buyers clearly deciding to move forward with their life plans.
For most Bay Area markets, summer has historically been a slower period after spring - with some regions seeing a relatively short {6 to 8 week) spike up in activity in autumn before the big midwinter slowdown - but typical seasonal trends have been upended a few times in recent years. Certainly, a substantial amount of buying and selling will continue to occur in coming months, as well as variations in underlying economic conditions, which we will cover in detail in future reports.
C0MPASS


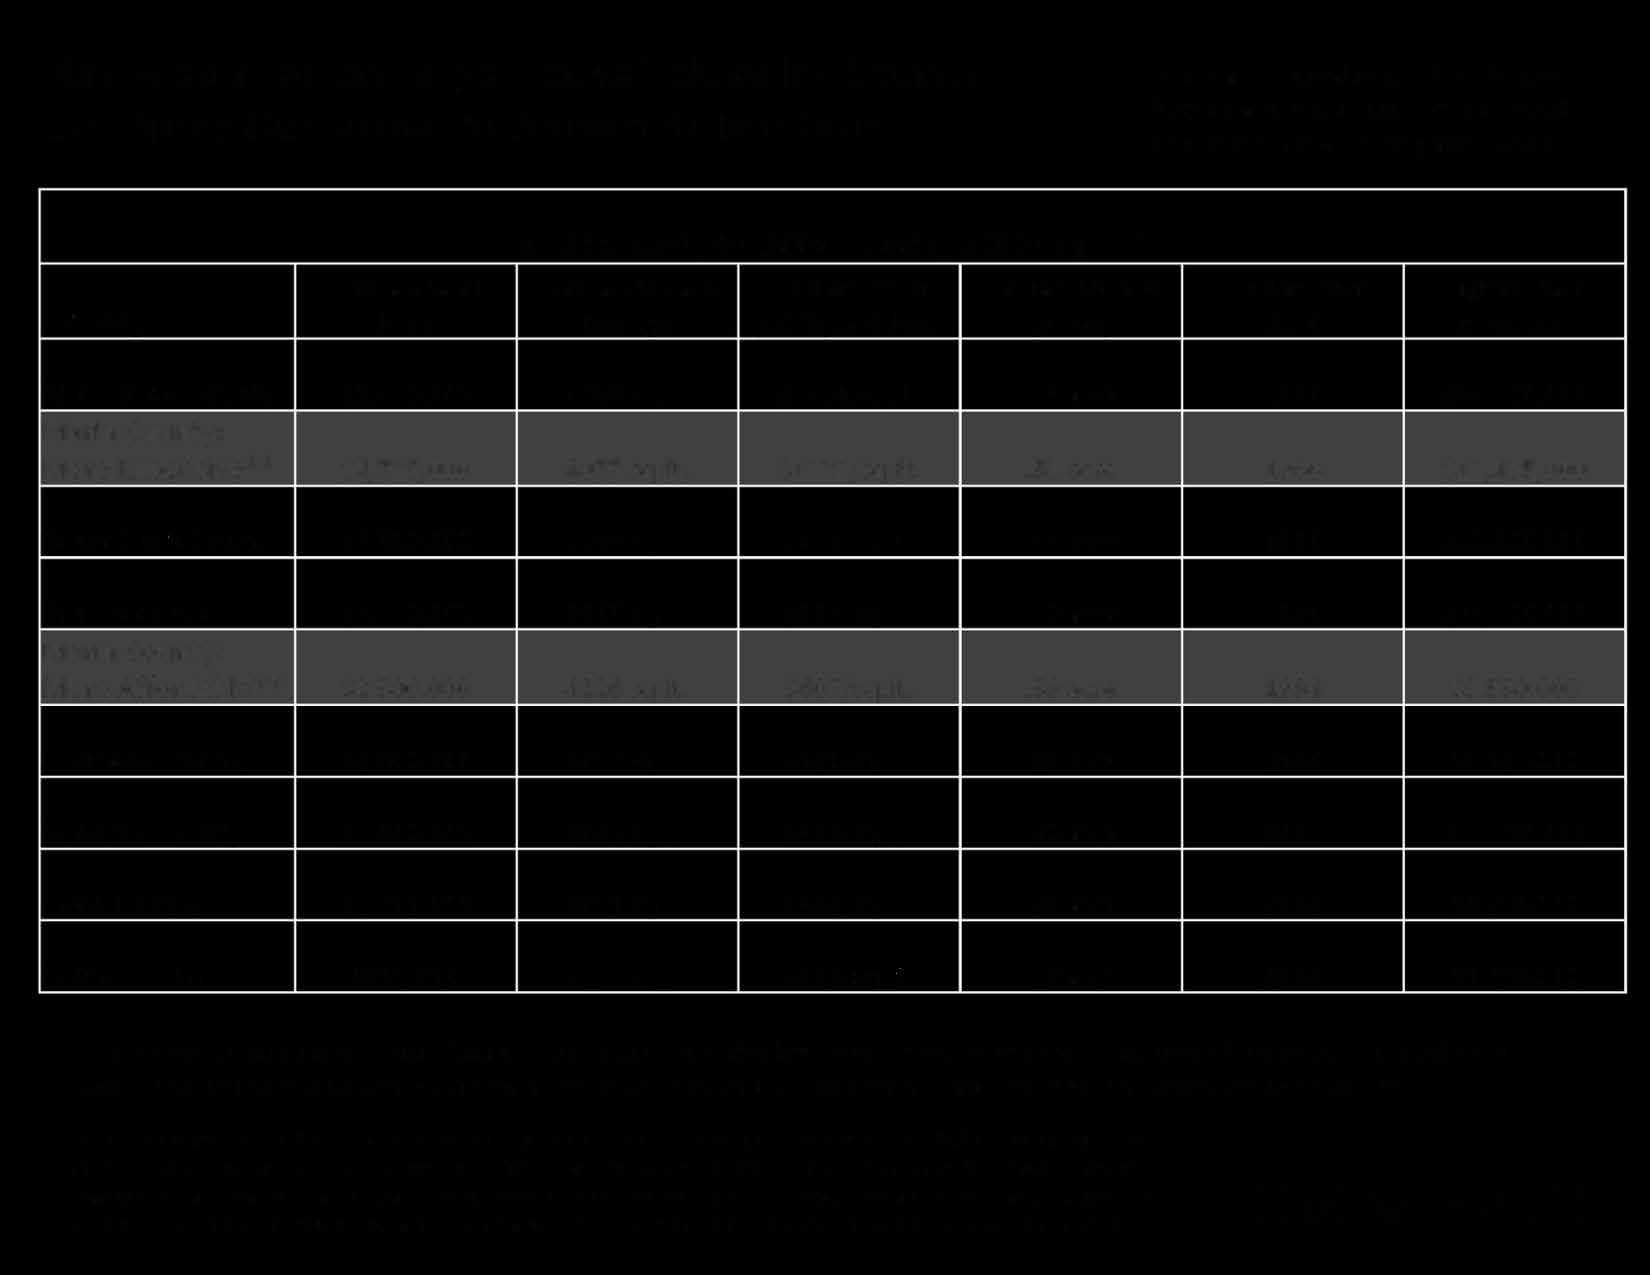
*Sales reported to NorCal MLS Alliance, March 1 - May 31, 2023. Y-o-Y change in sales compared to same period of 2022. "Average Days on Market" until acceptance of offer for sold listings. "Avg. Sales Price to LP%": 100% = an average sales price at original list price. **Months Supply of Inventory measures the approximate time required to sell the inventory of listings on market at currentrate of sale; lower readings signify higher buyer demand as compared to thesupply of homes for sale.
Data calculations per NorCal MLS Alliance Stats function, Broker Metrics or lnfosparks - deemed reliable, but may contain errors and subject to revision. Not all listings or sales are posted to MLS. All numbers approximate. Sales statistics can be affected by outlier data and can change quickly.
PriceSegment/ PropertyType Under $1,000,000 $1,000,000$1,999,999 $2,000,000$2,999,999 $3,000,000$4,999,999 $5,000,000 $7,499,999 $7,500,000+ Houses Condos& Townhouses Spring2023 -3 MonthsSales* 166 sales 259 sales 117 sales 65 sales 20 sales 7 sales 464 sales 170 sales Year-over-Year % Change* -7% -29% -38% -46% -46% -46% -33% -17% Supply of Inventory** 2.1 months 1.2 months 1.4 months 2 months 1.9 months 4.8 months 1.5 months 1.9 months Average Days on Market* 45 days 24 days 25 days 27 days 30 days Insufficient data 27 days 45 days % of SalesOver ListPrice* 31% 62% 59% 54% 41% 0% 57% 36% SalesPrice to ListPrice%* 99% 104% 102.5% 100% 103% 97.5% 103% 100%
C0MPASS
$1,062,500 $1,140,000 $1,275,000 $1,200,000 $1,200,000 $1,345,000 $1,415,000 $1,275�000 $1,207,500 $1,200,000 $1,215,000 $1,400,000 $1,315,000 $1,345,000 $1,535,000 $1,525,000 $1,500,000 $1,515,000 $1,315,000 $1,345,000 $1,737,500 $1,510,000 $1,512,500 $1,395,000 $1,600,000 $1,580,000 $1,630,000 $1,705,000
N 0 N 0 N 0 N 0
$1,775,000 $1,600,000 $1,863,500 $2,300,000 $1,535,000 $1,312,500 $1,620,000 $1,895,000
$1,625,000 $1,610,000 $1,910,000 $1,912,500 $2,050,000 $1,950,000 $2,372,500 $1,995,000 $2,050,000 $1,995t000 $1,635,000 $1,670,000 $1,780,000 $1,725,000 $1,875,000 $2,375,000 $2,200,000 $1,912,500 $2,158,000 $2,225,000 $2,125,000 $2,500,000 $3,275,000 $3,187,500 $3,317,000 $3,350,000 $3,020,000 $3,675,000
-C N 0 N 0 N 0 N 0
$4,142,500 $3,225,000 $3,650,000 $3,300,000 $3,500,000
Marin County Housing*
Total Housing Units: 111,963
Occupancy Rate: 92.5% Housing
Units by Building Type
25% of households have children under the age of 18, and 75% of households include no children.
Multi-unit buildings include condos, rental apartments and social housing.
64% of housing units are owner-occupied and 36% are tenant occupied.
Era of
In the Bay Area, Marin has the lowest % of homes built since 2000.
Except for San Francisco, most of the Bay Area was relatively empty before WWII. For Marin, the completion of the GG Bridge in 1937 was a critical turning point.
*"Total Housing Units" census estimate as of 7/1/22. Other data per U.S. census 2021, ACS 1-year
All numbers are U.S. Census estimates, and should be considered approximate. estimates for occupied housing. Percentages usually rounded to nearest half or full percentage point. Data
from sources deemed reliable, but may contain errors and subject to revision. All numbers approximate.
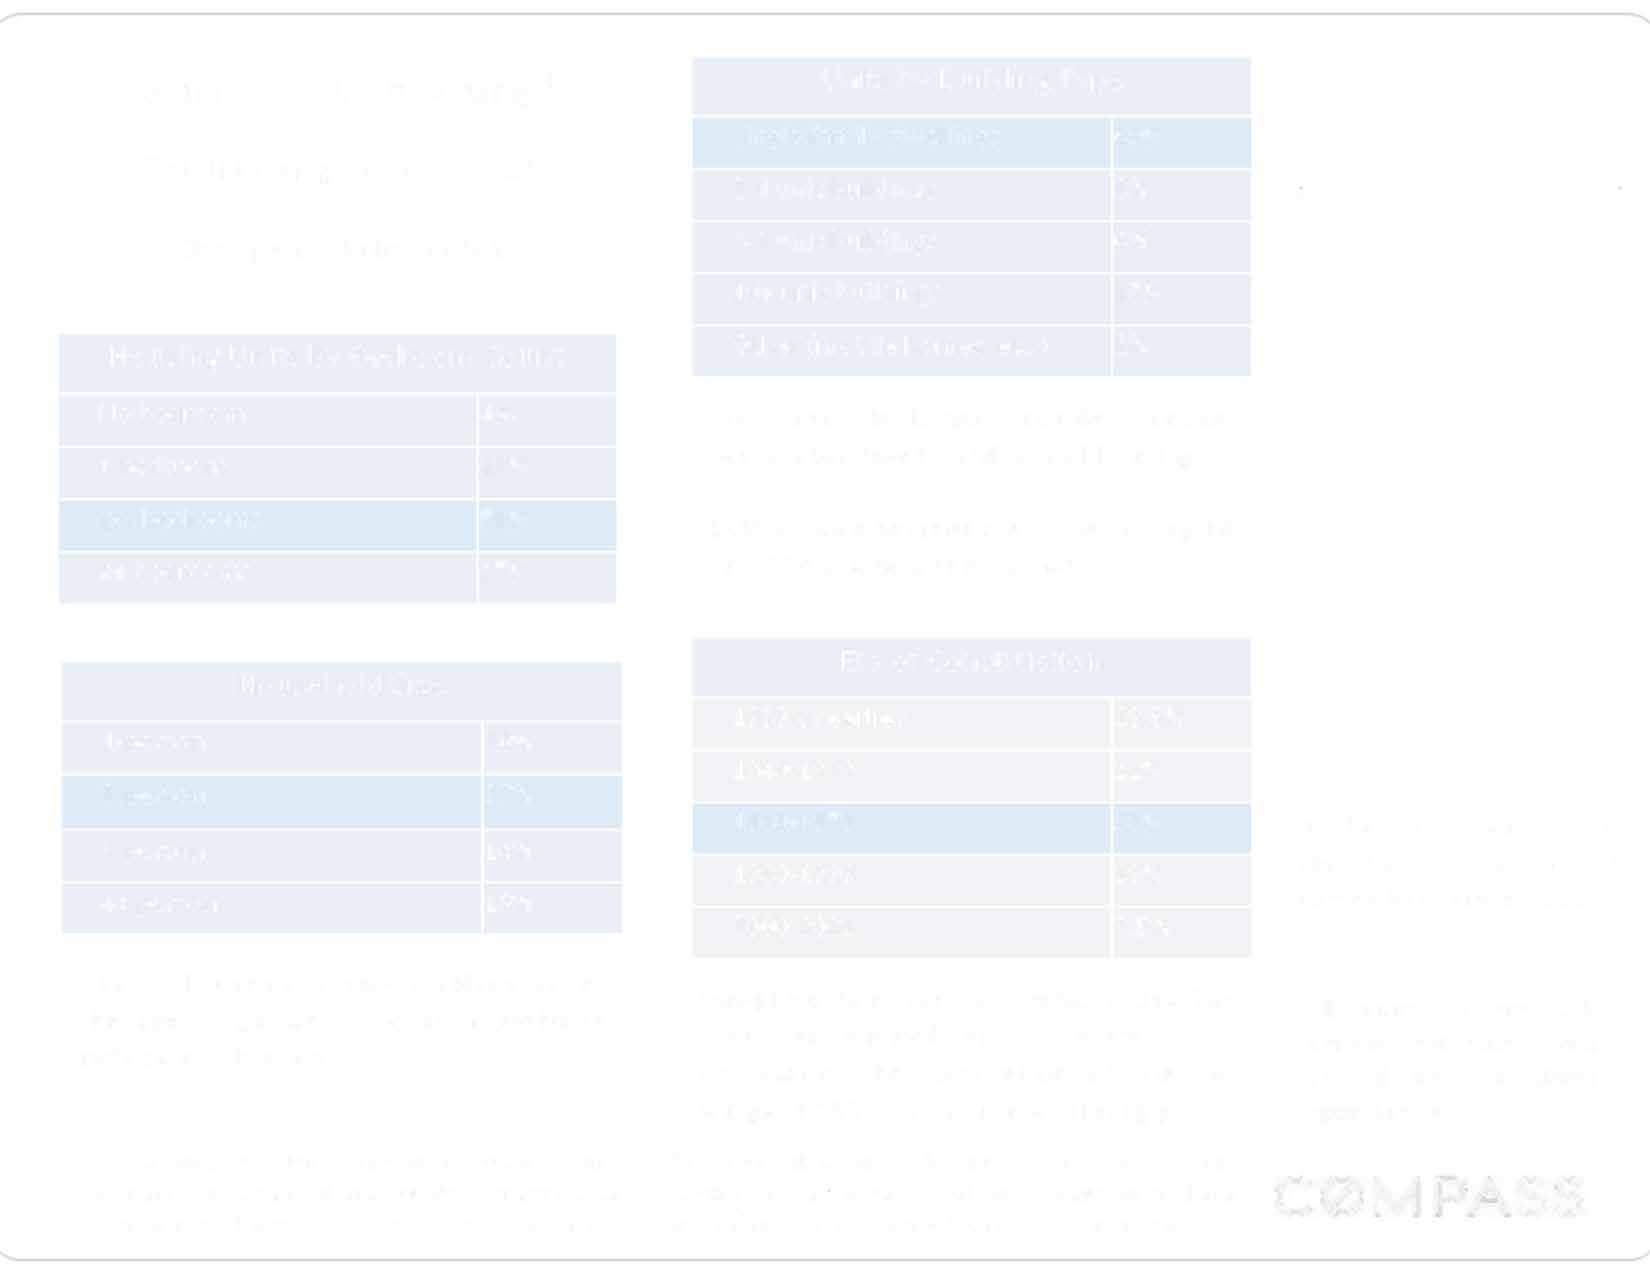
Units
No bedroom 1 bedroom 2-3 bedrooms 4+ bedrooms Household Size 1-person 2-person 3-person 4+ person 4% 13% 56% 27% 30% 37% 14% 19%
by Bedroom Count
Single family dwellings 69% 2-4 unit buildings 5-9 unit buildings 10+ unit buildings Other (mobile homes, etc.) 8% 6% 15% 2%
1939 or earlier 13.5% 1940-1959 22% 1960-1979 38% 1980-1999 19% 2000-2021 7.5%
Construction
◄
C0MpA$$
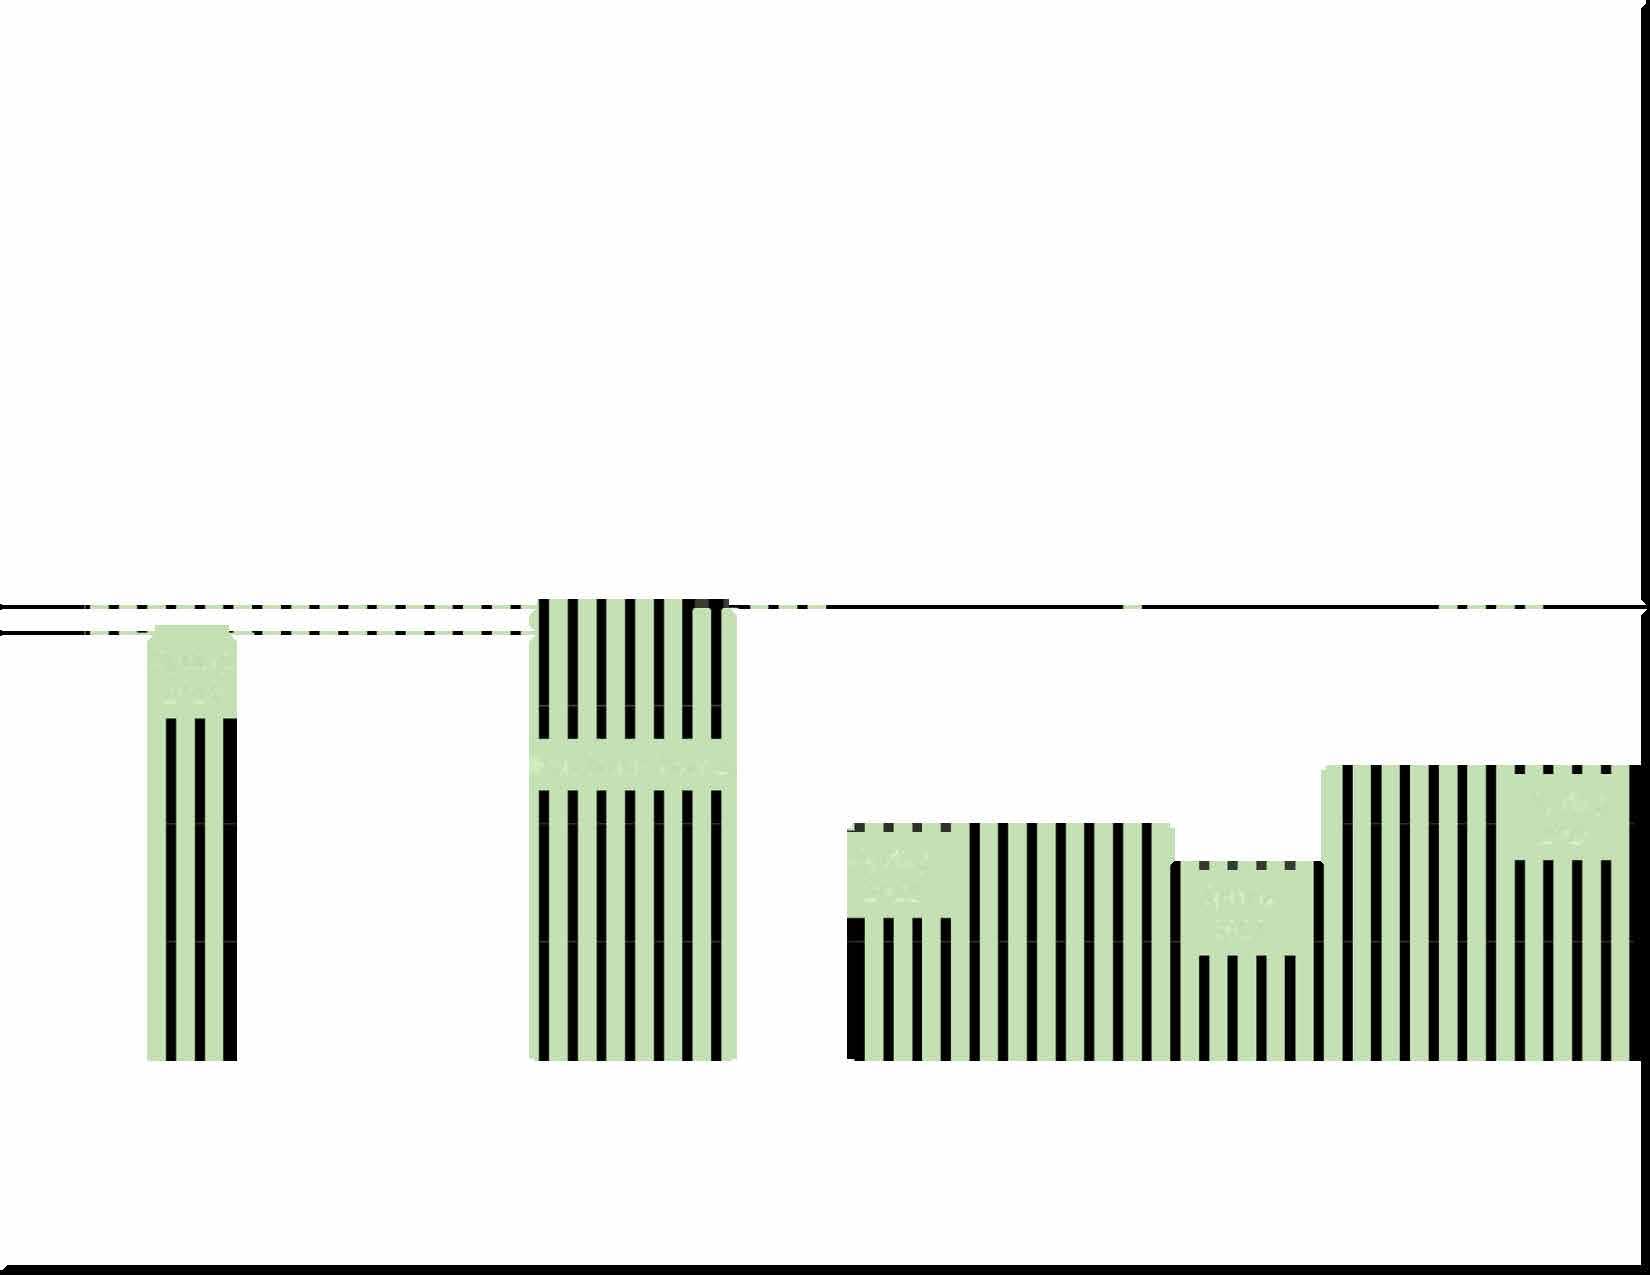
Spring 2019 Pandemic Year 1 Spring 2021 Spring 2022 Spring 2023

 San Rafael
Mill Valley
San Rafael
Mill Valley
Click Here to Access the COMPASS Review of Bay Area Home Prices


Median House Sales Price Median House Size Median $/Sq.Ft. San Mateo $10,800,000 5450 sq.ft. $1,756 San Mateo $5,637,500 4468 sq.ft. $1,315 Santa Clara $4,800,000 4246 sq.ft. $1,382 Contra Costa $4,355,000 4706 sq.ft. $898 San Francisco $4,300,000 3878 sq.ft. $1,534 Santa Clara $4,000,000 2277 sq.ft. $1,705 San Francisco $3,915,000 2906 sq.ft. $1,177 Marin $3,862,500 2894 sq.ft. $1,622 San Mateo $3,815,000 2369 sq.ft. $1,5U Santa Clara $3,800,000 2640 sq.ft. $1,405 San Mateo $3,700,000 3200 sq.ft. $1,063 San Mateo $3,657,500 2116 sq.ft. $1,492 Marin $3,500,000 2836 sq.ft. $1,278 Santa Clara $3,400,000 1976 sq.ft. $1,796 Marin $3,200,000 2566 sq.ft. $1,229 Marin $3,137,500 2137 sq.ft. $1,387 Santa Clara $2,850,000 2364 sq.ft. $1,288 Monterey $2,800,000 1817 sq.ft. 2135 sq.ft. .ft
Bay Area Median Large House Values by County
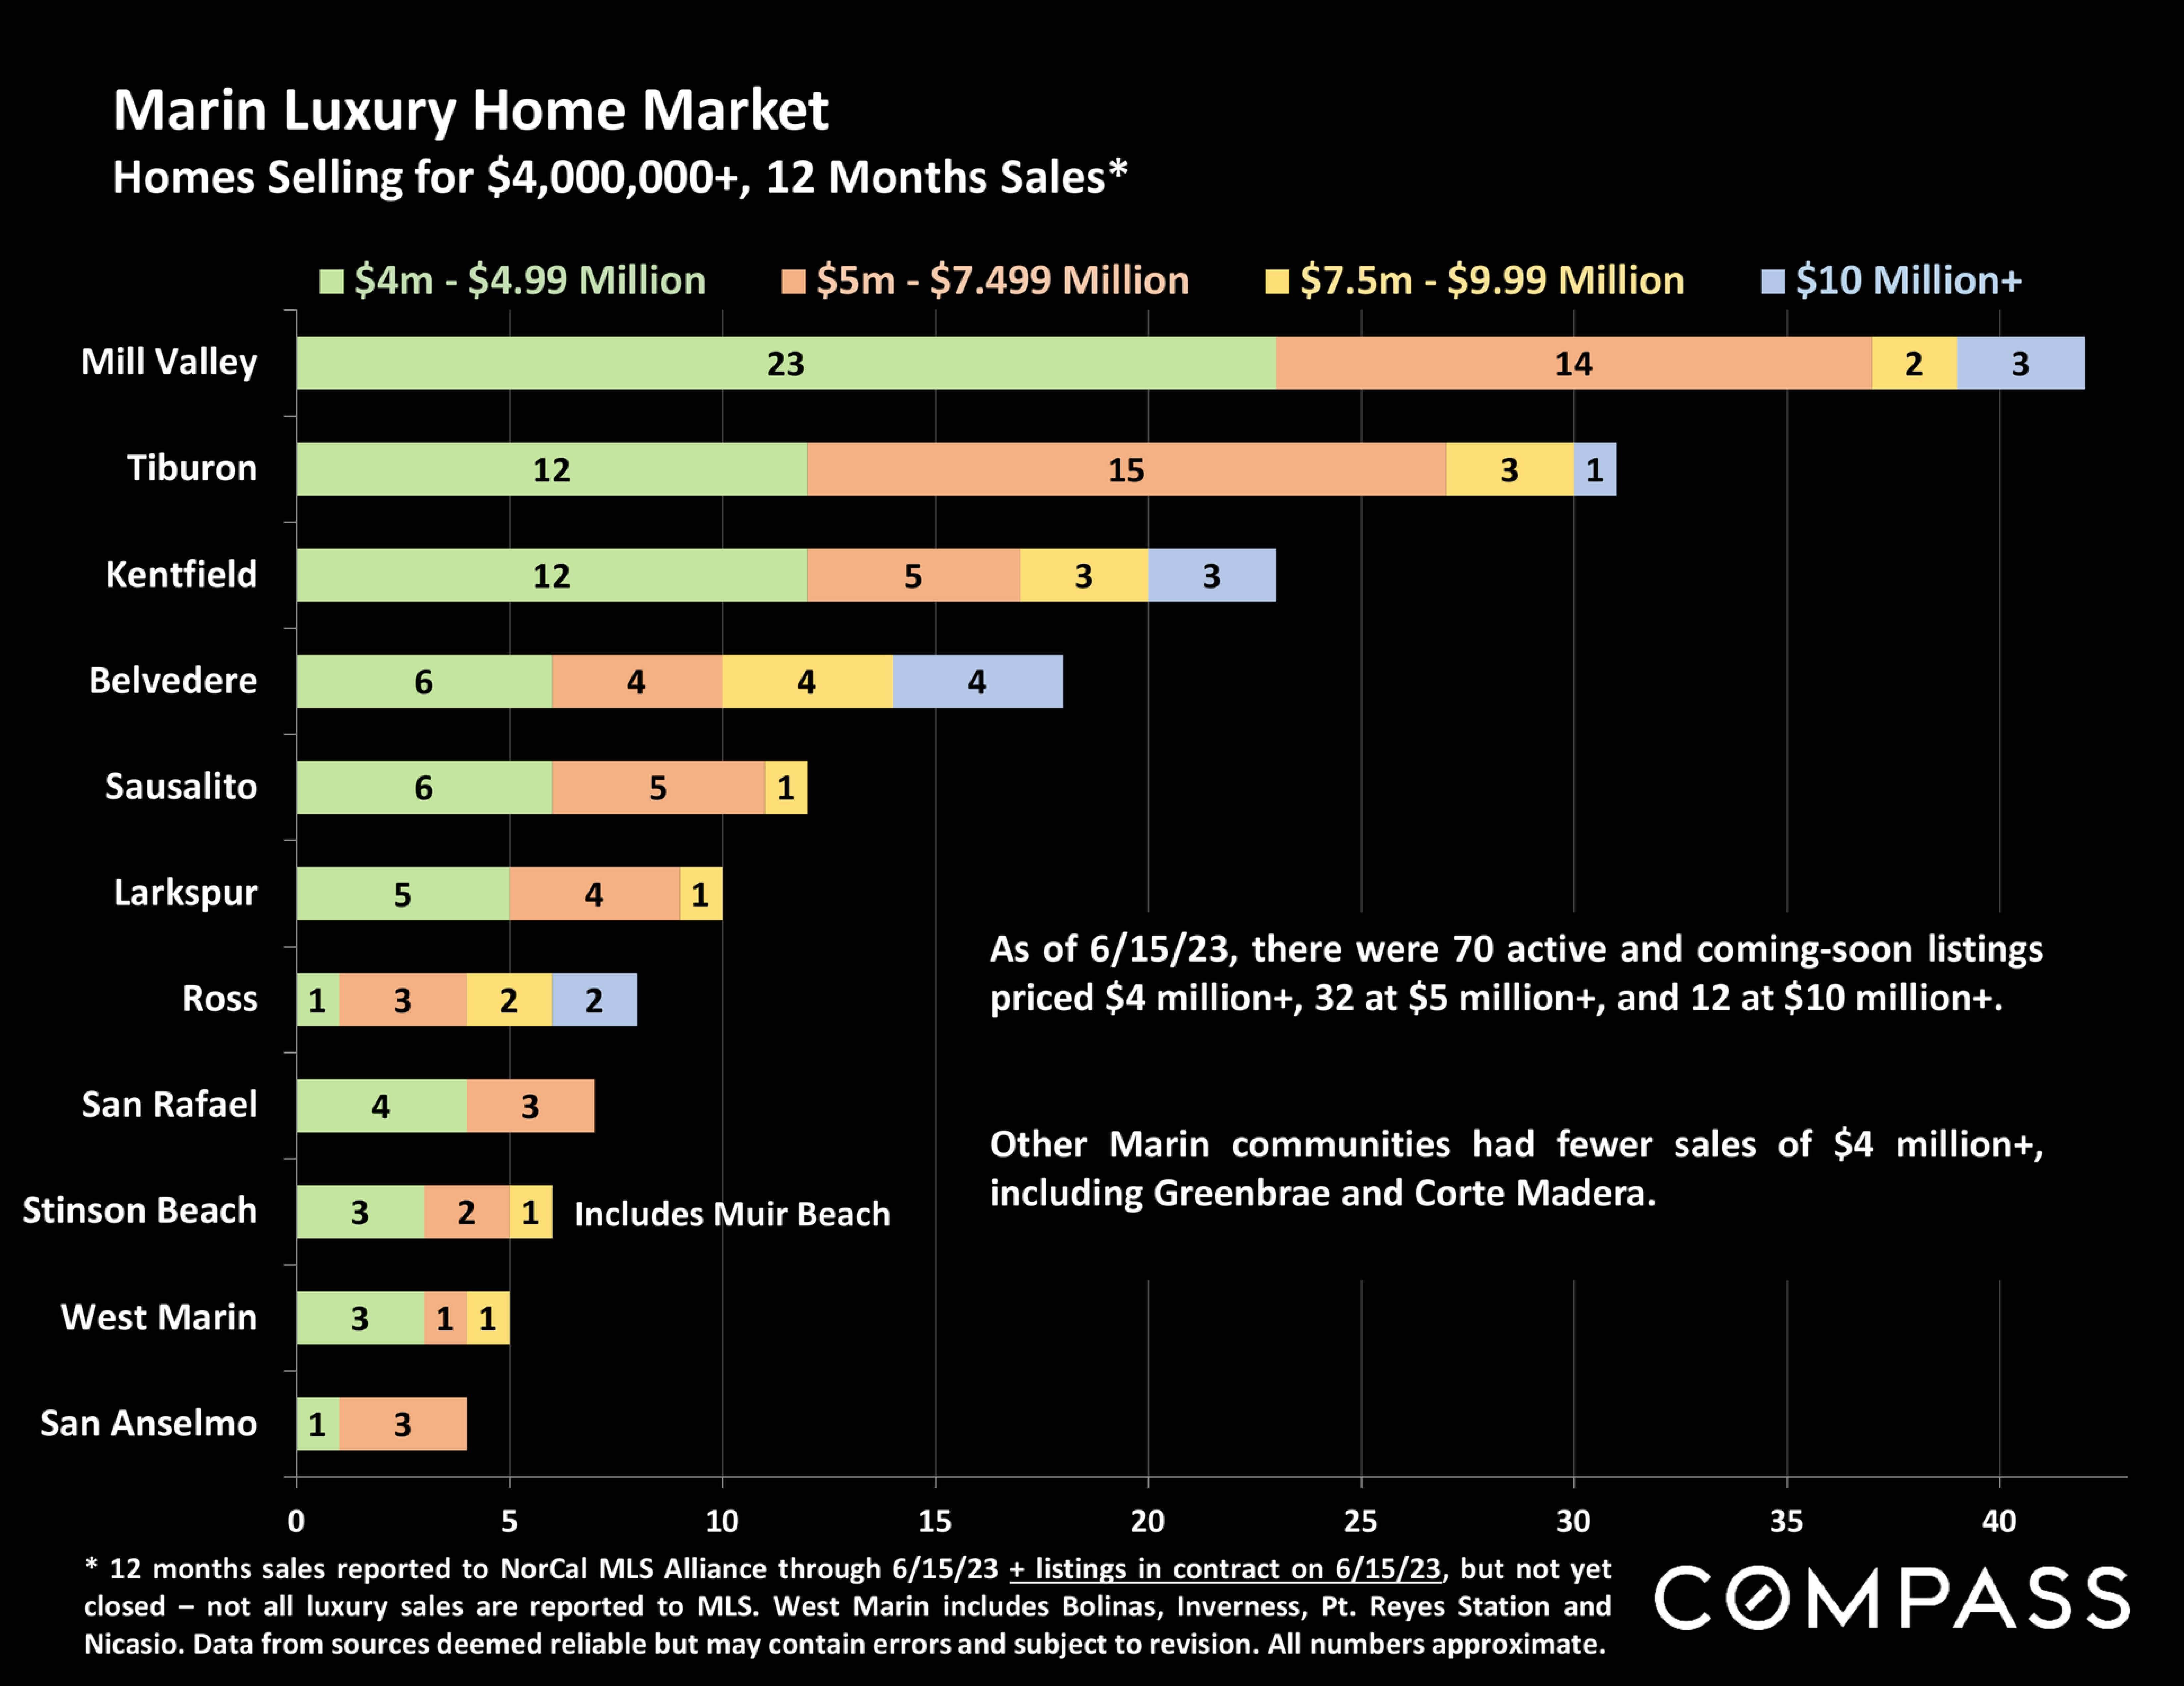
Early Spring 2023 Update: 5+ Bedroom/4+ Bath Count*
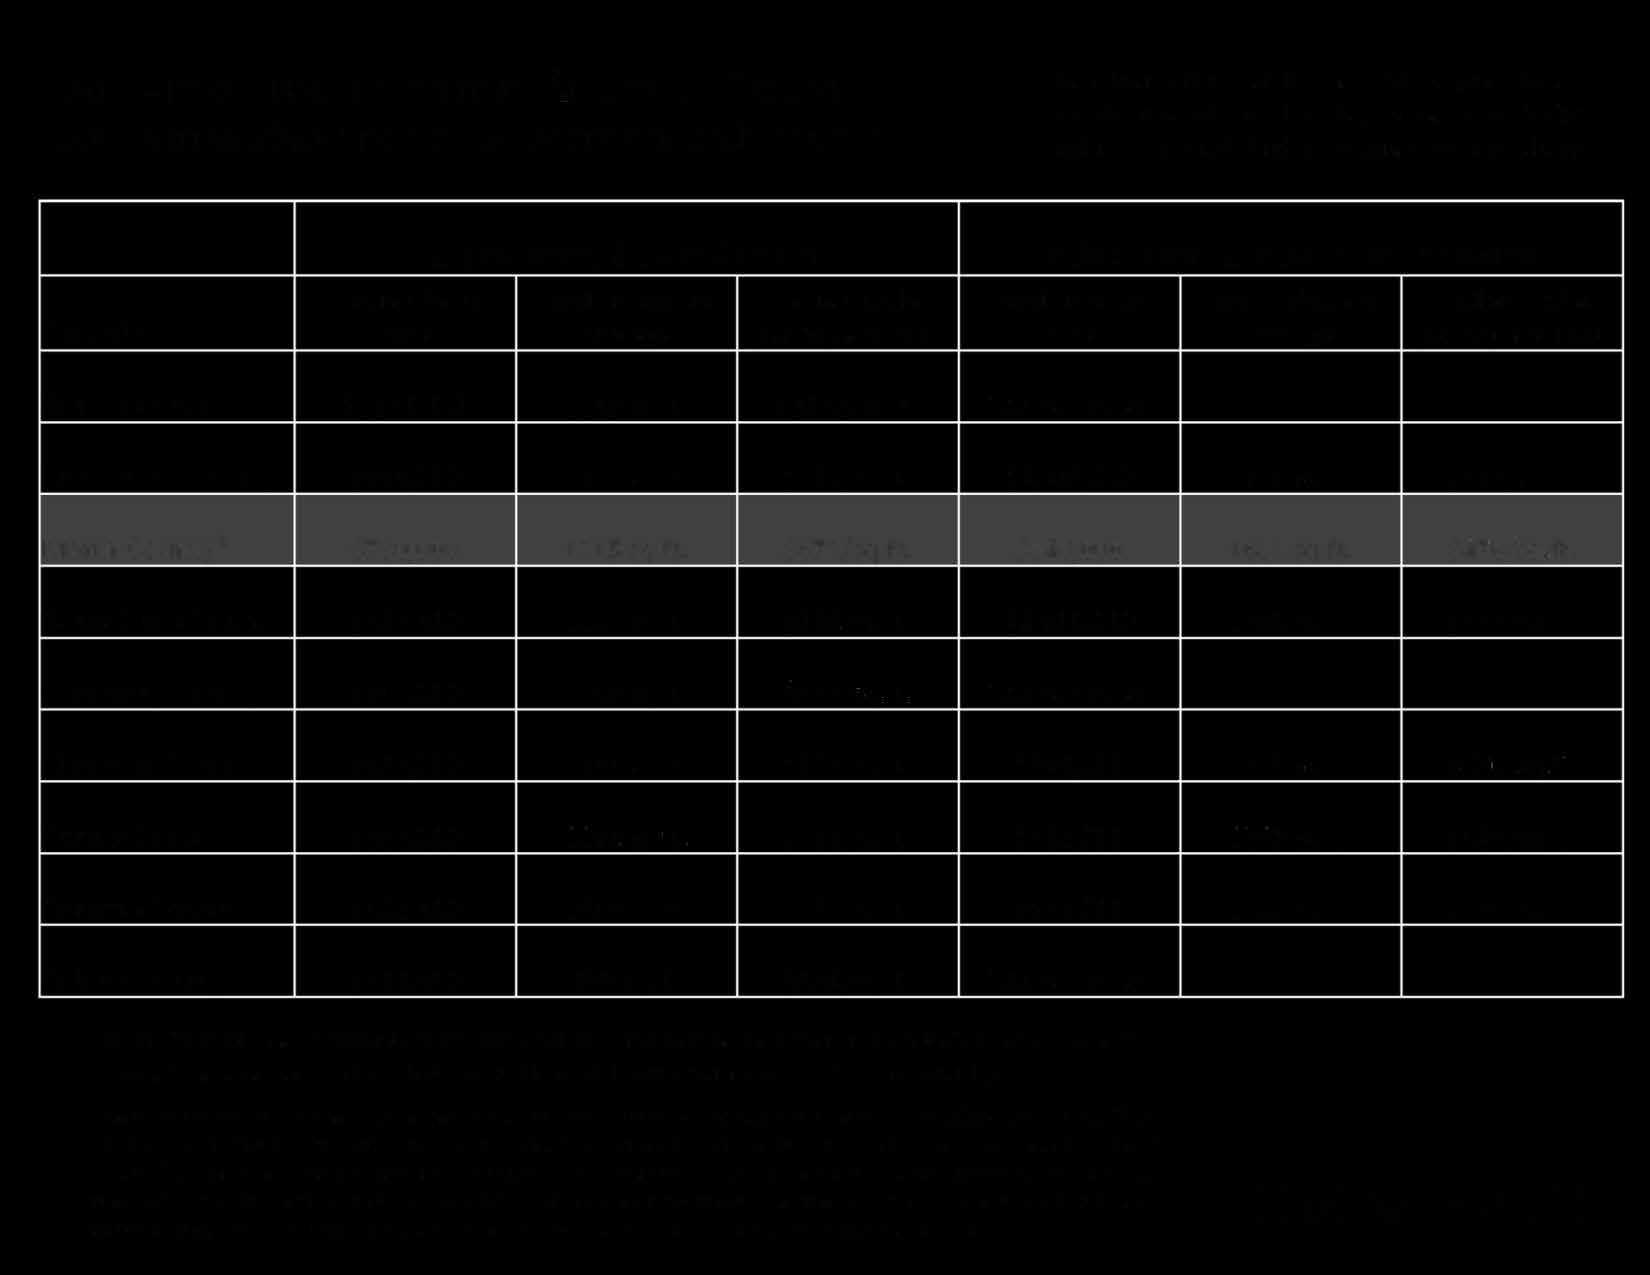
Generally speaking, the largest homes are more likely to be found in more expensive neighborhoods.
5+ Bedroom, 4+ Bath Houses, 3000+ sq.ft.*
**For these calculations, Marin County was roughly divided between its more expensive communities, mostly in southern Marin, and its more affordable communities, mostly in central/northern Marin. All median values are generalities.
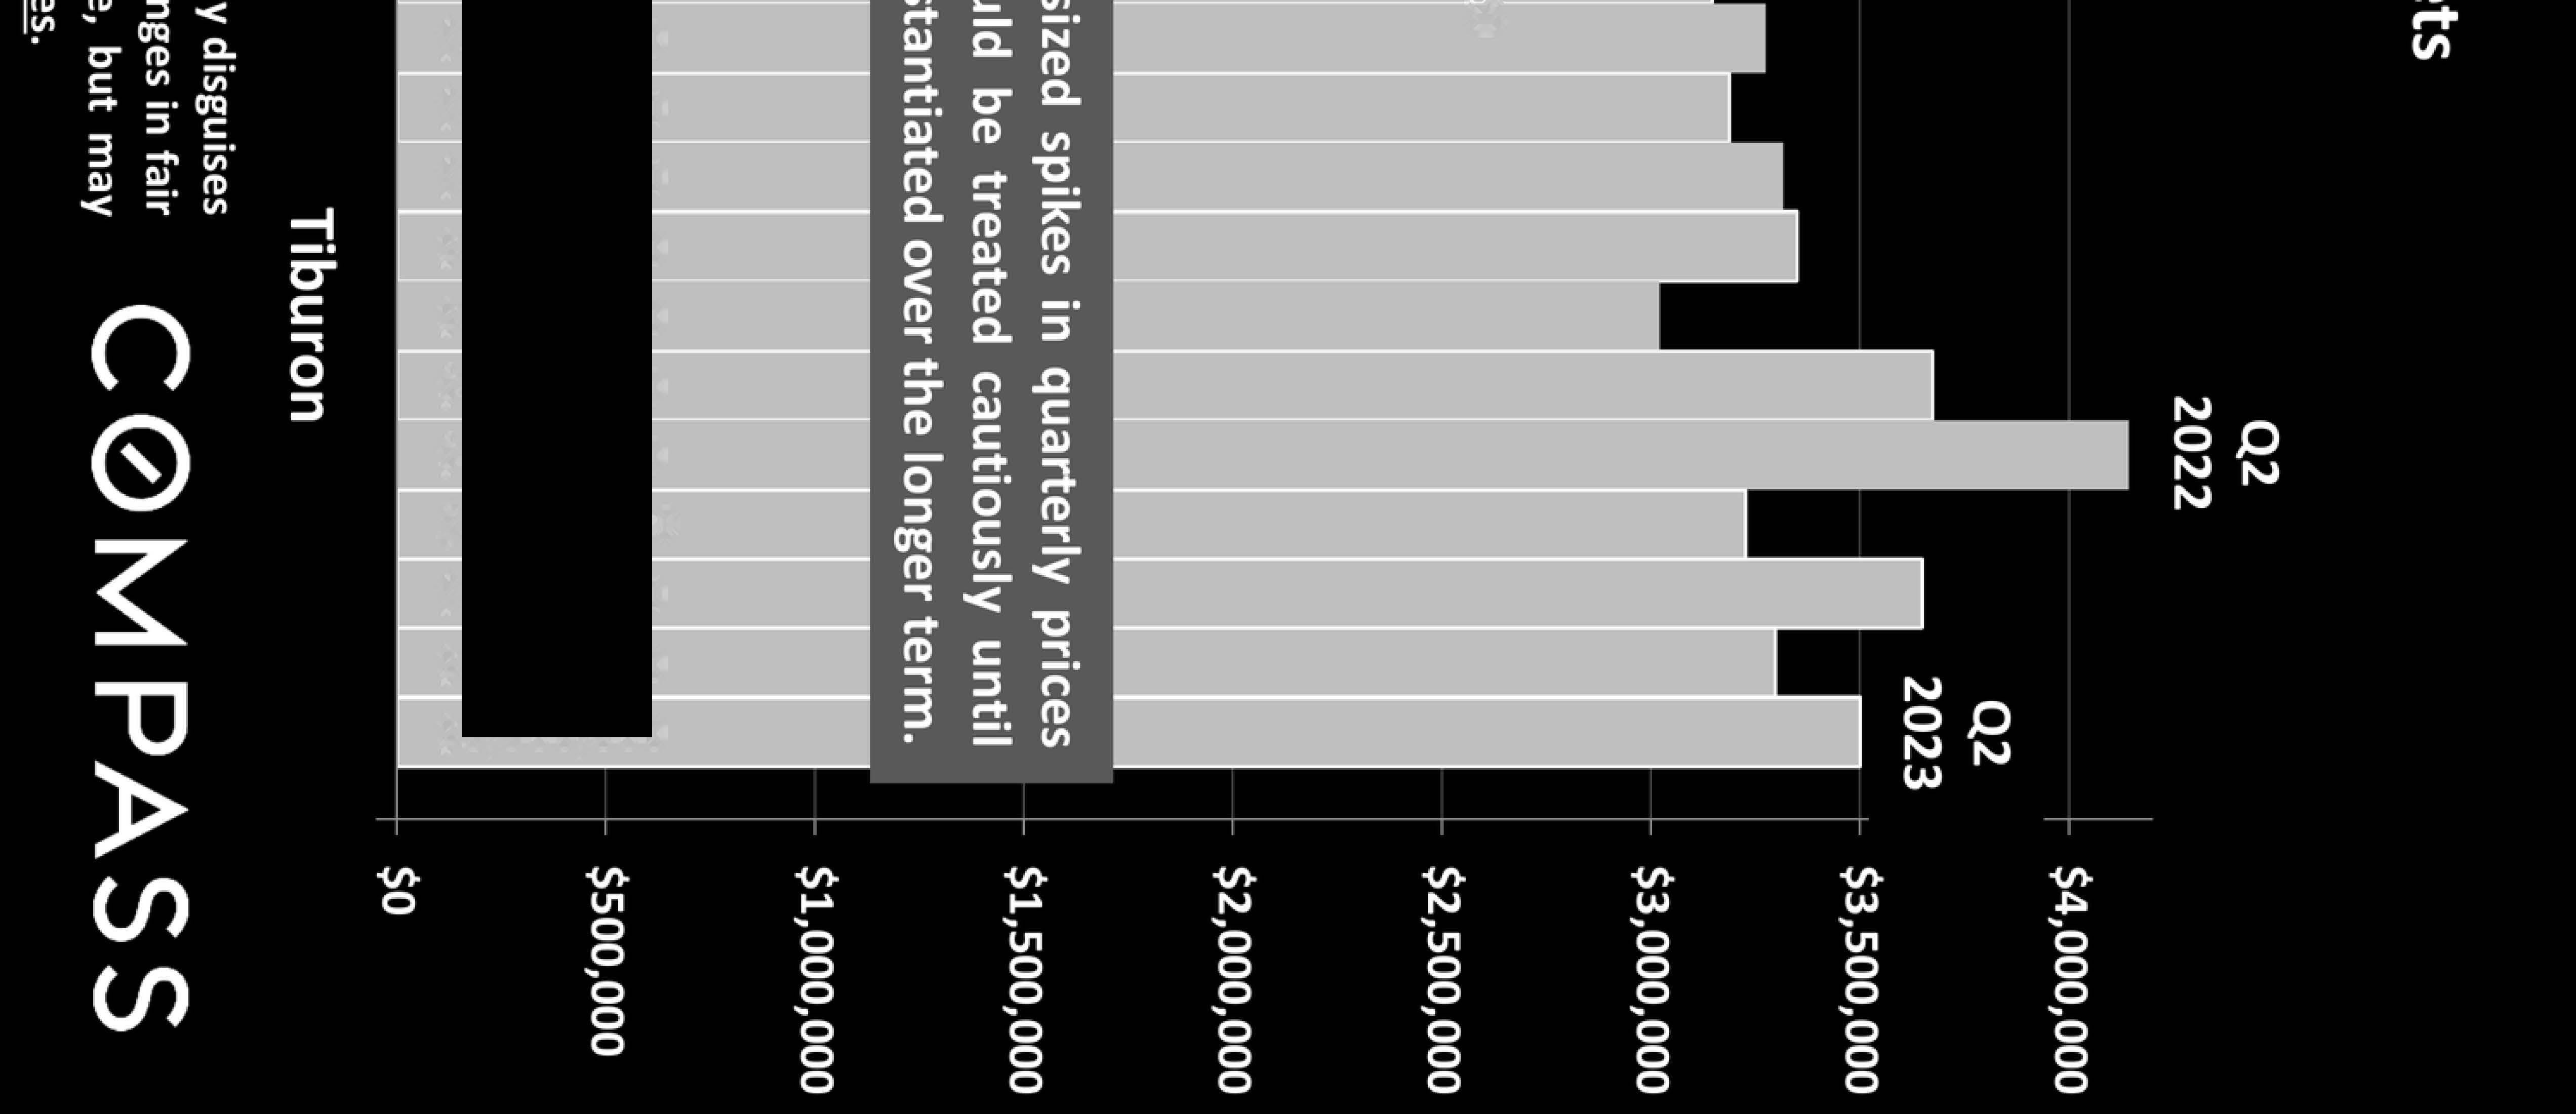
*Sales reported to NorCal MLS Alliance during the 4 months through mid-late March 2023. Excluding "fixer uppers.'' Counties contain submarkets of widely varying values. Median values fluctuate for reasons besides changes in fair market value. Data from sources deemed reliable, but may contain errors and subject to revision. Numbers approximate, and may change with late reported sales. Not all sales are reported to MLS.
County Median Sales Price Median Square Footage Median Dollar per Square Foot Median Lot Size (Acres) Median Year Built Highest Sale in Period* San Mateo County $6,250,000 4769 sq.ft. $1418/sq.ft. .54 acre 1990 $44,500,000 Marin County: More Expensive** $4,725,000 4077 sq.ft. $1222/sq.ft. .53 acre 1966 $12,435,000 Santa Clara County $3,800,000 4268 sq.ft. $859/sq.ft. .47 acre 2000 $13,000,000 San Francisco $3,750,000 3900 sq.ft. $997/sq.ft. .10 acre 1926 $34,500,000 Marin County: More Affordable** $2,500,000 4226 sq.ft. $607/sq.ft. .59 acre 1994 $3,550,000 Alameda County $2,400,000 3877 sq.ft. $620/sq.ft. .23 acre 1999 $4,925,000 Sonoma County $1,800,000 3825 sq.ft. $490/sq.ft. .60 acre 2004 $11,750,000 Contra Costa $1,765,000 3871 sq.ft. $432/sq.ft. .24 acre 2002 $9,250,000 Solano County $864,000 3415 sq.ft. $250/sq.ft. .18 acre 2008 $1,770,000
C0MPASS
Bay Area Median House Values by County
Early Spring 2023 Update: By Bedroom/Bath Count*
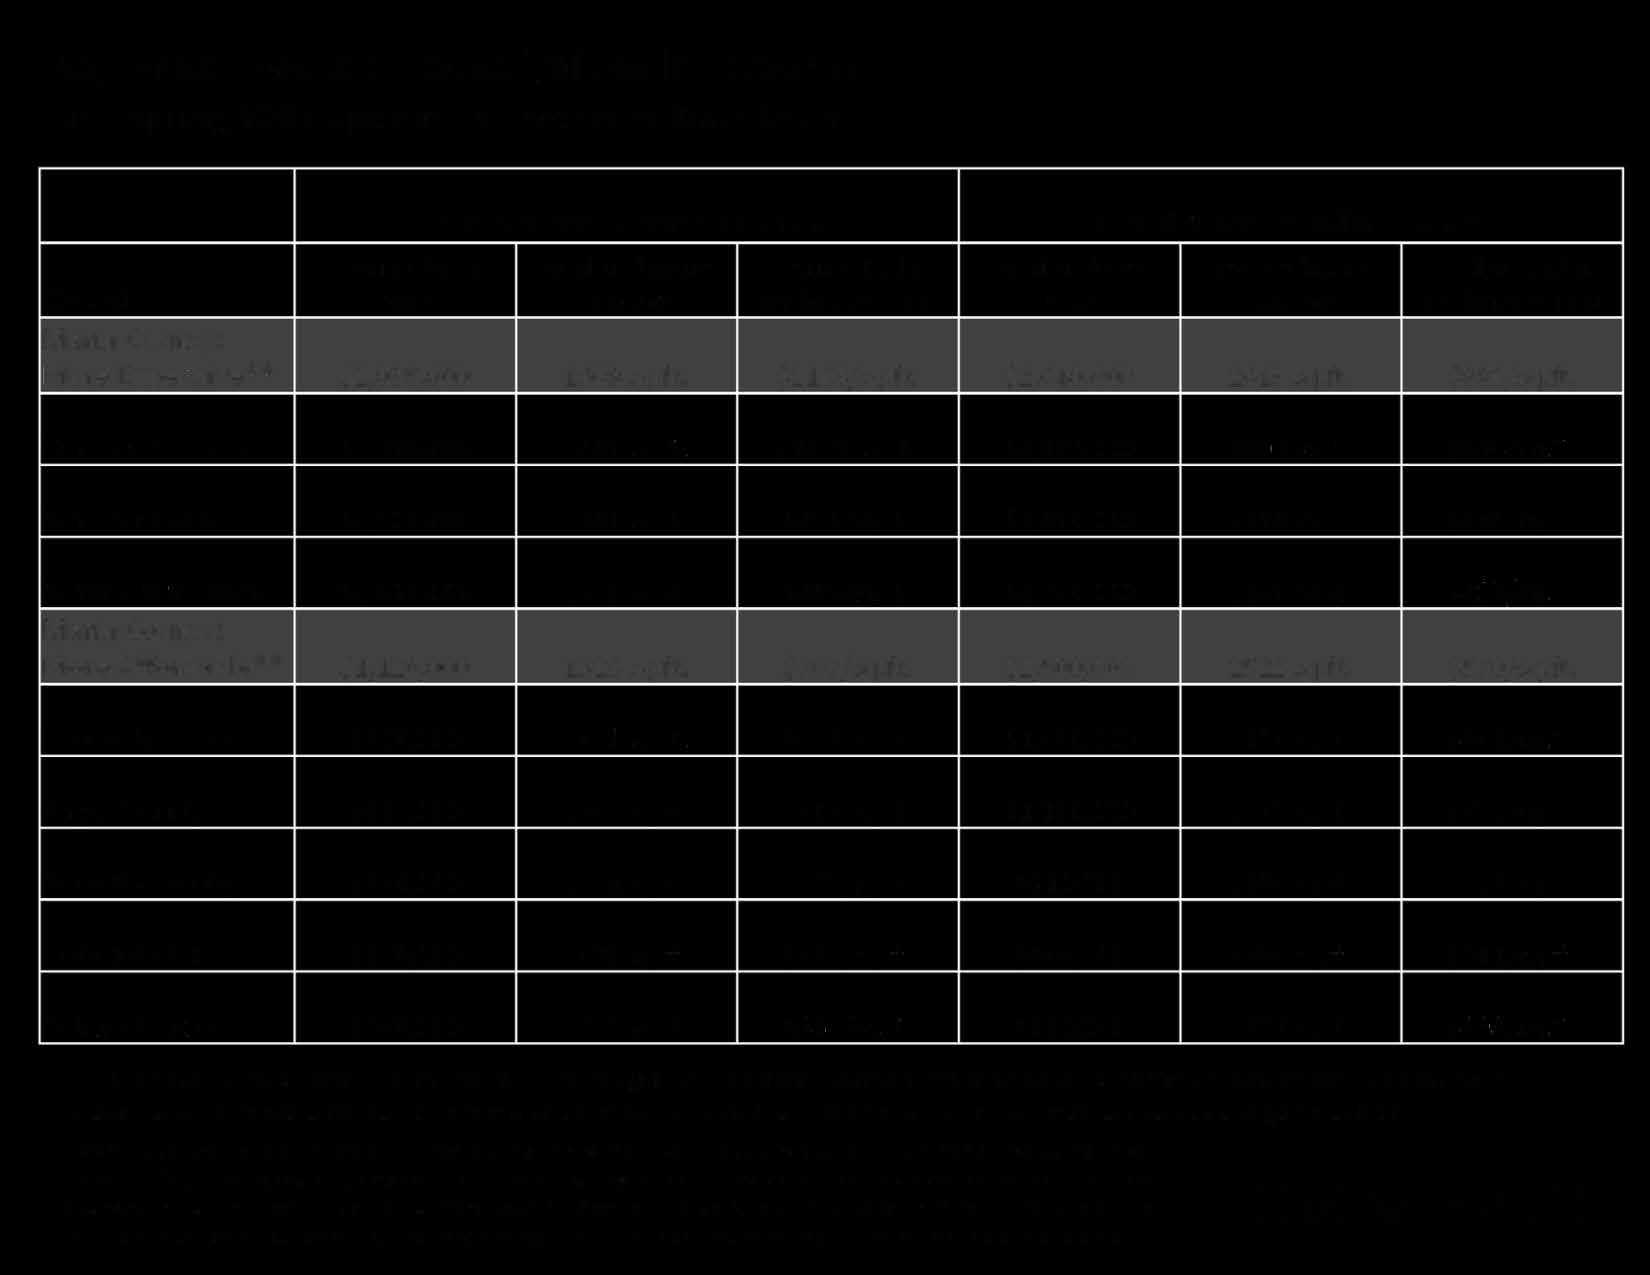
**For these calculations, Marin County was roughly divided between its more expensive communities, mostly in southern Marin, and its more affordable communities, mostly in central/northern Marin. All median values are generalities.
*Sales reported to NorCal MLS Alliance during the 4 months through mid-late March 2023. Excluding "fixer uppers." Counties contain submarkets of widely varying values. Median values fluctuate for reasons besides changes in fair market value. Data from sources deemed reliable, but may contain errors and subject to revision. Numbers approximate, andmay change with late reportedsales. Not all salesare reportedto MLS.
3 Bedroom, 2 Bath Houses 4 Bedroom, 3 Bath Houses County Marin County: More Expensive** San Mateo County San Francisco Santa Clara County Marin County: More Affordable** Alameda County Napa County Sonoma County Contra Costa Solano County Median Sales Price $2,035,000 $1,550,000 $1,400,000 $1,393,000 $1,120,000 $968,000 $835,000 $750,000 $670,000 $538,000 Median Square Footage 1609 sq.ft. 1480 sq.ft. 1580 sq.ft. 1402 sq.ft. 1526 sq.ft. 1410 sq.ft. 1443 sq.ft. 1501 sq.ft. 1430 sq.ft. 1502 sq.ft. Median Dollar per Square Foot $1183/sq.ft. $1045/sq.ft. $940/sq.ft. $984/sq.ft. $707/sq.ft. $692/sq.ft. $564/sq.ft. $507/sq.ft. $487/sq.ft. $364/sq.ft. Median Sales Price $2,640,000 $2,125,000 $1,850,000 $1,750,000 $1,500,000 $1,450,000 $1,100,000 $910,000 $842,500 $660,000 Median Square Footage 2613 sq.ft. 2205 sq.ft. 2058 sq.ft. 2146 sq.ft. 2522 sq.ft. 2170 sq.ft. 2396 sq.ft. 2158 sq.ft. 2264 sq.ft. 2171 sq.ft. Median Dollar per Square Foot $998/sq.ft. $934/sq.ft. $987/sq.ft. $815/sq.ft. $570/sq.ft. $646/sq.ft. $473/sq.ft. $418/sq.ft. $381/sq.ft. $298/sq.ft.
C0MPASS
Bay Area Median Home Values by County
Early Spring 2023 Update: By Bedroom/Bath Count*
San Francisco has by far the largest luxury condo market in the Bay Area, one factor behind its much higher median condo values.
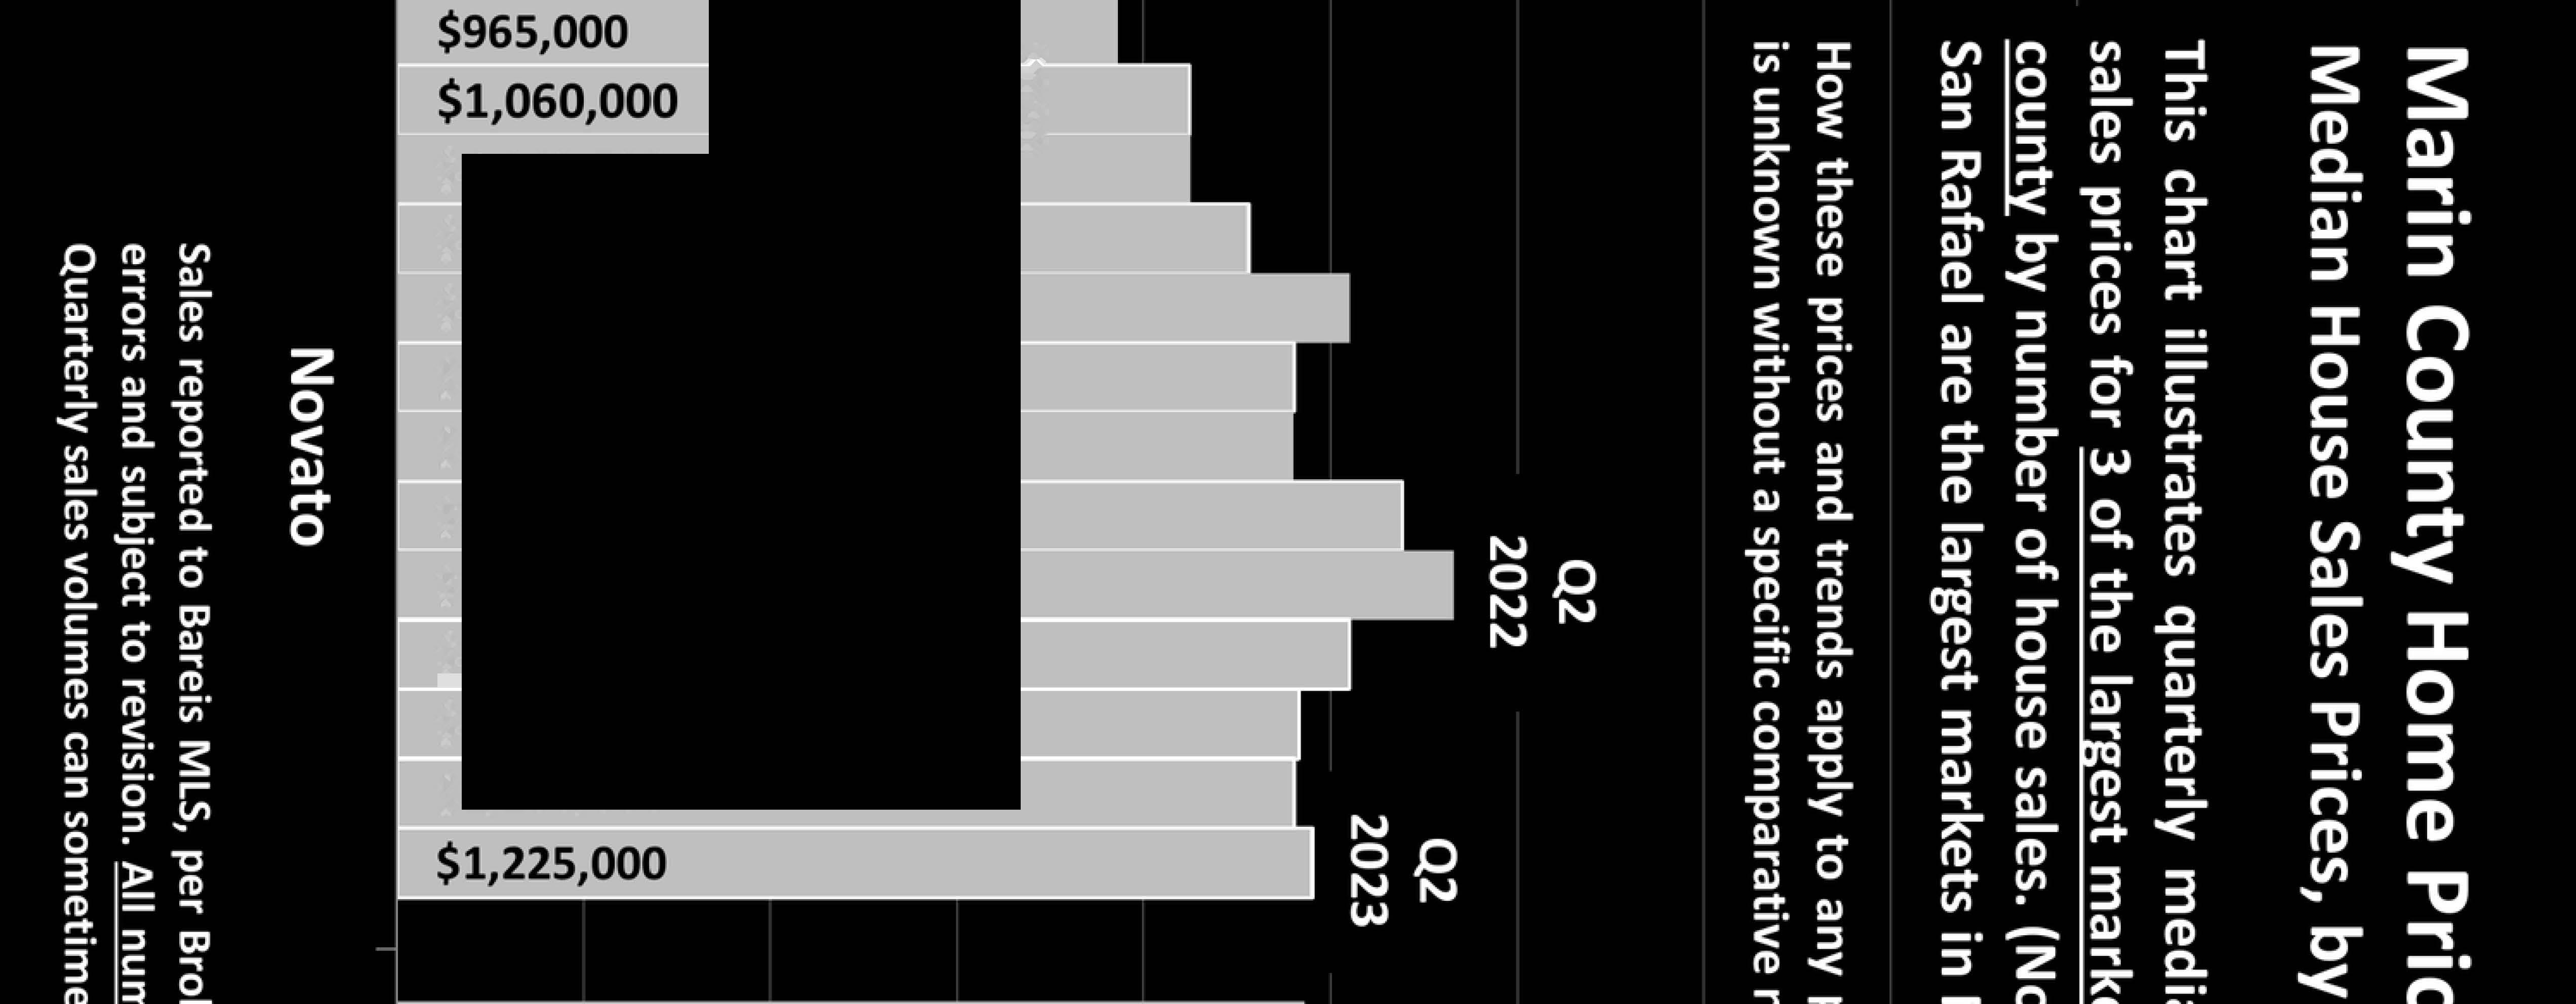
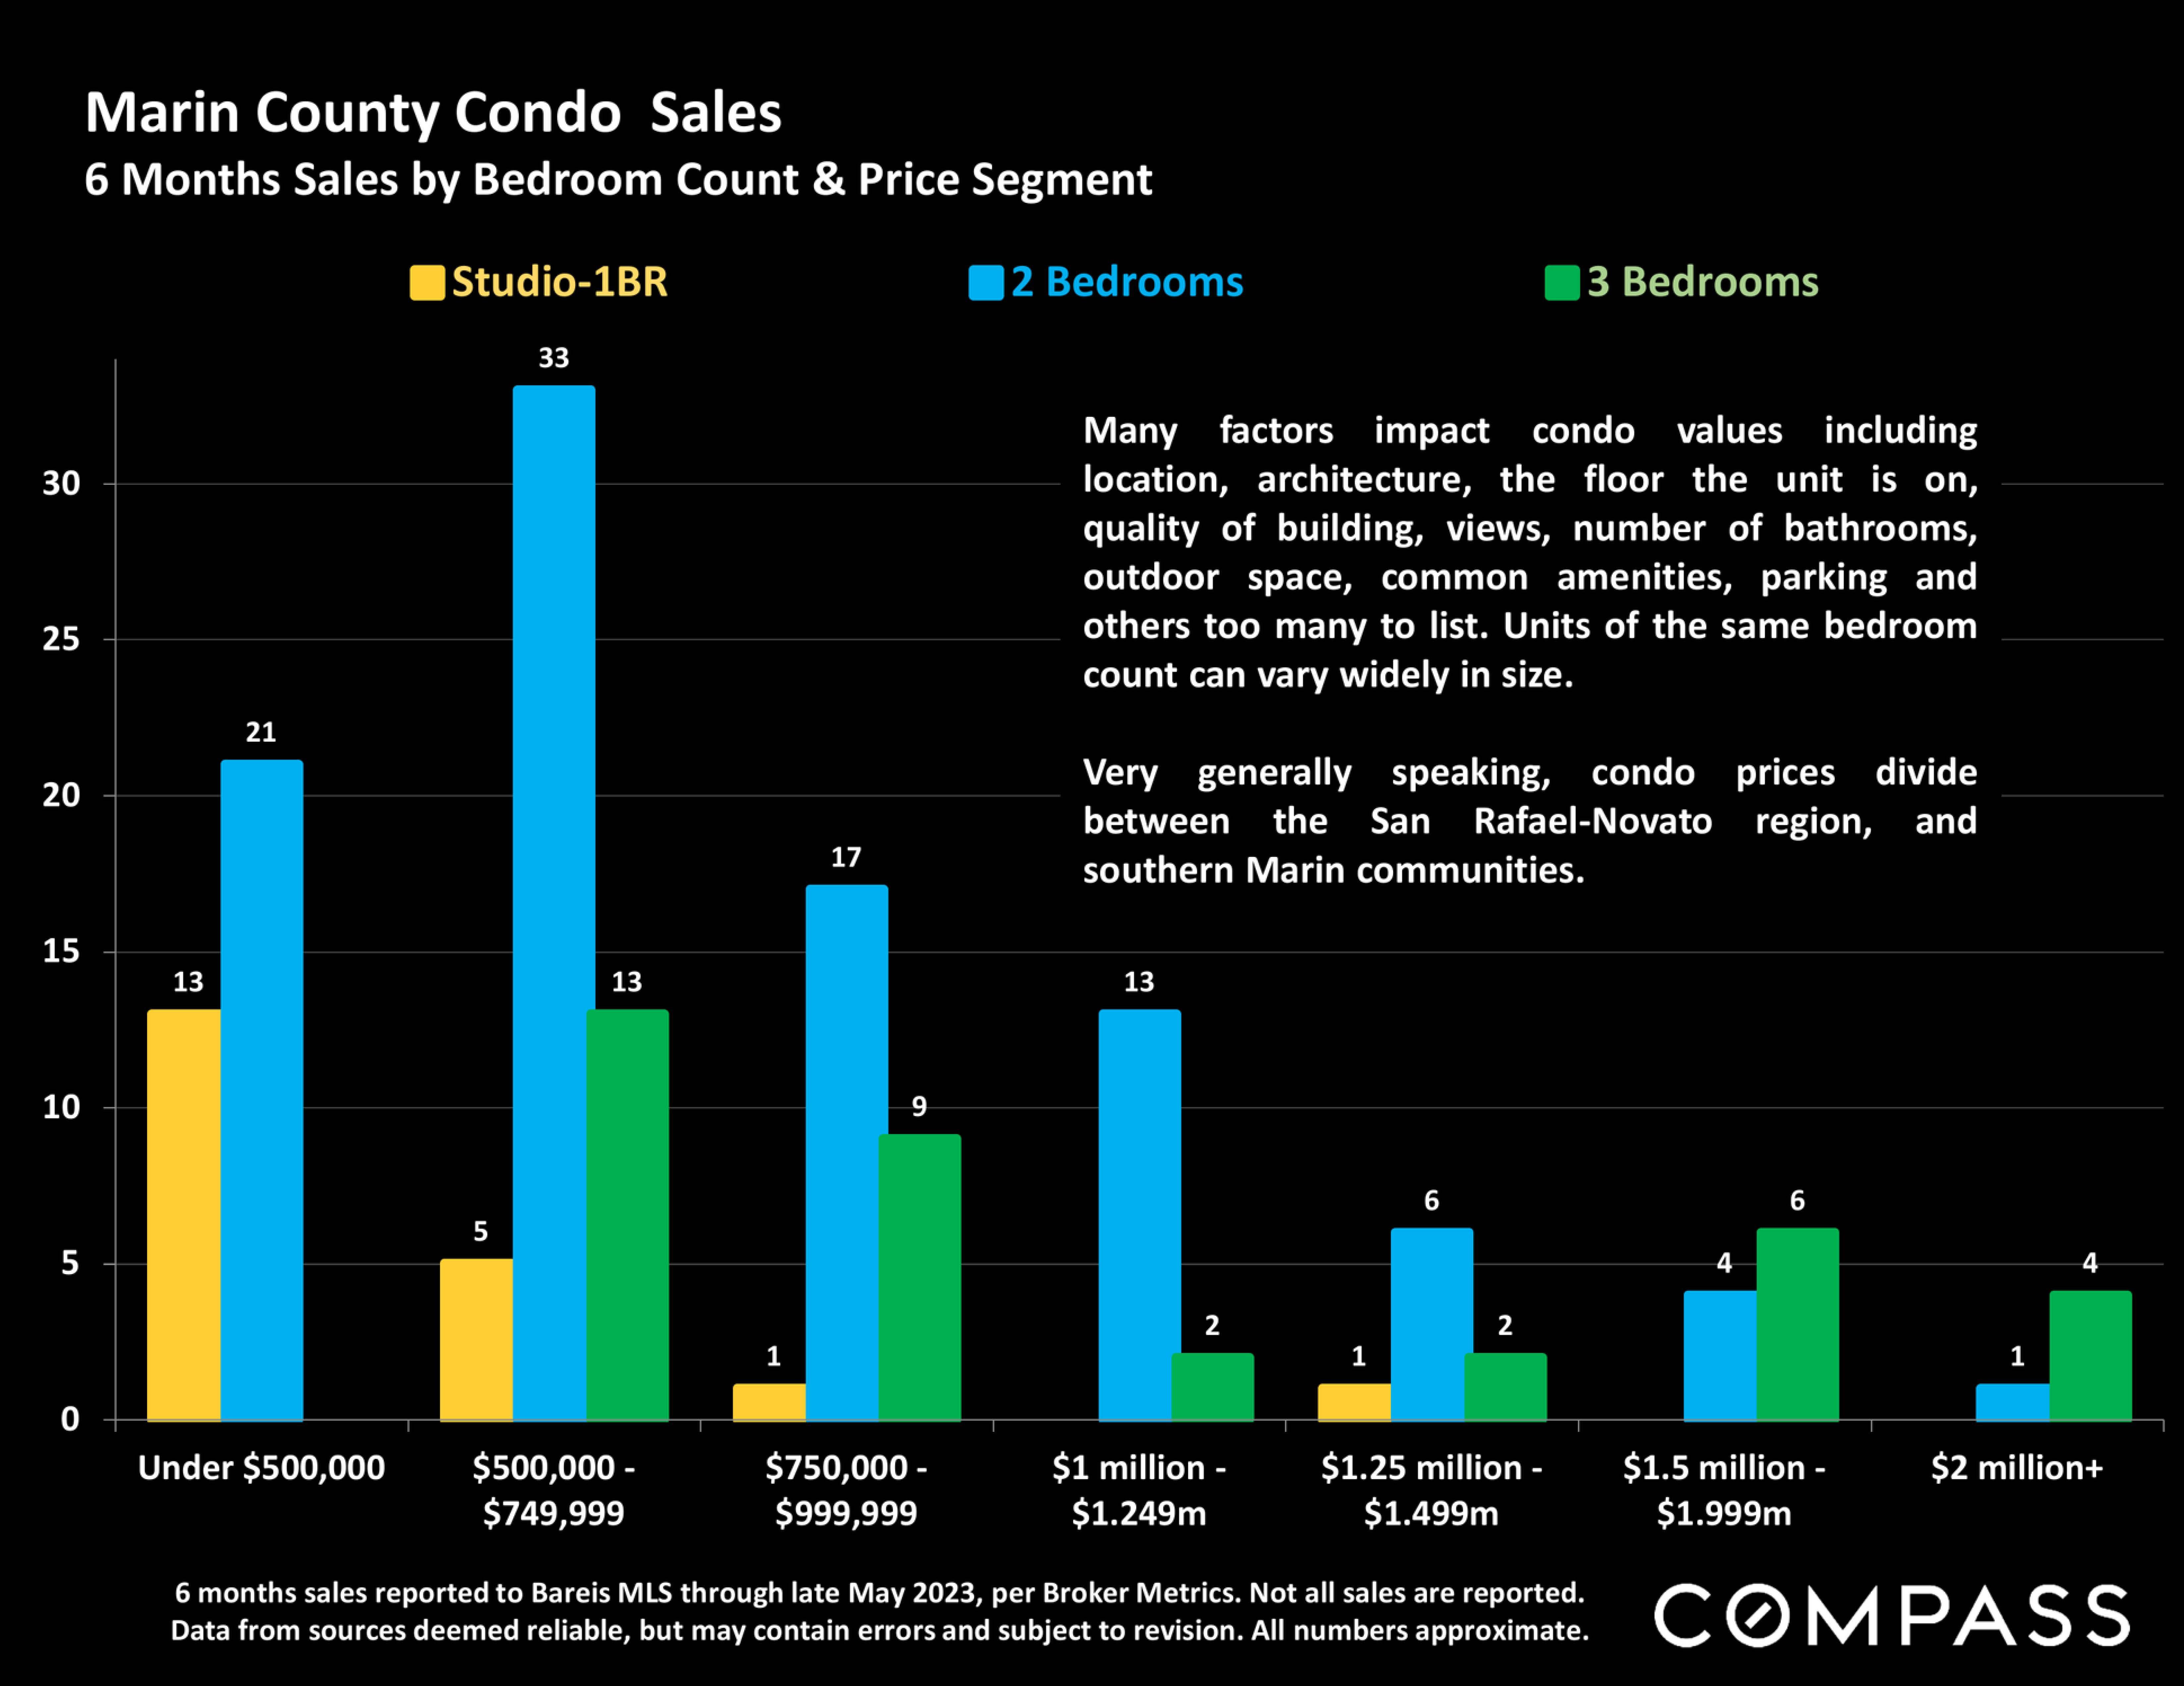
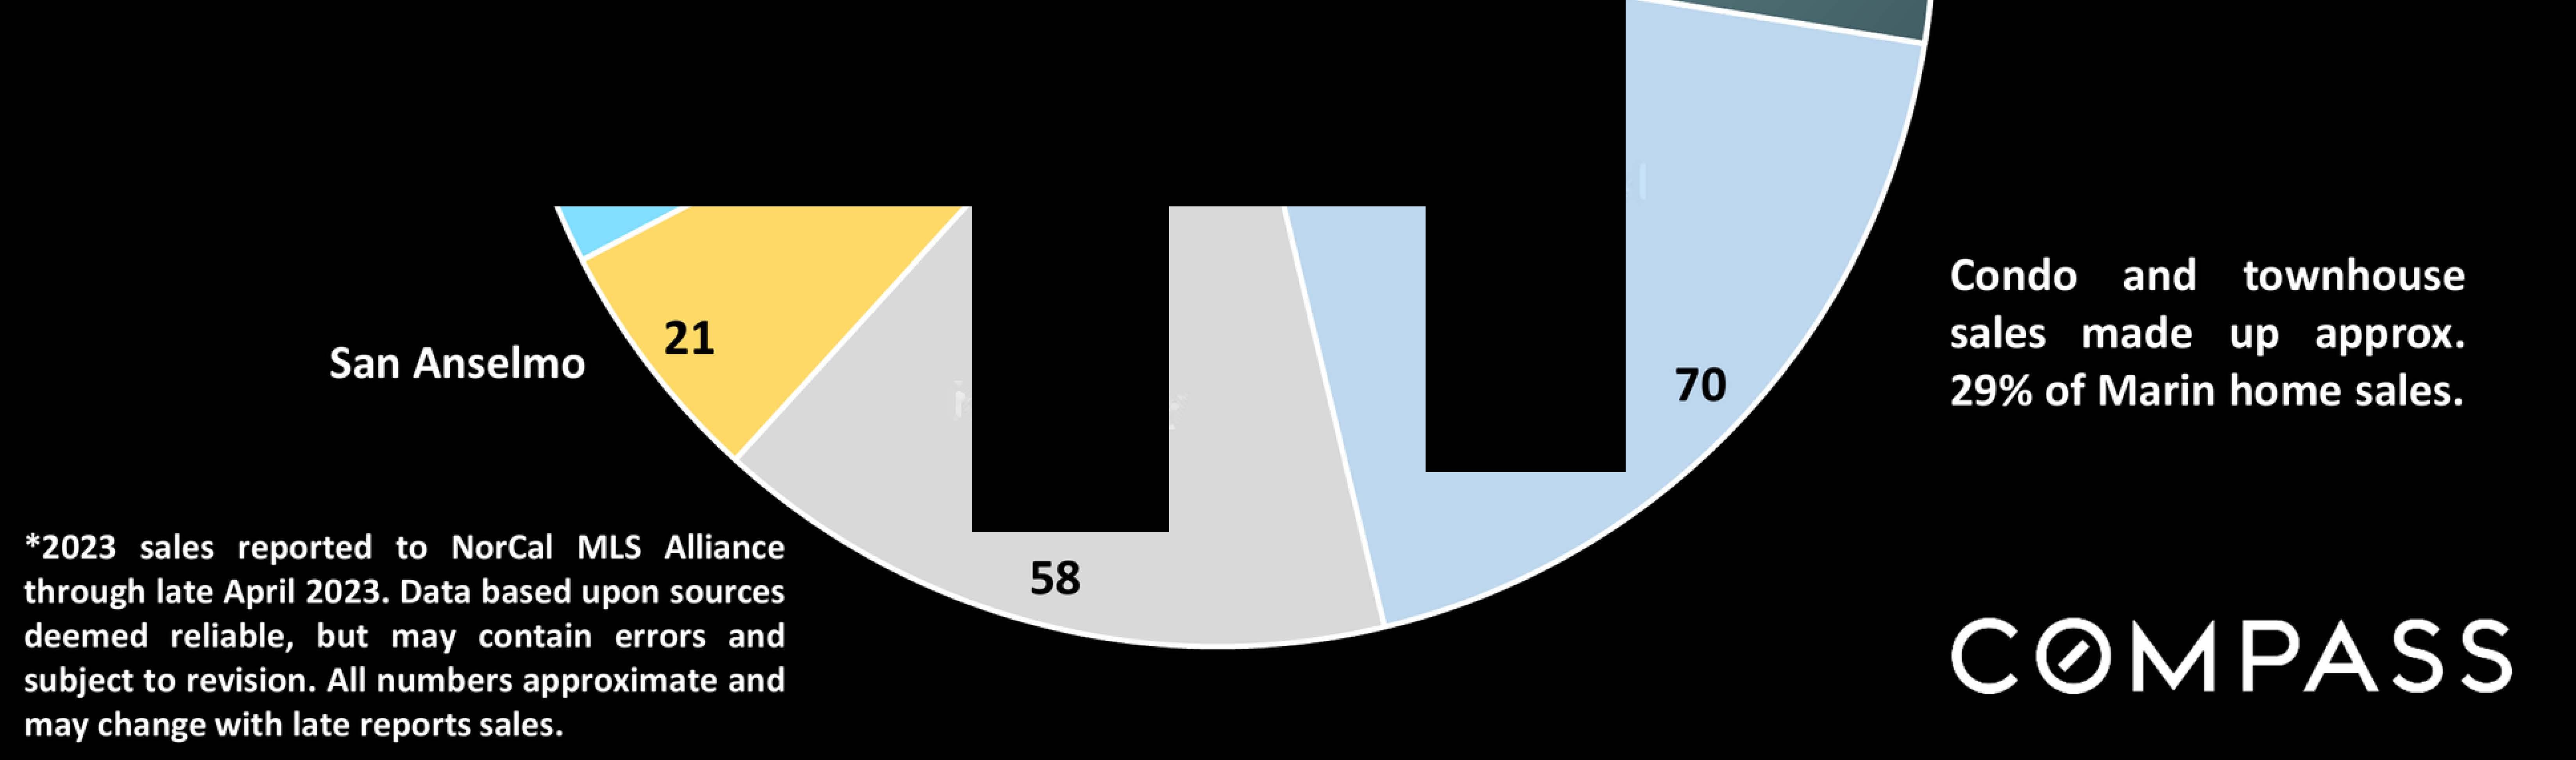
*Over 70% of Marin County's condo and townhouse sales occur in San Rafael and Novato. Median values vary widely between different communities within the county.
*Sales reported to NorCal MLS Alliance during the 4 months through mid-late March 2023. Excluding "fixer uppers." and "below market rate" sales. Counties contain submarkets of widely varying values. Median values fluctuate for reasons besides changes in fair market value. Data from sources deemed reliable, but may contain errors and subject to revision. Numbers approximate, and may change with late reported sales. Some categories within counties saw relatively few sales. Not all sales are reported to MLS.
2 Bedroom, 2 Bath Condos
Bedroom, 2-3 Bath Townhouses County San Francisco San Mateo County Marin County* Santa Clara County Monterey County Alameda County Contra Costa Sonoma County Solano County Median Sales Price $1,250,000 $850,000 $730,000 $727,500 $645,000 $625,000 $555,000 $432,500 $301,500 Median Square Footage 1182 sq.ft. 1090 sq.ft. 1215 sq.ft. 1115 sq.ft. 1152 sq.ft. 1088 sq.ft. 1122 sq.ft. 1069 sq.ft. 989 sq.ft. Median Dollar per Square Foot $1032/sq.ft. $756/sq.ft. $672/sq.ft. $662/sq.ft. $623/sq.ft. $572/sq.ft. $496/sq.ft. $385/sq.ft. $328/sq.ft. Median Sales Price Too few sales $1,389,000 $846,000 $1,200,000 Too few sales $835,000 $732,000 $575,000 Too few sales
3
Median Square Footage 1619 sq.ft. 1681 sq.ft. 1520 sq.ft. 1519 sq.ft. 1546 sq.ft. 1322 sq.ft. Median Dollar per Square Foot $888/sq.ft. $476/sq.ft. $757/sq.ft. $570/sq.ft. $487/sq.ft. $384/sq.ft. C0MPASS

M.;iny ofthese f.aclors' dfects an swlns both positive :1M1 neptive sometimestffHtsaredeeplycoun�r-k11u,1M!le,1.1�nderttlcc.auslnaa fll!uhCKJsln1booml.Economic,pofitic.a,socialandKdoctaJdyryimks
constantly thM\P •nd Inter.ct tn dlffkulMo-predlct �. Markel• chaftflnc de'4�ts un �ttolare pdoally, o, al'lie qultkly and UMll,,.C:t.dyTh•Impactof,s,.clflcfactonc..nYMYbymarketHlrnant

LocalKonomiccondliont. Hlgh-tKhbooms,employment.housincaffotd.lbility. dcwlopmtnt."ttntureupital&fore-Ianliwcstmcnt.pro/anti-businesssentiment,etc.
Intorestratcis Stockmark.is lnflaUonJ ConsumertonflcMnce HOUJehoklwe.Ith:ptrsonal, �nive,governmentaleconomicintlt:f'W:ntions(imh,din1 corpontc,I0\1.debtle-vels by�fed):pcm9/11/2001,post9/2008,post3/2.020

Naturaldlus1er1sucha.sCOVIO,1989Hrthquab,2017-21flru,drou,ht
Domfflic&foreisnmi1r.tion;feder11Iimmi1n1tion�ky;demosraphkdian,es n11�w•·•·...aaesuteta•*•nu& cNdlts,2017SALT�ucclonlt�tatlon Rentalmarket .,.,...,., lntttnat:IOMIeconomk/poliUc.alnenb,e.1. larieoUprke:i.wlrcs.mlllttry/KOnOmlc conflict,forelJneconornkcrlses,'1/11,2015Chinese:i.tockmarli.etCRSh lOC.-,state&NtJonal pollttu Soclalandqi.aalltyoflifelssuel; Crime,honwleuneu, <01tofIMftJ,e<onomkltlequallty,partisanpolltks,etc FIMn<lallndunryIIQnipulatlon,fraud,encineerln1,reckJeunHJ,e.1.funkboncb,s&L collapse,p.-tdatOfYltndil"II,abandOt"1tMn1ofriik"'IM'•&undetwritlnaStandatds,coos &ratlne-a�ncydtceft,lnsicMrtrad�cwor-MVtn&itdlrwtttlnc;lrntloMIt.11ubonnc• C0MPASS
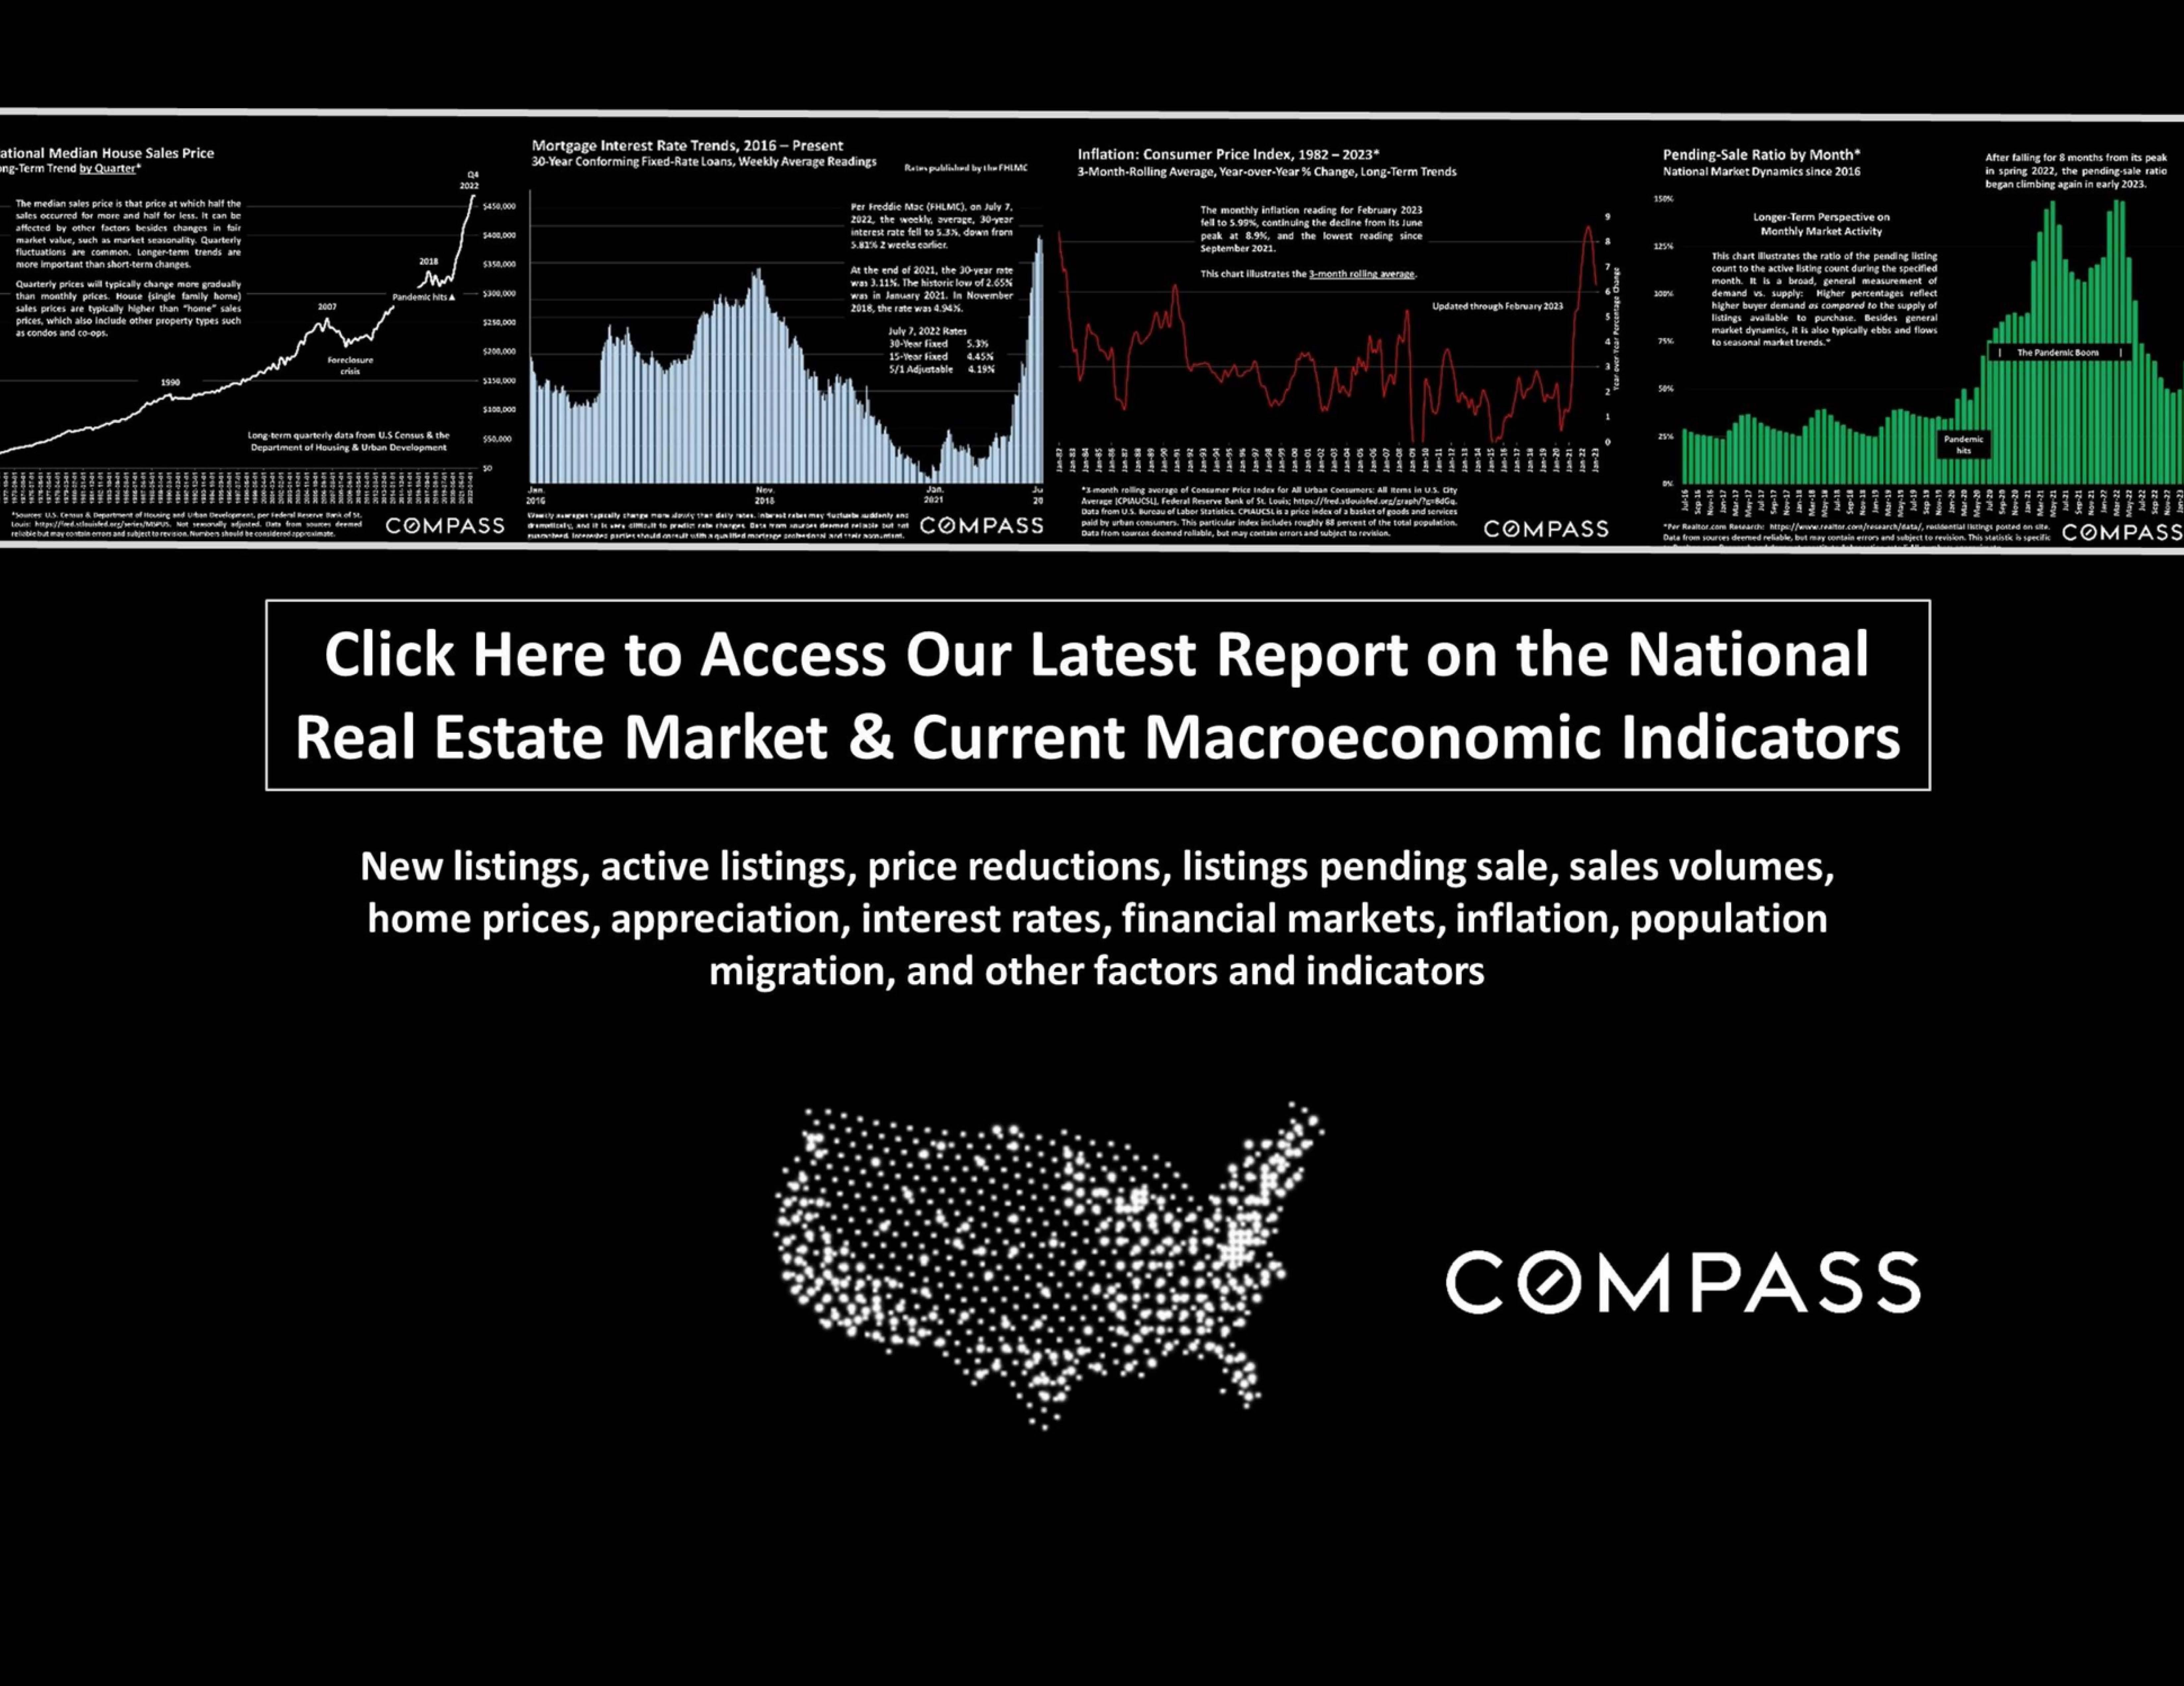
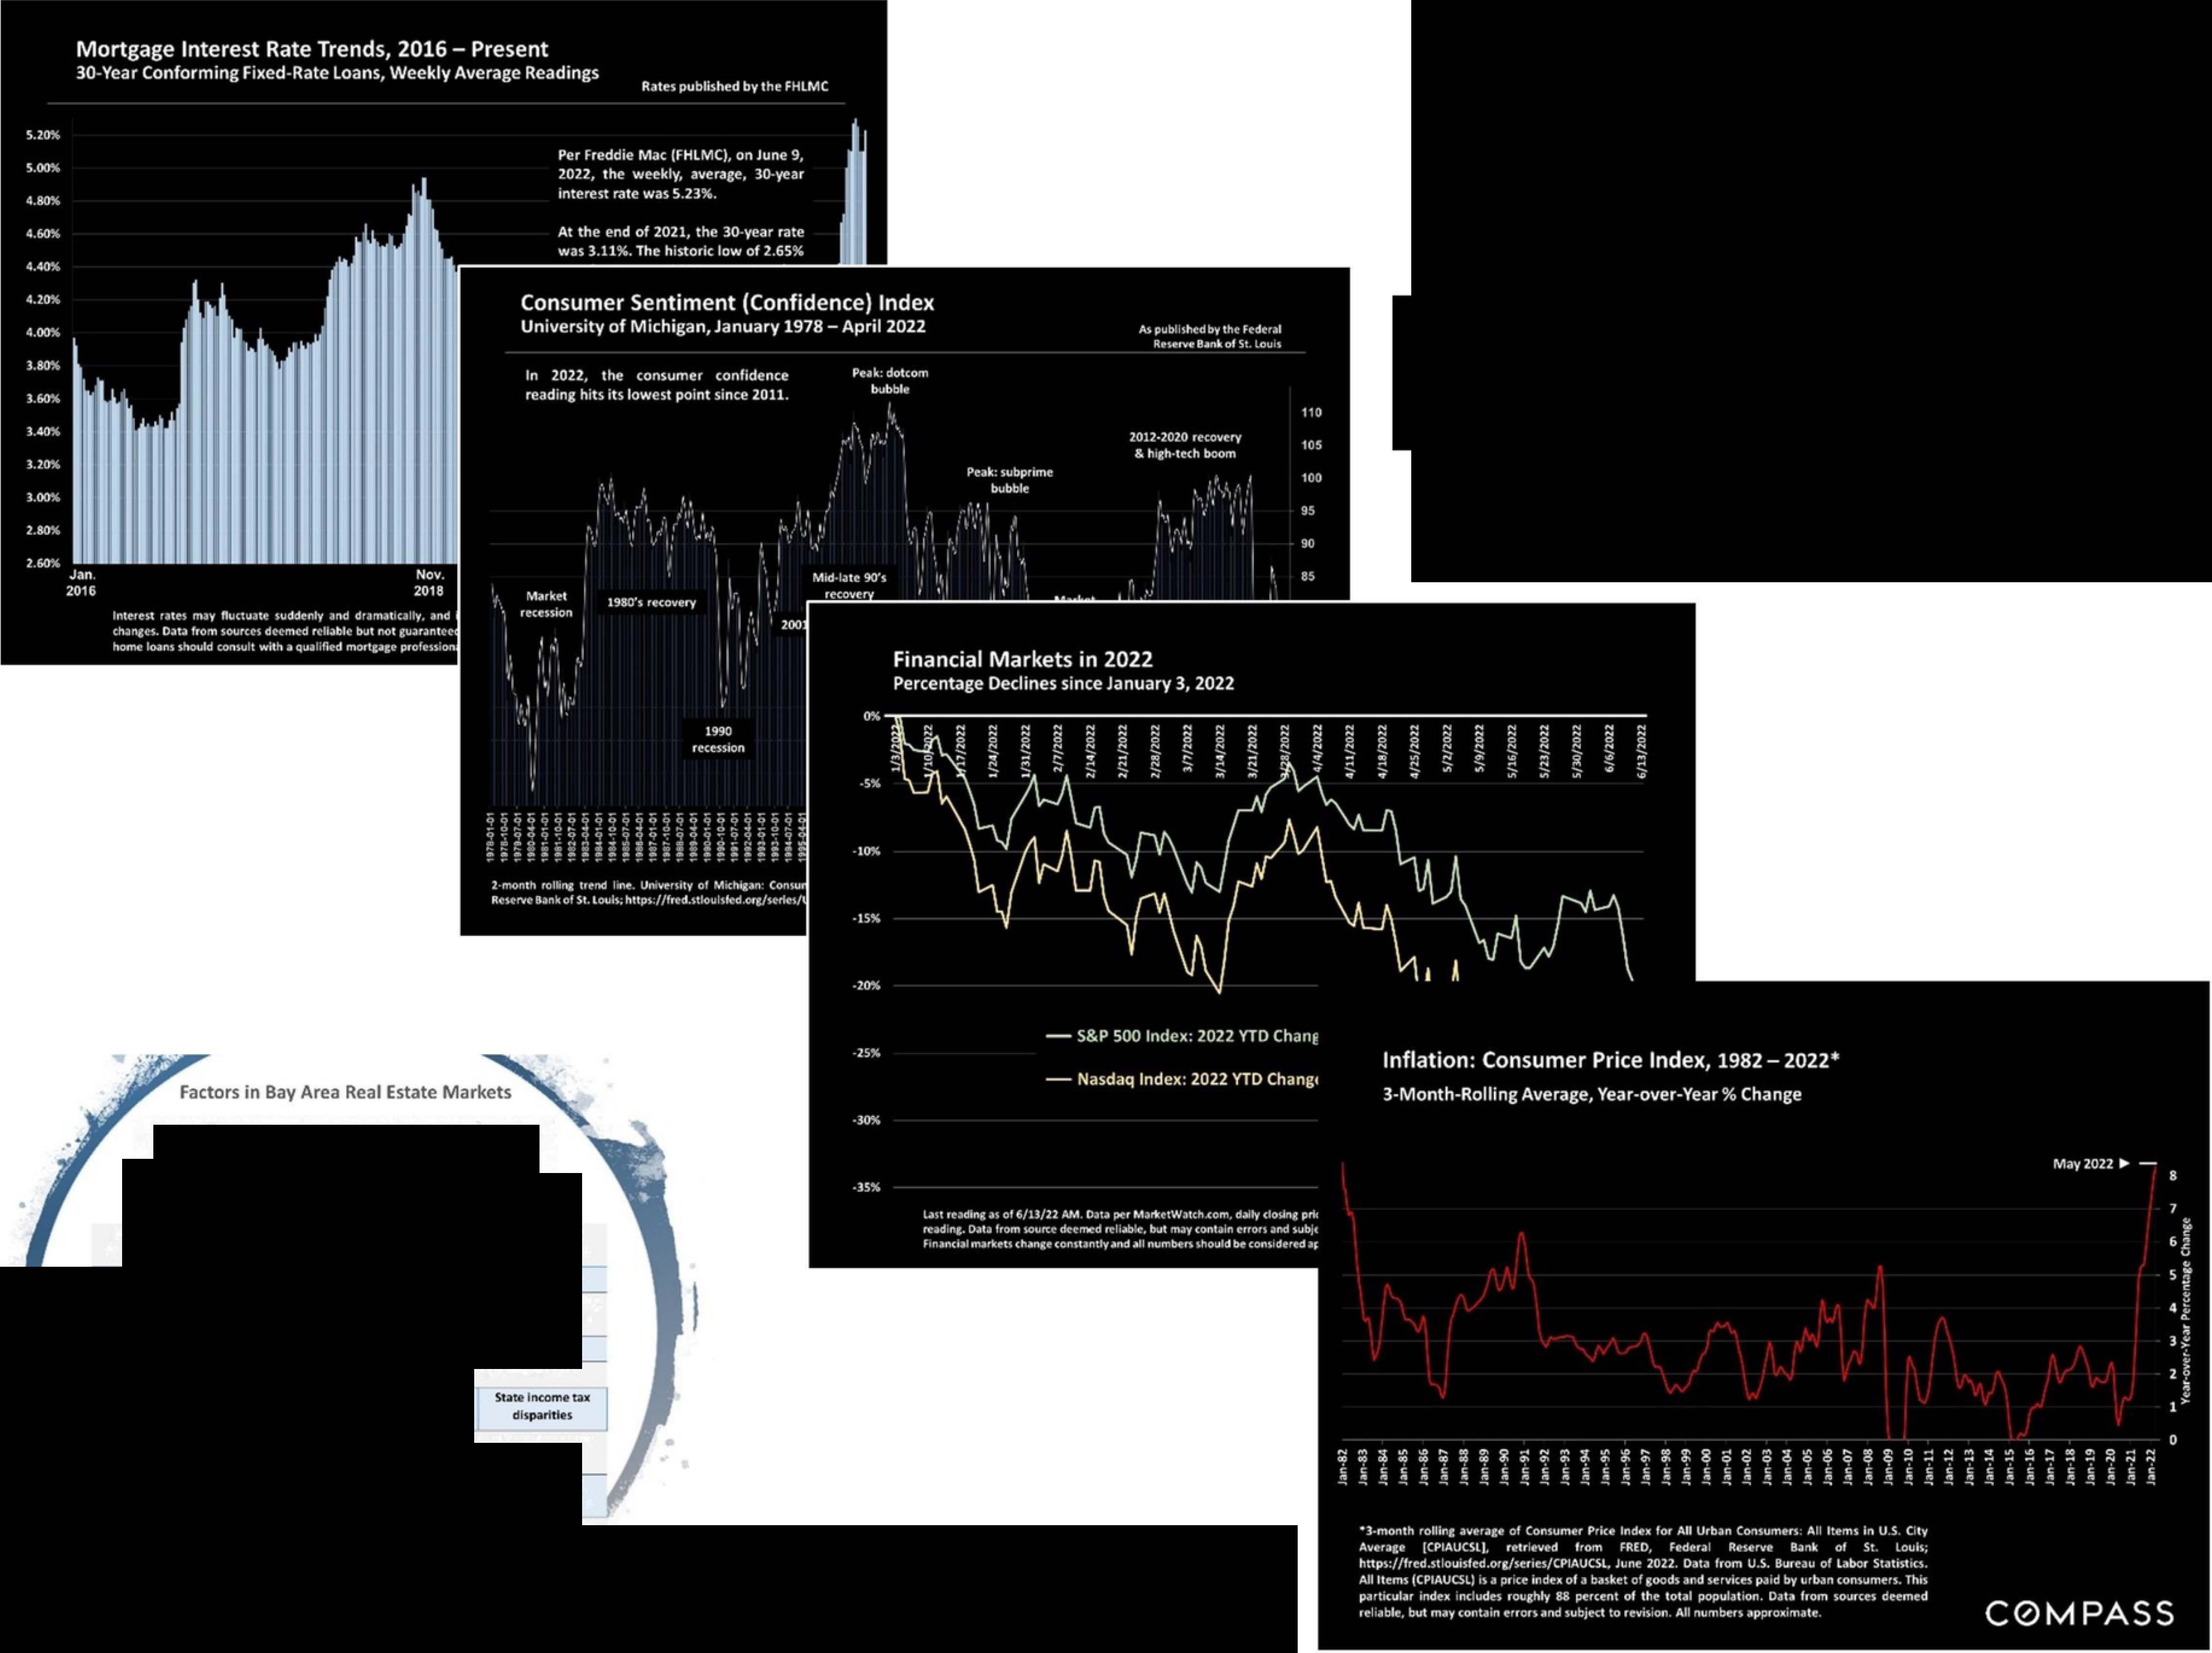
Click Here for Review of Selected Macroeconomic Trends
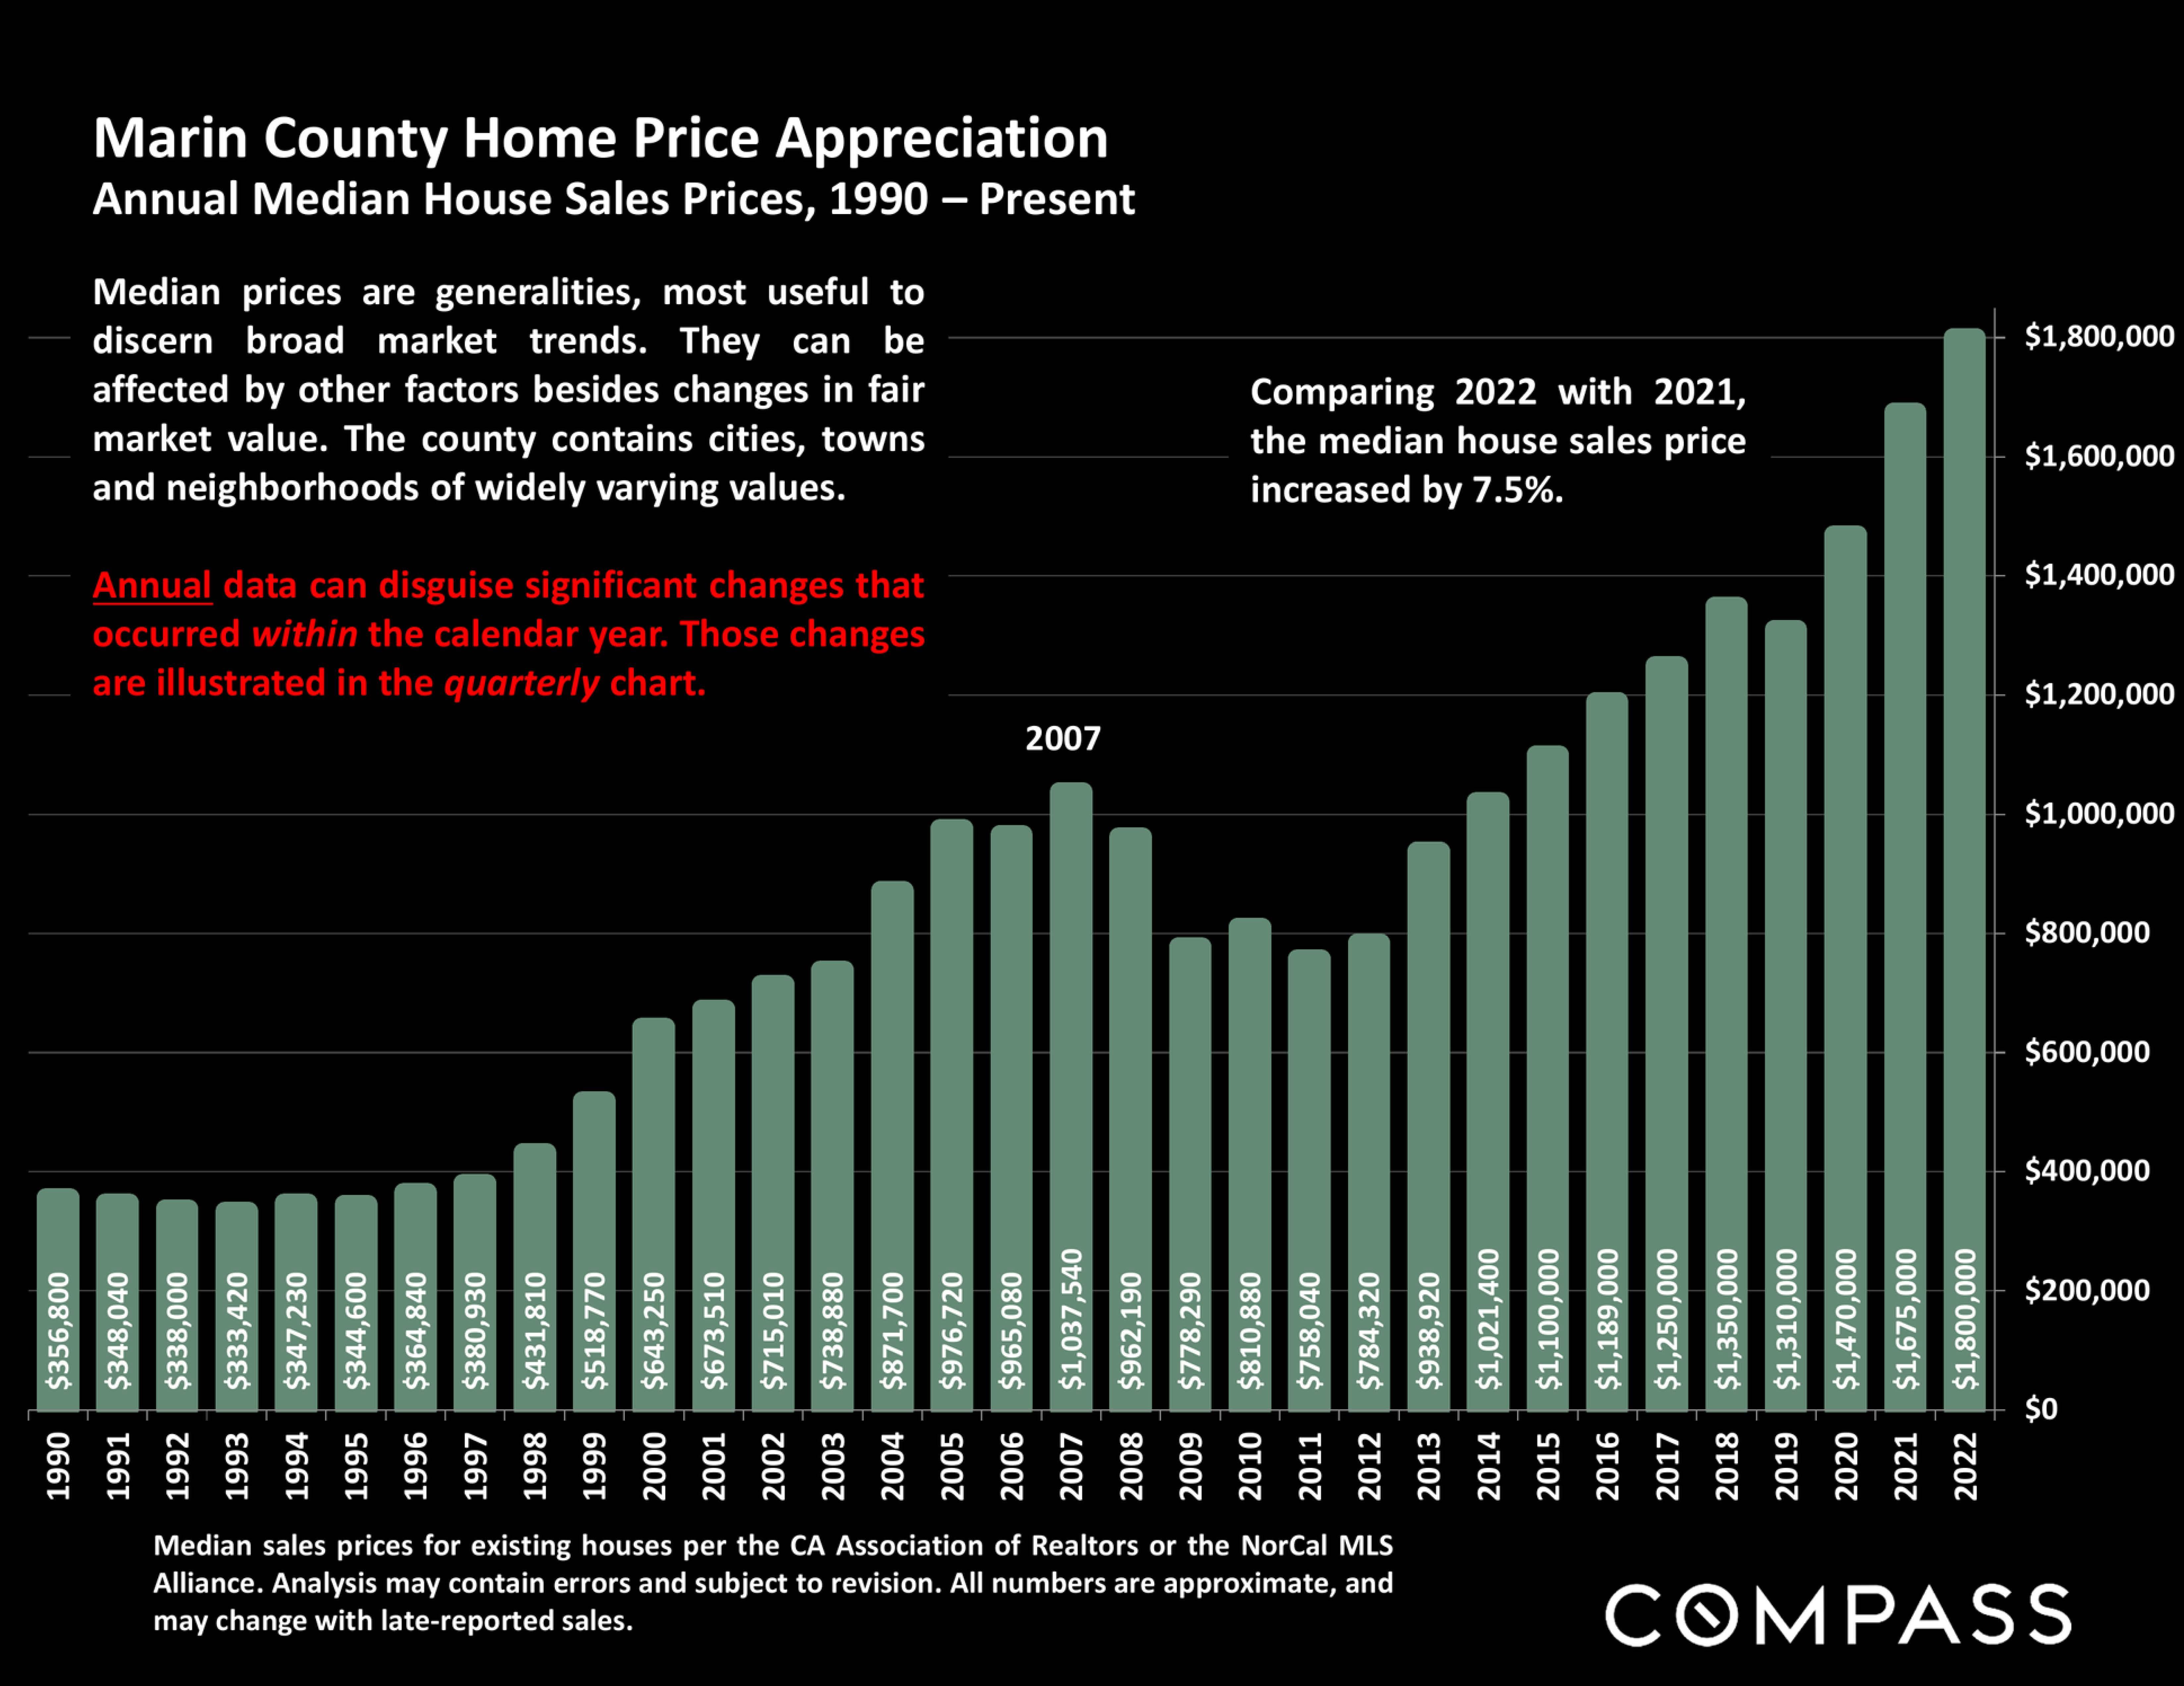
San Francisco Bay Area Home Price Appreciation Trends since 1990

The early 1990's recession, the dotcom boom, subprime bubble and crash, market recovery, high-tech boom - and pandemic.
Important notes and caveats regarding the context and methodology of this report are detailed on the last page. All calculations to be considered very approximate, good-faith estimates. How this report applies to any particular
M pA55 home is unknown without a specific comparative market analysis.

C0
Statistics are generalities, essentially summaries of widely disparate data generated by dozens or hundreds of unique, individual sales occurring within different time periods. They are best seen not as precise measurements, but as broad, comparative indicators, with reasonable margins of error. Anomalous fluctuations in statistics are not uncommon, especially in smaller, expensive market segments. Last period data should be considered estimates that may change with late-reported data. Different analytics programs sometimes define statistics - such as "active listings," "days on market," and "months supply of inventory" - differently: what is most meaningful are not specific calculations but the trends they illustrate. Most listing and sales data derives from the local or regional multi-listing service (MLS) of the area specified in the analysis, but not all listings or sales are reported to MLS and these won't be reflected in the data. "Homes" signifies real-property, single-household housing units: houses, condos, co-ops, townhouses, duets and TICs (but not mobile homes), as applicable to each market. City/town names refer specifically to the named cities and towns, unless otherwise delineated. Multi-county metro areas will be specified as such. Data from sources deemed reliable, but may contain errors and subject to revision. All numbers to be considered approximate.
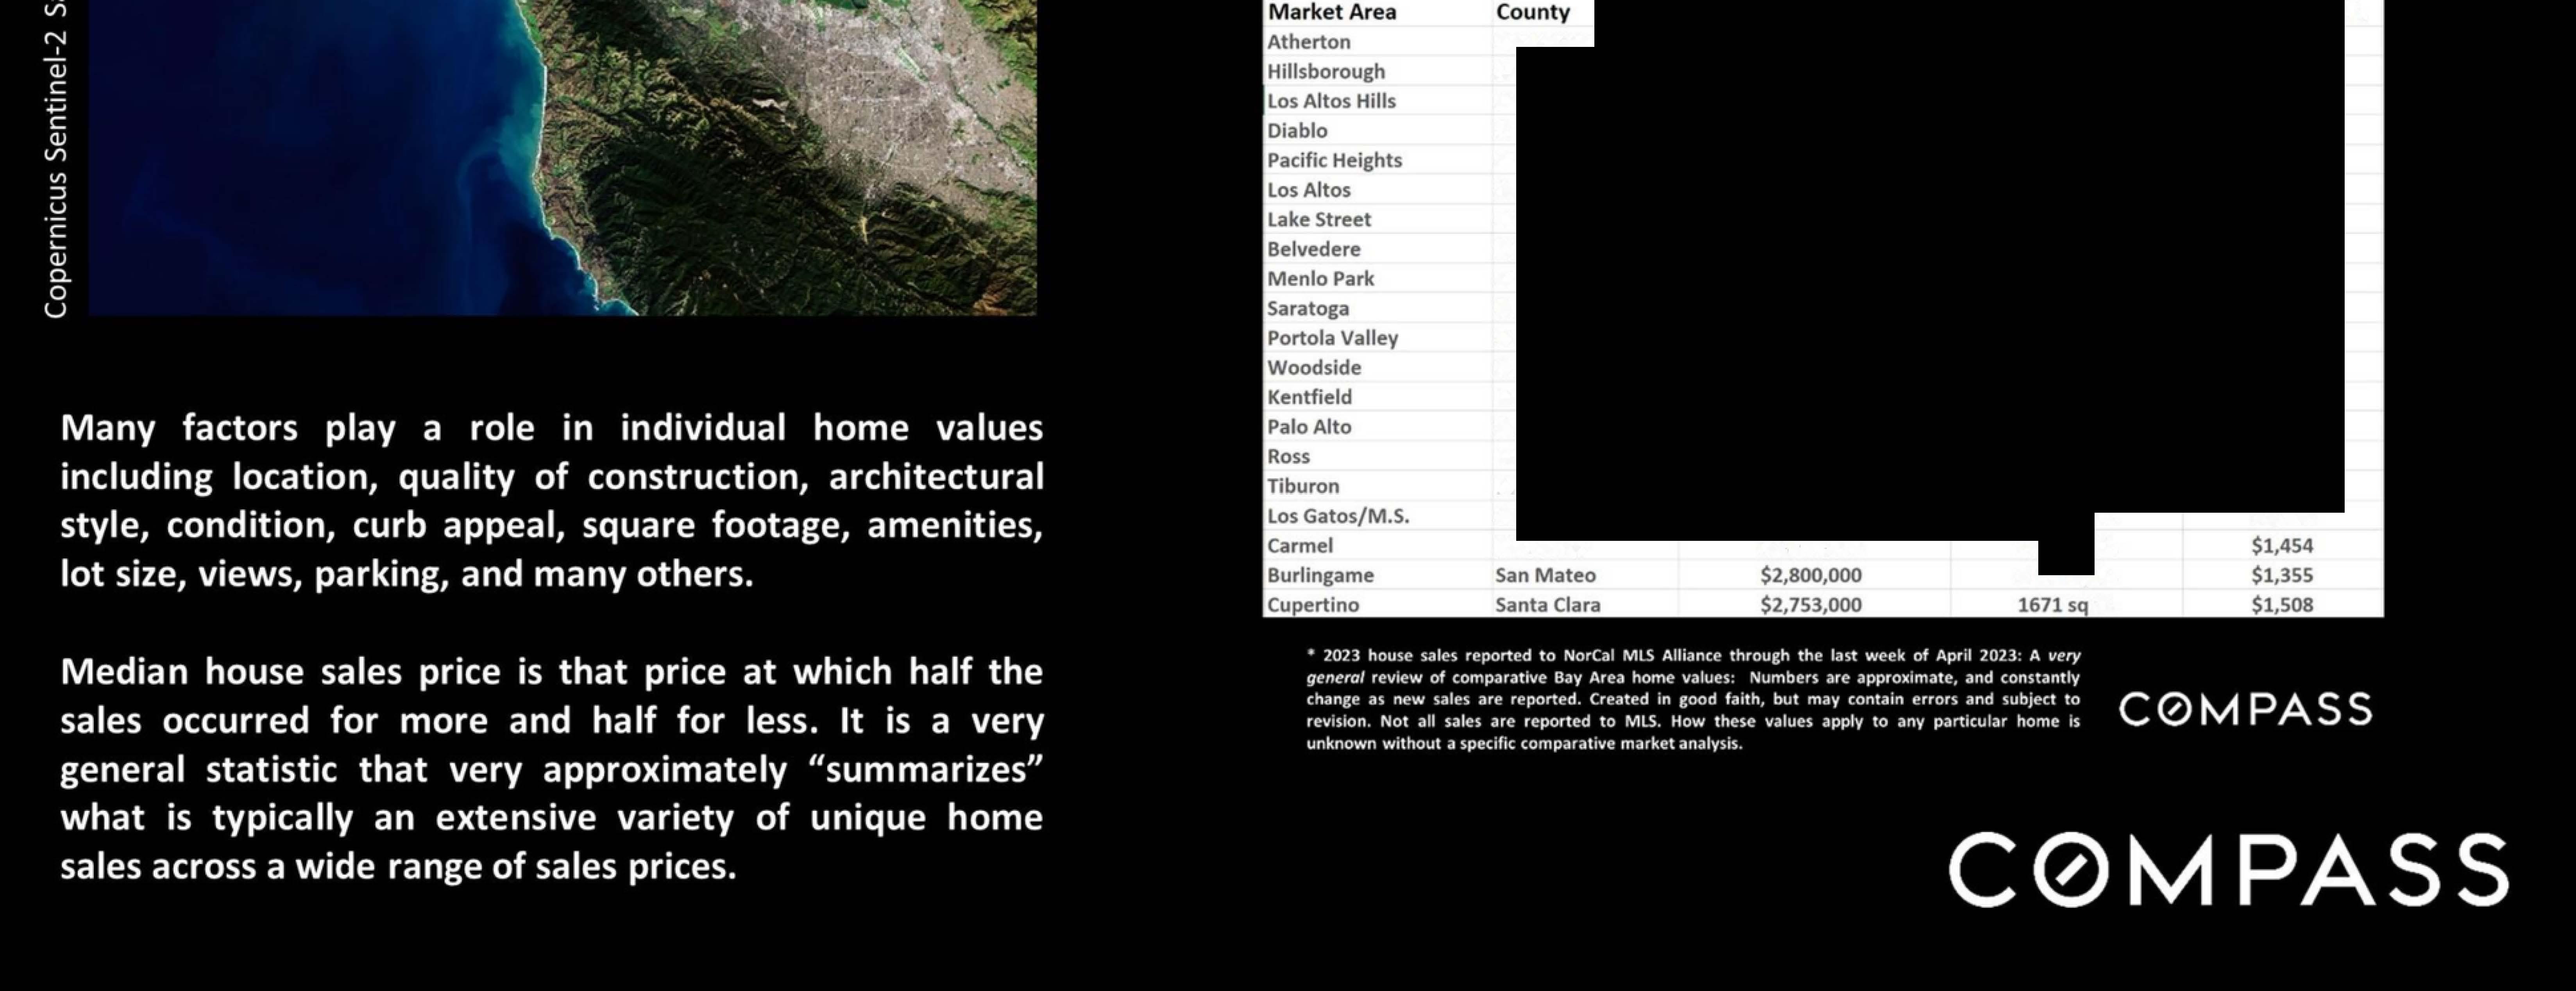
Many aspects of value cannot be adequately reflected in median and average statistics: curb appeal, age, condition, amenities, views, lot size, quality of outdoor space, "bonus" rooms, additional parking, quality of location within the neighborhood, and so on. How any of these statistics apply to any particular home is unknown without a specific comparative market analysis.
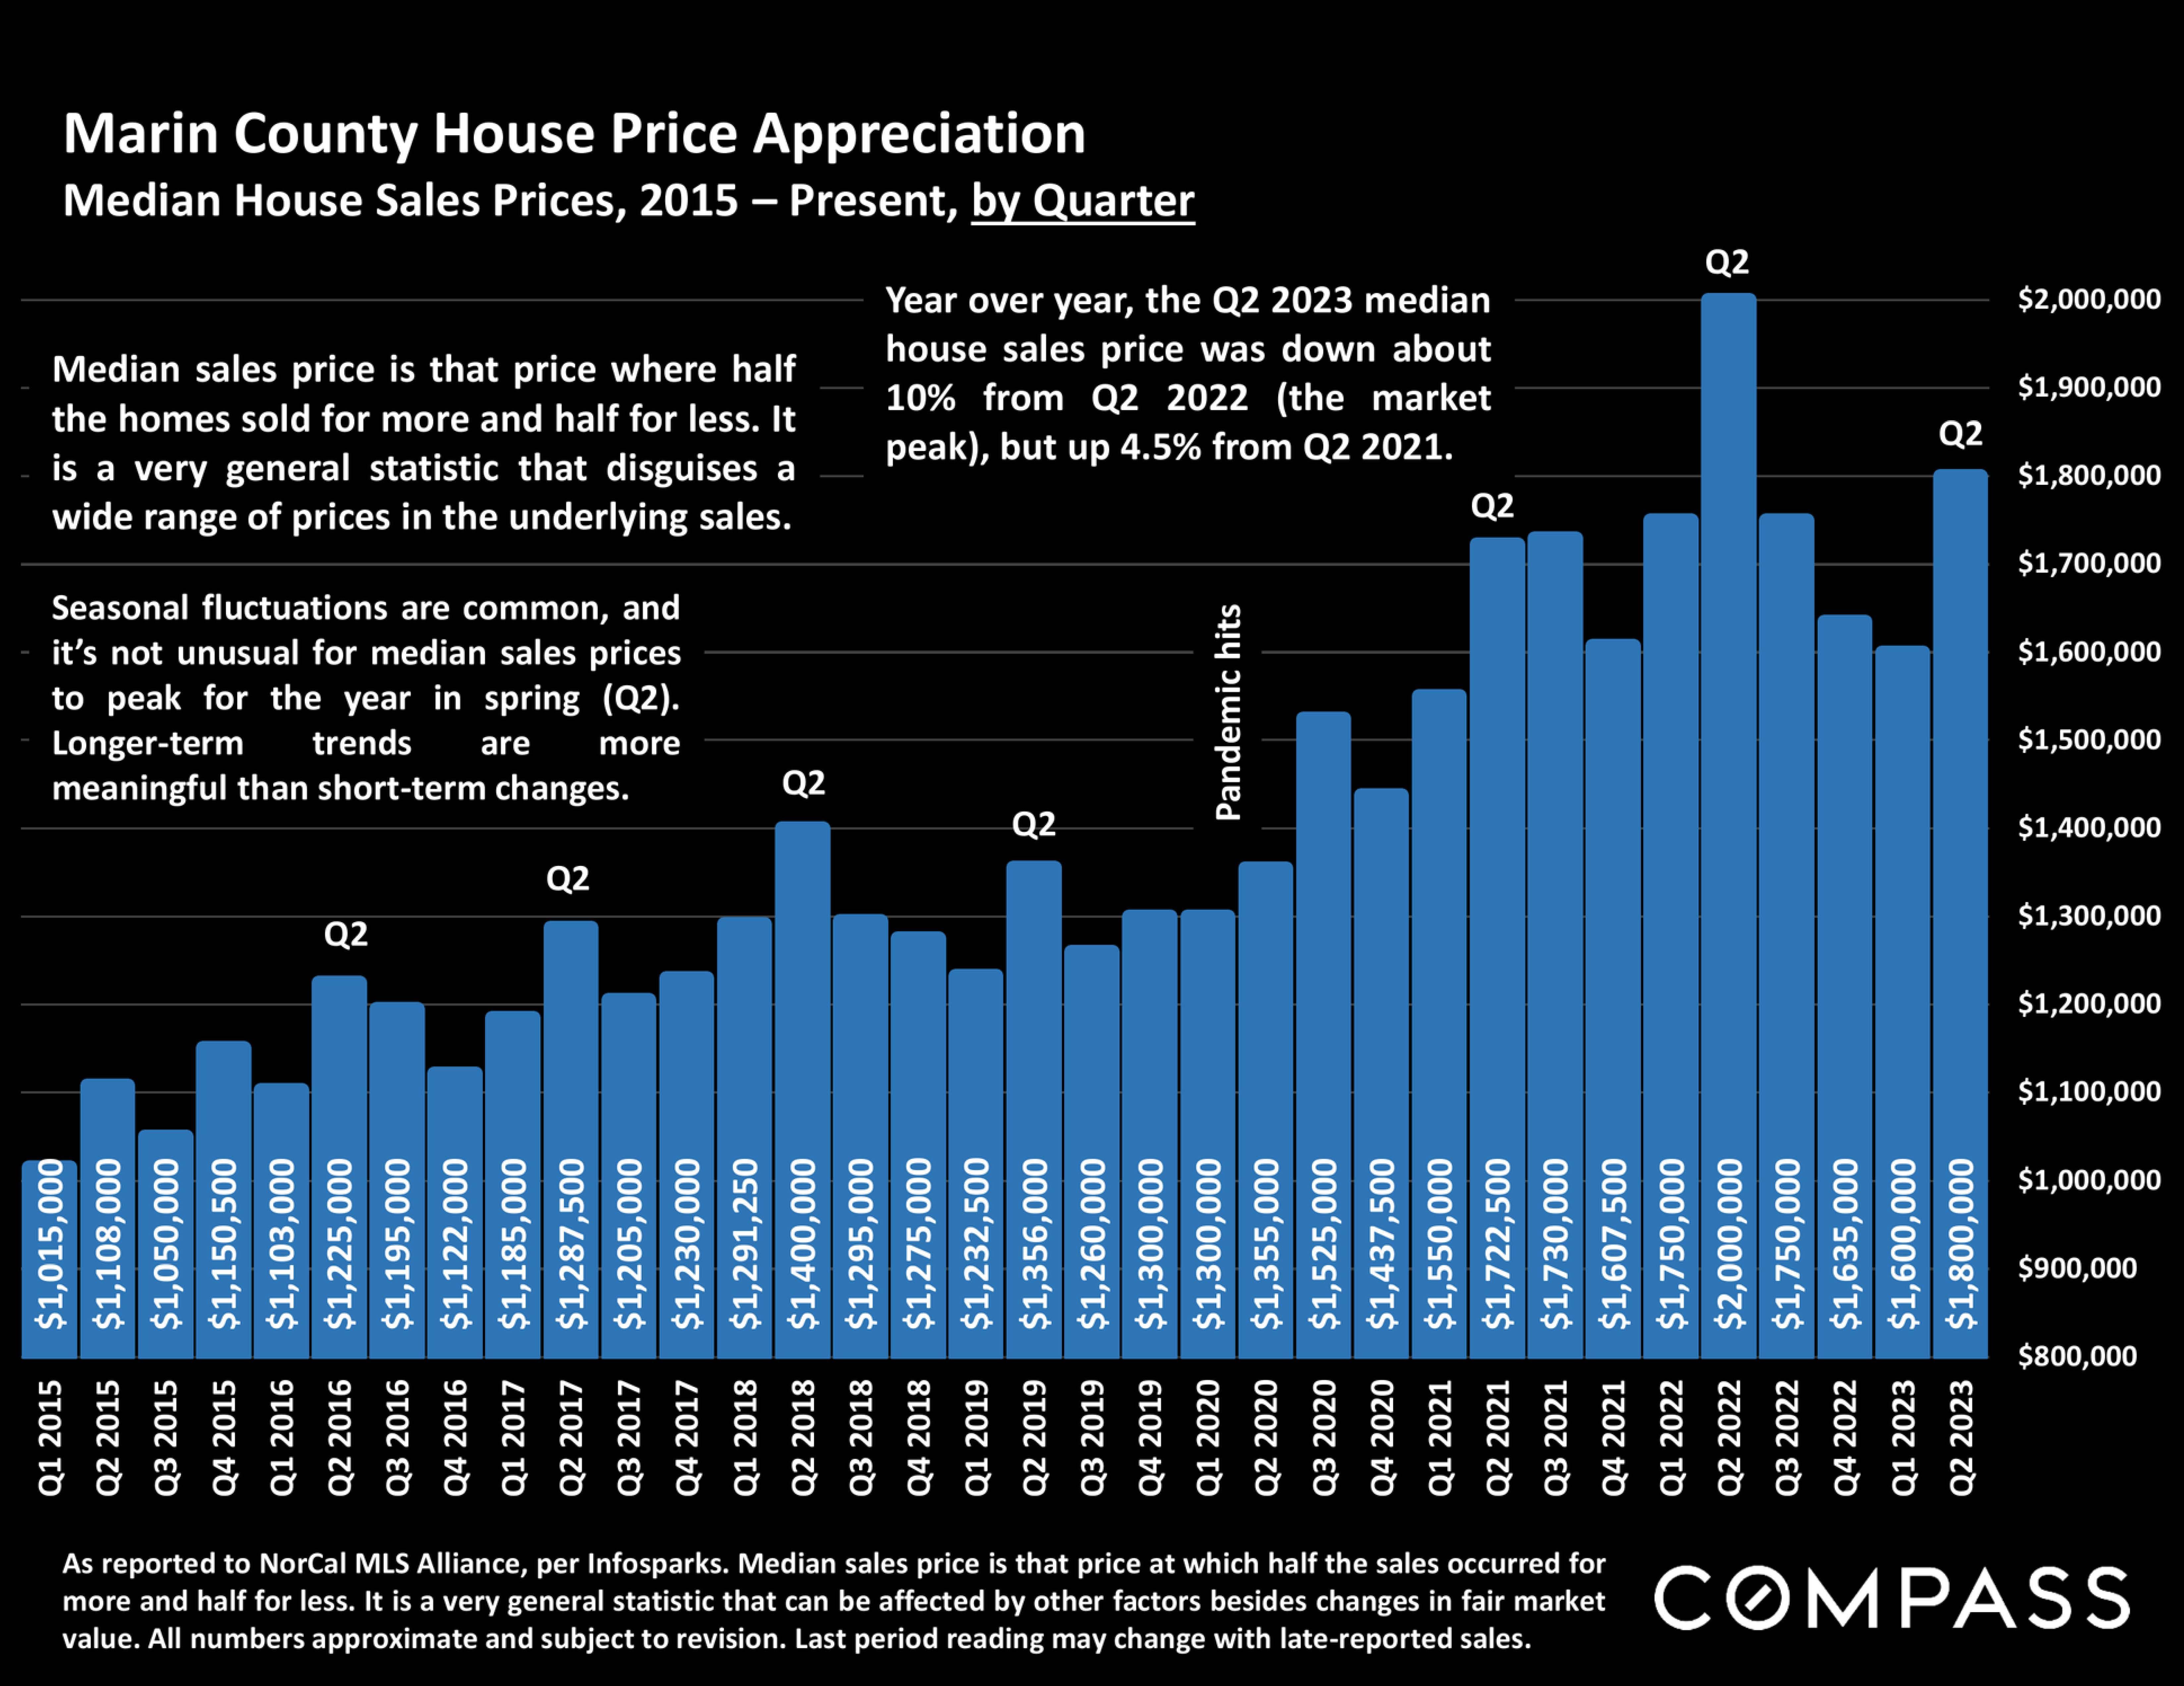
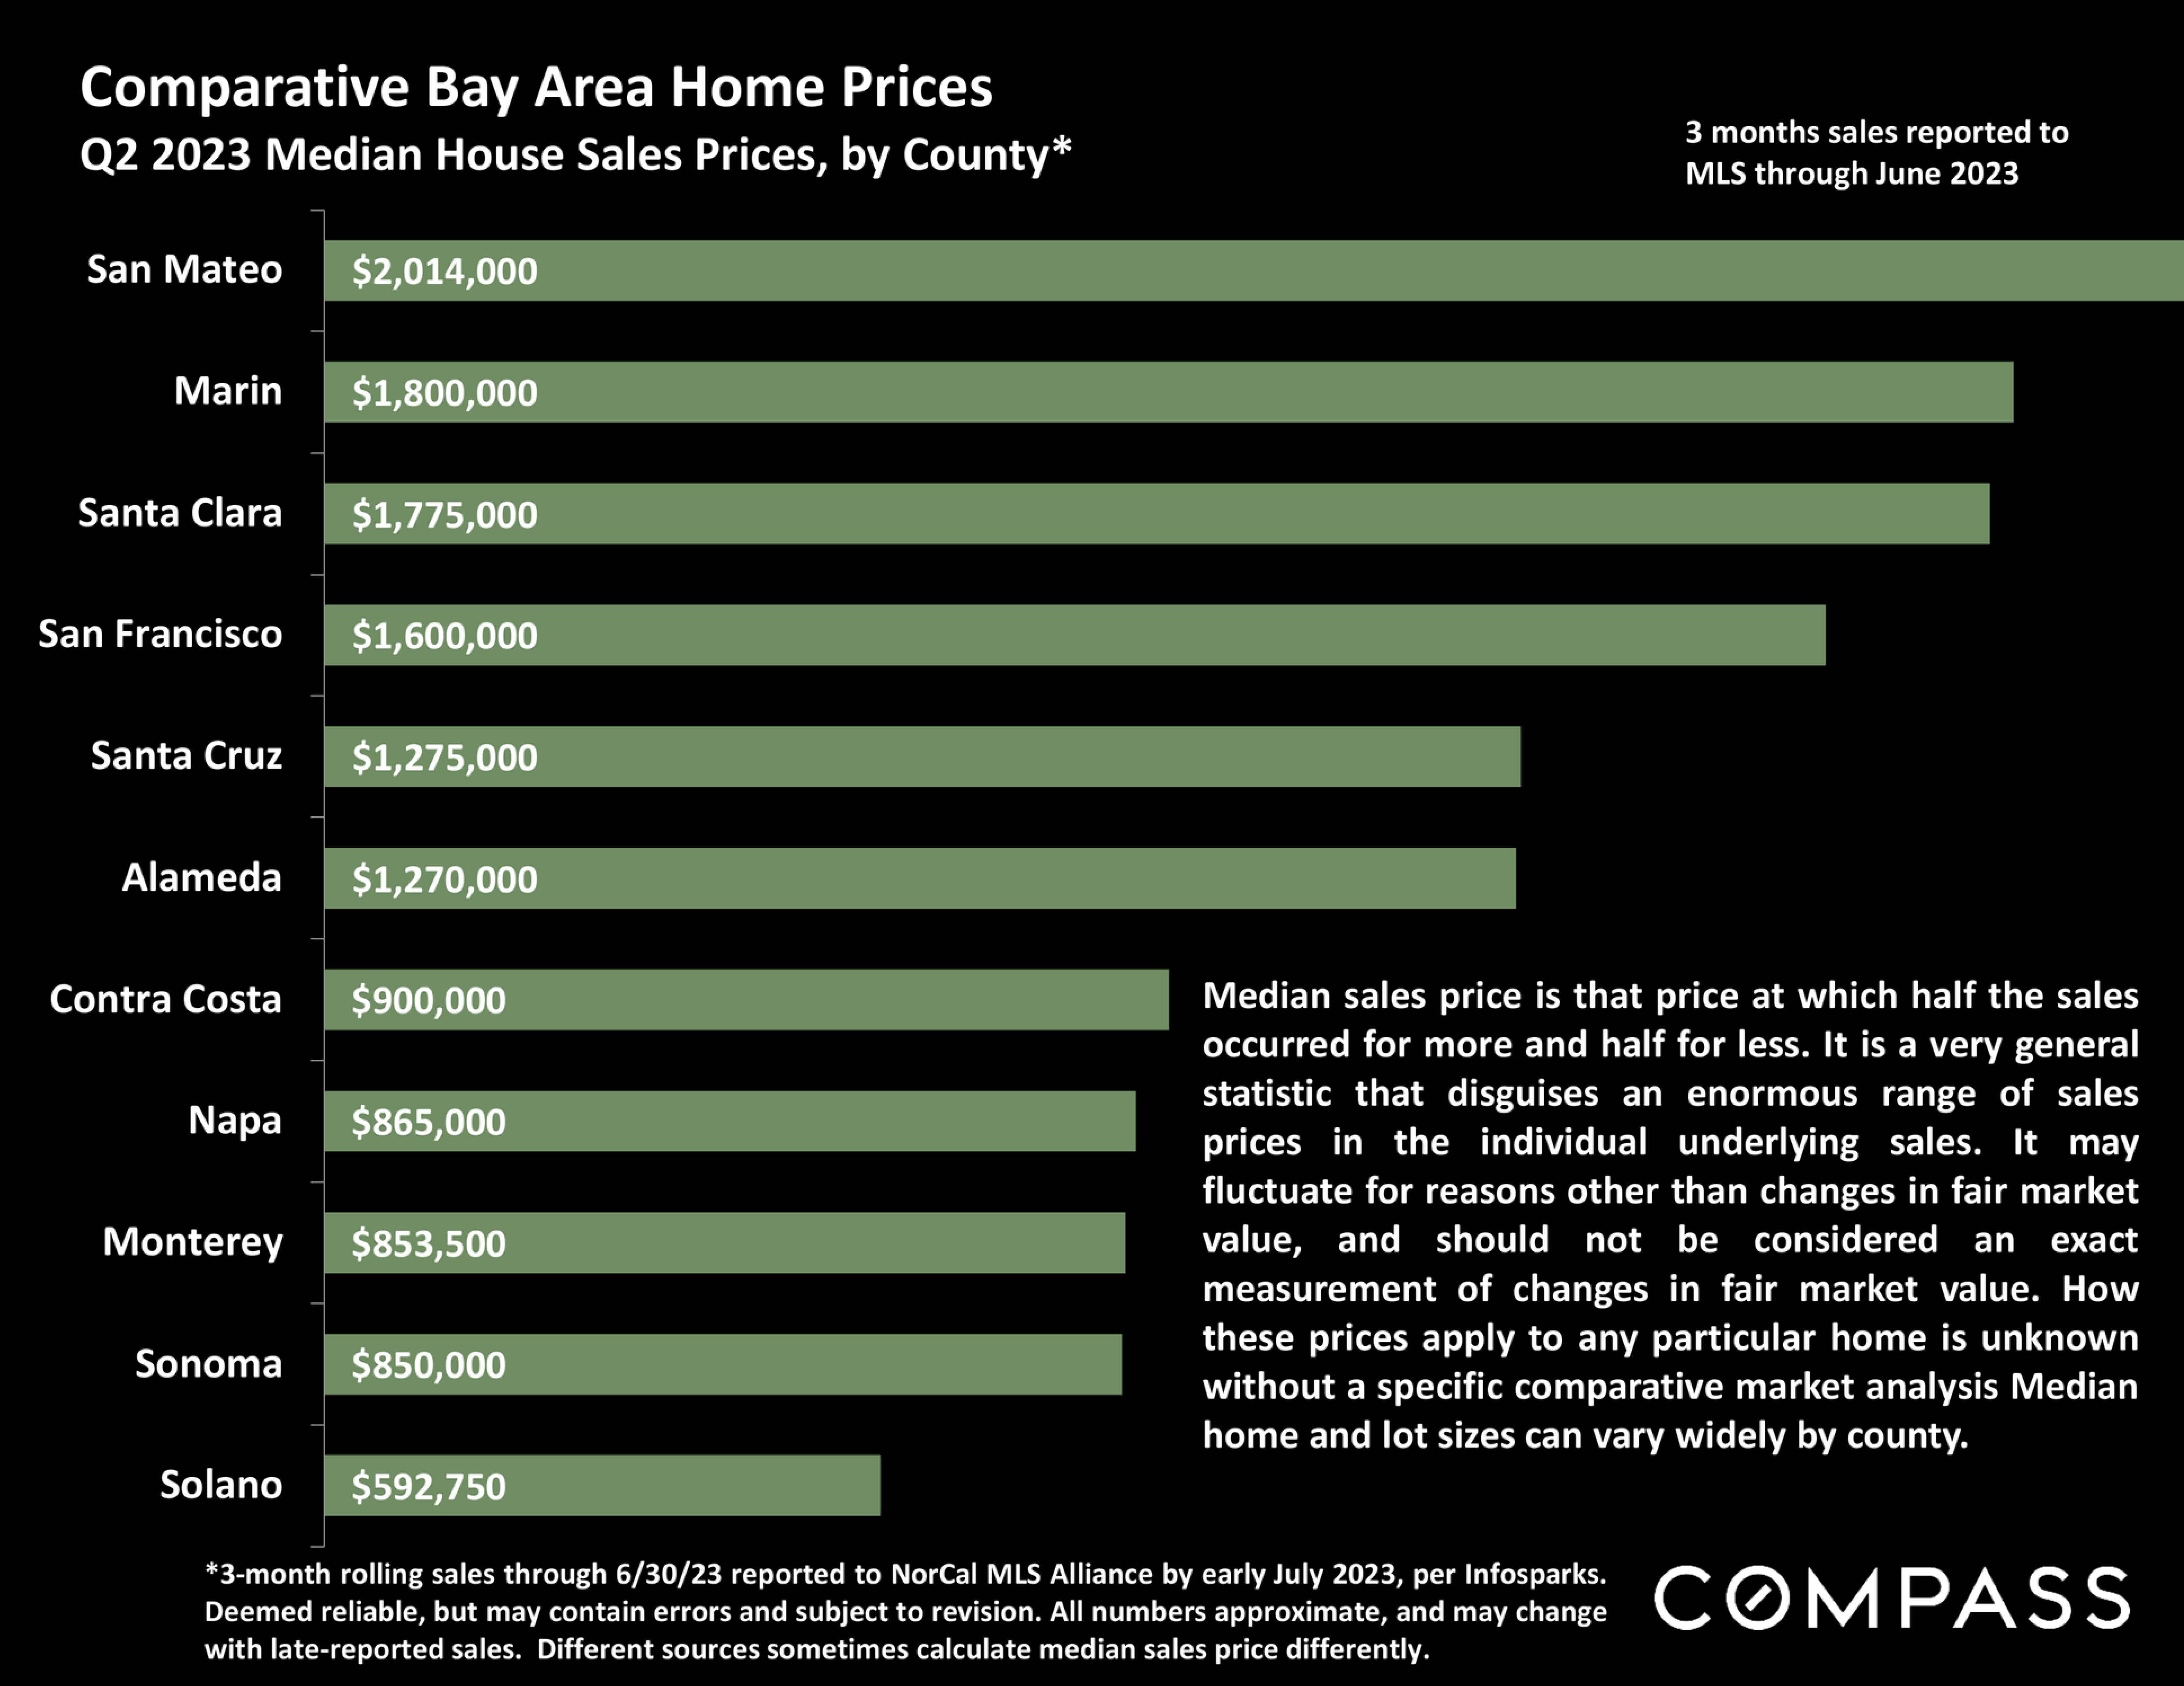
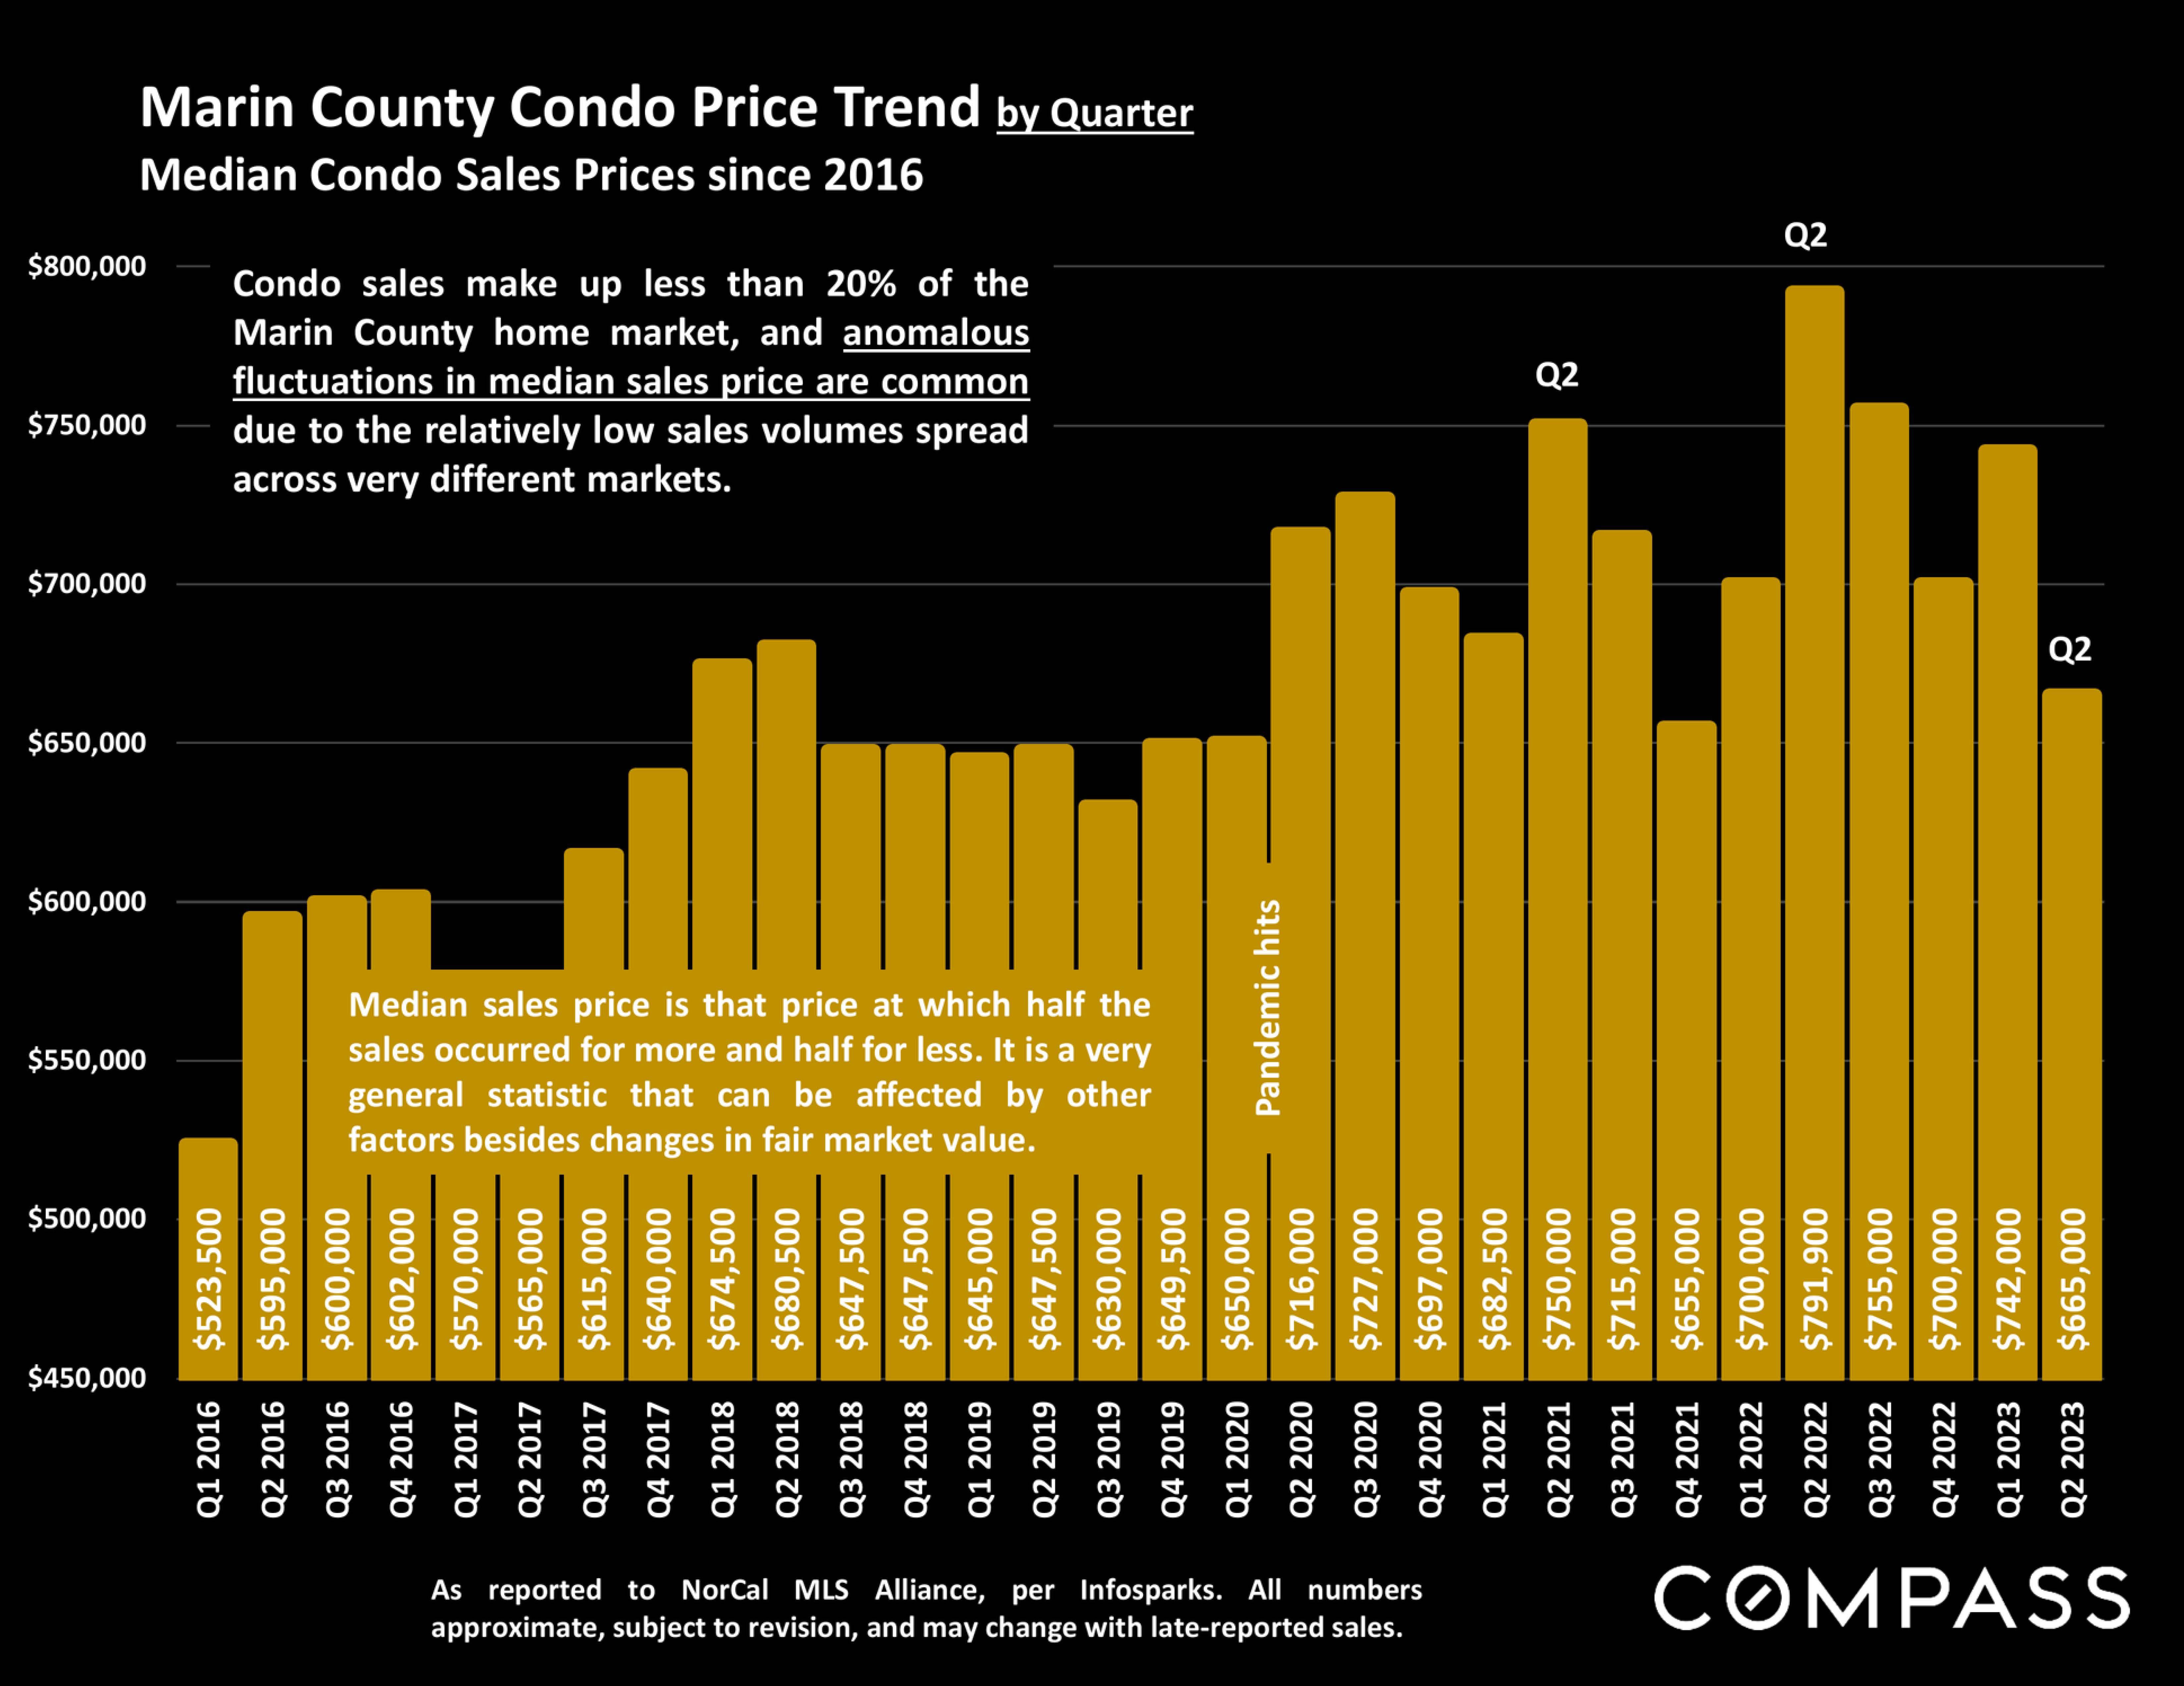
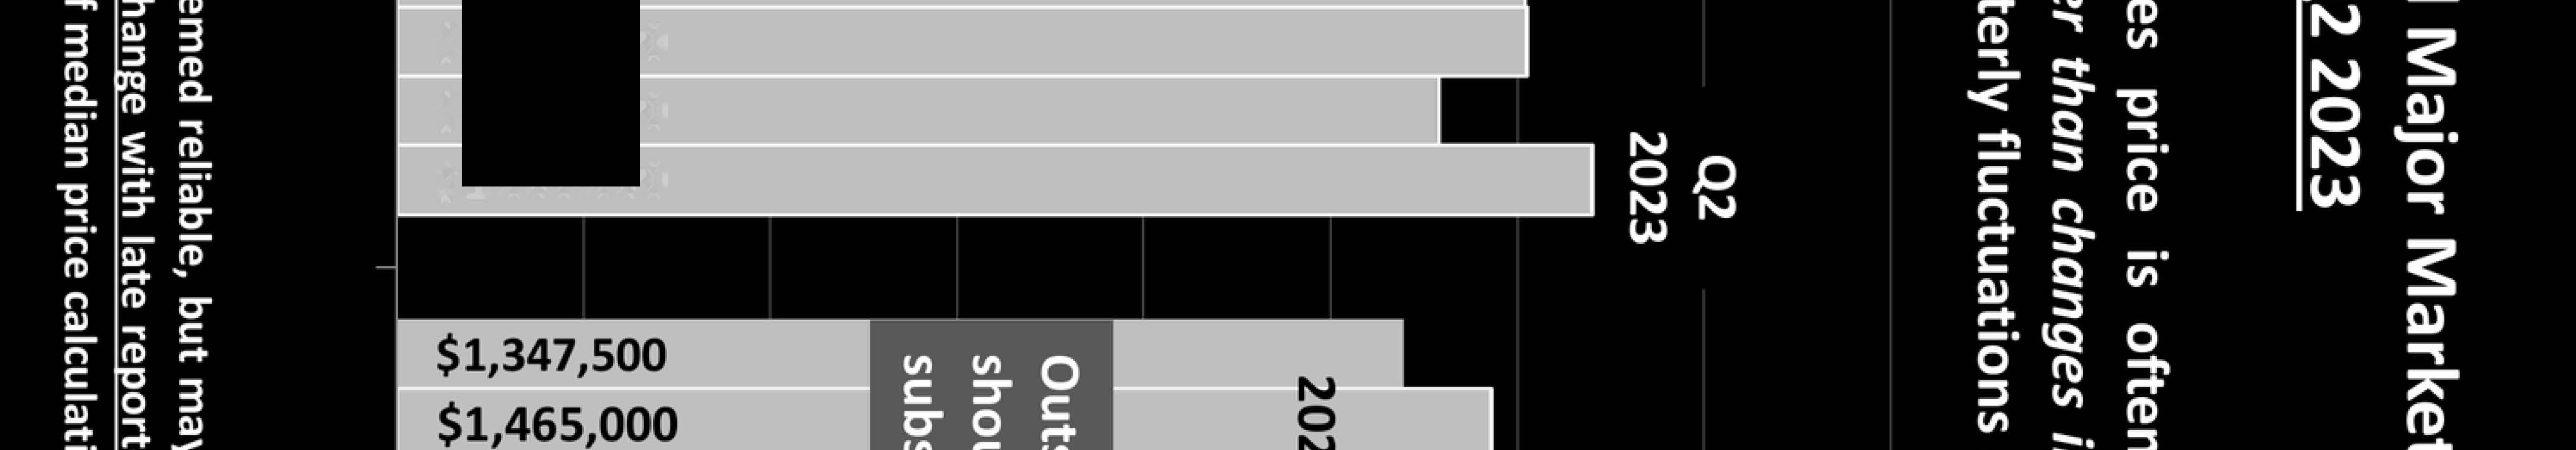
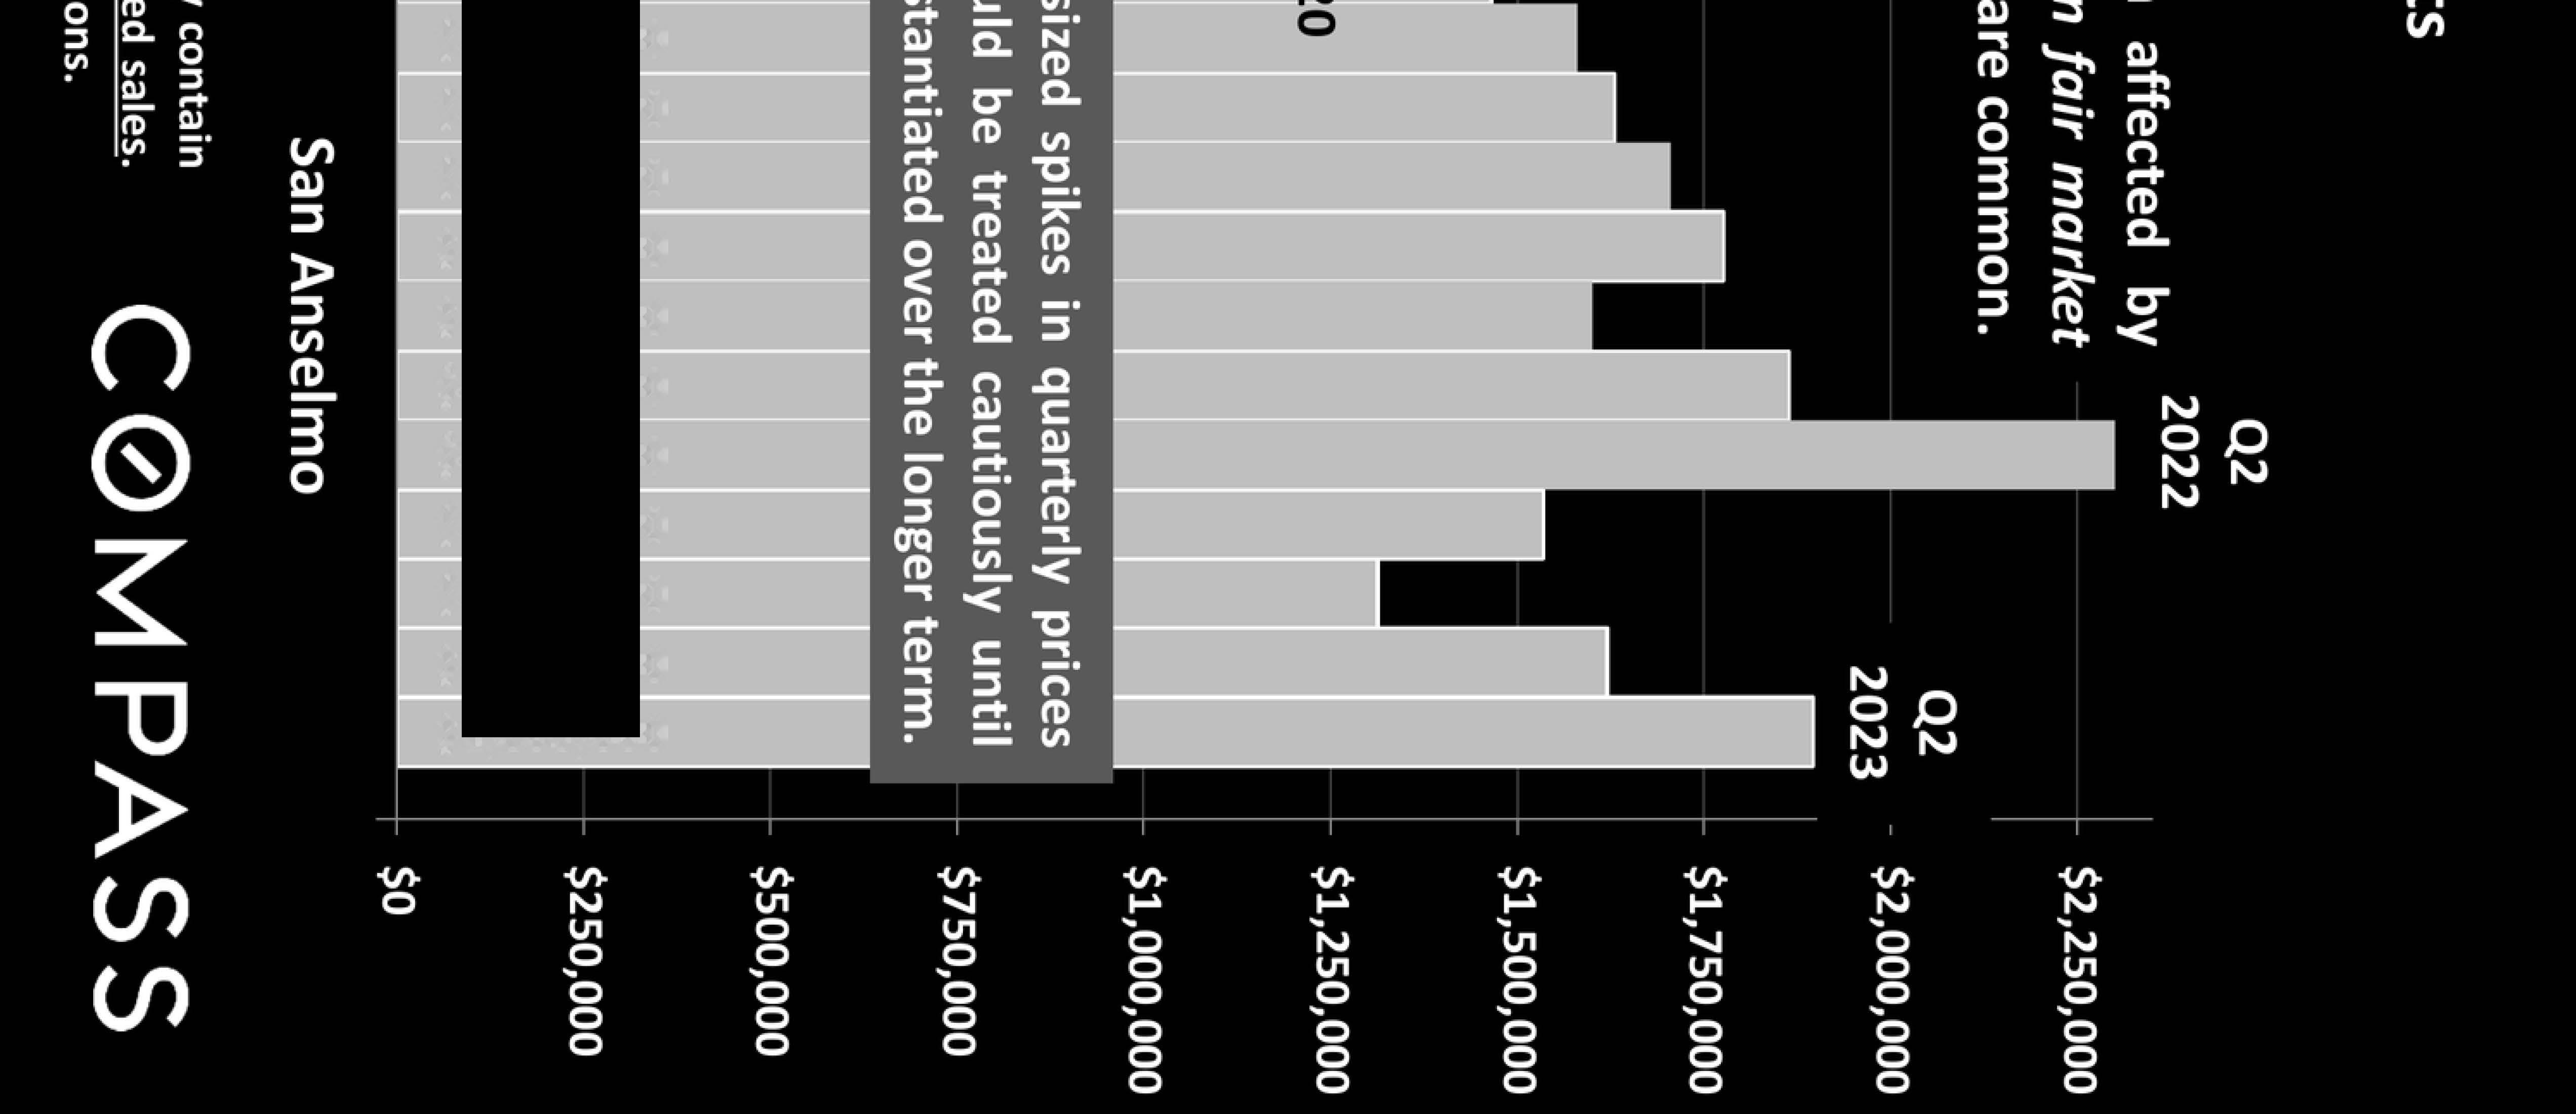
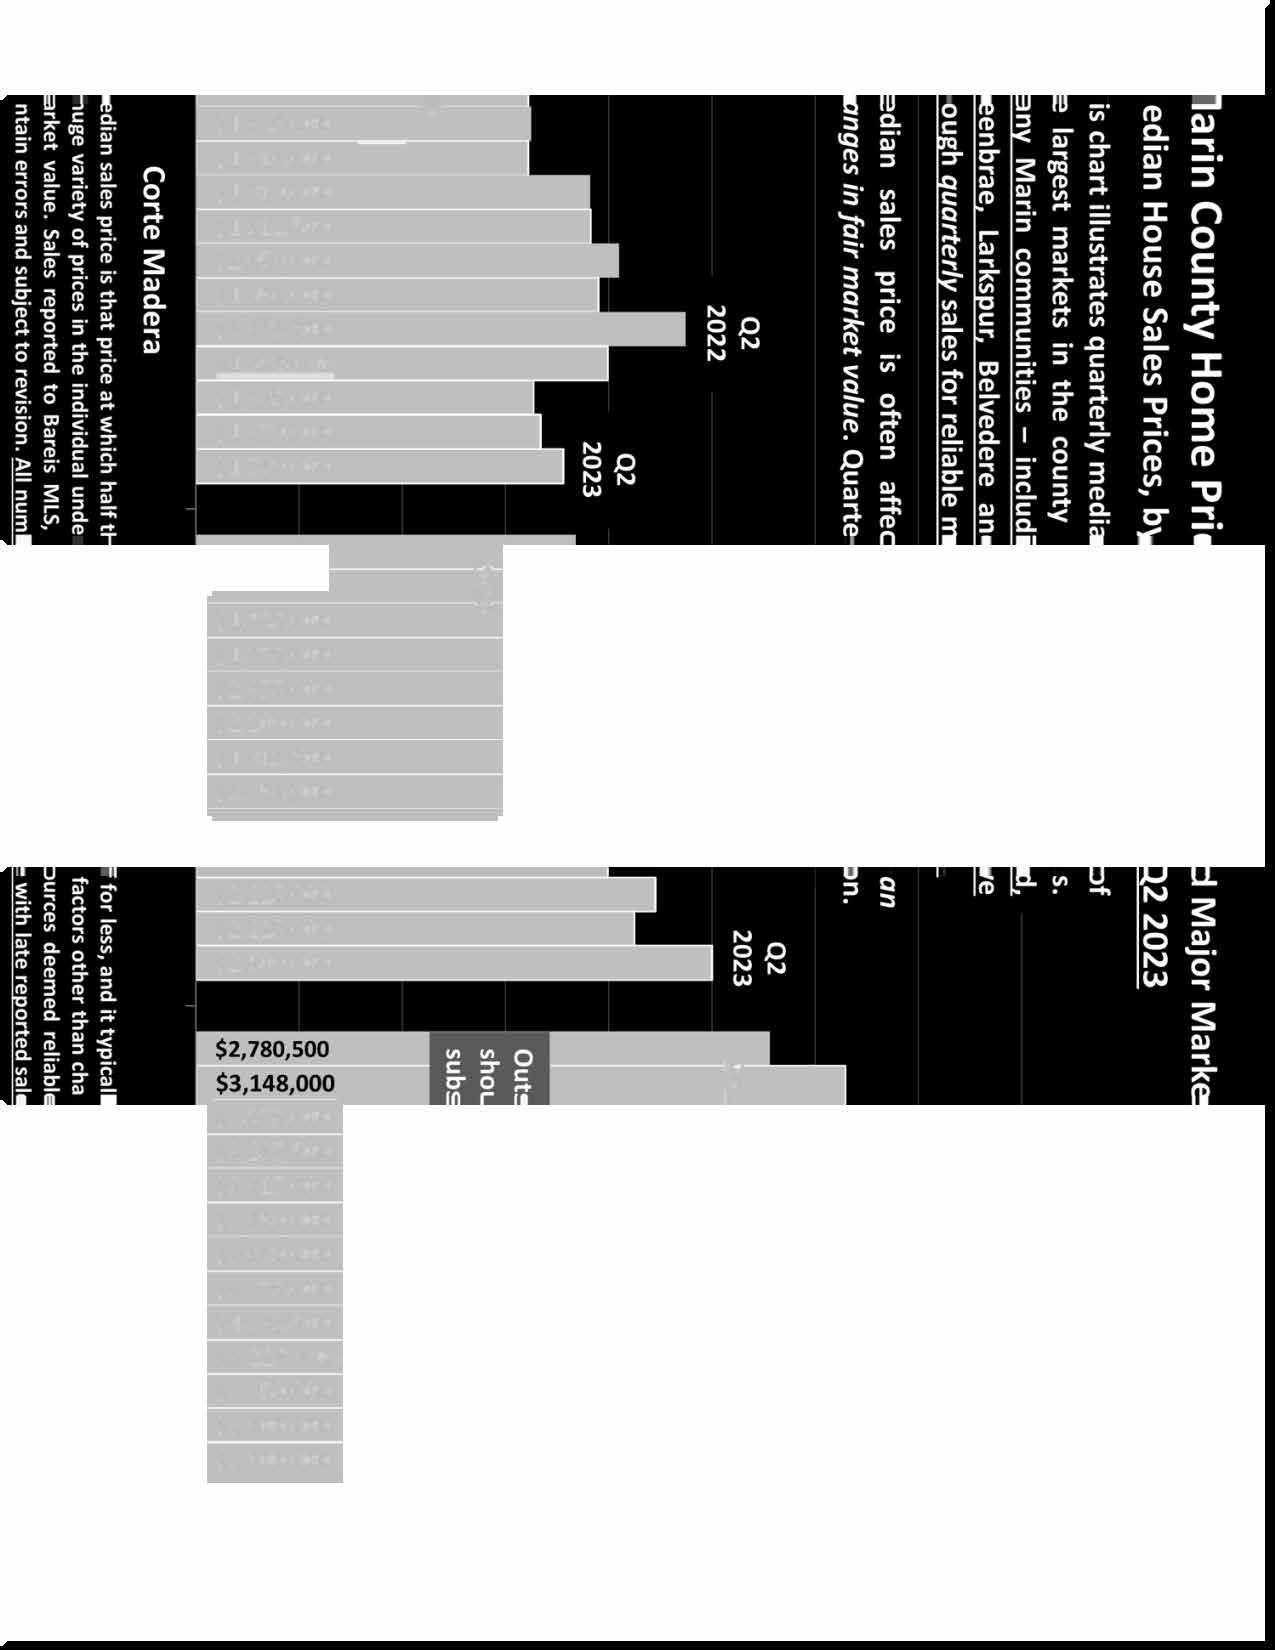
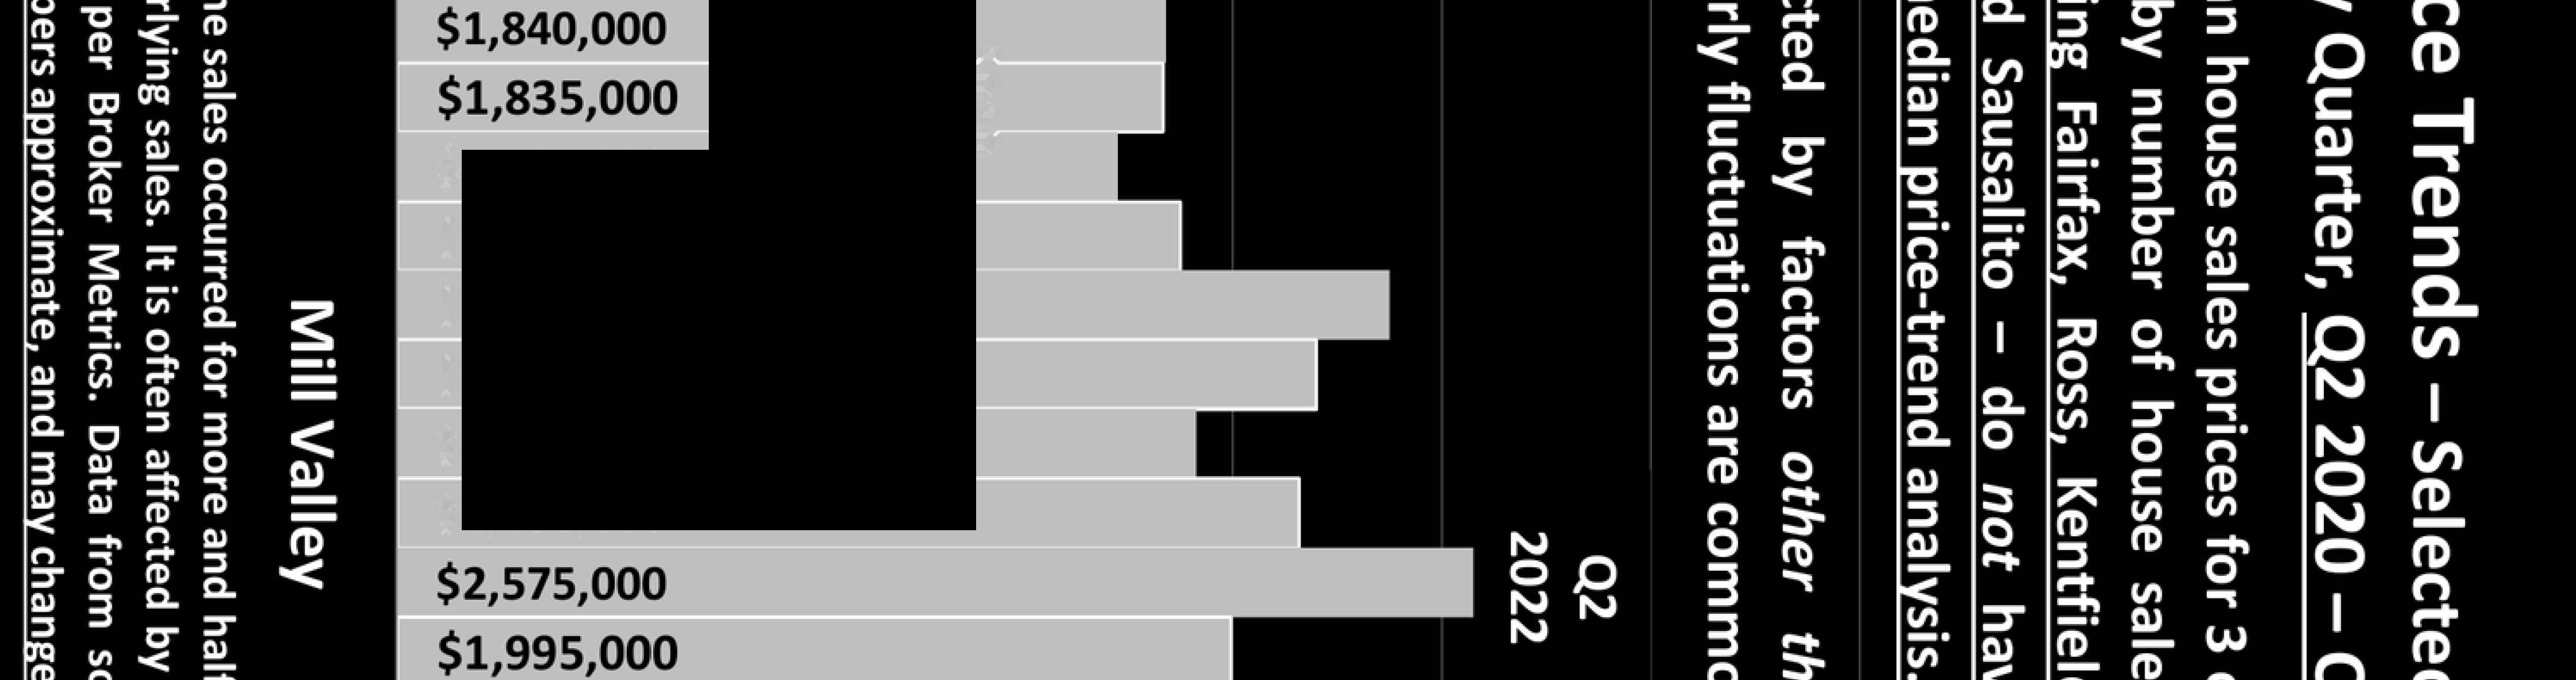
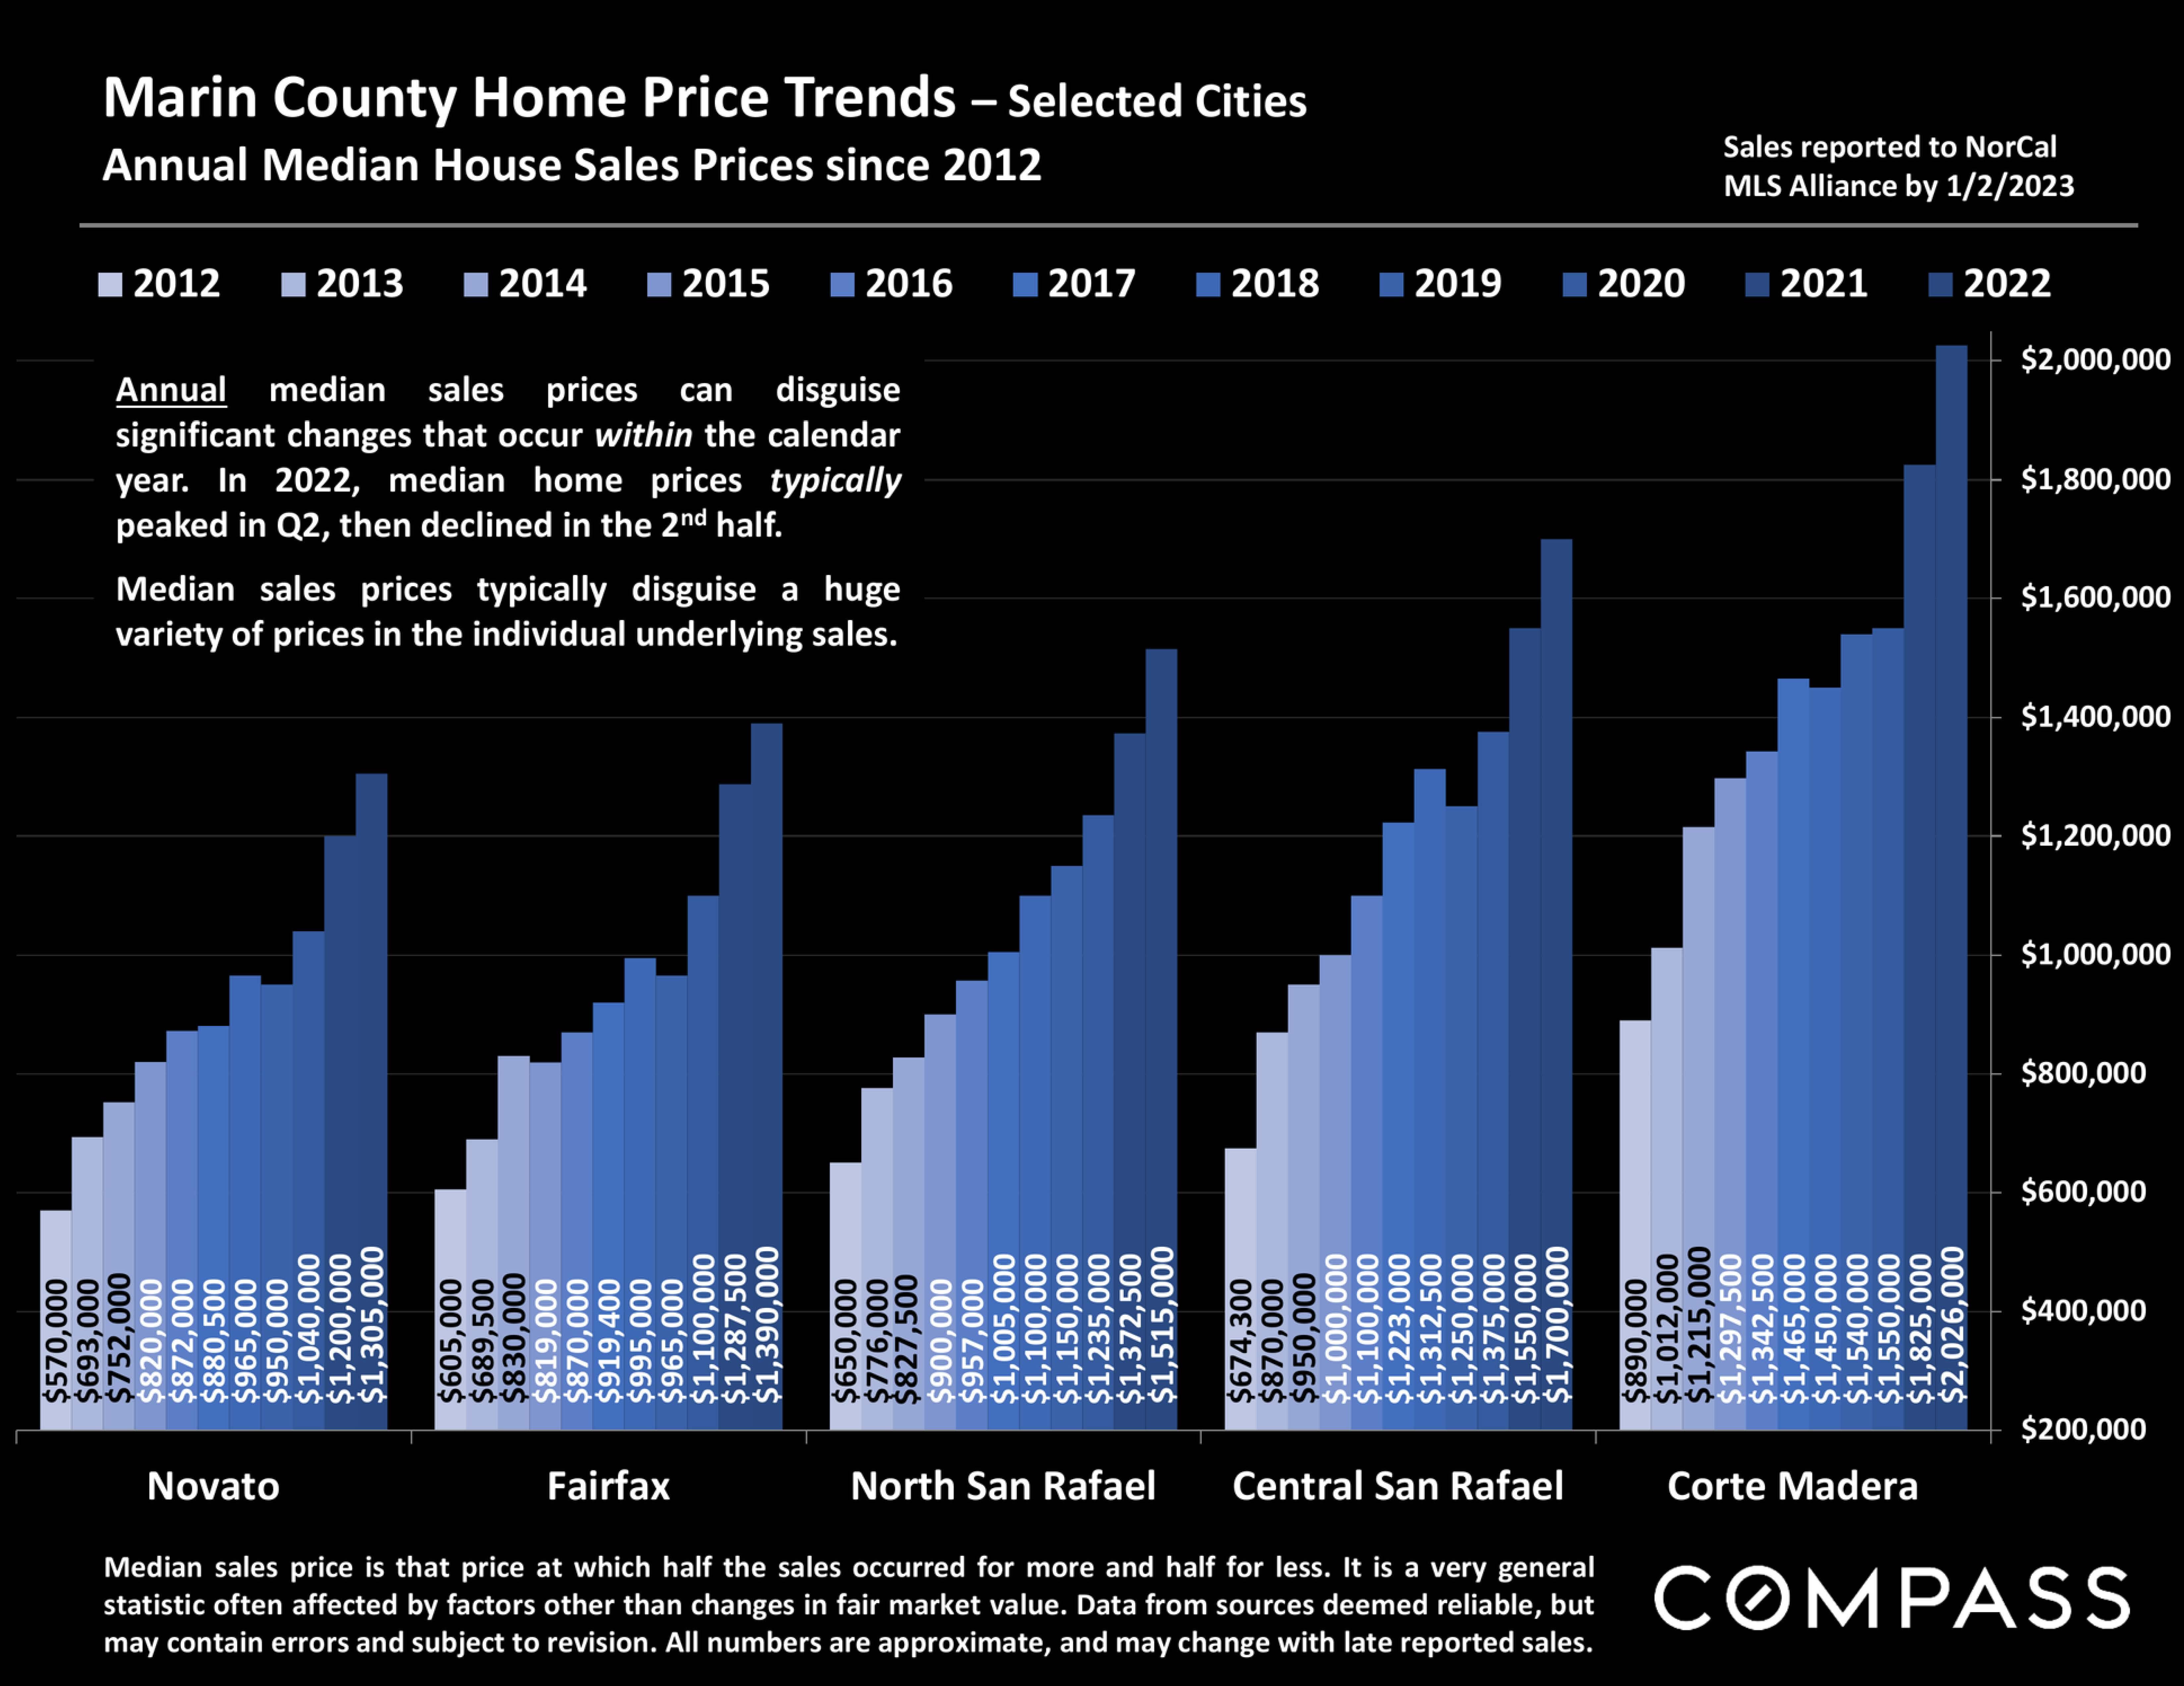
Median Sales Price is that price at which half the properties sold for more and half for less. It may be affected by seasonality, "unusual" events, or changes in inventory and buying trends, as well as by changes in fair market value. The median sales price for an area will often conceal an enormous variety of sales prices in the underlying individual sales.
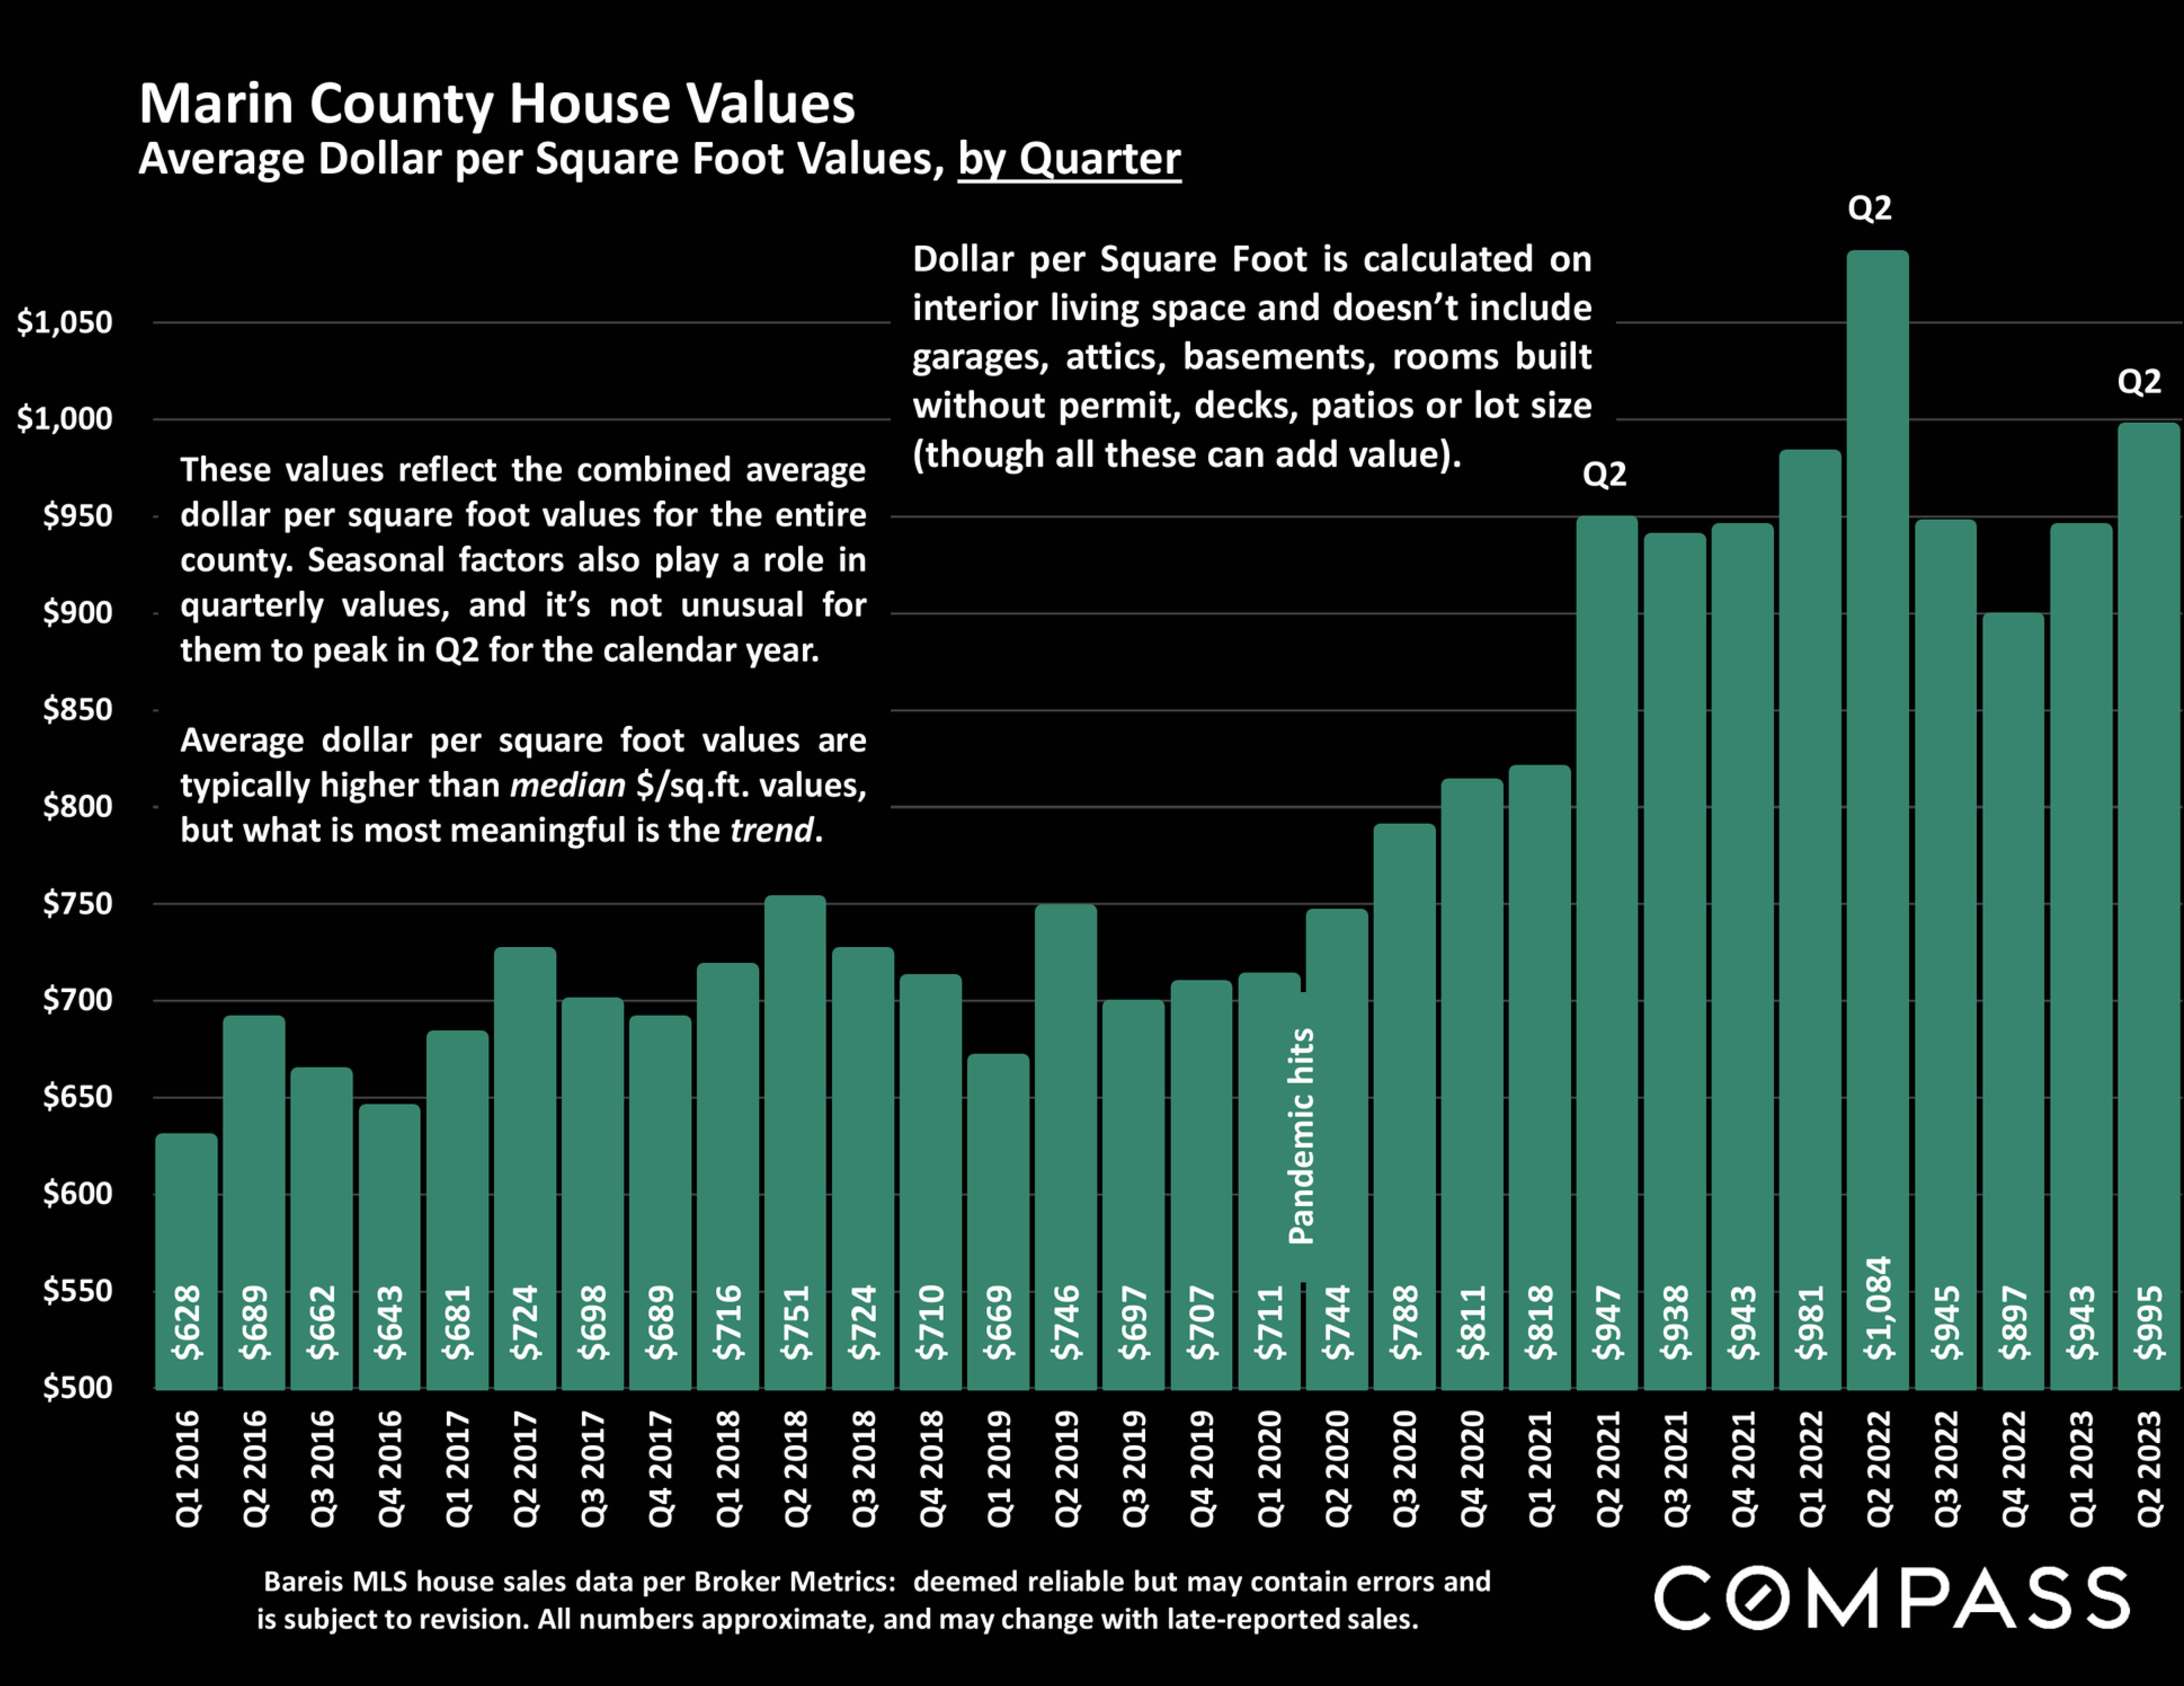
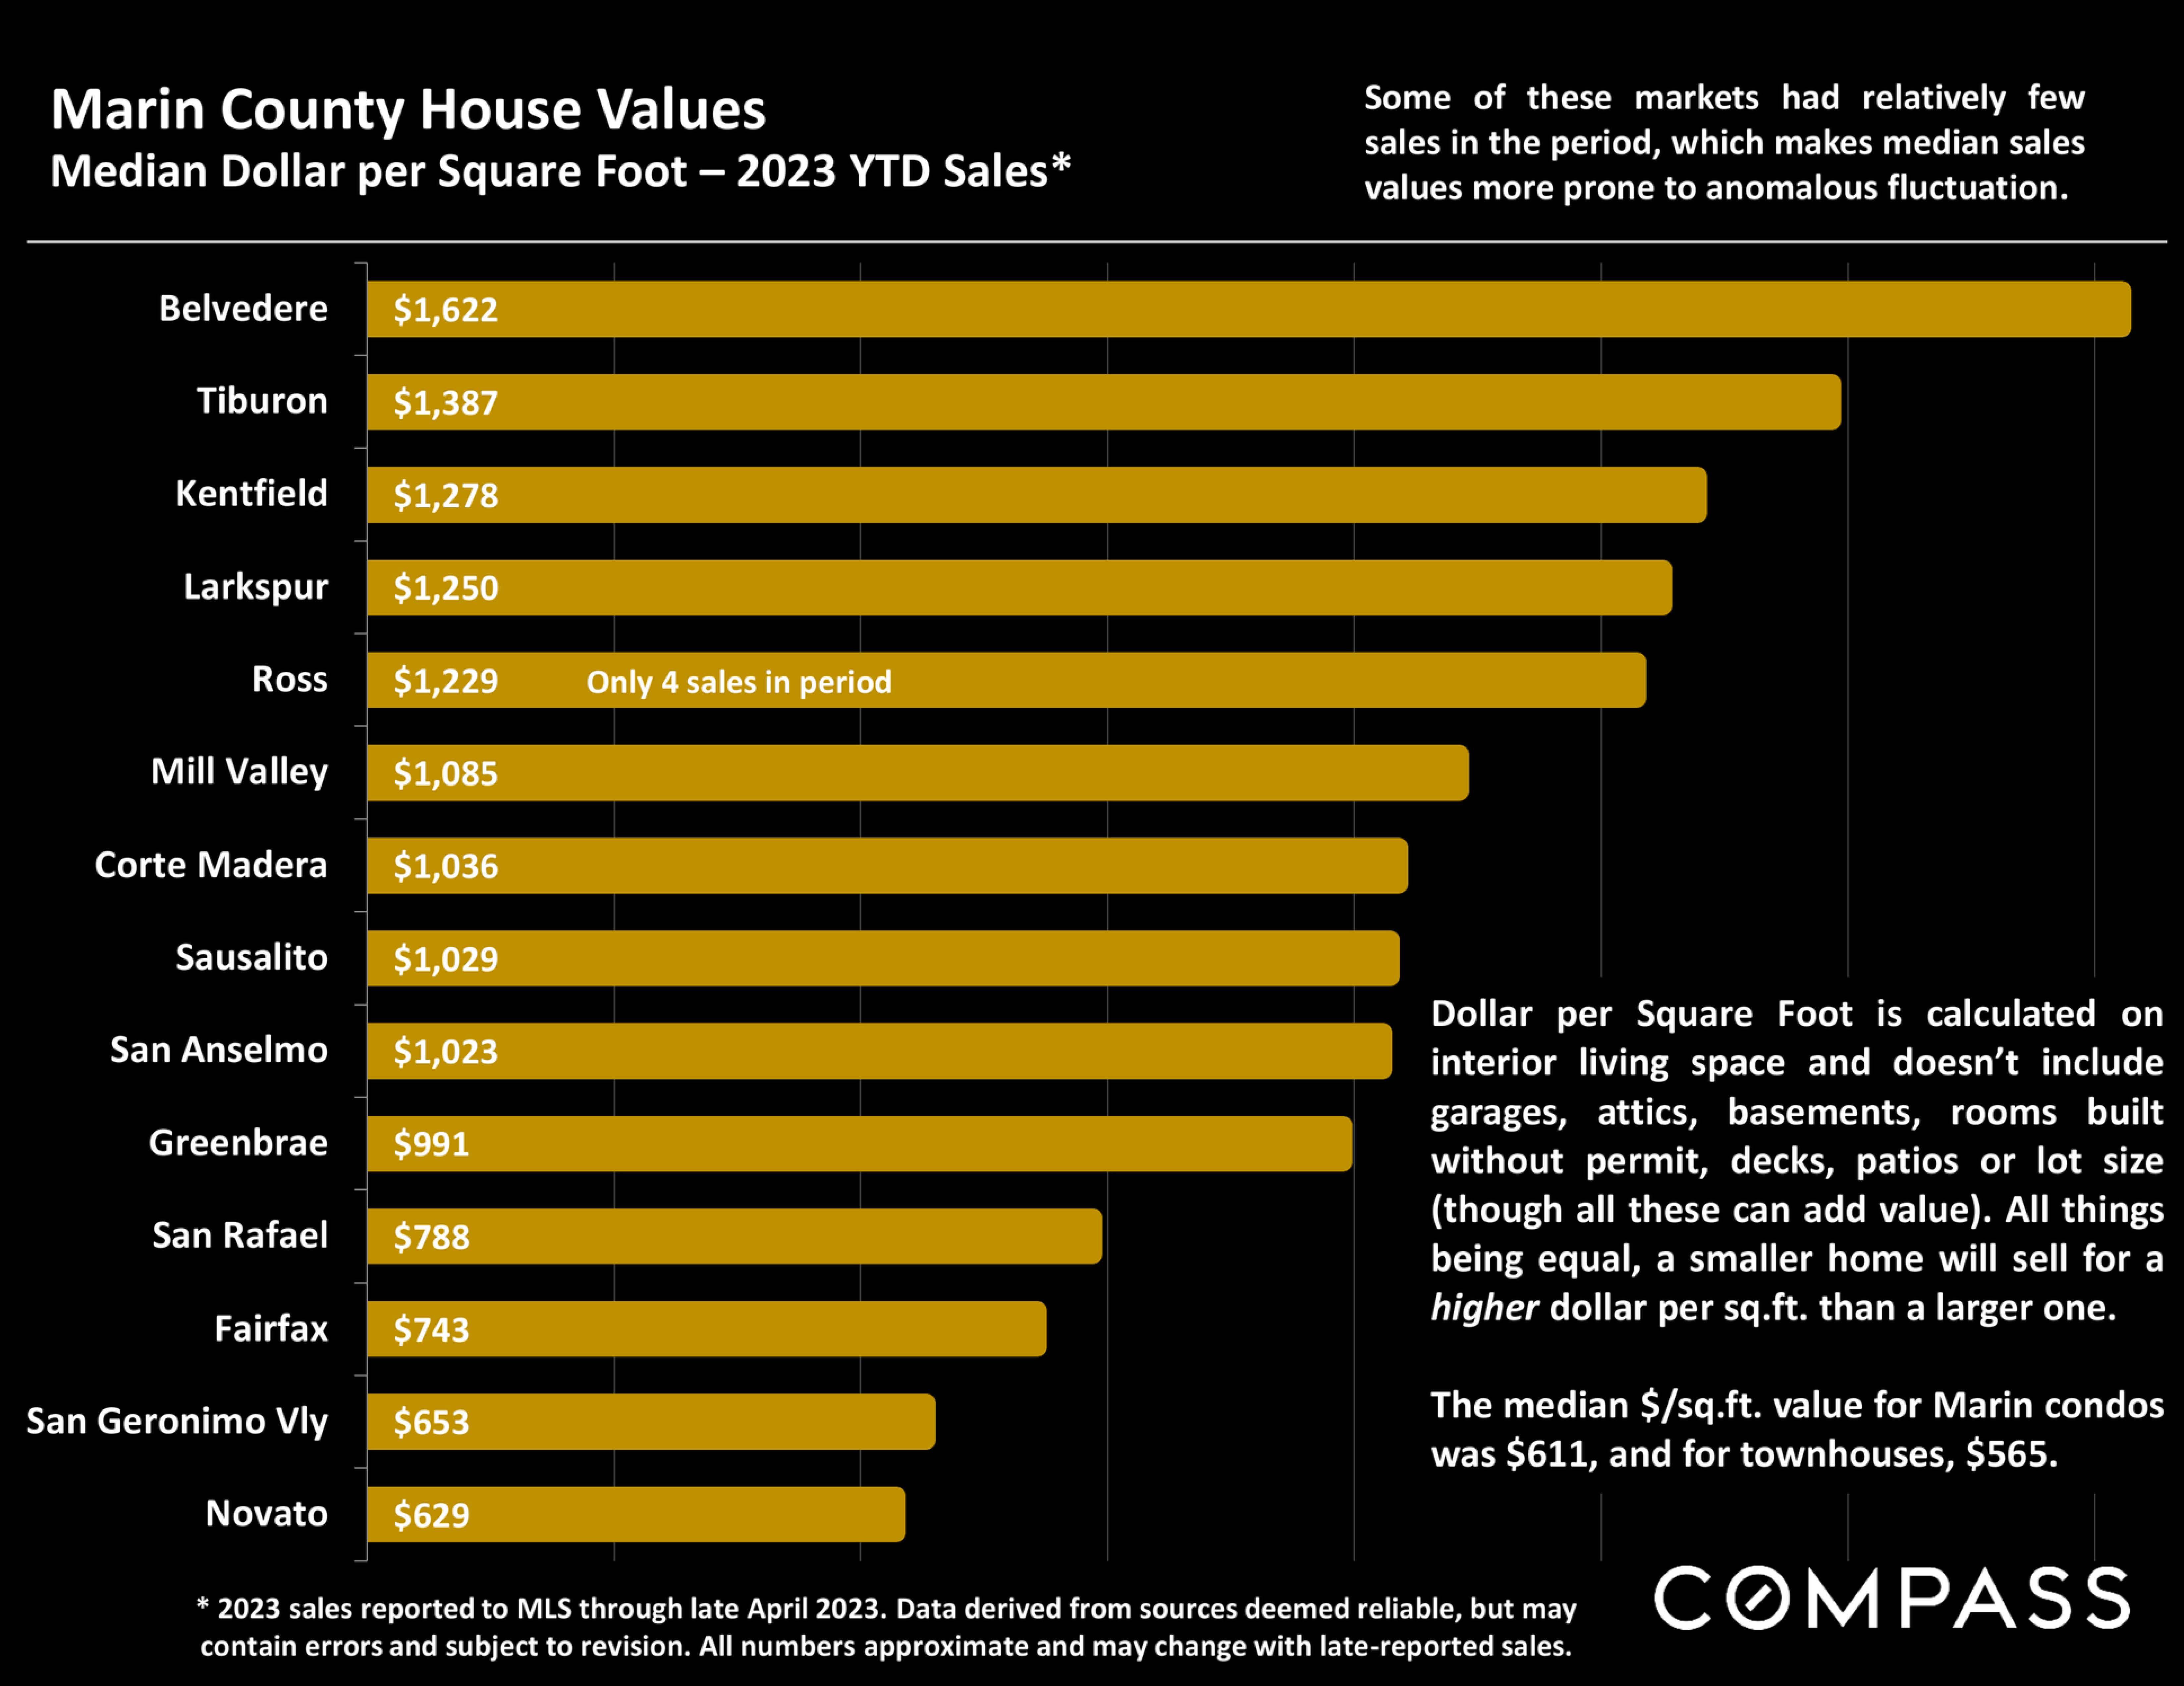
Dollar per Square Foot is based upon the home's interior living space and does not include garages, unfinished attics and basements, rooms built without permit, patios, decks or yards (though all those can add value to a home). These figures are usually derived from appraisals or tax records, but are sometimes unreliable (especially for older homes) or unreported altogether. The calculation can only be made on those home sales that reported square footage.
Compass is a real estate broker licensed by the State of California, DRE O1527235. Equal Housing Opportunity. This report has been prepared solely for information purposes. The information herein is based on or derived from information generally available to the public and/or from sources believed to be reliable. No representation or warranty can be given with respect to the accuracy or completeness ofthe information. Compass disclaims any and all liability relating to this report, including without limitation any express or implied representations or warranties for statements contained in, and omissions from, the report. Nothing contained herein is intended to be or should be read as any regulatory, legal, tax, accounting or other advice and Compass does not provide such advice. All opinions are subject to change without notice. Compass makes no representation regarding the accuracy of any statements regarding any references to the laws, statutes or regulations of any state are those of the author(s). Past performance is no guarantee of future results.