Across the Bay Area, the severe economic volatility which prevailed in Q2 – and the absence of a meaningful decline in mortgage interest rates – generally caused a significant year-over-year weakening in the spring selling season, usually the most dynamic of the year. This is reflected in many of the supply and demand indicators illustrated in this report. However, some homes continued to sell very quickly at well above asking price, and the number of homes selling for $4 million+ almost doubled from Q1.
As of early July, measures of economic uncertainty were dropping, stock markets had staged an astounding recovery to hit new highs, consumer confidence had begun to rebound, and interest rates were gradually declining. To a large degree, negative macroeconomic conditions trumped the typical spring-market trend of buyer demand outpacing the supply of homes for sale. Improvements in those conditions, should they continue, may support a stronger housing market in the second half of the year.
In the meantime, correct pricing, preparation and marketing are imperatives for sellers desiring the best results. And opportunities exist for buyers who keep a close eye on both new and older listings, monitor time-on-market and price reductions on unsold homes that meet their requirements – or perhaps need a little bit of work – and are prepared to move quickly and aggressively.
Report created in good faith using data from sources deemed reliable but may contain errors and subject to revision. Last period figures are preliminary estimates based on data available early in the following month. All numbers approximate, and may change with late-reported activity.
Economic Policy Uncertainty Index*
By Month since January 2000
Q2 2025 was a period of extreme political/economic volatility
The Economic Policy Uncertainty Index reading continued to decline in June, though remaining quite high by long-term norms.
The Economic Uncertainty Index is constructed from analysis of data from 3 sources: 1) an index of search results from 10 large newspapers for terms related to economic and policy uncertainty, 2) reports by the Congressional Budget Office, and 3) the Federal Reserve Bank of Philadelphia's Survey of Professional Forecasters.*
Dotcom crash & 9/11
Subprime crash & great recession
*Source: 'Measuring Economic Policy Uncertainty' by Scott Baker, Nicholas Bloom and Steven J. Davis, 3component index, www.PolicyUncertainty.com, https://www.policyuncertainty.com/us_monthly.html.
Jan. 2023
Conforming Fixed-Rate Loans, Weekly Average Readings*
Per Freddie Mac (FHLMC), on July 3, 2025, the weekly average, 30-year, conforming-loan interest rate, at 6.67%, continued to decline.
Fed begins reducing its benchmark rate.
Tariff shock hits financial markets
Jan. 2025
Rates vary widely according to the property, price, borrower and lender.
Updated 7/3/25 Jan. 2024
*Freddie Mac (FHLMC), 30-Year Fixed Rate Mortgage Weekly Average: https://www.freddiemac.com/pmms.
Data from sources deemed reliable. Different sources of mortgage data sometimes vary in their determinations of daily and weekly rates. Data from sources deemed reliable but may contain errors. All numbers approximate.
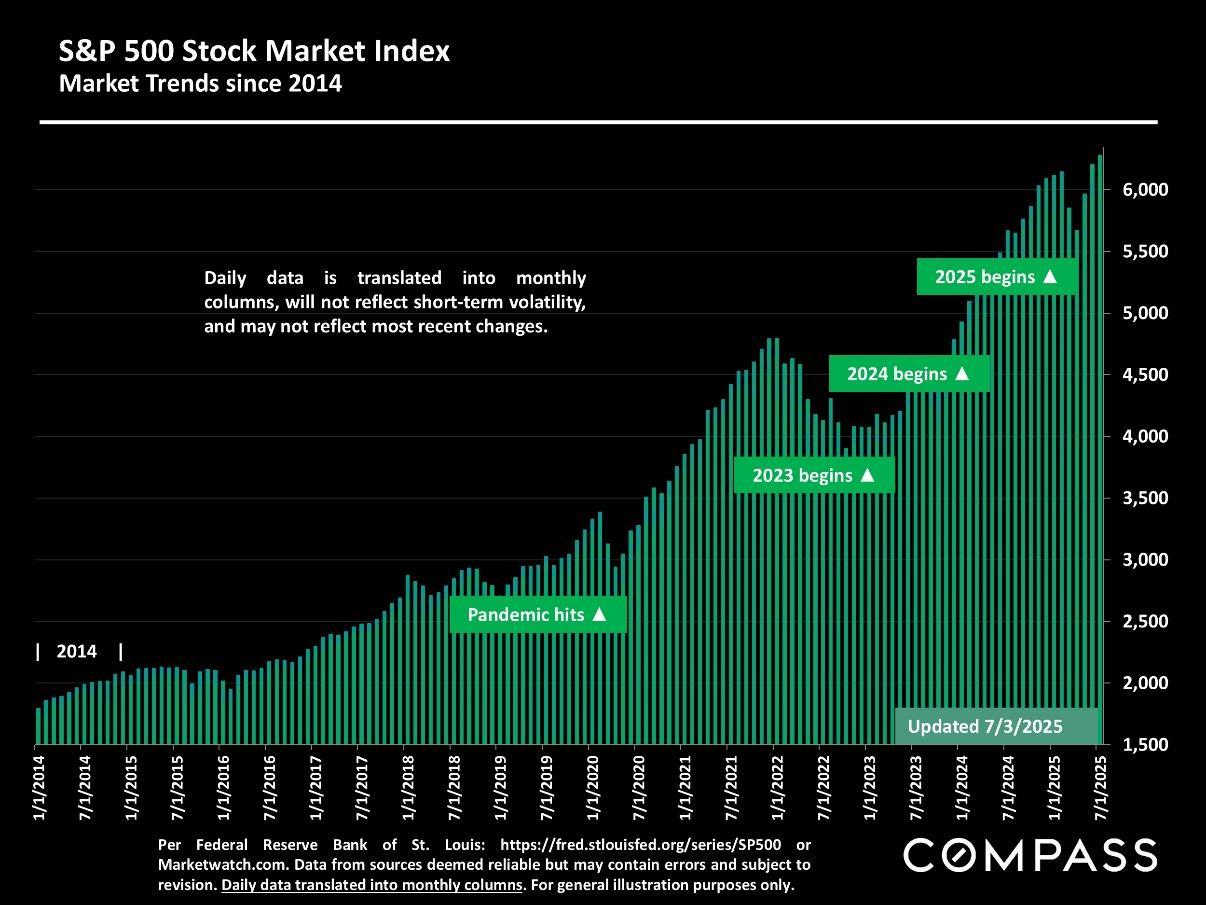
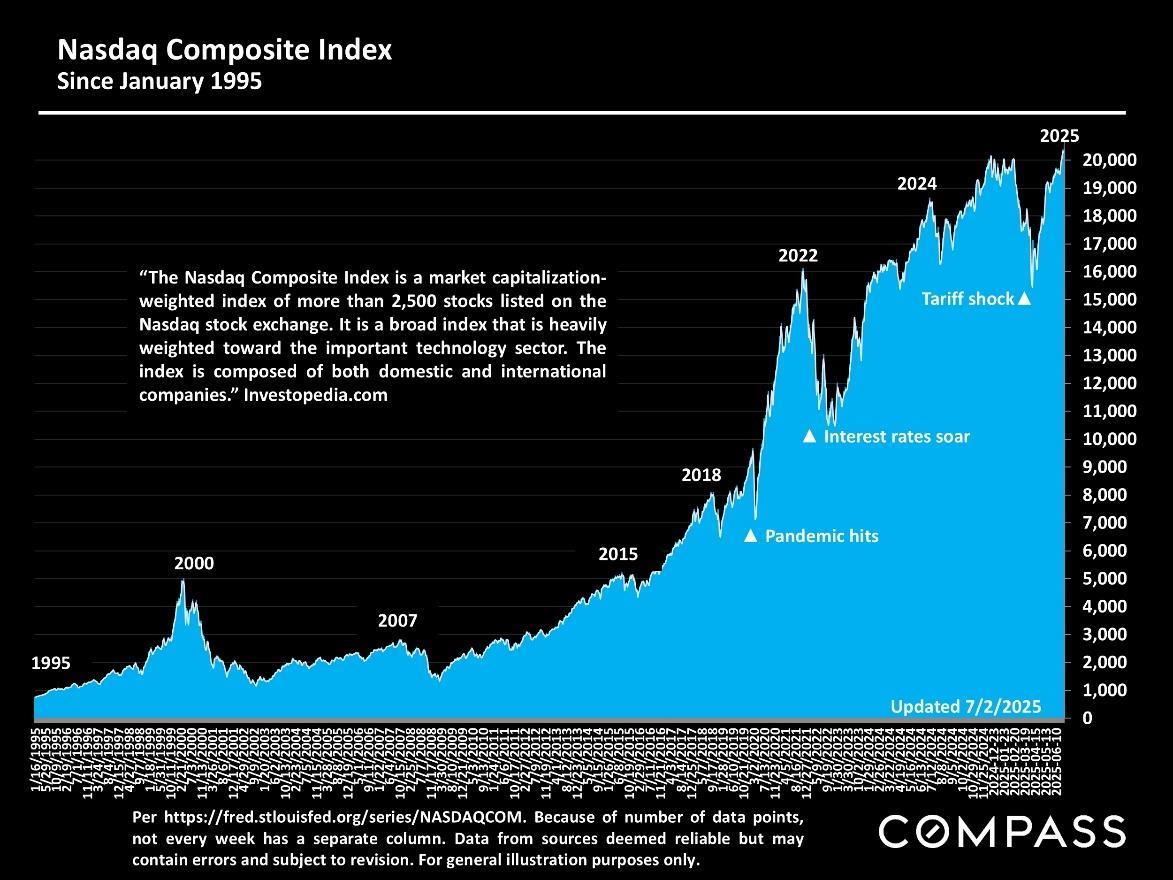
Following enormous rebounds from April’s crash, both the S&P 500 and the Nasdaq hit new all-time highs in early July.
Large changes in stock markets can dramatically affect household wealth, consumer confidence and housing markets, especially more affluent markets.
Marin County House Price Appreciation
Median House Sales Prices, 2015 – Present, by Quarter
Year over year, the Q2 2025 median house sales price was essentially unchanged from Q2 2023 and Q2 2024.
Q2
Median sales price is that price where half the homes sold for more and half for less. It is a very general statistic that disguises a wide range of prices in the underlying sales. Among other factors, changes in the median size of homes sold within different periods can affect median sales values.
It’s not unusual for median sales prices to peak for the year in spring (Q2).
Appreciation is typically measured year over year to account for market seasonality.
As
and subject
with
Marin County House Values
Average Dollar per Square Foot Values, by Quarter
Dollar per Square Foot is calculated on interior living space and doesn’t include garages, attics, basements, rooms built without permit, decks, patios or lot size (though all these can add value).
These values reflect the combined average dollar per square foot values for the entire county. Seasonal factors also play a role in quarterly values.
Dollar per square foot values and median sales prices sometimes move in different directions, often due to average home size changes.
Q2 2022 Peak Q2 2023 Q2 2024 Q2 2021
Year over year, the Q2 2025 average $/sq.ft. value fell slightly. Q2 2025
Bareis MLS house sales data per Broker Metrics: deemed reliable but may contain errors and is subject to revision. All numbers approximate, and may change with late-reported sales.
$961,000
1st Half Median House Sales Prices since 2020
Marin County: Selected Cities*
Median Sales Price is that price at which half the sales occurred for more and half for less. Over the longer term, price trends are typically similar across different markets within the same county.
2020 2021 2022 2023 2024 2025
January-June sales by year: Selected cities with higher sales volumes. Median home size varies widely by city.
Many of Marin’s markets – including Ross, Belvedere & Stinson Beach – don’t have enough sales for reliable price trend analysis. Throughout the county, the median size of homes sold within a specific market can vary significantly from period to period.
*Sales in January through June of each year, by city, as reported to NorCal MLS Alliance by 7/3/25. Median sales prices may be affected by and fluctuate due to other factors besides changes in fair market. Data from sources deemed reliable, but may contain errors and subject to revision. All numbers approximate, and last period may change with late-reported sales.
Novato San Rafael San Anselmo Corte Madera Mill Valley Kentfield Tiburon
Condo sales make up less than 20% of the Marin County home market, and anomalous fluctuations in median sales price are common due to the relatively low sales volumes spread across very different markets.
Generally speaking, median condo sales prices in the Bay Area have seen weaker dynamics than houses.
Median sales price is that price at which half the sales occurred for more and half for less. It is a very general statistic that can be affected by other factors besides changes in fair market value. Q3 2022
$595,000
As reported to NorCal MLS Alliance, per Infosparks. All numbers approximate, subject to revision, and may change with late-reported sales.
New Listings Coming on Market
Marin County Market Dynamics & Seasonality
The number of new listings coming on market ebbs and flows by seasonal trends, though it can be affected by specific market
Per Realtor.com Research: https://www.realtor.com/research/data/,
The number of new listings in June 2025 plunged from May, but was about 8% higher year over year.
Sept.
Marin County Homes Market
House, Condo & Townhouse Listings*
On 7/1/25, the number of listings for sale dropped from the previous month, but was up 37% year over year. 75% of listings were houses, 20% condos, and 5% townhouses.
The quantity of active listings on a given day is affected by 1) the number of new listings coming on market, 2) how quickly buyers put them into contract, 3) the sustained heat of the market over time, and 4) sellers pulling homes off the market without selling. Updated July 1, 2025
* Active/Coming-Soon listings posted to NorCal MLS Alliance. Data from sources deemed reliable, but may contain errors and subject to revision. Not all listings are posted to MLS. All numbers approximate. The number of active listings constantly changes.
Listings Accepting Offers (Going into Contract)
Marin County Market Dynamics & Seasonality
Residential activity reported to Bareis MLS, per Broker Metrics. Data from sources deemed reliable, but may contain errors and subject to revision. All numbers approximate, and may change with late-reported activity. Sept. 2021 April 2022
The number of listings going into contract in June 2025 declined from May, and was down about 7% year over year. The number of listings going into contract is an indicator of future sales volume.
May 2025
Percentage of Listings Accepting Offers (Going into Contract)
Marin County: Absorption Rate by Month
March 2022
April 2021
Pandemic boom: Extreme lows in interest rates
| Pandemic hits
Absorption rate is the comparison of buyer demand vs. the supply of homes for sale: The higher the percentage, the more heated and competitive the market.
March 2023
If the year-over-year increase in active listings outpaces any change in listings going into contract, the absorption rate falls on a y-o-y basis – as it has in virtually all Bay Area markets. March
March 2024
| Interest rate changes impact the market
*Bareis MLS reported data for houses, condos and townhouses, per Broker Metrics. Last month’s data estimated using available data, may change with late reported activity. Data from sources deemed reliable but may contain errors and subject to revision. All numbers approximate.
Updated through June 2025
Months Supply of Inventory (MSI) – of Active Listings on Market
Marin County Real Estate Market since 2018, 3-Month Rolling Average 0.5 1.0
Market cools
Pandemic hits Spring 2018 Spring 2019
MSI measures how long it would take to sell the current inventory of active listings at the current rate of sale. The lower the MSI, the stronger the buyer demand as compared to the supply of listings on the market. MSI typically fluctuates to seasonal trends in listing and sales activity.
| Pandemic boom ► MSI would be considered low on a long-term historical basis, but the June 2025 reading was higher than any June in the past 7 years. Spring 2023 Updated through June 2025
Market cools
3-month rolling average monthly data for residential transactions reported to Bareis MLS, per Broker Metrics. Data from sources deemed reliable, but may contain errors and subject to revision. All numbers approximate, and may change with late-reported activity.
Monthly Sales Volume
Marin County Market Dynamics & Seasonality
Sales in one month mostly reflect accepted offers in the previous month, i.e. they are a lagging indicator of market conditions.
Sales volume in June 2025 declined slightly from May and from June 2024.
Sales of houses, condos, townhouses reported to NorCal MLS Alliance, per Infosparks. Data from sources deemed reliable but may contain errors and subject to revision. Last month estimated based on available information and may change with late reported sales. All numbers approximate.
Marin County: Number of Home Sales
12-Month-Rolling Totals since 2005*
Broad Long-Term Trends of the Last 20 Years
Subprime boom
Each reading on this chart reflects the total number of 12 months of residential sales reported to MLS. Sales volume is affected by buyer demand, economic conditions, and the inventory of listings available to purchase – all dramatically at play in recent years. 12-month-rolling calculations smooth the trend line and remove the effect of seasonality, but may lag short-term changes.*
| High-tech boom | ▲ Interest rates soar
Pandemic hits ▲
Pandemic boom
Great recession
Updated through June 2025
*12-month-rolling attached & detached home sales reported to NorCal MLS Alliance, per Infosparks. Does not include sales not reported to MLS. Data from sources deemed reliable, but may contain errors and subject to revision. All numbers approximate.
Marin County Higher Price & Luxury Home Sales
Sales Prices of $4,000,000+, by Quarter since 2018
| Peak of pandemic boom |
Q2 2025 $4 million+ home sales doubled from Q1, and was unchanged year-over-year.
The market for luxury homes fluctuates by season, with spring (Q2) typically the dominant selling season of the year.
Price Reductions on Active Listings
Marin County Market Dynamics & Seasonality
The number of price reductions typically ebbs and flows by season, but can also be affected by specific events in the economy and the market. It’s not unusual for price reductions to peak in autumn.
The number of price reductions in June 2025 declined from May, but increased 19% year over year – to its highest June reading in 4+ years.
Per Realtor.com Research: https://www.realtor.com/research/data/, listings posted to site. Data from sources deemed
but may contain
and
Overbidding List Prices in Marin County
Percentage of Home Sales Closing over List Price
More overbidding ▲
▲ Pandemic hits
Sales in 1 month mostly reflect market dynamics in the previous month.
Seasonal ebbs and flows are common.
Higher overbidding percentages signify more buyer competition for new listings. The percentage usually runs lowest in midwinter, and highest in spring. In June 2025, 39% of sales sold for over list price, down from 49% in June 2024. April 2025 Fall 2024 Fall 2023
Sales data reported to NORCAL MLS® ALLIANCE, per Infosparks. Reflecting the percentage of sales closing at sales prices over the final list prices. Data from sources deemed reliable, but may contain errors and subject to revision. All numbers are approximate, and may change with late-reported sales.
Average Sales Price to Original List Price Percentage
Marin County Over/Under Bidding: Market Dynamics & Seasonality
This statistic is a lagging indicator of market activity 3-6 weeks earlier. It typically ebbs and flows per seasonal trends, but also affected by specific market dynamics.
Spring 2022
100% = an average sales price at original list price. 102% = an average sales price 2% over asking price; 98% = 2% below asking price. Overbidding usually peaks in spring.
In June 2025, the average home sale sold for about 1.5% below asking price, the lowest June reading in 5+ years.
Spring 2023
Spring 2024
Spring 2025
Pandemic hits
Updated through June 2025
Median Days on Market: Speed of Sale
Marin County: Market Dynamics & Seasonality
A measurement of how quickly the listings which sell go into contract, this statistic fluctuates dramatically according to seasonal demand trends, and is a lagging indicator of market activity 3-6 weeks earlier.
Jan. 2023
Homes typically sell fastest in spring as buyers respond to the rush of new listings coming on market. The median days on market in June 2025 was the highest June reading in 5+ years.
Statistics are generalities, essentially summaries of widely disparate data generated by dozens, hundreds or thousands of unique, individual sales occurring within different time periods. They are best seen not as precise measurements, but as broad, comparative indicators, with reasonable margins of error. Anomalous fluctuations in statistics are not uncommon, especially in smaller, expensive market segments. Last period data should be considered estimates that may change with late-reported data. Different analytics programs sometimes define statistics – such as “active listings,” “days on market,” and “months supply of inventory” – differently: what is most meaningful are not specific calculations but the trends they illustrate. Most listing and sales data derives from the local or regional multi-listing service (MLS) of the area specified in the analysis, but not all listings or sales are reported to MLS and these won’t be reflected in the data. “Homes” signifies real-property, single-household housing units: houses, condos, co-ops, townhouses, duets and TICs (but not mobile homes), as applicable to each market. City/town names refer specifically to the named cities and towns, unless otherwise delineated. Multi-county metro areas will be specified as such. Data from sources deemed reliable, but may contain errors and subject to revision. All numbers to be considered approximate.
Many aspects of value cannot be adequately reflected in median and average statistics: curb appeal, age, condition, amenities, views, lot size, quality of outdoor space, “bonus” rooms, additional parking, quality of location within the neighborhood, and so on. How any of these statistics apply to any particular home is unknown without a specific comparative market analysis.
Median Sales Price is that price at which half the properties sold for more and half for less. It may be affected by seasonality, “unusual” events, or changes in inventory and buying trends, as well as by changes in fair market value. The median sales price for an area will often conceal an enormous variety of sales prices in the underlying individual sales.
Dollar per Square Foot is based upon the home’s interior living space and does not include garages, unfinished attics and basements, rooms built without permit, patios, decks or yards (though all those can add value to a home). These figures are usually derived from appraisals or tax records, but are sometimes unreliable (especially for older homes) or unreported altogether. The calculation can only be made on those home sales that reported square footage.
Photo use under the Creative Commons License: https://creativecommons.org/licenses/by-sa/2.0/
Compass is a real estate broker licensed by the State of California, DRE 01527235. Equal Housing Opportunity. This report has been prepared solely for information purposes. The information herein is based on or derived from information generally available to the public and/or from sources believed to be reliable. No representation or warranty can be given with respect to the accuracy or completeness of the information. Compass disclaims any and all liability relating to this report, including without limitation any express or implied representations or warranties for statements contained in, and omissions from, the report. Nothing contained herein is intended to be or should be read as any regulatory, legal, tax, accounting or other advice and Compass does not provide such advice. All opinions are subject to change without notice. Compass makes no representation regarding the accuracy of any statements regarding any references to the laws, statutes or regulations of any state are those of the author(s). Past performance is no guarantee of future results.