

Marin County Real Estate March 2023 Report

After the acute decline in market activity occurring in the 2nd half of 2022, buyer demand rebounded dramatically and most market indicators turned positive in early 2023: Open house traffic, number of offers, and overbidding and absorption rates all saw improvement.*
It is too early for significant effects to show up in home prices: Indeed, through February, 3month-rolling median house sales prices saw year-over-year declines across all Bay Area counties. (These percentage declines should be regarded cautiously until substantiated over the longer term.) Even with the striking improvement in demand over late 2022, most year-over-year indicators remain depressed, but these comparisons are with the severely overheated conditions prevailing at the peak of a 10-year housing market upcycle. The market was still just waking up in February. March through May is typically the most active listing and sales period of the year, and should soon provide much more data on supply, demand and price trends. Over the last 3 years, spring markets were deeply affected, in very different and often surprising ways, by the onset of the pandemic (2020), the pandemic boom (2021), and soaring interest rates (2022).
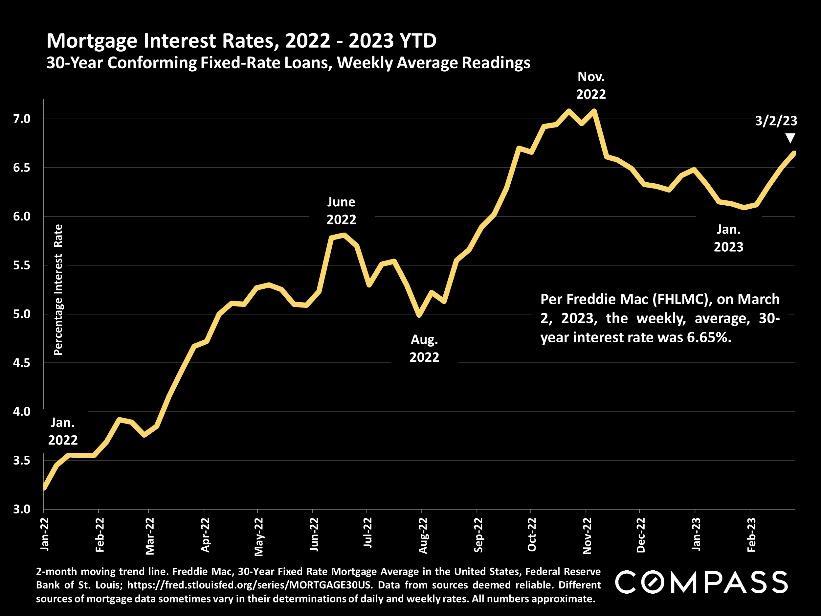
As has been the case for the last 14 months, the biggest wildcard remains interest rates: After dropping considerably in January from a November peak, they climbed again in February, with big impacts on loan application rates. It has been very challenging to predict short-term interest rate changes. Another major factor is the substantial decrease in the number of new listings coming on market over the last year, a critical issue with wide ramifications if it continues.
*Sales in one month generally reflect deal-making in the previous month, and often pertain to listings that have already been on the market for months longer. Many real estate statistics are lagging indicators, and even dramatic shifts in demand may show up only very gradually in their readings.
Absorption rate: A measurement of buyer demand as compared to the inventory of listings on the market. The higher the percentage, the stronger the demand as compared to the supply of homes for sale. It typically ebbs and flows according to seasonal trends in supply and demand, as well as being affected by changes in general market dynamics.
July 2020
April 2021
March 2022
March 2019
Pandemic hits
|
Historic lows in interest rates |
Early 2023 saw a sharp rebound in the absorption rate as buyer demand jumped.
* Bareis MLS reported data for houses, condos and townhouses, per Broker Metrics. Last month’s data estimated using available data, may change with late reported activity. Data from sources deemed reliable but may contain errors and subject to revision. All numbers approximate.

After dropping in January from a November peak, interest rates climbed again in February.

Many Marin communities have very low sales volumes, which can lead to dramatic, anomalous fluctuations in statistics and median values from period to period.
Median values are those values at which half the homes sold for more and half for less. They are very general statistics that typically disguise a wide range of values in the underlying sales. Median home sizes in Marin can vary widely between periods measured, with significant effects on median sales values.
* 4 months sales reported to NorCal MLS Alliance, through late February 2023. “Sales price to LP %” refers to average for homes selling within 30 days. Data derived from sources deemed reliable, but may contain errors and subject to revision. All numbers approximate. Outlier data adjusted when identified. Not all sales are reported to MLS.
How these statistics and values apply to any particular home is unknown without a specific comparative market analysis.
* 4 months sales reported to NorCal MLS Alliance, through late February 2023 . “Sales price to LP %” refers to average for homes selling within 30 days. Statistics are broad generalities summarizing disparate data. Data derived from sources deemed reliable, but may contain errors and subject to revision. All numbers approximate. Outlier data adjusted when identified. “West Marin” refers to Bolinas, Nicasio, Pt. Reyes Station, Inverness & Dillon Beach.
Median sales price is that price at which half the sales occurred for more and half for less. It is a very general statistic, disguising an enormous range of sales prices in the underlying sales. It is often affected by other factors besides changes in fair market value. Monthly and seasonal fluctuations are common, which explain many of the regular ups and downs in this chart. Longer-term trends are much more meaningful than short-term changes.
Year over year, the 3-month rolling, median house sales price in February 2023, $1,512,500, was down about 5%.
2022
2007-08

3-month rolling average of monthly median sales prices for “existing” houses, per CA Association of Realtors or NorCal MLS Alliance. 2-period moving trend line. Analysis may contain errors and subject to revision. All numbers approximate, and may change with late-reported sales.
Updated through February 2023
3-month-rolling data smooths out median sales prices and year-overyear appreciation rates, but may lag shorter-term changes in the market.
Comparing the 3-month-rolling median house sales price with the same period of the previous year to calculate the percentage change. Median sales prices can be affected by a variety of factors other than changes in fair market value, as can year-over-year appreciation rates.
The decline in February should be regarded with caution until substantiated over the longer term ►
*3-month rolling sales reported to NorCal MLS Alliance, per Infosparks. Data from sources deemed reliable, but may contain errors and subject to revision. Percentages rounded. All numbers approximate.
Comparing the median house sales price for the 3-month period, December 1, 2022 – February 28, 2023, with the same period 1 year prior.
3-month-rolling median sales prices mostly reflect accepted offers in the period 1 to 4 months earlier.
Median sales prices and year-over-year appreciation rates can fluctuate due to factors other than changes in fair market value. How this analysis applies to any particular home is unknown without a specific comparative market analysis.
* House sales reported to NorCal MLS Alliance by 3/4/2023. Percentages rounded. Latereported sales may change calculations. Counties contain submarkets of widely varying trends. All numbers are approximate, may contain errors and subject to revision.
Median sales price is that price at which half the sales occurred for more and half for less. It is a very general statistic, often affected by other factors besides changes in fair market value. Monthly and seasonal fluctuations are common – especially in Marin – and longer-term trends are more meaningful than short-term changes.
Year over year, the 3-month rolling, median condo sales price in February 2023, $742,000, was up about 6%.
Updated through February 2023
3-month rolling median condo sales prices reported to NorCal MLS Alliance, per Infosparks. 2period moving trend line. Analysis may contain errors and subject to revision. All numbers approximate, and may change with late-reported sales.
February columns highlighted for year-over-year comparisons
The number of new listings coming on market ebbs and flows by seasonal trends, though it can be affected by specific market dynamics.
Various markets since 2007 have seen ebbs and flows in the number of new listings coming on market – the pandemic saw a huge surge – but the latest 12-month total is the lowest in at least 18 years. Potential sellers have been holding off from listing their homes for a variety of reasons.
Each data point reflects 12 months of new listing activity in MLS: Average monthly volumes = 1/12 of these compiled figures. 12-month rolling data delivers broad, long-term trend lines, generally deleting the effect of market seasonality, but may disguise and lag shorter term changes.
* Each data point reflects the TOTAL of 12 months of activity for “all attached/detached” homes. 1/12 of these numbers = an average month within the 12 month period. New listings reported to NorCal MLS Alliance, per Infosparks. Not all new listings are posted to MLS. Data from sources deemed reliable, but may contain errors and subject to revision. Numbers are approximate and are meant to illustrate broad trends.
June 2019
February columns highlighted for year-over-year comparisons
A snapshot measure of how many active listings can be expected on any given day of the specified month.
Summer-Fall 2020
Summer-Fall 2021 Pandemic hits
Oct. 2022
The number of active listings on market on a given day is affected by 1) how many new listings come on market, 2) how quickly buyers purchase them, 3) the sustained heat of the market over time, and 4) sellers pulling their homes off the market without selling. The number typically ebbs and flows by season.
Per Realtor.com Research: https://www.realtor.com/research/data/, listings posted on site. Data from sources deemed reliable, but may contain errors and subject to revision. All numbers should be considered approximate.
Active/Coming-Soon Listings*
Listings Posted to MLS on March 1, 2023
Under $1,000,000: 93 listings
$1,000,000 - $1,999,999: 58 listings
$2,000,000 - $2,999,999: 32 listings
$3,000,000 - $4,999,999: 14 listings
$5,000,000 - $9,999,999: 18 listings
$10,000,000 & above: 11 listings
Includes 5 listings priced at $20,000,000+, all of them located in Belvedere.
Active/Coming Soon HOUSE Listings, with Median House List (Asking) Prices*
• Belvedere – 11 listings - $9,975,000
• Corte Madera – 3 listings - $1,675,000
• Fairfax – 6 listings - $1,385,000
• Greenbrae – 1 listing @ $2,299,000
• Inverness/Pt. Reyes – 3 listings - $3,975,000
• Kentfield – 2 listings - $2,790,500
• Larkspur – 5 listings - $2,495,000
• Mill Valley – 19 listings - $2,900,000
• Novato – 24 listings - $1,367,500
• Ross – 1 listing @ $19,950,000
• San Anselmo – 8 listings - $1,547,500
• San Geronimo Valley – 1 listing @ $2,200,000
• San Rafael – 25 listings - $1,895,000
• Sausalito – 6 listings - $2,120,000
• Tiburon – 9 listings - $7,995,000
• Marin CONDOS – 70 listings - $587,500
• Marin TOWNHOUSES – 14 listings - $809,500
Median list prices may not be representative of typical median house sales values. Median list prices for active inventory often skew higher than median sales prices, especially in the most expensive markets. Above data as of 2/28/23.
* Active/Coming Soon listings (no offer accepted) posted to NorCal MLS Alliance. Data from sources deemed reliable, but may contain errors and subject to revision. Not all listings are posted to MLS. All numbers approximate. Numbers of listings and median list prices change constantly.
Listings-going-into-contract is typically considered the most up-to-date measurement of market activity, but the last month’s number should be considered preliminary due to the issue of late-reported data.
February data highlighted for year-over-year comparisons
House, condo, townhouse listings reported to NorCal MLS Alliance, per Infosparks. Data from sources deemed reliable but may contain errors and subject to revision. All numbers approximate.
Last month number estimated based on available data, and may change with late reported activity.
Sales in one month mostly reflect acceptedoffer activity in the previous month.
July 2020
February columns highlighted for year-over-year comparisons
Oct. 2019
Sales of houses, condos, townhouses reported to NorCal MLS Alliance, per Infosparks. Data from sources deemed reliable but may contain errors and subject to revision. Last month estimated based on available information and may change with late reported sales. All numbers approximate.
Closed sales mostly reflect accepted-offer activity in the previous month. The luxury home market typically ebbs and flows by season: Peaking in spring, hitting its low in mid-winter.
Home sales reported to Norcal MLS Alliance, per Infosparks. Data from sources deemed reliable but may contain errors and subject to revision. Last month estimated from available data, and may change with late-reported sales. All numbers approximate.
February columns highlighted for year-over-year comparisons
Each data point reflects 6 months of MLS sales: Average monthly sales volumes = 1/6 of these compiled figures. 6-month rolling data delivers broad, clear, long-term trend lines – which will still reflect some seasonal ebbs and flows in sales – but may disguise and lag shorter term changes.
* 6-month rolling sales data as reported to NorCal MLS Alliance, per Infosparks. Numbers may change with late reported sales. Data from sources deemed reliable, but may contain errors and subject to revision. Not all sales are reported to MLS. All numbers approximate.
The number of price reductions typically ebbs and flows by season, but can also be affected by specific events in the economy and the market. It’s not unusual for price reductions to peak in autumn before the mid-winter holiday slowdown begins in mid-November.
Per Realtor.com Research: https://www.realtor.com/research/data/, listings posted to site. Data from sources deemed reliable, but may contain errors and subject to revision. All numbers approximate.
Historically, the current MSI reading – under 2.5 months of inventory – would typically be considered to indicate a low supply of listings for sale, but compared to the severely depressed levels during the pandemic boom, inventory has more than doubled.
3-month rolling average of monthly readings: MSI measures how long it would take to sell the current inventory of active listings at the current rate of sale. The lower the MSI, the stronger the buyer demand as compared to the supply of listings on the market. This statistic also typically fluctuates according to seasonal trends in listing and sales activity.
3-month rolling average monthly data for residential transactions reported to Bareis MLS, per Broker Metrics. Data from sources deemed reliable, but may contain errors and subject to revision. All numbers approximate, and may change with late-reported activity.
Sales in 1 month mostly reflect market dynamics in the previous month. Seasonal ebbs and flows are typical.
Pandemic More overbidding ▲ Spring 2018
Spring 2022
Fall 2020
MidWinter MidWinter
Spring 2021 Spring 2019 MidWinter
MidWinter
MidWinter
100% = an average sales price at original list price. 110% = an average sales price 10% over asking price; 94% = 6% below asking price.
This statistic is a lagging indicator of market activity 3-6 weeks earlier. It typically ebbs and flows per seasonal trends, but also affected by specific market dynamics.
Sales of houses, condos, townhouses reported to NorCal MLS Alliance, per Infosparks. Data derived from sources deemed reliable, but may contain errors and subject to revision. All numbers approximate, and may change with late-reported sales.
A measurement of how quickly the listings which sell go into contract, this statistic typically ebbs and flows per seasonal demand trends. Jan.
This statistic is a lagging indicator of market conditions. Jan.
Jan.
Pandemic
Spring
Spring
Sales of houses, condos, townhouses reported to NorCal MLS Alliance, per Infosparks, or per Broker Metrics Bareis MLS data. Data derived from sources deemed reliable, but may contain errors and subject to revision. All numbers approximate, and may change with late-reported sales.

Statistics are generalities, essentially summaries of widely disparate data generated by dozens, hundreds or thousands of unique, individual sales occurring within different time periods. They are best seen not as precise measurements, but as broad, comparative indicators, with reasonable margins of error. Anomalous fluctuations in statistics are not uncommon, especially in smaller, expensive market segments. Last period data should be considered estimates that may change with late-reported data. Different analytics programs sometimes define statistics – such as “active listings,” “days on market,” and “months supply of inventory” – differently: what is most meaningful are not specific calculations but the trends they illustrate. Most listing and sales data derives from the local or regional multi-listing service (MLS) of the area specified in the analysis, but not all listings or sales are reported to MLS and these won’t be reflected in the data. “Homes” signifies real-property, single-household housing units: houses, condos, co-ops, townhouses, duets and TICs (but not mobile homes), as applicable to each market. City/town names refer specifically to the named cities and towns, unless otherwise delineated. Multi-county metro areas will be specified as such. Data from sources deemed reliable, but may contain errors and subject to revision. All numbers to be considered approximate.
Many aspects of value cannot be adequately reflected in median and average statistics: curb appeal, age, condition, amenities, views, lot size, quality of outdoor space, “bonus” rooms, additional parking, quality of location within the neighborhood, and so on. How any of these statistics apply to any particular home is unknown without a specific comparative market analysis.
Median Sales Price is that price at which half the properties sold for more and half for less. It may be affected by seasonality, “unusual” events, or changes in inventory and buying trends, as well as by changes in fair market value. The median sales price for an area will often conceal an enormous variety of sales prices in the underlying individual sales.
Dollar per Square Foot is based upon the home’s interior living space and does not include garages, unfinished attics and basements, rooms built without permit, patios, decks or yards (though all those can add value to a home). These figures are usually derived from appraisals or tax records, but are sometimes unreliable (especially for older homes) or unreported altogether. The calculation can only be made on those home sales that reported square footage.
Compass is a real estate broker licensed by the State of California, DRE 01527235. Equal Housing Opportunity. This report has been prepared solely for information purposes. The information herein is based on or derived from information generally available to the public and/or from sources believed to be reliable. No representation or warranty can be given with respect to the accuracy or completeness of the information. Compass disclaims any and all liability relating to this report, including without limitation any express or implied representations or warranties for statements contained in, and omissions from, the report. Nothing contained herein is intended to be or should be read as any regulatory, legal, tax, accounting or other advice and Compass does not provide such advice. All opinions are subject to change without notice. Compass makes no representation regarding the accuracy of any statements regarding any references to the laws, statutes or regulations of any state are those of the author(s). Past performance is no guarantee of future results.