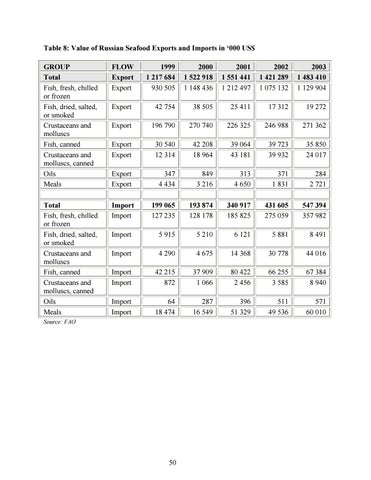
Table 8: Value of Russian Seafood Exports and Imports in ‘000 US$ GROUP Total Fish, fresh, chilled or frozen Fish, dried, salted, or smoked Crustaceans and molluscs Fish, canned Crustaceans and molluscs, canned Oils Meals Total Fish, fresh, chilled or frozen Fish, dried, salted, or smoked Crustaceans and molluscs Fish, canned Crustaceans and molluscs, canned Oils Meals
FLOW Export Export
1999 1 217 684 930 505
2000 1 522 918 1 148 436
2001 1 551 441 1 212 497
2002 1 421 289 1 075 132
2003 1 483 410 1 129 904
Export
42 754
38 505
25 411
17 312
19 272
Export
196 790
270 740
226 325
246 988
271 362
Export Export
30 540 12 314
42 208 18 964
39 064 43 181
39 723 39 932
35 850 24 017
Export Export
347 4 434
849 3 216
313 4 650
371 1 831
284 2 721
199 065 127 235
193 874 128 178
340 917 185 825
431 605 275 059
547 394 357 982
Import
5 915
5 210
6 121
5 881
8 491
Import
4 290
4 675
14 368
30 778
44 016
Import Import
42 215 872
37 909 1 066
80 422 2 456
66 255 3 585
67 384 8 940
Import Import
64 18 474
287 16 549
396 51 329
511 49 536
571 60 010
Import Import
Source: FAO
50
