Article
PengDu 1,* ,GeoffreyLittle 2 andErickRomero 1
1 CollegeofArchitectureandtheBuiltEnvironment,ThomasJeffersonUniversity,Philadelphia,PA19144,USA; erick.romero@students.jefferson.edu
2 GenesisAEC,BlueBell,PA19422,USA;littlegeoff2@yahoo.com
* Correspondence:peng.du@jefferson.edu
Abstract: Theurbandesignprocessiscomplexandinterdisciplinary,especiallyinthe contextofhigh-densitycitieswithhigh-risebuildings.Thedesignofhigh-risebuildings requiresinputfromavarietyofstakeholdersinthecity,whooftenrepresentconflicting requirementsandinterests.However,conventionaldesignapproachesstruggletoaddress thiscomplexity.Thisstudyintroducedagenerativeurbandesignapproachandappliedit toacasestudyforhigh-riseurbandevelopmentinGuangzhou,China.Specifically,7500urbanformsweregeneratedwithvariablessuchasstreetnetworks,blockoffset,building typology,andgreenspace,andthenwereevaluatedandoptimizedviamulti-objective evolutionaryalgorithms.Atotalof30,000performancevaluesweregeneratedthroughvarioussimulations.Thisstudyalsopresentedatwo-round,quantitativeevaluationprocess againsteightperformanceobjectivesfromenvironmental,social,andeconomicaspects, includingurbandensity,greenspacearea,DaylightPotential,constructioncost,HeatStress, GreenSpaceAccessibility,ViewInterest,andShadowImpact.
Keywords: generativeurbandesign;performance-baseddesign;evolutionaryalgorithm; simulation
AcademicEditor:YupengWang
Received:3January2025
Revised:10February2025
Accepted:18February2025
Published:20February2025
Citation: Du,P.;Little,G.;Romero,E. BalancingConstructionCostsand EnvironmentalandSocial PerformancesinHigh-RiseUrban Development:AGenerativeUrban DesignApproach. Buildings 2025, 15, 661. https://doi.org/10.3390/ buildings15050661
Copyright: ©2025bytheauthors. LicenseeMDPI,Basel,Switzerland. Thisarticleisanopenaccessarticle distributedunderthetermsand conditionsoftheCreativeCommons Attribution(CCBY)license (https://creativecommons.org/ licenses/by/4.0/).
1.Introduction
Citiesarefacingsignificantchallengesduetorapidurbanization,climatechange,and resourcedepletion.Therefore,designingfuturecitiesisbecomingextremelycomplexand requiresinterdisciplinarycollaborations.Onesolutionthatcitieshavebeeninvestigatingis increasingdensity.Developinghigh-risebuildingsisnottheonlywaytoincreaseurban density,buthasbecomeaviablesolution,especiallyinfast-growingcitiesinAsia.The concentrationofpeopleinhigh-risedevelopmentshasmadesignificantimpactsonthe environment,inbothpositiveandnegativeways,e.g.,greateroveralloperationalenergy efficiencyandlowercarbonemissionsvs.greaterairpollutionanddecreaseddaylight access[1,2].Inaddition,tallbuildingspresentsignificantsocialchallenges,suchasreduced communityinteractionandaccesstogreenspaces.Manystudieshaveexaminedboth theenvironmentalandsocialperformancesofhigh-risedevelopmentsqualitativelyand quantitively,butveryfewwereabletobringeconomicindicators,suchasconstructioncost, intotheequationwhenassessingtheperformanceofhigh-risedevelopments.Particularly, designersoftendonotprioritizeconstructioncostsenoughinearlydesignstages,which mightleadtopotentialcostoverruns.Estimatingtheconstructioncostsfortallbuildingsis evenmorecomplicatedduetothecomplexityoftheprojectsandlimiteddataavailability.
Urbandesignisaverycomplexprocess,especiallyinthecontextofhigh-densitycities withhigh-risebuildings,soitrequiresparticipationfromavarietyofstakeholderswho mightrepresentdifferentrequirementsandevenconflictinginterests[3,4].However, conventionaldesignapproachesstruggletoaddressthiscomplexity.Specifically,only averylimitednumberofdesignproposalsareoftendevelopedandrefinedthrough manualiterationandexperiencewithoutrigorouslytestingthefullrangeofpossibledesign schemesbyquantifyingdifferentperformanceobjectives,suchaslanduse,zoning,density, transportation,buildingmorphology,energyconsumption,andcarbonemissions[5,6]. Therefore,newdesignapproachesandtoolsareverymuchneededtobetterequipurban designerstoaddressvariouschallengesfromenvironmental,social,andeconomicaspects.
Inrecentyears,thegenerativedesignapproach,whichisaframeworkthatuses computationaldesignmethodsintegratingsimulationtoolsandevolutionaryalgorithms, wasdevelopedtogenerate,evaluate,andevolveaverylargenumberofdesignoptionsat variousscales[7,8].Thestudyintroducedinthispaperpresentedagenerativeurbandesign approachtogenerateurbanformsandevaluateandbalancetheirenvironmental,social, andeconomicperformance.Specifically,acasestudyforhigh-riseurbandevelopmentin Guangzhou,thecapitalandlargestcityofGuangdongProvinceinsouthernChina,was conductedusingthisapproach.
2.LiteratureReview
2.1.ConstructionCostofHigh-RiseBuildings
Itisgenerallyacceptedthattheconstructioncostsincreaseasthebuildingheightrises onafloorareabasis.However,veryfewempiricalstudiesontherelationshipbetween constructioncostandtheheightoftallbuildingshavebeenconducted.Recentstudies havefoundthattherelationshipbetweentheconstructioncostandbuildingheightwas representedbyaU-shapedcurve,insteadofasimplisticlinearregressionmodel[9–11].The U-shapedcurvesuggestedthattheconstructioncostpersquaremeterdecreasedinitially asthenumberofstoriesincreased,butitstartedtoriseafterpassingthebottompoint.
Theconstructioncostofhigh-risebuildingsisgreaterthanlow-risebuildingsmainly becauseofthegreatercostsforverticaltransportation,mechanicalsystems,towercranes, on-sitelabor,etc.[12,13].Thenumberofstudiesonhigh-riseconstructioncosts,especiallyforbuildingsover100mtall,isextremelylimited,largelyduetodataavailability. Tworecentstudiesontherelationshipbetweenhigh-riseconstructioncostsandbuilding heightconfirmedaU-shapedcurve[11,14].D.H.PickenandIlozorexamined24residential buildingsinHongKongrangingfrom3to39stories(heightrangingfrom9mto112m) completedintheearly1990s,andfoundthattheconstructioncostdeclineduntiltheheight reached100m,andthenraisedagain[11].BlackmanandPickenanalyzed36residential buildingsinShanghairangingfrom2to37stories(heightrangingfrom6mto115m), completedbetween2000and2007,andfoundthattheconstructioncostdeclineduntilthe heightreached24m,andthenraisedagain[14].Therawdataavailableintheliterature wereusedtopredicttheconstructioncostinthisstudy.
2.2.Multi-ObjectiveEvolutionaryAlgorithms
Evolutionaryalgorithmsarepopulation-basedmetaheuristicoptimizationmodels thatgeneratedesignsolutionspairedwithcompetingperformancemetrics.Thereare twomaintypesofdesignoptimizationinevolutionaryalgorithmsinthegenerativedesignprocess:single-objectiveoptimizationandmulti-objectiveoptimization[7].However, multi-objectiveevolutionaryalgorithmshavebeenproventobemoreeffectiveinmore complexurbancontexts.Asuccessfuloptimizationrunusingobjectiveevolutionaryalgorithmsreliesontherelationshipsbetweenthreekeymetrics:theparametersinformingthe
morphology(genes),themorphologicalcharacteristicsbeinggenerated(thephenotype), andtheperformanceobjectives(fitnessfunctions)[15].
Anincreasingamountofgenerativeurbandesignresearchhasappliedmulti-objective evolutionaryalgorithmstogenerateandoptimizeurbanformspairedwithasetofquantifiableperformanceobjectives,andtoconductandvisualizecomparativeanalysison differentdesignsolutions[16–18].However,mostofthestudiesconductedusingmultiobjectiveevolutionaryalgorithmsendedupwithaone-roundselectionprocessfromthe algorithm’soutput.However,thisone-roundselectionanalysislimitstheunderstandingof thedesignproposalswithinpre-determinedperformanceobjectives,whichcanonlybea fewgiventhecapacityofthetoolsthatarecurrentlyavailable.Someveryrecentresearch includedtwo-roundselectionstages,buttheperformancemetricsinthesecondstagewere evaluatedsubjectively.Therefore,thisstudyexaminedmoreperformanceobjectivesvia multi-objectiveevolutionaryalgorithms,byintegratingatwo-roundselectionprocesswith twodifferentsetsofquantifiableobjectivestofindoptimalsolutions.Also,mostofthestudiesfocusedonsocialandenvironmentalperformances,suchasenergy,carbon,daylight, mobility,andcomfort,butveryfewwereabletointegrateeconomicindicatorsintothe overalldesignperformance.Therefore,theresearchmethodsintroducedintheResearch Methodologysectionbelowwillfillthesetwosignificantresearchgapsbyintegrating constructioncostsandawiderangeofenvironmentalandsocialperformanceindicators intoagenerativeurbandesignworkflow.
3.ResearchMethodology
3.1.UrbanFormandPerformanceObjectives
ThisstudybeganwiththecreationofaparametricurbanmodelusingUrbano,an urbanmobilitymodelingpluginforRhino/Grasshopper,withdataloadedfromGISand OpenStreetMap(OSM)[19,20].Then,analgorithmwascreatedtogeneratetheurbanform, withvariablessuchasstreetnetworks,blockoffsets,buildings,andgreenspaces,and meanwhileexaminingtheperformanceoftheseurbanformsthroughvariousGrasshopper plugins.Thisstudyconductedatwo-round,quantitativeevaluationprocess.Specifically, thestudyintegrated4performanceobjectives,includingurbandensity,greenspacearea, DaylightPotential,andconstructioncosts,intotheevolutionaryalgorithmsinthefirstroundselectionprocess,followedbyanotherroundofevaluationbyusingadifferentset of4performanceobjectives,includingHeatStress,GreenSpaceAccessibility,ViewInterest, andShadowImpact(Table 1).
Table1. Theperformanceobjectivesusedinthetwo-round,quantitativeevaluationprocess.
3DaylightPotentialTheratioofthebuilding facadeswithdirectsun
Thewalkingdistancesconnecting thegreenspaceswithinthesite fromthesurrounding neighborhoods
directviewaccesstotheriver
3 Daylight Potential
Table1. Cont.
The ratio of the building facades with direct sun exposure
4 Construction Cost The total cost of constructing all the buildings
4ConstructionCostThetotalcostof constructingallthe buildings
3.2. Construction Cost Estimates
3.2.ConstructionCostEstimates
from the surrounding neighborhoods
View Interest ratio of the building facades with direct view access to the river
Shadow Impact Direct sun exposure to the buildings outside the site boundary
buildingsoutsidethesite boundary
The research used data from the study on Hong Kong high-rise construction costs [11] introduced in the Literature Review section due to the geographical proximity to the study area in Guangzhou, and then conducted a quadratic regression analysis, which is a statistical method to model a relationship between two sets of variables. Specifically, a quadratic regression model (y = 0.0809x2 16.13x + 2062.6, R2 = 0.32) was created to predict the estimated construction costs of the buildings, with a height up to 250 m The development of buildings taller than 250 m has been strictly restricted since 2022 by the Chinese government. Therefore, the research used 250 m as the height limit of buildings (Figure 1). As the Hong Kong study was conducted in 2001, the construction cost growth over time was factored in based on the Building Works Tender Price Index (BWTPI) [21], and then the prices were converted to United States Dollars (USD) from Hong Kong Dollars (HKD) The Hong Kong study was conducted in April 2001, so this study used 2001 Quarter 1 and the latest available 2023 Quarter 3 data from the Building Works Tender Price Index (BWTPI) to project the estimated construction costs for today (Hong Kong Architectural Services Department, n.d.). The study used 0.13 as the conversion rate from Hong Kong Dollars (HKD) to United States Dollars (USD.
TheresearchuseddatafromthestudyonHongKonghigh-riseconstructioncosts[11] introducedintheLiteratureReviewsectionduetothegeographicalproximitytothe studyareainGuangzhou,andthenconductedaquadraticregressionanalysis,whichis astatisticalmethodtomodelarelationshipbetweentwosetsofvariables.Specifically, aquadraticregressionmodel(y=0.0809x2 16.13x+2062.6,R2 =0.32)wascreatedto predicttheestimatedconstructioncostsofthebuildings,withaheightupto250m.The developmentofbuildingstallerthan250mhasbeenstrictlyrestrictedsince2022bythe Chinesegovernment.Therefore,theresearchused250mastheheightlimitofbuildings (Figure 1).AstheHongKongstudywasconductedin2001,theconstructioncostgrowth overtimewasfactoredinbasedontheBuildingWorksTenderPriceIndex(BWTPI)[21], andthenthepriceswereconvertedtoUnitedStatesDollars(USD)fromHongKongDollars (HKD).TheHongKongstudywasconductedinApril2001,sothisstudyused2001Quarter 1andthelatestavailable2023Quarter3datafromtheBuildingWorksTenderPriceIndex (BWTPI)toprojecttheestimatedconstructioncostsfortoday(HongKongArchitectural ServicesDepartment,n.d.).Thestudyused0.13astheconversionratefromHongKong Dollars(HKD)toUnitedStatesDollars(USD).

Figure 1. The quadratic regression model of the construction cost (USD/m2) vs. building height (m), with the plots representing data from the Hong Kong study [11]
Figure1. Thequadraticregressionmodeloftheconstructioncost(USD/m2)vs.buildingheight(m), withtheplotsrepresentingdatafromtheHongKongstudy[11].
3.3.Multi-ObjectiveOptimization
Amulti-objectiveevolutionaryalgorithmwasdevelopedusingWallacei,anevolutionaryandanalyticpluginforRhino/Grasshopper.Throughthisalgorithm,theperformance ofeachdesignobjectiveofeverysingleiterationwasevaluatedandoptimized.Then,the
paretofrontsolutionswereused,whichareasetofsolutionsthatarenon-dominated, representingthefactthattheoptimaltrade-offsbetweendifferentobjectiveswhenimprovingoneobjectivecannotbeobtainedwithoutworseninganother.Selectingparetofront solutionshelpedtheselectionprocessfocusonthegroupsofefficientoptionsandmake tradeoffswithinthisset,ratherthanconsideringthefull-sizepopulation(thetotalnumber ofiterations).Further,aK-meansclusteringalgorithmwasappliedtothepoolofthepareto frontsolutions,sothesesolutionswereorganizedintoclustersbasedontheirsimilarity. Inthisprocess,thesolutionclosesttothecenterofeachclusterwasselected.Lastly,afew additionalsolutionswereselected,includingthemostoptimalsolutionforeachperformanceobjective,the“AverageSolution”(withtheclosetequalweightingbetweenallthe performanceobjectives)andthe“IdealSolution”(withtheclosestoptimalresultforall theperformanceobjectives).The“AverageSolution”isconsideredanon-existentoptimal solutionintheobjectivespace,withtheclosestequalweightingbetweenallthedesign objectives.Similarly,the“IdealSolution”isalsoconsideredanon-existentoptimalsolution intheobjectivespace,andthustheselectedsolutionistheonenearesttothispointbased onaEuclideanmeasurebetweenthetwo[15].
4.CaseStudy:High-RiseUrbanDevelopmentinGuangzhou,China
4.1.SiteAnalysis
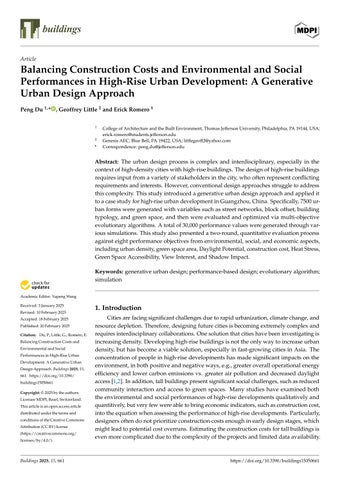
ThesiteisintheInternationalBusinessDistrict,afast-growing,high-densityarea inGuangzhou,China.SituatedalongsidethePearlRiverinthesouth,thesiteisalso adjacenttoacanalintheEast(Figure 2).Theareaofthesiteisapprox.73,000m2 and isexpectedtobedevelopedintoahigh-riseurbancomplex,withabuildingheightlimit of250m.Therefore,thekeyfocusofthedesignwastoincreasetheurbandensitybut alsobalanceenvironmentalandsocialimplications.Oneofthemajorchallengesfora high-rise,mixed-usedevelopmentistheshadowcausedbythebuildings,soincreasing daylightaccesswasoneofthekeydesignstrategies.Boththeriverandcanalareimportant ecologicalandenvironmentalassetstothesite,sothedesignstrategiesalsoincludedan increaseinthevisualconnectionswiththewateraswellastheaccessibilitytoopenspaces. Duetoacceleratedclimatechange,heathassignificantlyimpactedoursociety,including ariseinheat-relateddeaths,formanycitiesnationallyandinternationally[22],andthis isparticularlytrueforcitieswithhotandhumidclimaticconditions,suchasGuangzhou. Thus,thisstudyalsoimplementedstrategiestomitigatetheheatimpact.Therearevery limitedgreenspacesinthesurroundingurbancontext,sothedesignalsofocusedon creatingmoregreenspaces,notonlyonthegroundlevelbutalsothroughtherooftops.
4.2.FormGenerationandPerformanceEvaluation
Themainelementsoftheurbanformincludedstreets,parcels,buildings,andopen spaces.A20m-widegreencorridorwascreatedalongsidethecanaltobearecreational andecologicalspaceonthewaterfront.Atotalof3buildingtypeswerecreatedbased ontheheightandprogram:BuildingType1forofficeandmix-usedwithaheightrange of175–250m,BuildingType2forresidentialusedwithaheightrangeof75–150m,and BuildingType3forretailandentertainmentwithaheightrangeof25–50m.Inorderto reducethepressureofhigh-risebuildingsonthestreetlevel,andtocreaterooftopspaces foractivities,allthreebuildingtypeshavepodiums,withaheightrangeof24–40mfor BuildingType1,and8–24mforBuildingTypes2and3.Thefloorheightwassettobe4m acrossallthebuildings.
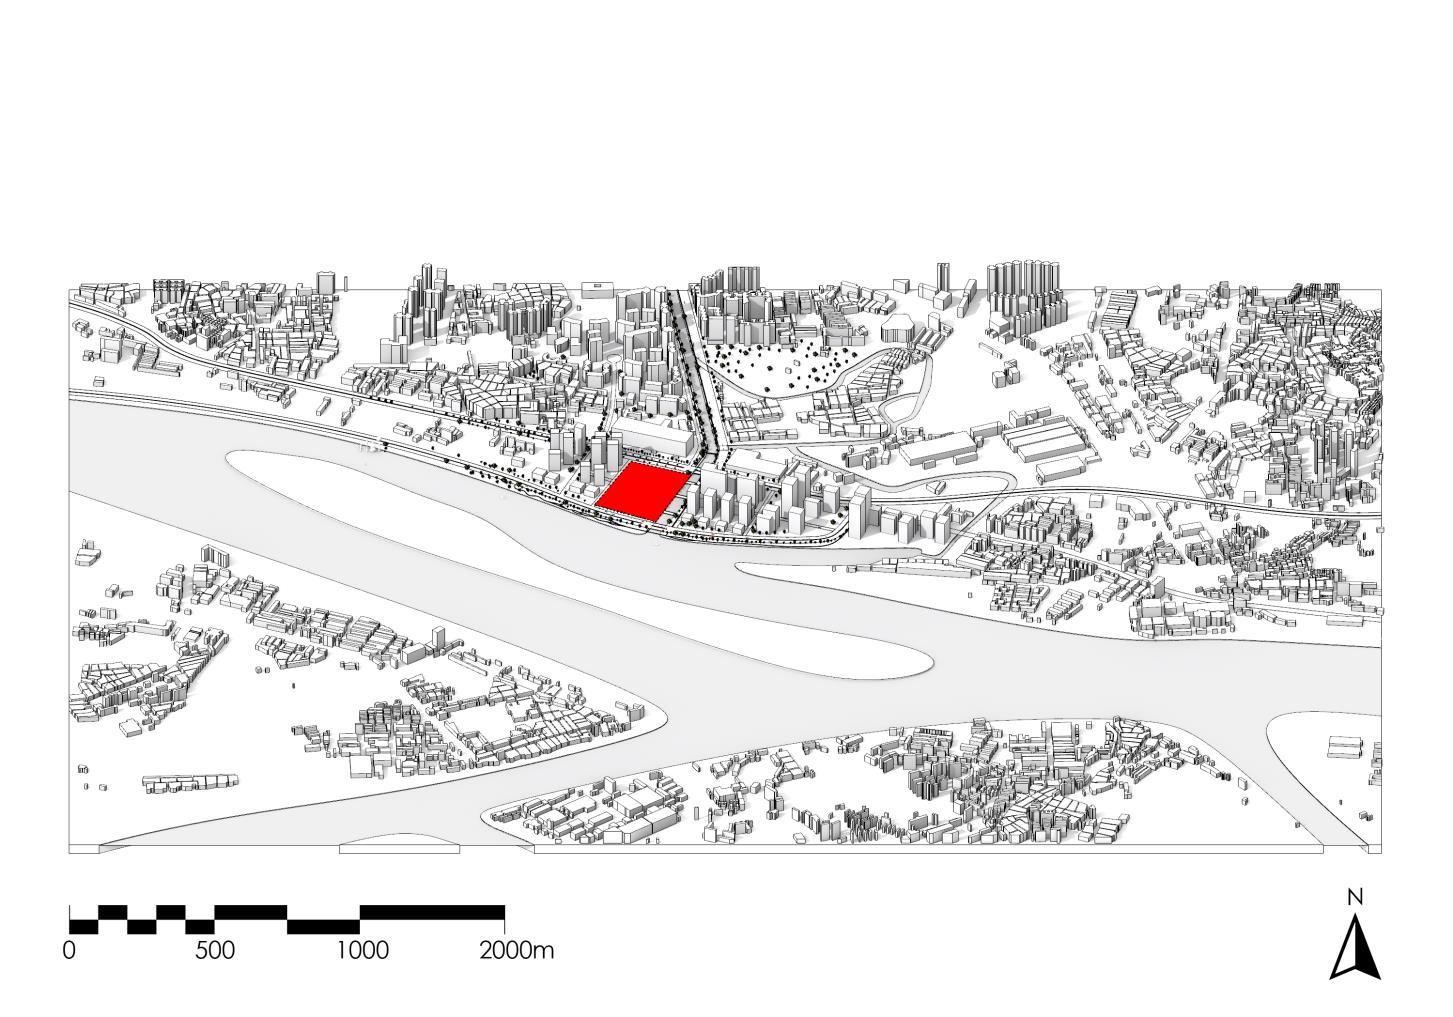
Figure2. Thestudysite,highlightedinred,anditssurroundingurbancontext.
Figure 2. The study site, highlighted in red, and its surrounding urban context.
4.2.
Form Generation and Performance Evaluation
The main elements of the urban form included streets, parcels, buildings, and open spaces. A 20 m-wide green corridor was created alongside the canal to be a recreational and ecological space on the waterfront. A total of 3 building types were created based on the height and program: Building Type 1 for office and mix-used with a height range of 175–250 m, Building Type 2 for residential used with a height range of 75–150 m, and Building Type 3 for retail and entertainment with a height range of 25–50 m. In order to reduce the pressure of high-rise buildings on the street level, and to create rooftop spaces for activities, all three building types have podiums, with a height range of 24–40 m for Building Type 1, and 8–24 m for Building Types 2 and 3. The floor height was set to be 4 m across all the buildings.
Theurbanformgenerationprocessincludedninemajorsteps(Figure 3):(a)adding movablepointsonthesiteboundary;(b)connectingthepointswithoffsettocreatestreets; (c)creatingparcelsandallocatinggreenspaces(occupancyrange:1–3parcels);(d)allocatingbuildingtypes,withType1inred(occupancyrange:1–3parcels),Type2inblue (occupancyrange:1–5parcels),andType3inyellow(occupancyrange:remainingparcels); (e)randomlyselectingoneoutofthefourcornerpointsofeachparcel,andscalingdown theparceltobethefootprintofthemainbuilding;(f)scalinguptheparcelbasedonthe pointselectedtocreatethefootprintoftheassociatedpodium;(g)extrudingthefootprint ofthemainbuildings;(h)extrudingthefootprintofthepodiums;And(i)identifyingextra greenspacesinadditiontothegreenspacesonthegroundallocatedatStep(c),including unbuiltlandswithintheparcelsiftheareaisgreaterthan1000m2 (otherwiseturnedintoa plaza)aswellasthepodiumroofsiftheareaisgreaterthan500m2 (otherwiseturnedinto aroofdeck).
The urban form generation process included nine major steps (Figure 3): (a) adding movable points on the site boundary; (b) connecting the points with offset to create streets; (c) creating parcels and allocating green spaces (occupancy range: 1–3 parcels); (d) allocating building types, with Type 1 in red (occupancy range: 1–3 parcels), Type 2 in blue (occupancy range: 1–5 parcels), and Type 3 in yellow (occupancy range: remaining parcels); (e) randomly selecting one out of the four corner points of each parcel, and scaling down the parcel to be the footprint of the main building; (f) scaling up the parcel based on the point selected to create the footprint of the associated podium; (g) extruding the footprint of the main buildings; (h) extruding the footprint of the podiums; And (i) identifying extra green spaces in addition to the green spaces on the ground allocated at Step (c), including unbuilt lands within the parcels if the area is greater than 1000 m2 (otherwise
AsintroducedintheResearchMethodologysection,fourperformanceobjectiveswere integratedintotheevolutionaryalgorithm(Figure 4),throughthefollowingcalculationand measurement:(a)TheFloorAreaRatio(FAR)=thetotalfloorarea/totalsitearea.(b)The GreenAreaRatio(GAR)=thetotalareaofthegreenspaces/totalsitearea.Thegreen spacesincludedthegreencorridor(5997m2)alongsidethecanal,thededicatedparcelsfor greenspaces,aswellastheareasofthepodiumroofs(if>500m2).(c)DaylightPotentialis measuredbytheratioofthebuildingfloorswithdirectsunexposurethroughthefacades toallthebuildingfloors.Theanalysisranfrom9a.m.to5p.m.ontheWinterSolstice inGuangzhou,with2hofminimaldirectsunexposure.Analgorithmwasdevelopedto contourthebuildingseverytwofloorsandthenconnectthemidpointoneachexploded segmentofthebuildingstothepointsintheskypresentingthesun’slocationsduringthe analysisperiod.(d)Theconstructioncost,measuredbythetotalconstructioncostofallthe buildingsinUSDinmillions.Thepricepersquaremeterforeachbuildingwasdetermined basedonthebuildingheightandthequadraticregressionmodel(y=0.0809x2 16.13x +2062.6,R2 =0.32),andthenwasmultipliedbytheGFAofeachrespectivebuildingto estimatethetotalconstructioncost.

exploded segment of the buildings to the points in the sky presenting the sun’s locations during the analysis period. (d) The construction cost, measured by the total construction cost of all the buildings in USD in millions. The price per square meter for each building was determined based on the building height and the quadratic regression model (y 0.0809x2 16.13x + 2062.6, R2 = 0.32), and then was multiplied by the GFA of each respective building to estimate the total construction cost.
Figure3. Thestep-by-stepprocessforgeneratingtheurbanform:(a)streetnodegeneration; (b)streetnetworkgeneration;(c)greenspaceallocation;(d)buildingallocationwithdifferenttypologies;(e)towerfootprintgeneration;(f)podiumfootprintgeneration;(g)towervolumegeneration; (h)podiumvolumegeneration;(i)urbanmassinggeneration.
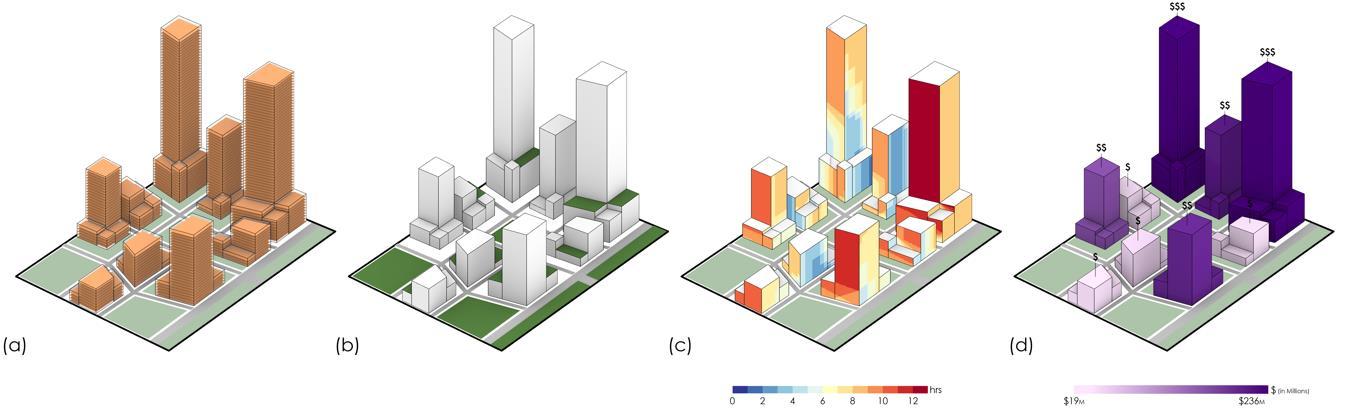
Figure 3. The step-by-step process for generating the urban form: (a) street node generation; (b) street network generation; (c) green space allocation; (d) building allocation with different typologies; (e) tower footprint generation; (f) podium footprint generation; (g) tower volume generation; (h) podium volume generation; (i) urban massing generation performance objectives were integrated into the evolutionary algorithm (Figure 4), through the following calcutotal floor area/total site total area of the green spaces/total site area. ) alongside the canal, the dedicated ). (c) Daylight measured by the ratio of the building floors with direct sun exposure through on the Winter minimal direct sun exposure. An algorithm was developed to contour the buildings every two floors and then connect the midpoint on each
Figure4. Avisualizationofthequantificationofthe4performanceobjectivesinthefirst-round evaluationprocess(fromlefttoright):(a)FloorAreaRatio(FAR);(b)GreenAreaRatio(GAR); (c)DaylightPotential;(d)constructioncost.
Figure 4. A visualization of the quantification of the 4 performance objectives in the first-round evaluation process (from left to right): (a) Floor Area Ratio (FAR); (b) Green Area Ratio (GAR); (c Daylight Potential; (d) construction cost.
5. Analysis and Selection
5.1. Result Analysis
The algorithm ran a total population of 7500 (design solutions) via Wallacei comprised of 100 generations with 75 solutions each. Each solution included four performance objective values, so there were 30,000 values in total. Each performance objective (fitness function) was analyzed separately across four key metrics: the standard deviation, fitness
5.AnalysisandSelection
5.1.ResultAnalysis
Thealgorithmranatotalpopulationof7500(designsolutions)viaWallaceicomprised of100generationswith75solutionseach.Eachsolutionincludedfourperformanceobjectivevalues,sotherewere30,000valuesintotal.Eachperformanceobjective(fitness function)wasanalyzedseparatelyacrossfourkeymetrics:thestandarddeviation,fitness values(performancevalues),thestandarddeviationtrendline,andthemeanvaluetrendline(Figure 5).Thesimulationwasproventobesuccessfulinimprovingthemeanvalues forPerformanceObjective1(FAR)andPerformanceObjective2(GAR)basedonthemean valuetrendline.Thevariationofsolutionsfluctuatedthroughoutanddidnotconverge towardanoptimalresultforPerformanceObjective3(DaylightPotential)andPerformance Objective4(constructioncost).
Figure5. Theresultsofthemulti-objectiveevolutionaryalgorithm.Eachperformanceobjective (fitnessfunction)wasanalyzedagainstfourmetrics(fromlefttoright):thestandarddeviation,fitness values(performancevalues),thestandarddeviationtrendline,andthemeanvaluetrendline.
Figure 5. The results of the multi-objective evolutionary algorithm. Each performance objective (fitness function) was analyzed against four metrics (from left to right): the standard deviation, fitness values (performance values), the standard deviation trendline, and the mean value trendline.
5.2.EvaluationandSelection
5.2.
Evaluation and Selection
AsintroducedintheResearchMethodologysection,atwo-roundselectionprocess wasconducted.Inthefirstround,809paretofrontsolutionsoutoftheentirepopulation (e.g.,7500iterations)wereidentified.Then,theseselectedsolutionsweregroupedinto 20clustersviaaK-meansclusteringalgorithm.Specifically,thesolutionclosesttothecenter ofeachclusterwaspicked,soatotalof20solutionswereselected.Inaddition,theoptimal solutionforeachperformanceobjective,e.g.,thehighestFloorAreaRatio(FAR),thehighest GreenAreaRatio(GAR),thegreatestDaylightPotential,andthelowestconstructioncost, wereselected,totalingfousolutions.Finally,twomorespecialsolutions,the“Average Solution”and“IdealSolution”,wereselected.The“IdealSolu-tion”happenedtobethe sameastheoptimalsolutionfortheDaylightPotential,so,thenumberoftheselected solutionswasreducedto25from7500(Figure 6).
As introduced in the Research Methodology section, a two-round selection process was conducted. In the first round, 809 pareto front solutions out of the entire population (e.g., 7500 iterations) were identified. Then, these selected solutions were grouped into 20 clusters via a K-means clustering algorithm. Specifically, the solution closest to the center of each cluster was picked, so a total of 20 solutions were selected. In addition, the optimal solution for each performance objective, e.g., the highest Floor Area Ratio (FAR), the highest Green Area Ratio (GAR), the greatest Daylight Potential, and the lowest construction cost, were selected, totaling fou solutions. Finally, two more special solutions, the “Average Solution” and “Ideal Solution”, were selected. The “Ideal Solution” happened to be the same as the optimal solution for the Daylight Potential, so, the number of the selected solutions was reduced to 25 from 7500 (Figure 6).

Figure6. A3Daerialviewrenderoftheselected25solutionsandtheirassociatedradarcharts.
Figure 6. A 3D aerial view render of the selected 25 solutions and their associated radar charts.
Theresultofeachperformanceobjectiveforeachsolution,includingtheabsolute valueanditsrankingamongallthe7500solutions,wasexported,analyzed,andvisualized viaWallacei(Figure 7).LowervaluesrepresentbetterperformanceonWallacei.“Solution (Gen.68|Ind.43)”wasfoundtobethe“AverageSolution”(withtheclosetequalweighting betweenthefourperformanceobjectives),presenting5.33FAR(ranking#3741/7500),32% GreenAreaRatio(ranking#4229/7500),39%DaylightPotential(ranking#3802/7500),and aconstructioncostofUSD714.48million(ranking#4171/7500).“Solution(Gen.53|Ind. 2)”wasfoundtobethe“IdealSolution”(theclosestoptimalresultforthefourperformance objectives),presenting3.75FAR(ranking#6517/7500),36%GreenAreaRatio(ranking #2551/7500),55%DaylightPotential(ranking#1/7500),andaconstructioncostofUSD 193.17million(ranking#764/7500).
The result of each performance objective for each solution, including the absolute value and its ranking among all the 7500 solutions, was exported, analyzed, and visualized via Wallacei (Figure 7). Lower values represent better performance on Wallacei. “Solution (Gen. 68|Ind. 43)” was found to be the “Average Solution” (with the closet equal weighting between the four performance objectives), presenting 5.33 FAR (ranking # 3741/7500), 32% Green Area Ratio (ranking # 4229/7500), 39% Daylight Potential (ranking# 3802/7500), and a construction cost of USD 714.48 million (ranking # 4171/7500). “Solution (Gen. 53|Ind. 2)” was found to be the “Ideal Solution” (the closest optimal result for the four performance objectives), presenting 3.75 FAR (ranking # 6517/7500), 36% Green Area Ratio (ranking # 2551/7500), 55% Daylight Potential (ranking# 1/7500), and a construction cost of USD 193.17 million (ranking # 764/7500).
Figure 7. Examples of the design (3D model and site plan) and performance analysis (radar chart and parallel coordinate plot chart) (from left to right): (a) the optimal solution for the Floor Area Ratio (FAR); (b) the optimal solution for the Green Area Ratio (GAR); and (c) the “Ideal Solution”, the same as the optimal solution for the Daylight Potential.
Figure7. Examplesofthedesign(3Dmodelandsiteplan)andperformanceanalysis(radarchartand parallelcoordinateplotchart)(fromlefttoright):(a)theoptimalsolutionfortheFloorAreaRatio (FAR);(b)theoptimalsolutionfortheGreenAreaRatio(GAR);and(c)the“IdealSolution”,thesame astheoptimalsolutionfortheDaylightPotential.
5.3.Second-RoundEvaluation
5.3. Second-Round Evaluation
Inordertoofferamorecomprehensiveunderstandingoftheoverallperformanceof thedesignproposalsproducedbythealgorithms,anadditionalfourperformanceobjectives wereaddedtofurtherevaluatethe25selectedsolutions(Figure 8)throughthefollowing calculationsandmeasurements:(a)HeatStresswasmeasuredbytheratioofthenumber of“heatstress”hourstothetotalhoursreflectingtheUniversalThermalClimateIndex (UTCI)ononeofthehottestdaysinGuangzhou.Sixcategoriesaredefinedtoreflectthe UTCIconditions:NoThermalStress (9 ≤ UTCI<26),SlightHeatStress (26 ≤ UTCI<28), ModerateHeatStress(28 ≤ UTCI<32),StrongHeatStress(32 ≤ UTCI<38),VeryStrong HeatStress(38 ≤ UTCI<46),andExtremeHeatStress(46<UTCI).The“heatstress” definedinthisstudyincludedthethreestrongestHeatStresslevels:StrongHeatStress, VeryStrongHeatStress,andExtremeHeatStress.26Augustto1Septemberwasfound tobethehottestweekinGuangzhou.ThestudyrantheUTCIsimulationon26August forthefulldayandcalculatedthe“heatstress”hours.(b)GreenSpaceAccessibility(GSA) wasmeasuredbythewalkingdistancesbetweenthegreenspacesandthesurrounding neighborhoods.Twocornerpointsonthenorthboundaryofthesiteweresetasthestarting pointsforwalkingtowardsthegreenspaceswithinthesite.Theaveragelengthofthe pedestrianpathsfromthestartingpointstothemiddlepointsofthedesignatedgreen spaceswasusedforcomparison.(c)TheViewInterestwasmeasuredbytheratioofthe buildingfloorswithadirectvisualconnectionwiththecanaltoallthebuildingfloors.The visualconnectiontotheriverwasexcludedinthequantificationoftheViewInterest.The riverisinthesouth,sooptimizingtheviewtotheriverwouldleadtotheproductionof similarsolutionstooptimizingtheDaylightPotential.Itisimportanttosetupcompeting objectivesinthemulti-objectiveevolutionaryalgorithm.Analgorithmwasdeveloped tocontourthebuildingseverytwofloorsandtoconnectthemidpointoneachexploded segmentofthebuildingstothemiddlelineoftheportionofthecanaladjacenttothesite. (d)TheShadowImpactwasmeasuredbythechangeofthedirectsunhoursonthefacades ofthesurroundingbuildingsimmediatelyoutsidethesiteboundarywithandwithoutthe proposedurbandevelopment.
In order to offer a more comprehensive understanding of the overall performance of the design proposals produced by the algorithms, an additional four performance objectives were added to further evaluate the 25 selected solutions (Figure 8) through the following calculations and measurements: (a) Heat Stress was measured by the ratio of the number of “heat stress” hours to the total hours reflecting the Universal Thermal Climate Index (UTCI) on one of the hottest days in Guangzhou. Six categories are defined to reflect the UTCI conditions: No Thermal Stress (9 ≤ UTCI < 26), Slight Heat Stress (26 ≤ UTCI < 28), Moderate Heat Stress (28 ≤ UTCI < 32), Strong Heat Stress (32 ≤ UTCI < 38), Very Strong Heat Stress (38 ≤ UTCI < 46), and Extreme Heat Stress (46 < UTCI). The “heat stress” defined in this study included the three strongest Heat Stress levels: Strong Heat Stress, Very Strong Heat Stress, and Extreme Heat Stress. 26 August to 1 September was found to be the hottest week in Guangzhou. The study ran the UTCI simulation on 26 August for the full day and calculated the “heat stress” hours. (b) Green Space Accessibility (GSA) was measured by the walking distances between the green spaces and the surrounding neighborhoods. Two corner points on the north boundary of the site were set as the starting points for walking towards the green spaces within the site. The average length of the pedestrian paths from the starting points to the middle points of the designated green spaces was used for comparison. (c) The View Interest was measured by the ratio of the building floors with a direct visual connection with the canal to all the building floors. The visual connection to the river was excluded in the quantification of the View Interest. The river is in the south, so optimizing the view to the river would lead to the production of similar solutions to optimizing the Daylight Potential. It is important to set up competing objectives in the multi-objective evolutionary algorithm. An algorithm was developed to contour the buildings every two floors and to connect the midpoint on each exploded segment of the buildings to the middle line of the portion of the canal adjacent to the site. (d) The Shadow Impact was measured by the change of the direct sun hours on the facades of the surrounding buildings immediately outside the site boundary with and without the proposed urban development.
Thestudyconductedsimulationsonthesefouradditionalperformanceobjectivesfor the25selectedsolutionsthroughvariousRhino/Grasshopperplugins.Then,thesimulation resultswerecombinedwiththeresultsofthepreviousfourperformanceobjectivesforthe finalevaluation.Arankingcriterionwasdevelopedtoevaluatetheoverallperformance ofeachsolution.Specifically,theaveragevalueofeachperformanceobjectivewasset asathreshold,andiftheperformancevaluewasbetterthantheaverage,onepointwill begained.Performingbetterthantheaveragedidnotmeanthatthevaluewasgreater
Figure 8. A visualization of the quantification of the 4 performance objectives in the second-round evaluation process (from left to right): (a) Heat Stress; (b) Green Space Accessibility (GSA); (c) View Interest; (d) Shadow Impact.
thantheaverage.ThehighervaluethebetterfortheperformanceobjectivesFAR,GAR, Daylight,andViewInterest;andthelowervaluethebetterfortheperformanceobjectives constructioncost,HeatStress(UTCI),GreenSpaceAccessibility,andShadowImpact.For example,theaverageFARamongallthe25solutionswas5.43,soasolutionwithaFAR greaterthan5.43receivedonepoint,otherwiseitreceivednopoint.Thefinalrankingof thesolutionswasgeneratedbasedonthetotalpoints(Figure 9).
The study conducted simulations on these four additional performance objectives for the 25 selected solutions through various Rhino/Grasshopper plugins. Then, the simulation results were combined with the results of the previous four performance objectives for the final evaluation. A ranking criterion was developed to evaluate the overall performance of each solution. Specifically, the average value of each performance objective was set as a threshold, and if the performance value was better than the average, one point will be gained. Performing better than the average did not mean that the value was greater than the average. The higher value the better for the performance objectives FAR, GAR, Daylight, and View Interest; and the lower value the better for the performance objectives construction cost, Heat Stress (UTCI), Green Space Accessibility, and Shadow Impact. For example, the average FAR among all the 25 solutions was 5.43, so a solution with a FAR greater than 5.43 received one point, otherwise it received no point. The final ranking of the solutions was generated based on the total points (Figure 9).
Figure 8. A visualization of the quantification of the 4 performance objectives in the second-round evaluation process (from left to right): (a) Heat Stress; (b) Green Space Accessibility (GSA); (c) View Interest; (d) Shadow Impact.
Figure8. Avisualizationofthequantificationofthe4performanceobjectivesinthesecond-round evaluationprocess(fromlefttoright):(a)HeatStress;(b)GreenSpaceAccessibility(GSA);(c)View Interest;(d)ShadowImpact.
The study conducted simulations on these four additional performance objectives for the 25 selected solutions through various Rhino/Grasshopper plugins. Then, the simulation results were combined with the results of the previous four performance objectives for the final evaluation. A ranking criterion was developed to evaluate the overall performance of each solution. Specifically, the average value of each performance objective was set as a threshold, and if the performance value was better than the average, one point will be gained. Performing better than the average did not mean that the value was greater than the average. The higher value the better for the performance objectives FAR, GAR, Daylight, and View Interest; and the lower value the better for the performance objectives construction cost, Heat Stress (UTCI), Green Space Accessibility, and Shadow Impact. For example, the average FAR among all the 25 solutions was 5.43, so a solution with a FAR greater than 5.43 received one point, otherwise it received no point. The final ranking of the solutions was generated based on the total points (Figure 9).
Figure9. Thefinalrankingoftheselected25solutions,highlightingthevaluesoftheperformance objectivesperformingbetterthantheaverages.
Followingthisapproach,nosolutionreceivedeightorsevenpoints.Thetop-ranked solutionsincludedonesolutionwithsixpointsandfoursolutionswithfivepointseach (Figure 10).“Solution(Gen.41|Ind.60)”wasfoundtohavethebestoverallperformance,
withsixobjectivesperformingbetterthantheaverages,includingtheGreenSpaceRatio (GAR),theDaylightPotential,theconstructioncost,GreenSpaceAccessibility(GSA),View Interest,andShadowImpact.

Figure10. Thetop5bestoverallperformingsolutionsandtheassociatedradarchartsrepresenting theperformanceresults.
Figure 10. The top 5 best overall performing solutions and the associated radar charts representing the performance results.
6. Discussion
Linearrelationshipsbetweensomeperformanceindicatorswerefoundaspredicted, e.g.,thehighertheFARthegreatertheconstructioncost,butsomerelationshipswere dynamic,whichoffereduniqueinsightsforurbandesigners.Forexample,“Solution(Gen. 20|Ind.66)”hadthefourthhighestFAR(6.91)withanabove-averageGAR(36%),meaning thatwecouldstillobtainlargegreenspacesinanultra-denseurbandevelopment;“Solution (Gen.66|Ind.02)”hadabelow-averageGAR(29%)withthethirdgreatestGSA(153.8), meaningthatwecouldstillmakethegreenspaceverymuchaccessibleeventhoughthe sizeofthegreenspaceislimited.
6.Discussion
This study introduced a generative urban design approach to address complex and interdisciplinary challenges in the context of high-rise urban development. Specifically, multi-objective evolutionary algorithms were used to generate and evaluate how morphological variation evolved in response to conflicting performance objectives across environmental, social, and economic aspects. One of the major limitations of multiobjective evolutionary algorithms in urban design is the very limited number of objectives that can be applied in the algorithms due to the capacity of the tools that are currently available, as well as the simulation time; therefore, many studies have used subjective indicators to expand the scope of the performance matrix. The two-round, quantitative evaluation process with two different sets of performance objectives (totaling eight performance objectives) presented in this study offers an innovative approach to expanding the number of quantifiable performance objectives, filtering a large solution set (totaling 7500 urban forms with 30,000 performance values), and understanding each solution’s performance environmentally, socially, and economically. Particularly, integrating construction cost into the algorithms as one performance objective is a unique contribution to the early stage of urban design. There are other important indicators involved in urban design that are hard to quantify, e.g., cultural and aesthetic considerations. How to integrate such indicators into a generative urban design workflow, either through algorithms or other analytical approaches, should be explored in future research.
Thisstudyintroducedagenerativeurbandesignapproachtoaddresscomplexand interdisciplinarychallengesinthecontextofhigh-riseurbandevelopment.Specifically, multi-objectiveevolutionaryalgorithmswereusedtogenerateandevaluatehowmorphologicalvariationevolvedinresponsetoconflictingperformanceobjectivesacrossenvironmental,social,andeconomicaspects.Oneofthemajorlimitationsofmulti-objective evolutionaryalgorithmsinurbandesignistheverylimitednumberofobjectivesthatcan beappliedinthealgorithmsduetothecapacityofthetoolsthatarecurrentlyavailable, aswellasthesimulationtime;therefore,manystudieshaveusedsubjectiveindicators toexpandthescopeoftheperformancematrix.Thetwo-round,quantitativeevaluation processwithtwodifferentsetsofperformanceobjectives(totalingeightperformanceobjectives)presentedinthisstudyoffersaninnovativeapproachtoexpandingthenumber ofquantifiableperformanceobjectives,filteringalargesolutionset(totaling7500urban formswith30,000performancevalues),andunderstandingeachsolution’sperformance environmentally,socially,andeconomically.Particularly,integratingconstructioncostinto thealgorithmsasoneperformanceobjectiveisauniquecontributiontotheearlystageof urbandesign.Thereareotherimportantindicatorsinvolvedinurbandesignthatarehard toquantify,e.g.,culturalandaestheticconsiderations.Howtointegratesuchindicators intoagenerativeurbandesignworkflow,eitherthroughalgorithmsorotheranalytical approaches,shouldbeexploredinfutureresearch.
Itisimportanttohighlightthatthegenerativeurbandesignworkflowdevelopedin thisstudywasnotintendedtogiveadefinitiveansweronwhichsolutionisthebest.As discussedabove,theurbandesignprocessiscomplex,soitrequiresinputfromavariety ofstakeholderswhooftenrepresentconflictingrequirementsandinterests.Theranking criterionproposedinthestudytreatedeachoftheeightperformanceobjectivesequally,
It is important to highlight that the generative urban design workflow developed in this study was not intended to give a definitive answer on which solution is the best. As discussed above, the urban design process is complex, so it requires input from a variety of stakeholders who often represent conflicting requirements and interests. The ranking criterion proposed in the study treated each of the eight performance objectives equally, but future research may apply different weights to the metrics representing the priorities of certain stakeholders. Using the performance objectives in this study as an example, developers might give more weight to the construction cost, urban designers might give more weight to Shadow Impact, and landscape architects might give more weight to the Green Area Ratio and accessibility. Also, different weights might be given based on the project’s location and climatic environment. In this study, for example, more weight could be given to Heat Stress and Shadow Impact, as Guangzhou has a subtropical monsoon climate with high temperatures and humidity in summer.
Author Contributions: Conceptualization, P.D.; methodology and analysis, P.D. and G.L.; software and visualization, G.L. and E.R.; writing original draft preparation, P.D.; writing review and
butfutureresearchmayapplydifferentweightstothemetricsrepresentingthepriorities ofcertainstakeholders.Usingtheperformanceobjectivesinthisstudyasanexample, developersmightgivemoreweighttotheconstructioncost,urbandesignersmightgive moreweighttoShadowImpact,andlandscapearchitectsmightgivemoreweighttothe GreenAreaRatioandaccessibility.Also,differentweightsmightbegivenbasedonthe project’slocationandclimaticenvironment.Inthisstudy,forexample,moreweightcould begiventoHeatStressandShadowImpact,asGuangzhouhasasubtropicalmonsoon climatewithhightemperaturesandhumidityinsummer.
AuthorContributions: Conceptualization,P.D.;methodologyandanalysis,P.D.andG.L.;software andvisualization,G.L.andE.R.;writing—originaldraftpreparation,P.D.;writing—reviewandediting,P.D.,G.L.andE.R.Allauthorshavereadandagreedtothepublishedversionof themanuscript.
Funding: Thisresearchreceivednoexternalfunding.
DataAvailabilityStatement: Theoriginalcontributionspresentedinthisstudyareincludedinthe article.Furtherinquiriescanbedirectedtothecorrespondingauthor.
ConflictsofInterest: Theauthorsdeclarenoconflictsofinterest.
References
1. Du,P.;Al-Kodmany,K.;Ali,M.M.(Eds.) TheRoutledgeHandbookonGreeningHigh-DensityCities:Climate,SocietyandHealth, 1sted.;Routledge:NewYork,NY,USA,2024.
2. Du,P.;Wood,A.;Stephens,B.EmpiricalOperationalEnergyAnalysisofDowntownHigh-Risevs.SuburbanLow-RiseLifestyles: AChicagoCaseStudy. Energies 2016, 9,445.[CrossRef]
3. Nagy,D.;Villaggi,L.;Benjamin,D.GenerativeUrbanDesign:IntegratingFinancialandEnergyGoalsforAutomatedNeighborhoodLayout.InProceedingsoftheSymposiumforArchitectureandUrbanDesign,Delft,TheNetherlands,4–7June2018. [CrossRef]
4. Besserud,K.;Hussey,T.UrbanDesign,UrbanSimulation,andtheNeedforComputationalTools. IBMJ.Res.Dev. 2011, 55, 2:1–2:17.[CrossRef]
5. Sun,Y.GenerativeMethodsforUrbanDesignandRapidSolutionSpaceExploration.Master’sThesis,CornellUniversity,Ithaca, NY,USA,2021.[CrossRef]
6. Wilson,L.;Danforth,J.;Davila,C.C.;Harvey,D.HowtoGenerateaThousandMasterPlans:AFrameworkforComputational UrbanDesign.InProceedingsoftheSymposiumonSimulationforArchitectureandUrbanDesign,SIMAUD’19,Atlanta,GA, USA,7–9April2019;SocietyforComputerSimulationInternational:SanDiego,CA,USA,2019;pp.1–8.
7. Jiang,F.;Ma,J.;Webster,C.J.;Chiaradia,A.J.F.;Zhou,Y.;Zhao,Z.;Zhang,X.GenerativeUrbanDesign:ASystematicReviewon ProblemFormulation,DesignGeneration,andDecision-Making. Prog.Plan. 2024, 180,100795.[CrossRef]
8. Newton,D.W.IdentifyingCorrelationsbetweenDepressionandUrbanMorphologythroughGenerativeDeepLearning. Int.J. Archit.Comput. 2023, 21,136–157.[CrossRef]
9. Barr,J.M.TheEconomicsofSkyscraperHeight.In BuildingtheSkyline:TheBirthandGrowthofManhattan’sSkyscrapers;Oxford UniversityPress:Oxford,UK,2016;pp.141–183.[CrossRef]
10. Chau,K.-W.;Wong,S.K.;Yau,Y.;Yeung,A.K.C.DeterminingOptimalBuildingHeight. UrbanStud. 2007, 44,591–607.[CrossRef]
11. Picken,D.H.;Ilozor,B.D.HeightandConstructionCostsofBuildingsinHongKong. Constr.Manag.Econ. 2003, 21,107–111. [CrossRef]
12. Ashworth,A.;Perera,S.Therelationshipbetweenconstructionpriceandheight. Chart.Surv.Build.Quant.Surv.Q. 1978, 5,68–71.
13. Picken,D.;Ilozor,B.TheRelationshipbetweenBuildingHeightandConstructionCosts.In DesignEconomicsfortheBuilt Environment;JohnWiley&Sons,Ltd.:Hoboken,NJ,USA,2015;pp.47–60.[CrossRef]
14. Blackman,I.Q.;Picken,D.H.HeightandConstructionCostsofResidentialHigh-RiseBuildingsinShanghai. J.Constr.Eng. Manag. 2010, 136,1169–1180.[CrossRef]
15. Showkatbakhsh,M.;Makki,M.Multi-ObjectiveOptimisationofUrbanForm:AFrameworkforSelectingtheOptimalSolution. Buildings 2022, 12,1473.[CrossRef]
16. Balling,R.J.;Taber,J.T.;Brown,M.R.;Day,K.MultiobjectiveUrbanPlanningUsingGeneticAlgorithm. J.UrbanPlan.Dev. 1999, 125,86–99.Availableonline: https://trid.trb.org/view/503961 (accessedon1July2024).[CrossRef]
17. Koenig,R.;Miao,Y.;Aichinger,A.;Knecht,K.;Konieva,K.IntegratingUrbanAnalysis,GenerativeDesign,andEvolutionary OptimizationforSolvingUrbanDesignProblems. Environ.Plan.BUrbanAnal.CitySci. 2020, 47,997–1013.[CrossRef]
18. Choi,J.;Nguyen,P.C.T.;Makki,M.TheDesignofSocialandCulturalOrientatedUrbanTissuesthroughEvolutionaryProcesses. Int.J.Archit.Comput. 2020, 19,331–359.[CrossRef]
19. Dogan,T.;Samaranayake,S.;Saraf,N.Urbano:ANewTooltoPromoteMobility-AwareUrbanDesign,ActiveTransportation ModelingandAccessAnalysisforAmenitiesandPublicTransport.InProceedingsoftheSymposiumonSimulationforArchitectureandUrbanDesign,SIMAUD’18,Delft,TheNetherlands,4–7June2018;SocietyforComputerSimulationInternational:San Diego,CA,USA,2018;pp.1–8.
20. Dogan,T.;Yang,Y.;Samaranayake,S.;Saraf,N.Urbano:ATooltoPromoteActiveMobilityModelingandAmenityAnalysisin UrbanDesign. Technol.Archit.Des. 2020, 4,92–105.[CrossRef]
21. HongKongArchitecturalServicesDepartment.BuildingWorksTenderPriceIndexReport.Availableonline: https://www. archsd.gov.hk/en/reports/building-works-tender-price-index.html# (accessedon15February2024).
22. May,E.;Du,P.;Martine,V.EnvironmentalJustice:ACaseStudyintotheHeatVulnerableNeighborhoodsofPhiladelphia. 2023.Availableonline: https://www.acsa-arch.org/chapter/environmental-justice-a-case-study-into-the-heat-vulnerableneighborhoods-of-philadelphia/ (accessedon1July2024).
Disclaimer/Publisher’sNote: Thestatements,opinionsanddatacontainedinallpublicationsaresolelythoseoftheindividual author(s)andcontributor(s)andnotofMDPIand/ortheeditor(s).MDPIand/ortheeditor(s)disclaimresponsibilityforanyinjuryto peopleorpropertyresultingfromanyideas,methods,instructionsorproductsreferredtointhecontent.