
RASMUSSENGRUPPEN AS *) Annual Report 2021
*) This is a translation of the valid annual report for the Rasmussen Group, and has been prepared for information purpose only.
RASMUSSENGRUPPEN AS (organization number 929 477 545) is the ultimate parent company in the Rasmussen Group. An overview of the companies included in the Group corporate structure is presented in the financial statement.
The Group’s business is organized into three business segments; financial investments, offshore and real estate.
The parent company, RASMUSSENGRUPPEN AS, conducts its operations from Kristiansand and Oslo. The company’s registered office is located in Kristiansand.
RESULTS AND COMMENTS ON THE ANNUAL REPORT
RASMUSSENGRUPPEN AS is an investment entity and prepares the financial statements in accordance with the regulations for simplified IFRS, meaning all assets are measured at fair value, in accordance with IFRS 10. The company shall therefore not prepare a consolidated financial statements. Financial statements using fair value valuation of assets in accordance with IFRS 10 have been prepared for the first time for the financial year 2021, with revised comparative figures for 2020. As a result of this, RASMUSSENGRUPPEN AS' equity has increased by NOK 4,242 million (not recorded through profit and loss) as of 1 January 2021 compared to equity in the official consolidated financial statements as of 31 December 2020.
In 2021, RASMUSSENGRUPPEN AS recorded a profit before tax of NOK 2,634 million (2020: NOK 4,125 million revised). The total profit for 2021 amounted to NOK 2,620 million (NOK 4,062 million revised).
Equity amounted to NOK 25,795 million as of 31.12.2021 (NOK 23,197 million as of 31.12.2020 revised). The company’s book equity ratio equaled to 98.9% (98.7%).
BUSINESS SEGMENTS
Financial investments
The Rasmussen Group’s financial investments are operated by the parent company RASMUSSENGRUPPEN AS and its wholly-owned subsidiaries PORTIA AS, VIOLA AS and CRESSIDA AS. The equity investment in Shearwater GeoServices Holding AS, which is part of the investment portfolio, is dealt with separately under offshore.
The Group invests globally, both directly and indirectly, with an emphasis on investments in Europe and the United States. Like last year, there has been a focus on certain major investments in Norway in 2021. The investment decisions are based upon company analysis conducted by internal resources.
In 2021, the Group recorded a profit before tax on financial investment activities (including investments in equity funds) of NOK 624 million (NOK 2,870 million). The main positive profit contributors were Oda Group Holding AS (formerly Kolonial.no) with NOK 941 million and B2 Holding ASA with NOK 169 million. The negative profit contributors were mainly Nordic Aquafarms AS with NOK 287 million and ICE Group ASA with NOK 253 million.
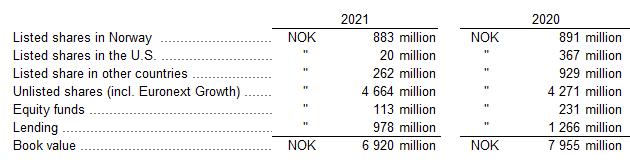
As of 31 December 2021, the book value of financial investments, excluding Shearwater (incl. lending, excl.
Shearwater lending), amounted to NOK 6,920 million (NOK 7,955 million) and was distributed as follows:
As of 31 December 2021, the Group’s largest individual financial investments were NOK 2,746 million in Nykode Therapeutics AS, NOK 1,421 million in Oda Group Holding AS, NOK 119 million in ICE Group ASA and NOK 692 million in loans including accrued interests, NOK 532 million in B2Holding ASA and NOK 46 million in Nordic Aquafarms and NOK 286 million in loans including accrued interests.
In 2021, net sale in the business segment amounted to NOK 1,381 million The largest divestments were NOK 490 million in Oda Group Holding AS, NOK 355 million in Airbus Group and NOK 351 million in Volkswagen VZ. The main investments in 2021 were NOK 122 million in the equity fund Aurora Biotech Select, NOK 100 million in Onna Greens AS and NOK 62 million in ZIVID AS.
As of year end, the main risk factors for financial investments were a highly prices stock market, high inflation, high investment and debt level in China, as well as the development of oil and energy prices in general. The company-specific risk related to individual shares has been reduced through a diversified investment portfolio.
Offshore
RASMUSSENGRUPPEN AS and GC Rieber Shipping ASA established in 2016 the Norwegian seismic company Shearwater GeoServices Holding AS. In November 2018, Shearwater acquired Schlumberger’s offshore-related seismic activities, including 10 seismic vessels with streamer equipment and technology. In January 2020, Shearwater acquired 7 seismic vessels and sufficient streamer equipment to equip 5 seismic vessels, which ware held jointly by CGG and Eidesvik through the company Global Seismic Shipping AS. In addition, CGG committed to lease a minimum of 2 seismic vessels each year for 5 years to its multiclientoperation. In April 2021 Shearwater acquired 6 seismic vessels and sufficient streamer equipment to equip 4 seismic vessels from Tiger Moth AS. The vessels and equipment were formerly owned by Polarcus.
During 2021, the Group invested an additional NOK 667 million in shares of Shearwater and granted a convertible loan of USD 85 million to the company. As of 31 December 2021, the loan amounted to NOK 800 million including accrued interests.
Shearwater holds a total of 22 modern seismic vessels, and is by far the world’s largest seismic company measured by the number of vessels owned by the company. As of 31 December 2021, RASMUSSENGRUPPEN AS, together with CRESSIDA AS, PORTIA AS and VIOLA AS owned 77,2 % of the company (Schlumberger 12,9 % and Rieber 8,4 %).
RASMUSSENGRUPPEN AS has a controlling interest in Shearwater and holds 78,2 % of the voting shares together with CRESSIDA AS, PORTIA AS, and VIOLA AS.
Bergen-based Shearwater is a global supplier of marine geophysical services, mainly comprising the collection and processing of seismic data for oil/gas and multi-client companies. As of 31 December 2021, Shearwater had 883 employees, of which 467 were working offshore. Employees working onshore are located in Norway (at the head office in Bergen and at the research and development department in Bærum), the UK, the U.S., Malaysia and Singapore.
After a weak period in the seismic market from 2015-2018, the market improved considerably through 2019 and the beginning of 2020. In this period, there was an increase in activity in the oil companies and increased rates in the signed contracts. The significant fall in the oil price, as a result of the measures taken against Covid-19 as of February 2020, led to a significant reduction in planned investments made by the oil companies for 2020. The activity in the seismic market fell drastically until it hit the bottom level in the third quarter of 2020. Since then the activity has increased, which, amongst other things, is driven by an increase in the oil price.
The main risk factor for Shearwater is the development of oil and gas prices, as well as future needs for oil and gas. If the price of oil and gas remains high, it will probably lead to increased exploration activity and thus increase activity in the seismic market in general.
As of 31 December 2021, the Group’s book value of offshore assets was NOK 8,579 million (NOK 6,697 million) and consisted of the shares in Shearwater, recorded in accordance with an internal valuation based on discounted future EBITDA as the market prospects appeared at year end. Book value per share in USD remains unchanged from 31 December 2020. A loan to Shearwater of NOK 800 million (NOK 0 million) comes as an addition to this.
In 2021, The Rasmussen Group recorded a profit before tax from its offshore segment of NOK 1,258 million (NOK 431 million).
Real estate
The real estate and property development business is mainly operated through RASMUSSENGRUPPEN AS’ wholly-owned subsidiary AVANTOR AS, which has its registered office in Nydalen in Oslo, where the Avantor Group also conducts its operations.
As of 31 December 2021, the Avantor Group’s property portfolio amounted to approximately 250,000 square meters of GFA. The non-leased commercial space value was 3.5%, and the average remaining lease period was 4.7 years. The client portfolio is of high quality with lessees spread across several industries.
The development portfolio includes a regulated development potential of approximately 210,000 square meters GIA mainly in Nydalen with the Gullhaug Torg 5 construction project which was initiated in 2020, Gullhaug Torg 2A which was initiated in 2021, and Slemmestad. Moreover, the group has two development sites in Tønsberg, one of which has ongoing residential construction and one which is unregulated. In new projects that are initiated, there is a particular focus on sustainable urban development.
Avantor manages its own property portfolio in Nydalen. The company also manages public and private infrastructure on behalf of Nydalen Gårdeierforening.
Through determined and systematic work, Avantor has not only participated in creating a new city district, but also a brand. Nydalen has become an attractive area for business and residency, as well as a city centre for the district of Nordre Aker, which has approximately 53,000 inhabitants.
As of the financial year 2021, AVANTOR AS, prepares its financial statements in accordance with the regulations for simplified IFRS, meaning that investment properties are booked in the balance sheet using fair value measurement, and the year’s change in value is recognized through the statement of profit and loss. At the end of 2021, the Avantor Group had total assets amounting to NOK 11,009 million (NOK 9,058 million revised). The book value of equity amounted to NOK 7,206 million (NOK 6,518 million revised). Total interestbearing debt amounted to NOK 1,948 million (NOK 1,103 million). As of 31 December 2021, the Avantor Group had available liquidity via a credit agreement and an unused credit limit totalling NOK 377 million, as well as significant values in non-pledged properties. The capital situation, with a equity ratio (taking into account the fair value of deferred tax) of more than 72 %, makes the Avantor Group well equipped for further development in Nydalen, Slemmestad and new areas.
The real estate business is exposed to rental risk, project risk, financial risk, regulatory risk and accident risk, and procedures for handling these risks have been established. Details on the risks related to construction activities in connection with real estate and property business, such as demolition and excavation work, handling of possibly contaminated masses and major terrain work, are given in AVANTOR AS’ annual report. For the Avantor Groups loan debt, interest rate swap agreements have been entered into with a duration to 2030, meaning approximately 67 % of the Groups interest expenses are secured against interest rate fluctuations.
In 2021, The Rasmussen Group recorded a profit before tax from its real estate operations of NOK 752 million (NOK 824 million).
CASH AT BANK
RASMUSSENGRUPPEN AS, together with CRESSIDA AS, PORTIA AS and VIOLA AS’ total cash at bank was NOK 1,636 million as of 31 December 2021 (NOK 1,398 million). The cash at bank gives the Group considerable leverage to make new investments
RISKS
Commercial investment activities involve a trade-off between expected return and risk. It is therefore not a goal for the Group to minimize its overall risk. However, the Group sees the importance of conscious risk management and has established procedures for handling the types of risks to which it is exposed to ensure that the Group’s overall risk is proportionate to the Group’s risk-bearing capacity. Of importance to the Group in this context is to ensure diversification in its investments as well as that the parent company, RASMUSSENGRUPPEN AS shall not have any debt through lending nor assume any guarantees for other companies’ obligations
EMPLOYEES AND WORKPLACE ENVIROMENT
As of yearend, RASMUSSENGRUPPEN AS had five employees. The company purchases various administrative services from POLYSERVICES AS, which has eight employees.
The salary differences that exist are based on responsibility, competence, thoroughness, and effort. When recruiting for vacant positions, the Group is conscious of the fact that there are both male and female candidates qualified for jobs, and equal opportunities are given regardless of ethnic origin and religion.
In 2021, absence due to illness was insignificant in RASMUSSENGRUPPEN AS. Absence due to illness in RASMUSSENGRUPPEN AS in 2021 was 1,5 %. The working environment in RASMUSSENGRUPPEN AS is considered to be good. The working environment is characterized by motivated employees who make a very good effort.
ESG, etc.
RASMUSSENGRUPPEN AS focuses on sustainability in all its business segments Active work is being done on environmental, social, and ethical issues (ESG). Through board representation, RASMUSSENGRUPPEN AS influences companies in their work with this extended concept of sustainability. Sustainability perspectives are also used as a basis for assessing new investments.
RASMUSSENGRUPPEN AS always conducts its own ESG assessments, while also relying on assessments made by certain other actors. RASMUSSENGRUPPEN AS has, for example, chosen not to invest in companies that the Norwegian Oil Fund has excluded from its investment universe.
RASMUSSENGRUPPEN AS will ensure fulfillment of the obligations that will follow from the Transparency Act after it enters into force on 1 July 2022.
Real estate
In general, the focus on the environment has been central ever since Avantor started the development of Nydalen in the early 90s. Focus on the environment is an ongoing project with continuously higher ambitions, and is a central part of the company's development of properties. Avantor was the first private real estate company in Norway to be environmentally certified according to ISO 14001, and the company is a key participant in the Norwegian green building council.
In Nydalen in Oslo, Avantor has built an environmentally friendly energy plant that supplies district heating and cooling, based on heat pump technology and ground wells. The energy plant was put into operation as early as 2003 and was then one of the largest in Northern Europe. In 2014, Avantor expanded the energy plant in Nydalen to meet an increasing need for environmentally friendly energy. When the area is fully developed, the energy plants will reduce CO2 emissions in the area by 4,500 tons per year, corresponding to the annual emissions from around 3,300 fossil cars.
Vertikal Nydalen (with street address Gullhaug Torg 2A) is a new business and residential project with innovative environmental solutions that will be completed in 2023. Vertikal Nydalen is part of FutureBuilt, an innovation program for the most ambitious companies in the construction industry. FutureBuilt projects must exceed the UN Sustainable Development Goals and the Paris Goals, and always cut carbon gas emissions by at least 50 percent compared to common practice. Vertikal Nydalen will be the first combination building in Norway with natural ventilation. The goal is to avoid buying energy for ventilation, heating and cooling. This will be achieved using solar cells and low-temperature heat pump systems with ground wells.
At Slemmestad in Asker, environment and sustainability will be central when Avantor develops a former industrial area. A comprehensive environmental strategy has been drawn up for the project, which consists of around 100,000 square meters of residential area and around 55,000 square meters of commercial space.
In 2021, Avantor prepared a new environmental strategy for 2021–2023. The company focuses on six of the UN's sustainability goals that Avantor can influence as much as possible. For each of the sustainability goals Avantor focuses on, specific goals have been set up to be reached by the end of 2023, as well as a long-term goal for 2030. Avantor will conduct an annual analysis to identify any changes that may have an impact on development.
Avantor provides equal opportunities to all employees regardless of background, and the company has zero tolerance for discrimination. Avantor employees and suppliers represent many nationalities. Avantor is an IAcompany. The salary differences that exist in the company are based on responsibility, competence, thoroughness and work effort.
Avantor's activities have consequences that visibly affect society. The company is therefore dependent on the trust of customers, suppliers, public authorities and society in general. Avantor has adopted and implemented ethical guidelines, which are intended to help protect this trust. The ethical guidelines are approved by the Board of Directors each year and applies to all employees and members of Avantor's boards.
Offshore
The Shearwater Group owns and operates modern seismic vessels that map possible natural oil and gas resources in the seabed.
As the owner of the world's largest fleet of advanced seismic vessels, Shearwater recognizes its responsibility for the environment and works continuously to minimize the negative impact of its operations. The ambitions of the company go beyond satisfying regulatory requirements and guidelines for the industry.
Shearwater has the largest and most modern fleet of seismic vessels. The company has decided to always use marine gas oil (MGO) as fuel, rather than the cheaper and more polluting heavy fuel oil (HFO). Modern vessels use less fuel than older vessels and are thus more environmentally friendly. The size of the fleet
provides an opportunity to optimize the allocation of assignments and thus minimize transit between assignments. Reduced transit has a direct positive effect on emissions.
Shearwater is a technology leader in the seismic market, and several of the solutions directly contribute to reducing greenhouse gas emissions. One example of this is "Monowing", based on proprietary technology, a solution that reduces the resistance of the water and thus reduces fuel consumption and emissions. Seismic technology is also increasingly used in mapping and monitoring areas for carbon storage.
Shearwater provides equal opportunities to all employees regardless of background, and the company has zero tolerance for discrimination. Different backgrounds and experience among employees are positive for innovation and improves business-related decisions. The employees of Shearwater represent a total of 74 nationalities. Shearwater supports the UN Universal Declaration of Human Rights, the UN Global Compact, the UK Modern Slavery Act 2015 and the standards of the International Labour Organization. The company complies with all these laws and principles and includes them in agreements with subcontractors.
Shearwater considers business ethics to be critical for commercial success and long-term value creation. The company has implemented policies and procedures to ensure that the company is run in the best possible way. This includes transparency, accountability, and ethical conduct. Shearwater has implemented a Code of Conduct outlining the principles of conduct and business practices. This applies to board members, management, employees, hired personnel, consultants and agents.
Financial investments
RASMUSSENGRUPPEN AS invests in several companies, both early-stage companies and more established companies, where RASMUSSENGRUPPEN AS is not the majority owner. Of the companies that are included or have been included in the portfolio of financial investments, several are working on innovative solutions that support several of the UN's sustainability goals. This includes Nykode Therapeutics AS, which works with the development of vaccines for cancer treatment and treatment of other diseases, N2 Applied AS which develops technology to reduce emissions from agriculture, and Nordic Aquafarms AS which develops land-based fish farming close to consumers in Europe and is planning the same in USA. Land-based fish farming has less environmental impact in the sea and further contributes to reducing CO2 emissions because of a lower need for air freight
RASMUSSENGRUPPEN AS also provides direct financial assistance to society, which can be linked to several of the UN's sustainability goals. Financial contributions are regularly made to organizations and sports clubs that work to include children and young people who have limited funds to participate in sports and cultural events, and to organizations in Norway and other countries that provide assistance to people who for various reasons need help. In addition, financial contributions are made on a more individual basis.
RASMUSSENGRUPPEN AS has, among other things:
• contributed NOK 10 million to the Covax collaboration, which ensures that the Covid-19 vaccine also reaches poor countries.
• contributed NOK 7.5 million to the establishment of a laboratory and research environment in neuroscience at the University of Agder.
• NOK 10 million in support to various organizations (Médecins Sans Frontières, the Red Cross, the Salvation Army and Norwegian Church Aid) working to improve the humanitarian situation in Ukraine.
LIABILITY INSURANCE FOR THE BOARD AND CEO
The company does not have any liability insurance for the Board and the CEO
FUTURE PROSPECTS AND SUBSEQUENT EVENTS
Developments in 2022 are characterized by geopolitical uncertainty related to war in Ukraine, higher inflation, rising interest rates, falling share prices, disruptions in supply chains for goods and sharply rising energy and
commodity prices. The last factor has had a positive impact on developments at the Oslo Stock Exchange. RASMUSSENGRUPPEN AS has also been affected by a decline in the value of investments in 2022, without this affecting the financial statement for 2021 or the assessment of the financial status at the time of publication of this annual report. The Board considers RASMUSSENGRUPPEN AS to be financially well equipped to adapt its activities in accordance with the company's strategy also in a more uncertain world ahead.
***
RASMUSSENGRUPPEN AS’ financial statements are prepared under the going-concern assumption – and the conditions for this assumption are met.
Kristiansand, 16 May 2022
SVEIN T. SØNNING DAG RASMUSSEN CATHRINE RASMUSSEN (Chairman of the Board) (Member of the Board and CEO) (Member of the Board)PER OTTO RASMUSSEN DAHL
CARL EINAR B. RASMUSSEN (Member of the Board) (Member of the Board)
OPERATING REVENUES AND OPERATING EXPENSES
2021 2020 NOK NOK Note (IFRS) (IFRS) (Reworked)
Share dividends .................................................................................................................................................................… 3 24 002 775 18 553 645 Profit on sale of securities ..................................................................................................................................................... 3 552 646 467 358 238 068
÷
………………………………………………………………………………………………………………………………………………………
÷
.................................................................................................................................................................…
÷
÷
÷
÷
÷ 366 361 ÷ 345 330 OPERATING PROFIT 2 632 918 276 4 117 681 179 FINANCIAL INCOME AND FINANCIAL EXPENSES Interest income from bank deposits ….................................................................................................................................................................… 1 888 636 7 463 518 Interest expenses and other financial expenses .................................................................................................................................................................… ÷ 393 338 ÷ 408 710 NET FINANCIAL INCOME .................................................................................................................................................................… 1 495 298 7 054 808 PROFIT BEFORE TAX .................................................................................................................................................................… 2 634 413 574 4 124 735 987 TAX ON PROFIT Tax on profit .................................................................................................................................................................… 7 ÷ 14 419 133 ÷ 62 596 631 TOTAL PROFIT .................................................................................................................................................................… 2 619 994 441 4 062 139 356
PROFITS Proposed allocation/was allocated as follows: Allocated other equity ....................................................................................................................................... 0 0 Allocated share premium .............................................................................................................................................................… 0 0 AVAILABLE .......................................................................................................................................................... 2 619 994 441 4 062 139 356 Proposed allocation/was allocated as follows: Allocated unrealized gains fund .............................................................................................................................................................… 9 1 854 136 593 3 827 901 636 Dividend payout to shareholders .................................................................................................................................................................… 9 22 000 000 142 732 800 Allocated other equity .................................................................................................................................................................… 9 743 857 848 91 504 920 TOTAL ALLOCATED .................................................................................................................................................................… 2 619 994 441 4 062 139 356 RASMUSSENGRUPPEN AS Statement of Income 2021
Change in value of shaers in subsidiaries and associated companies........................................................................................................................ 1,2 258 378 960 724 261 418 Change in value of shares in Shearwater GeoServices Holding AS ..................................................................................................................................................... 1 709 899 716 406 338 254 Change in value of shaers in AVANTOR AS ..................................................................................................................................................... 1 845 434 470 832 196 561 Change in value other short-term shareholdings, etc. ..................................................................................................................................................... 3 318 602 803 1 865 105 403 Change in value risk lendings.................................................................................................................................................................………
91 306 243 0 Interest income from risk lendings.................................................................................................................................................................……… 125 378 344 76 348 946 Currency exchange gains/losses on futures contracts and lendings
78 815 236
48 176 669 Payroll expenses, remuneration of the Board and social costs
5
148 249 372
88 877 854 Other administration and operating expenses, etc. .................................................................................................................................................................…
40 318 519
25 961 263 Ordinary depreciations .................................................................................................................................................................…
ALLOCATION OF
RASMUSSENGRUPPEN AS Balance Sheet as of 31 December 2021 2021 2020 NOK NOK Note (IFRS) (IFRS) ASSETS (Reworked) Fixed assets Tangible fixed assets Operating equipment, inventory, office equipment, etc. .......................................................................................................................... 3 841 392 4 207 753 3 841 392 4 207 753 Financial assets Shares in subsidiaries ..................................................................................................................................................................... 1 10 282 971 267 8 872 195 644 Shares in associated companies .......................................................................................................................... 2 212 431 485 419 393 678 10 495 402 752 9 291 589 322 Total fixed assets .......................................................................................................................… 10 499 244 144 9 295 797 075 Current assets Investments Shares in Shearwater GeoServices Holding AS .................................................................................................................................................................................. 1 7 841 180 489 6 696 621 761 Other short-term shareholdings, etc. .................................................................................................................................................................................. 1,3 4 590 675 519 5 254 175 830 Convertible lendings .............................................................................................................................................. 4 1 778 000 514 1 266 416 387 14 209 856 522 13 217 213 978 Receivables Short-term receivables .................................................................................................................................................................................. 19 843 713 160 265 660 19 843 713 160 265 660 Cash and cash equivalents Cash at bank ......................................................................................................................... 1 330 332 571 821 708 519 Total current assets 15 560 032 806 14 199 188 157 TOTAL ASSETS ............................................................................................................................................................ 26 059 276 950 23 494 985 232 EQUITY AND LIABILITIES Equity Paid-up equity: Share capital (95.155.200 shares of NOK 0,17) ............................................................................................................................................................. 8,9 16 176 384 1 094 284 800 Share premium ............................................................................................................................. 1 176 594 048 98 485 632 Retained earnings: Other equity ............................................................................................................................................................. 9 10 841 627 828 10 097 769 981 Unrealized gains fund ............................................................................................................................................................. 9 13 760 291 060 11 906 154 466 Total equity .......................................................................................................................… 9 25 794 689 320 23 196 694 879 Long-term liabilities Provisions for liabilities Deferred tax ..................................................................................................................................................................... 7 9 007 557 46 531 499 Total provisions for liabilities 9 007 557 46 531 499 Short-term liabilities Accounts payable ...........................................................................................................................… 230 909 276 850 Tax payable .............................................................................................................................. 7 50 511 937 14 928 924 Unpaid government charges and special taxes .............................................................................................................................. 14 180 618 14 215 852 Provision for dividend payout to shareholders ................................................................................................................................... 22 000 000 142 732 800 Accounts payable to group companies ..................................................................................................................................................................... 5 817 526 3 136 320 Other short-term liabilities ........................................................................................................................................................... 5 162 839 083 76 468 108 Total short-term liabilites .......................................................................................................................… 255 580 073 251 758 854 TOTAL EQUITY AND LIABILITIES ................................................................................................................................... 9 26 059 276 950 23 494 985 232
subsequent notes are included as part of the financial statements.
CARL
DAG
The
Kristiansand, 16 May 2022 SVEIN T. SØNNING
EINAR B. RASMUSSEN
RASMUSSEN (Chairman of the board) (Member of the Board and CEO) (Member of the Board) CATHRINE RASMUSSEN (Member of the board) PER OTTO RASMUSSEN DAHL (Member of the board)
Notes to the 2021 Financial Statements of RASMUSSENGRUPPEN
AS:
All amounts in the notes are shown in NOK thousands unless otherwise stated in the note.
Accounting principles
General information
RASMUSSENGRUPPEN AS is a Norwegian investment company headquartered in Kristiansand. The company is organized into three business segments; real estate, financial investments and offshore. The businesses are run from Kristiansand and Oslo. The company invests directly and indirectly in businesses that are considered to have possibilities to create value.
Basis for the preparation of the financial statements
Simplified IFRS has been used in accordance with section 3-9 of the Norwegian Accounting Act and the regulations relating to simplified IFRS adopted by the Ministry of Finance. This mainly means that measurement and recognition follow the international accounting standard (IFRS) and note information is in accordance with the Norwegian Accounting Act and generally accepted accounting principles. Exceptions to measuring and recognition by full IFRS are explained below.
RASMUSSENGRUPPEN AS is an investment entity that invests funds owned by several shareholders in accordance with its strategy of solely achieving an increase in value and measures investments at fair value. The investments are in the form of equity, subordinated lending and similar investments.
Investment entity, first time application and effect of change in principles
The company is an investment entity in accordance with the provisions of IFRS 10. Hence, Investments in subsidiaries are not consolidated, but are recorded as financial assets with a change in value through profit and loss. In accordance with IFRS 10, no consolidated financial statements are prepared. The financial year 2021 is the first year the investment entity principle in IFRS 10 is applied, and comparative figures for 2020 have been revised accordingly. The company's book value of equity has increased by NOK 4,242 million (previously unrecorded) as of 1 January 2021 compared to the book value of equity of the consolidated financial statements as of 31 December 2020.
New and changed standards
Changes in the IFRS interpretations from 1 January 2021 have not had a material impact on the financial statements.
Functional currency and reporting currency The company operates in several currencies, but the most used functional currency is NOK and the presentation currency is consequently NOK.
Main principles for classification and valuation of balance sheet items
Assets, including financial assets, for permanent ownership or use are classified as fixed assets including receivables due in more than one year. Receivables to be paid within a year and other assets are classified as current assets. Debt due within one year are classified as short-term liabilities. Other liabilities are classified as long-term liabilities.
Loans to companies in which RASMUSSENGRUPPEN AS has invested are treated as current assets where the investment in shares is presented as current assets.
Revenue recognition
Return on investments are recognized in accordance with the development in market value. Dividends are recognised as income when the company is unconditionally entitled to dividends.
Operating costs
Operating expenses include costs of salaries and operating expenses related to the company's operations. Operating expenses are recognized when incurred.
Provisions
The company recognizes provisions when there is a legal or self-imposed obligation as a result of past events when it is probable that the liability will be settled, and when the size of the obligation can be estimated with sufficient reliability.
Currency Income, expenses, investments and sales in foreign currencies are recorded at the current exchange rates.
Monetary assets and securities denominated in foreign currencies are translated at the exchange rate at the balance sheet date.
Financial assets
Investments in subsidiaries
Investments in subsidiaries are recorded at fair value with a change in value through profit and loss in accordance with IFRS 10 and the provisions on investment entities.
Investments in subsidiaries are mainly companies where the ownership staket is more than 50 % and the company has control. Assessment of control is carried out for each individual investment.
Investments in associated companies
Investments in associated companies are recorded at fair value with a change in value through profit and loss.
Associated companies are companies in which the company has significant influence but not control. As a general rule, significant influence is achieved by ownership between 20% and 50%. The assessment is made for each individual investment.
Other investments
Other investments are investments in entities where the company has no control, significant influence or a joint venture. The company's other investments consist of investments in shares and corresponding ownership interests. The company records investments at fair value with a change in value through profit and loss.
Valuation – Hierarchy of financial assets and liabilities
The company divides investments measured at fair value on the balance sheet in accordance with IFRS 13 into a hierarchy based on the basis of the valuation.
Level 1:
Valuation based on listed prices in active markets for identical assets without adjustments. Only listed stocks are considered level 1 investments.
Level 2: Investments where input data other than quoted prices are used, or observable prices are not in active markets.
Level 3:
Other investments are considered at level 3. These are investments where all information or parts of information about value cannot be observed in the market.
Lendings
The company's lendings are recorded at fair value with a change in value through profit and loss.
Receivables
Receivables are generally listed at nominal value with deductions for any expected loss in accordance with IFRS 9.
Dividends
Proposed dividend payouts to shareholders are classified as debt. This is allowed under simplified IFRS.
Taxes
Tax on profit comprises tax payable for the period and the changes in deferred tax. Tax payable is calculated on the basis of the tax result for the year. Net deferred tax/tax assets are calculated on all differences between the accounting amount and tax value of assets and liabilities.
Deferred tax assets are recognised on the balance sheet when it is likely that the company will have sufficient tax profit in subsequent periods to be able to use the tax asset.
Cash flow statement
The company prepares the cash flow statement in accordance with the indirect method.
Subsequents events
New information after the balance sheet date about the company's financial position on the balance sheet date is taken into account in the financial statements. Events after the balance sheet date that do not affect the company's financial position on the balance sheet date, but which will affect the company's financial position in the future, are disclosed if material.
Changes in standards and interpretations with future entry into force
The IASB has adopted several amendments to standards and interpretations with effect from 1 January 2022 or later. The company has not previously implemented any such changes and they are not expected to have a material effect on the accounts.
Note 1. Shares in subsidiaries
Investment entity
The company meets the requirements of an investment entity in accordance with IFRS 10.27 and 10.28. The company records investments in subsidiaries and associated companies at fair value on the balance sheet and change in value through profit and loss in accordance with IFRS 9.
Table: Overview of subsidiaries as of 31.12
Company name Ownership Voting interest Headquarters
Total profit Total equity
AVANTOR AS 100 % 100 % Oslo 739 783 7 205 947
PORTIA AS 100 % 100 % Kristiansand 325 295 1 304 275
CRESSIDA AS 100 % 100 % Kristiansand 142 984 556 495
VIOLA AS 100 % 100 % Kristiansand 97 112 351 127
CORDELIA AS 100 % 100 % Kristiansand ÷ 310 59 685
Froland verk AS 100 % 100 % Kristiansand 80 12 580 POLYSERVICES AS 100 % 100 % Kristiansand 208 27 664
Shearwater GeoServices Holding AS * 70,6 % 71,5 % Bergen ÷ 415 367 4 337 086
* Applies to 2020, as 2021 is not finalized.
RASMUSSENGRUPPEN AS owns 6.6% (votes for 6.7%) in Shearwater via CRESSIDA AS, PORTIA AS and VIOLA AS.
CRESSIDA AS, PORTIA AS and VIOLA AS are companies that are part of RASMUSSENGRUPPEN AS's strategy for opportunistic investments, and the companies' assets are valued according to the same principles as RASMUSSENGRUPPEN AS uses. CORDELIA AS is valued based on own internal calculations based on the company's rental contracts for rental of real estate
Froland Verk AS and POLYSERVICES AS are valued at the companies' book value of equity that is assumed to correspond to fair value. The subsidiaries are valued at fair value in accordance with IFRS 13 and are valued in accordance with the principle of level 3 of the valuation hierarchy.
Table: Overview of development subsidiary 2021
Other Avantor Shearwater
Acquisition cost 1.1 390 756 2 002 296 3 126 452
Additions by purchase 0 0 431 597
Additions by share emission 0 0 0
Period disposals 0 0 ÷ 2 434
Acquisition cost 31.12 390 756 2 002 296 3 555 615
Fair value 1.1 1 746 458 7 125 738 6 696 622
Realized losses in the period 0 0 0 Realized gains in the period 0 0 0
Period fair value adjustment 565 341 845 434 709 900
Fair value 31.12 2 311 799 7 971 172 7 841 180
Table: Overview of development subsidiary 2020
Other Avantor Shearwater
Acquisition cost 1.1 390 756 2 002 296 2 911 349
Additions by purchase 0 0 215 103
Additions by share emission 0 0 0
Period disposals 0 0 0
Acquisition cost 31.12 390 756 2 002 296 3 126 452
Fair value 1.1
1 022 197 6 293 541 6 069 672
Realized losses in the period 0 0 0
Realized gains in the period 0 0 0
Period fair value adjustment 724 261 832 197 406 338
Fair value 31.12 1 746 458 7 125 738 6 696 622
The Avantor Group invests in investment properties for development, rental and sale, and residential properties for development and sale. Assets for residential development and district development are partly acquired in 2021 and valued at cost, while older housing projects are valued internally. Historically, most of the investments have been made in Nydalen in Oslo. In 2021, the Group acquired a larger property portfolio at Slemmestad, a project consisting mainly of residential development and some commercial building development.
The valuation of Avantor's investment properties is calculated by external valuation experts on the basis of underlying leases where a yield calculation has been made for all of the company's investment properties with yield levels from 3.88% to 6.25% depending on the qualities and location of the properties and which gives an average yield used as of 31.12.2021 of 4.24%.
Table: Sensitivity analysis Avantor - Effect value versus change in yield 2021 2020
Change in yield of +/÷ 0.25% +/ ÷ 540 000 +/ ÷ 480 000
Risk factors for changes in value are interest rate changes, changes in demand for rent and purchases and general price changes.
Shearwater GeoServices Holding AS
The investment is set by an internal valuation based on expected EV/EBITDA and EV/free cash flow, internal required rate of return and assumed value of ships laid up. The value is also assessed in relation to how comparable listed shares are valued. RASMUSSENGRUPPEN AS also owns shares in Shearwater via the subsidiaries CRESSIDA AS, PORTIA AS and VIOLA AS, which are valued by the same method as RASMUSEENGRUPPEN AS uses.
Table: Sensitivity analysis value change of EV/EBITDA 2021 2020
Multiple change +/÷ 0.5 units +/ ÷ 904 050 + /÷ 639 750
EBITDA change of +/÷5 % +/ ÷ 687 078 +/ ÷ 690 930
Risk factors for Shearwater are the ability to adapt to changing markets in the medium and long term. The most important risk factors for Shearwater are developments in the price of oil and gas and future demand for oil and gas. If oil and gas prices remain high, this will probably lead to increased exploration activity and thereby higher activity in the seismic market.
Investment in PORTIA AS, VIOLA AS and CRESSIDA AS
The companies make various financial investments. Below is a table showing developments for all companies distributed between different valuation levels. More information can be found in the respective subsidiaries' financial statements.
Table: Overview of development 2021 Level 1 Level 2 Level 3
Acquisition cost 1.1 291 603 247 958 178 192
Additions by purchase 262 725 29 854 280 937
Additions by share emission 25 500 39 768
Period disposals ÷ 170 286 ÷ 63 895 ÷ 94 603
Acquisition cost 31.12 384 042 239 417 404 294
Fair value 1.1 275 568 725 700 88 859 Realized losses in the period ÷ 12 987 ÷ 13 670 ÷ 63 687
Realized gains in the period 72 944 44 260 1 473
Period fair value adjustment
÷ 1 991 ÷ 20 351 553 725
Fair value 31.12 374 444 679 984 877 060
Table: Overview of development 2020
Level 1 Level 2 Level 3
Acquisition cost 1.1 280 818 135 295 131 301
Additions by purchase 202 983 396 247 56 834 Additions by share emission 25 224 61 664
Period disposals ÷ 192 198 ÷ 308 808 ÷ 71 607
Acquisition cost 31.12 291 603 247 958 178 192
Fair value 1.1 267 287 284 867 147 667 Realized losses in the period ÷ 52 478 ÷ 1 462 0 Realized gains in the period 105 019 439 123 3 413
Period fair value adjustment
÷ 17 049 256 211 ÷ 6 575
Fair value 31.12 275 568 725 700 88 859
AVANTOR AS
Note 2. Shares in associated companies
Table: Overview of investments in associated companies as of 31.12
Company name Headquarters Ownership Voting interest
Arctic Asset Management AS Oslo 31,9 % 32,4 %
Net 1 International Holding AS Oslo 40,5 % 40,5 %
Onna Greens AS Oslo 28,6 % 28,6 % Nordic Aquafarms AS Fredrikstad 35,4 % 35,4 %
Information on the companies' net profit for 2021, and equity as of 31.12.2021 has been omitted as the invested amount is considered immaterial.
Table: Overview of development 2021
Level 1 Level 2 Level 3
Acquisition cost 1.1 592 715
Additions by purchase 0
Additions by share emission 100 000
Period disposals 0
Acquisition cost 31.12 692 715
Fair value 1.1 419 394
Realized losses in the period 0
Realized gains in the period 0
Period fair value adjustment ÷ 306 962 Fair value 31.12 212 431
Table: Overview of development 2020
Nivå 1 Nivå 2 Nivå 3
Acquisition cost 1.1 561 567
Additions by purchase 0
Additions by share emission 31 148
Period disposals 0 Acquisition cost 31.12 592 715
Fair value 1.1 394 996
Realized losses in the period 0
Realized gains in the period 0
Period fair value adjustment 0 Fair value 31.12 419 394
The companies are valued based on an overall assessment where emphasis is also placed on known issue prices and trade prices. Overall assessment also includes an assessment of the companies' liquidity, risk profile and expected market developments in the relevant segment.
Note 3. Short-term shareholdings
For individual companies in which RASMUSSENGRUPPEN AS has short-term shareholdings, the following have a market value exceeding NOK 100 million as of 31.12.2021:
Nykode Therapeutics AS 2 274 187 Level 2
Oda Group Holding AS 1 421 421 Level 3
B2Holding ASA 451 408 Level 1
Nekkar ASA 117 830 Level 1
Arctic Aurora Biotech (equity fund) 112 590 Level 1 Ice Group AS 101 237 Level 1
Onna Greens AS 100 000 Level 3
The table shows the largest individual investments (includes total investment, directly owned by RASMUSSENGRUPPEN AS)
Table: Overview of developments 2021 (shares owned directly by RASMUSSENGRUPPEN AS)
Level 1 Level 2 Level 3
Acquisition cost 1.1 2 405 039 753 348 340 276
Additions by purchase 122 092 17 258
Additions by share emission 342 355
÷ 1 254 342 0 ÷ 209 337
Period disposals
Acquisition cost 31.12 1 272 788 770 606 473 294
Fair value 1.1 2 153 182 2 096 533 1 004 461
Realized losses in the period 0 0 0
Realized gains in the period 267 112 0 280 655
Period fair value adjustment ÷ 243 112 160 396 353 097
Fair value 31.12 780 555 2 274 186 1 535 936
Table: Overview of developments 2020 (shares owned directly by RASMUSSENGRUPPEN AS) Level 1 Level 2 Level 3
Acquisition cost 1.1 2 422 483 0 340 276
Additions by purchase 941 229 753 348 2 004
Additions by share emission 0 Period disposals ÷ 958 673 0 ÷ 2 004 Acquisition cost 31.12 2 405 039 753 348 340 276
Fair value 1.1 2 196 856 0 439 424
Realized losses in the period 0 0 0 Realized gains in the period 358 348 0 0 Period fair value adjustment ÷ 33 501 1 343 185 565 037
Fair value 31.12 2 153 182 2 096 533 1 004 461
Note 4. Lending
Lendings are recorded at nominal value and adjusted to fair value. Interest on loans accumulates on balances. Furthermore, for convertible loans, a valuation of the conversion right has been made. In some cases, collateral may be agreed for servicing loans.
Borrower Currency Valueadjustment Interest Book value Due longer than 1 year Ice Group ASA SEK ÷ 35 369 43 890 543 411 543 411 Shearwater GeoServices Holding AS USD 24 539 50 798 800 447 800 447 Nordic Aquafarms AS NOK 0 15 616 285 889 285 889 Ice Group ASA NOK 0 13 884 148 254 148 254
In some cases, foreign exchange risk on loans is reduced by entering into futures contracts. The criteria for hedge accounting are not met.
Futures contracts corresponding to SEK 550 million have been signed related to loans in SEK to Ice Group ASA. Both loans to Ice Group ASA have been repaid at the end of March 2022. Loans to Shearwater were granted in 2021 and loans to Nordic Aquafarms AS were granted in 2020.
Note
5. Salaries and fees
(Amounts in NOK) 2021 2020 Salaries and Board Members' remuneration .....................................................................................................................................................................… 18 921 416 18 995 781 Pension costs (including CEO) .....................................................................................................................................................................… 556 106 511 951 Accrued/reversed bonuses for officers excluding CEO *) .....................................................................................................................................................................… 33 671 638 55 374 437 Adjustment bonus balance as a result of change in accounting principles 1. January 2021……………..……………..…..…………….. 71 257 925 0
Employer's contribution (inluding for Board Members' remuneration) .....................................................................................................................................................................… 22 821 673 13 029 557 Other personnel expenses .....................................................................................................................................................................… 1 020 614 966 128
Total payroll expenses and social costs .....................................................................................................................................................................… 148 249 372 88 877 854
*) Bonus scheme
There are bonus scheme agreements between RASMUSSENGRUPPEN AS and 6 officers in the Group.
The total amount of the bonus is related to the Rasmussen Group's net profit for the year relative to the Group's book value of equity at the beginning of the year. The CEO in RASMUSSENGRUPPEN AS is not included in the bonus scheme.
Number of employees
RASMUSSENGRUPPEN AS had 5 employees at the end of the financial year, corresponding to 5 full-time employees.
Pension costs
The company is obligated to have an occupational pension scheme in accordance with the Norwegian Act on Mandatory occupational pensions. The company's pension schemes meet the requirements of this Act.
Benefits and collateral for officers (Amount in NOK thousands)
CEO The Board
Salary 4 606 1 212
Pension costs 112 0 Other benefits 200 0
Remuneration of companies controlled by the chairman of the Board 0 2021
Fees to Deloitte AS for auditing and audit-related assistance, VAT included 600
Fees for other assistance, VAT included 0
Fees to Deloitte Advokatfirma AS for assistance, VAT included 575
Profit before tax where profit from currency futures together with an estimate of administration costs are allocated to the related business segments, is distributed as follows: As of 31.12.2021, the share capital of the company consists of 95,155,200 shares of NOK. 0.17. The shares are divided into 951,552 shares of class A with voting rights and with a total nominal value of NOK. 161,763.84, further there are 56,073,600 class B shares that do not have voting rights and with a total nominal value of NOK. 9,532,512 and 22,429,440 class C shares that do not have voting rights and with a total nominal value of NOK. 3,813,004.80, as well as 15,700,608 class D shares that do not have voting rights and with a total nominal value of NOK. 2.669.103,36.
Dag Rasmussen has a controlling influence in Einar Rasmussen Investment AS.
Rannfrid Rasmussen has a controlling influence in Rannfrid Rasmussen Investment AS.
Note 6. Distribution of profit before tax between business segments 2021 2020 Financial investments .....................................................................................................................................................................… NOK 623 704 468 NOK 2 869 608 287 Offshore .....................................................................................................................................................................… " 1 258 874 743 " 431 474 504 Real Estate .....................................................................................................................................................................… " 751 834 363 " 823 653 196 NOK 2 634 413 574 NOK 4 124 735 987 Note 7. Tax on profit - deferred tax The basis for calculating deferred tax assets as of 31.12 is the following: 2021 2020 Temporary differences related to ∙ tangible fixed assets .....................................................................................................................................................................… NOK 148 330 NOK 155 668 ∙ currency futures contracts .....................................................................................................................................................................… " 16 255 610 " 156 386 094 unrealized gain currency receivable .....................................................................................................................................................................… " 24 539 500 " 0 shares outside of the exemption method .....................................................................................................................................................................… " 0 " 54 965 053 Deferred tax basis .....................................................................................................................................................................… NOK 40 943 440 NOK 211 506 815 22% calculated deferred tax .....................................................................................................................................................................… NOK 9 007 557 NOK 46 531 499 This year's taxable profit is calculated as follows: Profit before tax .....................................................................................................................................................................… NOK 2 634 413 574 NOK 4 124 735 987 Fair value adjustment market-based shares .....................................................................................................................................................................… ÷ " 2 132 315 949 ÷ " 3 827 901 638 Changes temporary differences .....................................................................................................................................................................… " 115 598 322 ÷ " 19 566 207 Permanent differences .....................................................................................................................................................................… ÷ " 388 096 235 ÷ " 11 651 360 Utilized tax loss carryforward .....................................................................................................................................................................… " 0 ÷ " 197 758 038 Tax base for tax payable this fiscal year .....................................................................................................................................................................… NOK 229 599 713 NOK 67 858 745 Tax on profit is calculated as follows: Tax payable for the fiscal year (22%).....................................................................................................................................................................… NOK 50 511 937 NOK 14 928 924 Changes deferred tax assets against profit/loss.....................................................................................................................................................................… ÷ " 37 523 943 " 46 172 839 PAYE tax on share dividends from foreign shares within the exemption method .....................................................................................................................................................................… " 1 431 139 " 1 494 867 Tax on profit .....................................................................................................................................................................… NOK 14 419 133 NOK 62 596 630 Note 8. Share capital and shareholder information As of 16.05.2022, there are 11 shareholders in the company. The shares are owned as follows: Number of class Ashares Number of class B-, C- and D-shares Total number of shares Einar Rasmussen .....................................................................................................................................................................… 30 0 30 Einar Rasmussen Investment AS *) .....................................................................................................................................................................… 169 344 16 765 056 16 934 400 Rannfrid Rasmussen .....................................................................................................................................................................… 30 912 3 060 288 3 091 200 Rannfrid Rasmussen Investment AS **) .....................................................................................................................................................................… 229 152 22 686 048 22 915 200 Dag Rasmussen (Member of the Board og CEO) .....................................................................................................................................................................… 497 953 17 918 208 18 416 161 Cathrine Rasmussen (Member of the Board) .....................................................................................................................................................................… 992 15 789 312 15 790 304 Carl Einar Bonnevie Rasmussen (Member of the Board) .....................................................................................................................................................................… 161 7 861 392 7 861 553 Julie K.Bonnevie Rasmussen .....................................................................................................................................................................… 160 7 861 392 7 861 552 Maren K. Bonnevie Rasmussen .....................................................................................................................................................................… 20 160 1 995 840 2 016 000 Anne Dahl .....................................................................................................................................................................… 1 344 133 056 134 400 Per Otto Rasmussen Dahl (Member of the Board) .....................................................................................................................................................................… 1
133 056 134
951 552 94
95
344
400
203 648
155 200 *)
**)
Share capital Share premium
Unrealized gains fund Other equity
Equity as of 31.12. 2019 1 094 285 98 486 13 108 921
Reworked adaptation IFRS 10 Equity as of 1.1.2020 reworked 1 094 285 98 486 8 078 253 10 006 265 Profit for the year reworked 3 827 902 234 238 Other changes
Provision for payment of dividends ÷ 142 732 Equity as of 31.12.2020 1 094 285 98 486 11 906 154 10 097 770
Unrealized gains
Share capital Share premium fund Other equity
Equity as of 1.1.2021 reworked 1 094 285 98 486 11 906 154 10 097 770 Profit for the year 1 854 137 765 858 Reduction of share capital to share premium ÷ 1 078 108 1 078 108
Provision for payment of dividends ÷ 22 000 Equity as of 31.12.2021 16 176 1 176 594 13 760 291 10 841 628
Related-party transactions 2021 2020 Purchase of managerial services from POLYSERVICES AS 18 231 15 414 Sale of services to AVANTOR AS 118 260 Interest income loan to Shearwater GeoServices Holding AS 50 798
Related-party balances 2021 2020 Receivables group companies 49 200 Liabilities group companies 5 818 3 136 Loan to Shearwater GeoServices Holding AS 800 447
Note 9. Equity
Subsequents
Note 10. Note 11.
Events No events that significantly impacts the business has occured after the balance sheet date. Note 12. Related-party transactions and balances
Cash-flow Statement for RASMUSSENGRUPPEN AS: 2021
NOK NOK CASH FLOWS FROM COMPANY OPERATING ACTIVITIES (Reworked) Profit before tax ............................................................................................................................................. 2 634 413 574 4 124 735 987 Taxes paid for the preceding year ............................................................................................................................................. ÷ 14 928 925 0 Ordinary depreciations ............................................................................................................................................. 366 361 345 330 Interest received …................................................................................................................................................ ÷ 127 266 980 ÷ 83 812 464 Interest paid ...…................................................................................................................................................ ÷ 213 969 ÷ 193 345 Cash-flow adjustments regarding securities .................................................................................................................................................. ÷ 2 131 103 949 ÷ 3 827 901 638 Changes in accounts receivable and short-term liabilities ............................................................................................................................................. 351 296 531 ÷ 151 456 230 NET CASH FLOW FROM COMPANY OPERATING ACTIVITIES ............................................................................................................................................................ 712 562 643 364 630 100 CASH FLOWS FROM INVESTMENT ACTIVITIES Investments in tangible fixed assets ............................................................................................................................................. 0 ÷ 3 068 813 Net investments/sales of short-term shareholdings, etc. ............................................................................................................................................. 450 378 336 ÷ 987 664 650 Investments in lending .............................................................................................................................................÷ 511 584 127 ÷ 542 615 553 NET CASH FLOW FROM INVESTMENT ACTIVITIES ...................................................................................................................................... ÷ 61 205 791 ÷ 1 533 349 016 CASH FLOWS FROM FINANCING ACTIVITIES Dividend payments ............................................................................................................................................. ÷ 142 732 800 ÷ 142 732 800 Net payments from Group companies ............................................................................................................................................. 0 165 000 000 NET CASH FLOW FROM FINANCING ACTIVITIES ...................................................................................................................................... ÷ 142 732 800 22 267 200 Net change in cash and cash equivalents throughout the year ............................................................................................................................................. 508 624 052 ÷ 1 190 986 116 Cash at bank as of 1 January .................................................................................................................................... 821 708 519 2 012 694 635 CASH AT BANK AS OF 31 DECEMBER .......................................................................................................................................................... 1 330 332 571 821 708 519 As of 31.12.2021, the company has no debts to credit institutions, nor has it provided any guarantees or secured liabilities.
2020