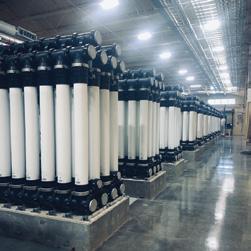
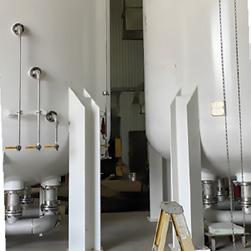
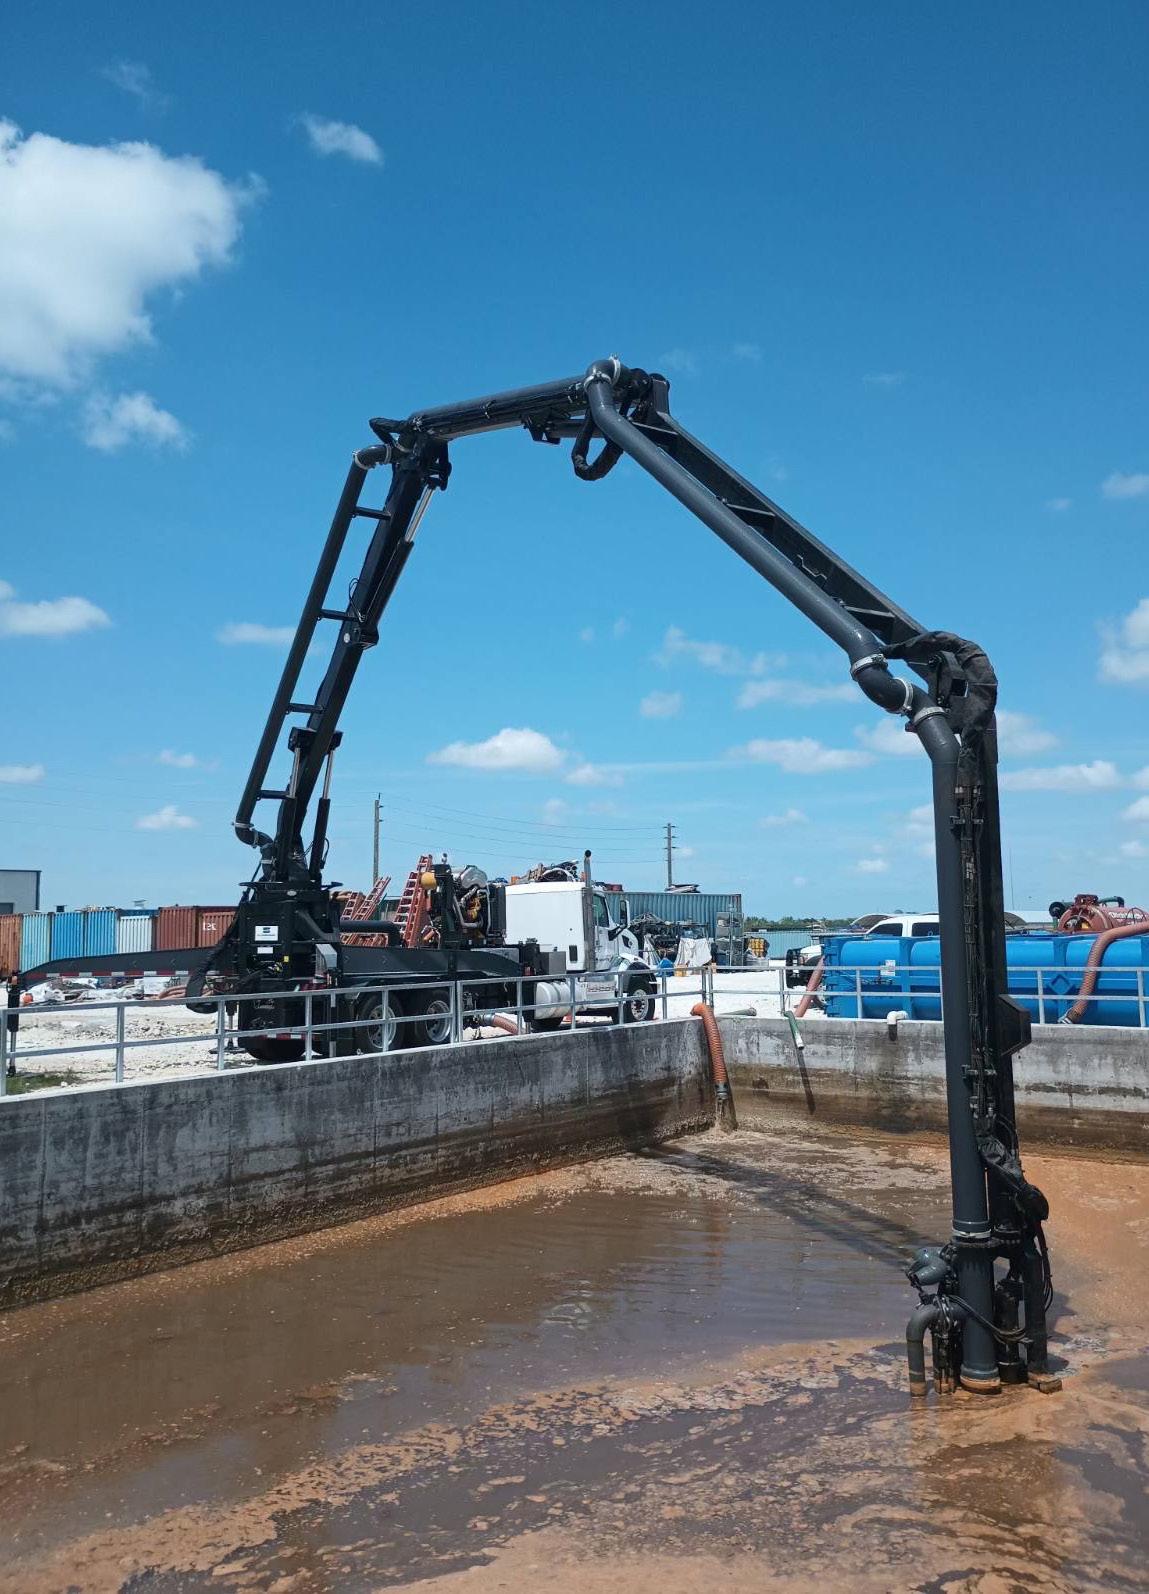
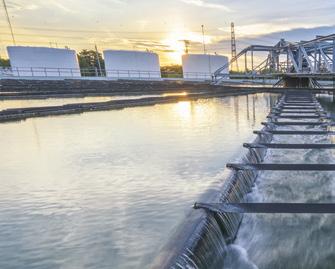
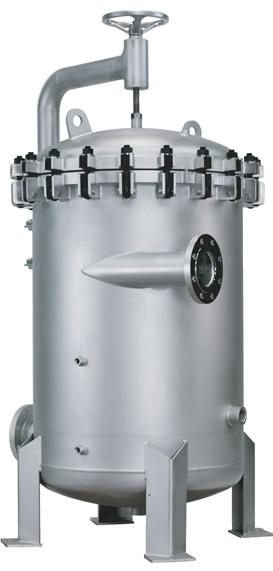
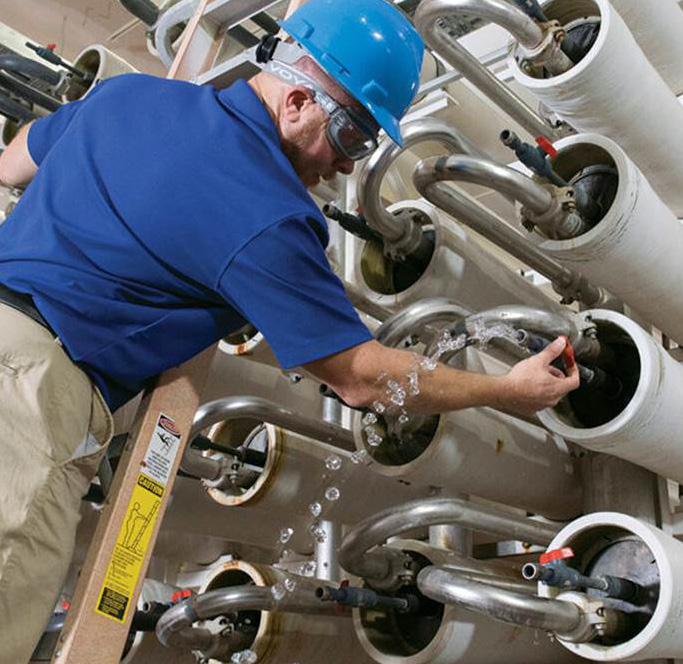
We address the challenge of PFAS in municipal drinking water and industrial wastewater through:
PRE TREATMENT
Hollow Fiber Ultrafiltration (submerged or pressurized) CONCENTRATION
High Rejection Reverse Osmosis (RO)
CAPTURE
LEAPfas* high efficiency Granulated Activated Carbon and/or Ion Exchange (mainstream or RO concentrate treatment)
End-to-end PFAS treatment and management solutions for a safer, cleaner future. Scan here or visit bit.ly/pfas-faqs to learn more.
*Trademark of Veolia; may be registered in one or more countries.
Editor’s Office and Advertiser Information:
Florida Water Resources Journal
1402 Emerald Lakes Drive
Clermont, FL 34711
Phone: 352-241-6006
Editorial, editor@fwrj.com
Display and Classified Advertising, ads@fwrj.com
Business Office: 1402 Emerald Lakes Drive, Clermont, FL 34711
Web: www.fwrj.com
General Manager: Michael Delaney
Editor: Rick Harmon
Graphic Design Manager: Patrick Delaney
Mailing Coordinator: Buena Vista Publishing
Published by BUENA VISTA PUBLISHING for Florida Water Resources Journal Inc.
President: Richard Anderson (FSAWWA) Peace River Manasota Regional Water Supply Authority
Vice President: Joe Paterniti (FWEA) Clay County Utility Authority
Treasurer: Rim Bishop (FWPCOA) Seacoast Utility Authority
Secretary: Rim Bishop (FWPCOA) Seacoast Utility Authority
Moving?
The Post Office will not forward your magazine. Do not count on getting the Journal unless you notify us directly of address changes by the 15th of the month preceding the month of issue. Please do not telephone address changes. Email changes to changes@fwrj.com or mail to Florida Water Resources Journal, 1402 Emerald Lakes Drive, Clermont, FL 34711
Membership Questions
FSAWWA: Casey Cumiskey – 407-979-4806 or Casey@fsawwa.org
FWEA: Laura Cooley, 407-574-3318, admin@fwea.org
FWPCOA: Darin Bishop – 561-840-0340
Training Questions
FSAWWA: Donna Metherall – 407-979-4805 or Donna@fsawwa.org
FWPCOA: Shirley Reaves – 321-383-9690
For Other Information
FDEP Operator Certification: Ron McCulley – 850-245-7500
FSAWWA: Peggy Guingona – 407-979-4820
Florida Water Resources Conference: 267-884-6292
FWPCOA Operators Helping Operators: John Lang – 772-559-0722, oho@fwpcoa.org
FWEA: Laura Cooley, 407-574-3318, admin@fwea.org
Websites
Florida Water Resources Journal: www.fwrj.com
FWPCOA: www.fwpcoa.org
FSAWWA: www.fsawwa.org
FWEA: www.fwea.org and www.fweauc.org
Florida Water Resources Conference: www.fwrc.org
Technical Articles
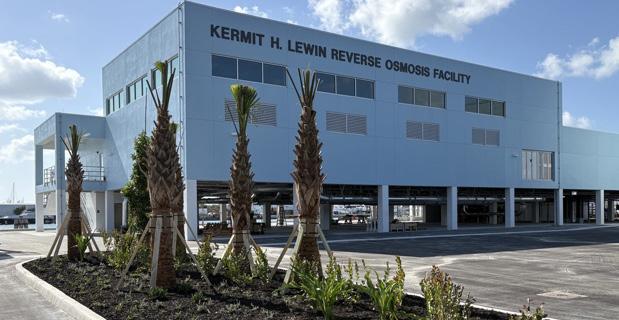
New $47M Reverse Osmosis Water Treatment Facility Opens on Stock Island
State-of-the-art plant doubles water treatment capacity and boosts resilience for the Lower Keys
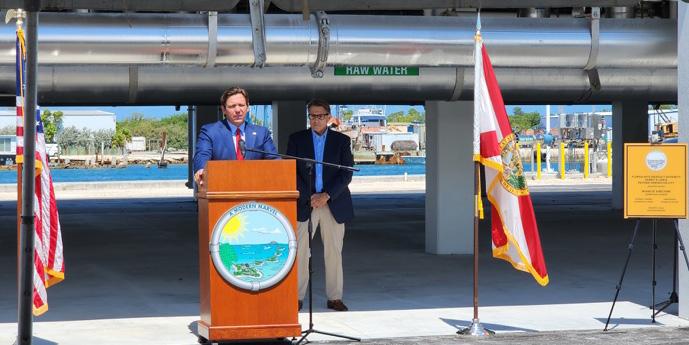
The Florida Keys Aqueduct Authority (FKAA), joined by Florida Gov. Ron DeSantis, stakeholders, and project partners, recently celebrated the opening of the $47 million Kermit H. Lewin Stock Island Reverse Osmosis Facility. The new facility doubles the previous plant’s capacity from 2 to 4 million gallons per day, providing a new water source to meet daily water system demands and enhancing emergency water supply and storm resilience in the Lower Florida Keys.
The project was made possible with support from multiple funding sources, including a loan from the U.S. Environmental Protection Agency Water Infrastructure Finance and Innovation Act and $30.6 million from the Rebuild Florida Infrastructure Repair Program following Hurricane Irma.
Located in a region with limited natural freshwater resources, the Florida Keys rely primarily on a single transmission pipeline from the south Florida mainland for their potable water supply. The new Stock Island facility, which replaces a decades-old seawater treatment plant on the same island, provides a vital layer of redundancy and resilience, designed to maintain reliable access to clean water in the event of service interruptions due to hurricanes, flooding, or other emergencies. The new facility will also augment existing supply to accommodate growth.
The facility serves as a critical water security infrastructure for approximately 25,000 residents and 1,200 businesses in the
Lower Keys region, from Stock Island through Big Pine Key. During peak tourist season, when the area’s population can swell by an additional 15,000 visitors, the facility’s expanded capacity helps meet water supply needs, even during periods of high demand.
Named in honor of Kermit H. Lewin, a longtime FKAA board member, the facility is built to maintain operations during Category 5 hurricanes and 100-year flood events, with structural elements elevated more than 20 feet above sea level. The plant was designed by Carollo Engineers, with support from key subconsultants Control System Consulting and ADS Engineering.
“This facility is a testament to our commitment to long-term water security in the face of extreme weather events,” said David Hackworth, FKAA director of engineering.
“By doubling our treatment capacity and incorporating advanced technology, we’re strengthening water reliability for Lower Keys residents and businesses while preparing for future challenges. This project represents a significant investment in our community’s resilience and demonstrates our dedication to providing safe, reliable water service regardless of conditions.”
The upgraded plant features advanced reverse osmosis (RO) technology, including the latest in membrane system design and materials. The system achieves approximately 45 percent water recovery—the proportion of seawater converted to freshwater—through
single-stage RO units and incorporates degasification and chemical treatment processes with post-treatment stabilization. These innovations offer higher efficiency and longer service life, contributing to a 50 percent reduction in energy consumption compared to the previous facility, despite doubling its production capacity. This energy efficiency is particularly important given the energyintensive nature of desalination processes.
The facility is also constructed to withstand the harsh environmental conditions in the Keys, including corrosive sea atmosphere, frequent storms, and potential sea level rise. All structural and process equipment materials were selected for their resistance to corrosion.
“We’re proud to have designed a system that blends innovation with durability, providing the community with access to safe, clean water when it’s needed most,” said Chris Reinbold, senior project manager at Carollo.
The facility includes energy-efficient transfer pumping systems and incorporates a modern water quality laboratory and emergency living quarters for staff. Power is supplied by the electrical grid or by onsite diesel generators, with backup fuel storage to support continuous operations during emergencies.
With commissioning complete and the plant fully operational in time for the 2025 hurricane season, it sets a new benchmark for resilient and sustainable water infrastructure in coastal and island communities. S
Gov. Ron DeSantis speaking at the grand opening.
The Kermit H. Lewin Stock Island Reverse Osmosis Facility.
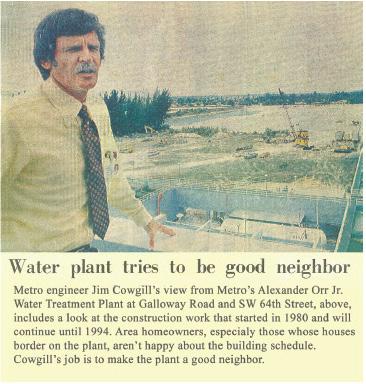
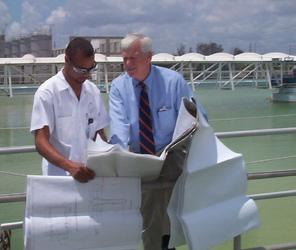
It is with sorrow and love that the family of James T. Cowgill announces his passing on February 26 after a battle with brain cancer.
Jim graduated in 1964 from the University of Virginia with a degree in mechanical engineering, the third generation in his family to become a UVA engineer. He also earned certification as a professional engineer.
His more than 50 years in engineering followed a multifaceted path. His first job at Newport News Shipbuilding and Dry Dock had him working on mechanical components in the overhaul of Navy nuclear submarines. From there, he moved to General Electric in Philadelphia, designing and testing mechanical equipment for the manned orbital laboratory program. In his next position, he designed and tested machinery to ensure safety in the maintenance of Eastern Airlines jets. Afterward, he spent two decades at the MiamiDade Water and Sewer Authority, serving as its assistant director.
For the next 30 years, he applied his expertise as senior consultant at Hazen and Sawyer, becoming a vice president and
In Memoriam James Thomas Cowgill 1942 - 2025
shareholder. When asked about his career, he simply stated: “I have spent the past 50 years working on improving the water and wastewater infrastructure in the south Florida area.” Hazen and Sawyer and his colleagues held a Celebration of Life on April 4 in recognition of his personal attributes and professional accomplishments.
Jim was active in the American Water Works Association (AWWA) and Water Environmental Federation, serving as chair of the AWWA Preventers Committee. His involvement in the Florida Section of AWWA earned him an appointment as a trustee and later as chair. At the section he also chaired the Finance and Likins Scholarship committees and the Technical Council. In 1997 he was selected as a recipient of the George Warren Fuller Award, given by AWWA “to recognize individuals with outstanding service to the water industry.”
Jim served as an instructor for the Dade County Supervisory/Training Program. He presented various technical papers on water and wastewater treatment plant operations and appeared as a guest speaker on several television talk shows and at engineering/ contractor meetings and civic functions.
In addition to his lifelong enjoyment of his profession, Jim loved people and made friends everywhere he went. Always positive and kind, he will forever be remembered for his positive outlook on life and his keen sense of humor and
wit. A talented tennis player from an early age, he was on the courts at least three times a week. An ardent Miami Dolphins fan, he held season tickets since the inception of the franchise. He never missed watching a UVA Cavaliers basketball game on television and especially loved it when he could do it with his son, a fourth-generation UVA graduate.
Jim had a great love for his family life. One of his favorite activities was playing board and card games with his children and grandchildren, who called him “the game guy.” He enjoyed travel, and his enjoyment increased when he could do it with family and friends.
Jim had a strong faith in God and prayed daily. He served as an usher at the 8:30 a.m. Mass at his parish of St. Sebastian for over 20 years. He is predeceased by his son, Jim Cowgill Jr. (ALS in 2023) and will be missed by his wife of 58 years, Lourdes; his daughter Lourdes Ann Janssen and husband Herbert; his daughter-in-law Marlene Fayette-Cowgill; his grandchildren, Jackson and Katherine Davis and JT and Ashlyn Cowgill; two great grandchildren; and his sister and brother-in law Elena and Jose DelAlamo.
A Celebration of Life Mass was held at St. Sebastian Catholic Church in Fort Lauderdale on May 7, followed by a reception at the parish hall. In lieu of flowers, donations can be made to the Gleason Foundation (www.teamgleason.org), which supports individuals suffering from ALS. S
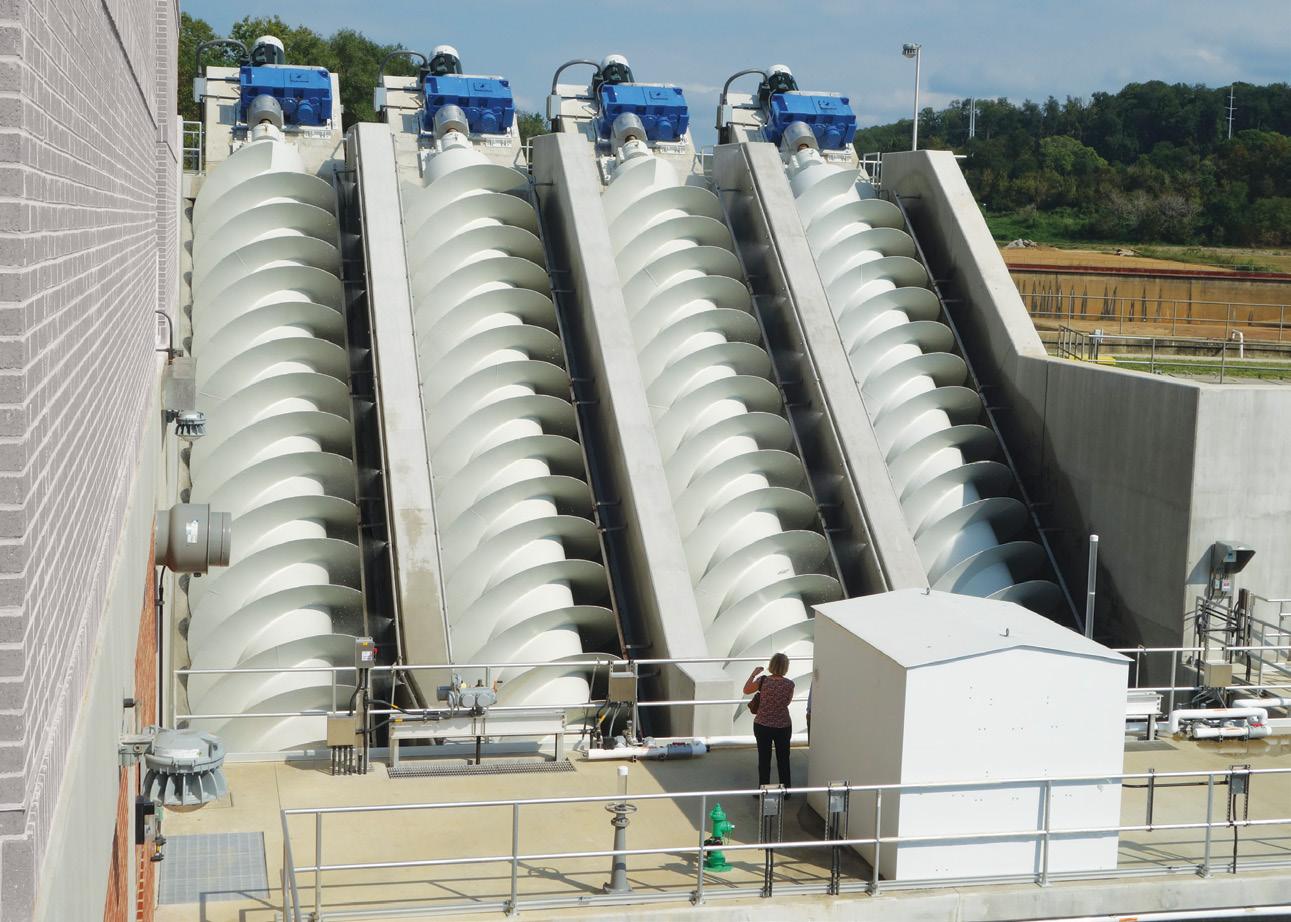
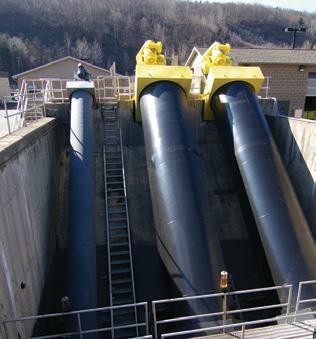
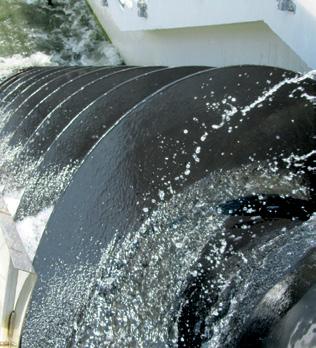
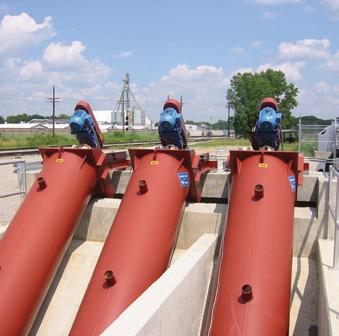
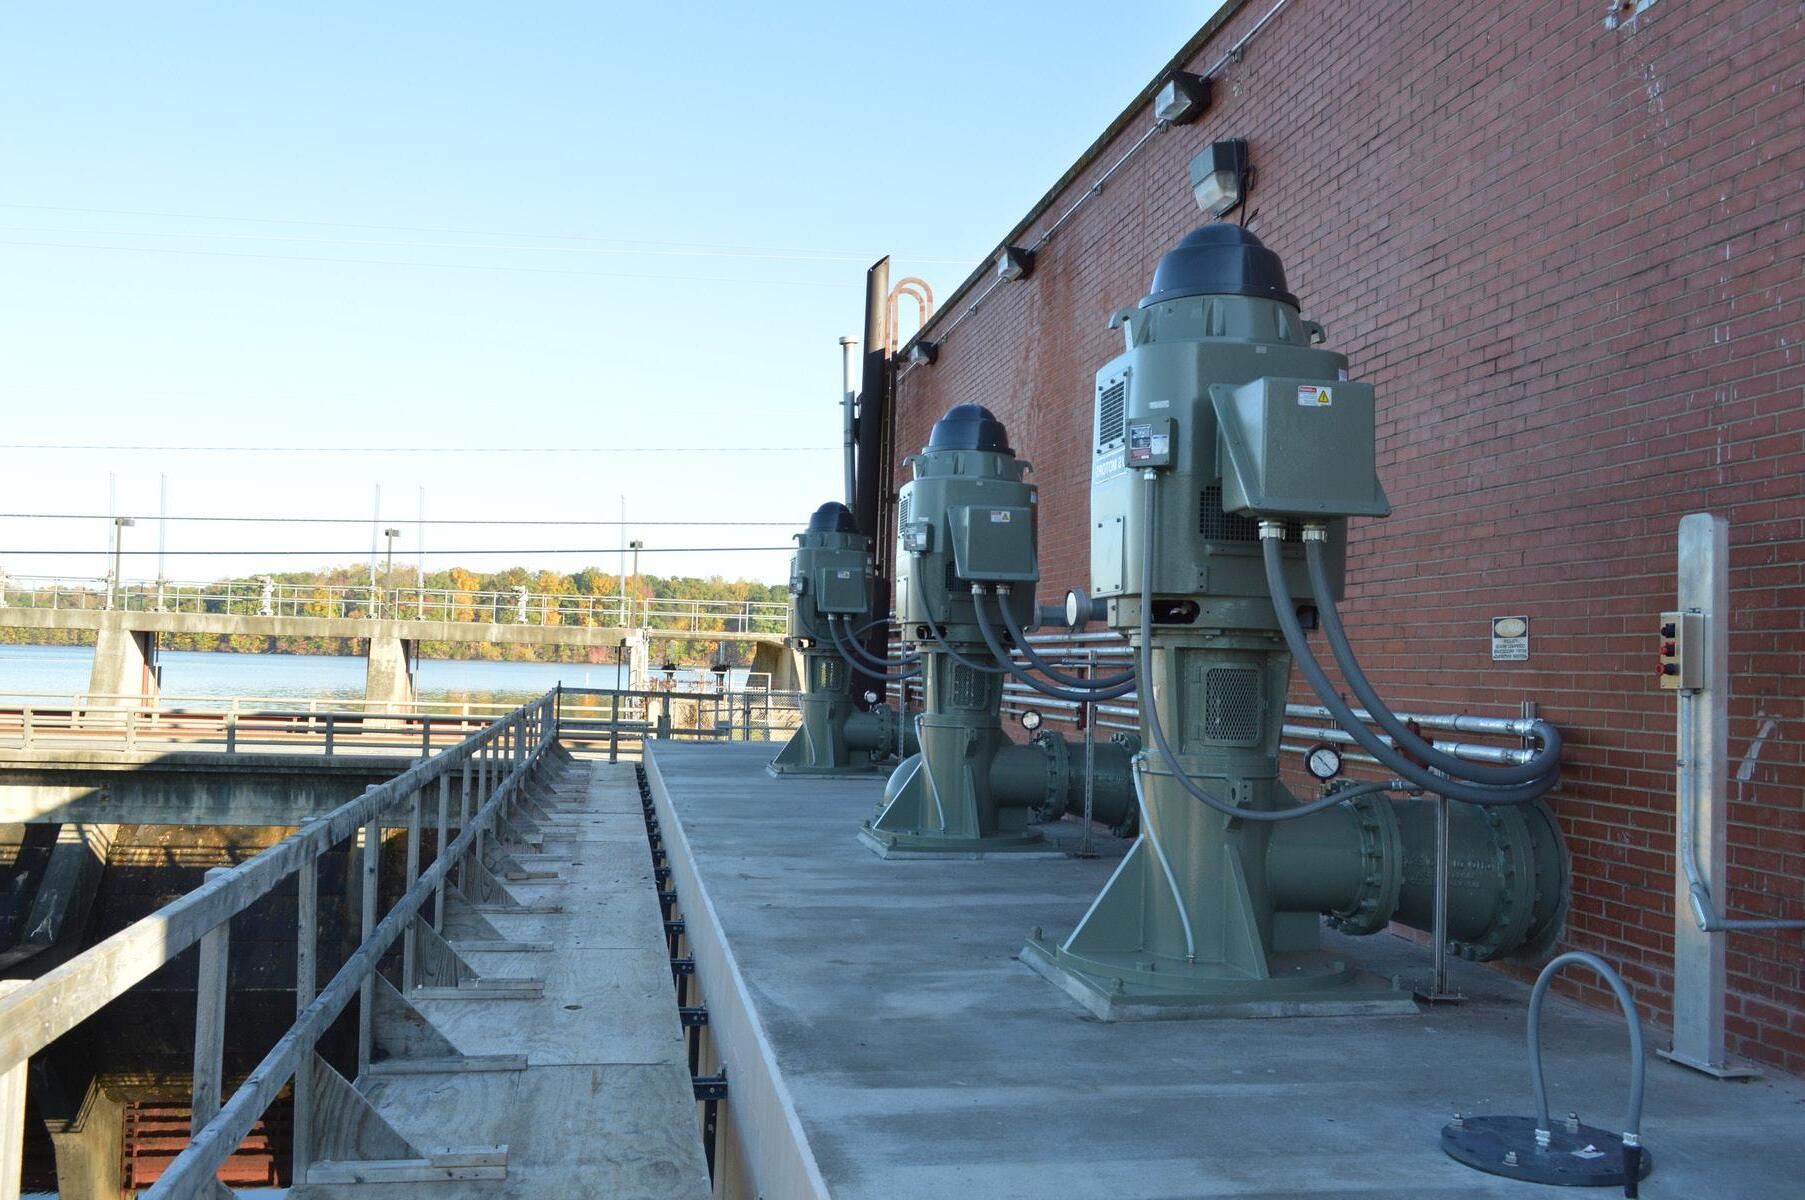
LOOKING FOR A SCREW PUMP UPGRADE THAT’S BABA-COMPLIANT?
LAKESIDE REPLACES ALL BRANDS & TYPES… AND MEETS REQUIREMENTS.
Lakeside’s screw pumps offer the ideal and cost-effective “drop in” replacements for less reliable designs. Improve pumping performance and reduce maintenance costs with our superior dual upper bearing design and heavy-duty self-aligning lower bearing designs. For decades we’ve been the go-to source for replacing all screw pump brands. Replacements typically require little or no structural modifications. It’s what you expect from Lakeside Equipment—known for nearly a century for efficient and dependable operation in all wastewater, drainage and industrial applications.
Cleaner Water for a Brighter Future®
Speak to one of our experts at 630.837.5640, email us at sales@lakeside-equipment.com, or visit www.lakeside-equipment.com for more product information.
CLR Process
Magna Rotor Aerators & Accessories
Sequencing Batch Reactors
Package Treatment Plants
Submersible Mixers & Recirculation Pumps
An Integrated Algae Mitigation System to Seek and Abate Harmful Algal Blooms
Sharanya Natarajan
This article was the winner of the 2024 Florida Second Place Stockholm Junior Water Prize.
Ensuring safe and clean water bodies is essential for natural ecosystem balance. Yet, algal bloom episodes distressing the water bodies have been rising rapidly. In a push to aggressively improve water quality across the United States, federal, state, and local agencies are all considering various options to overcome this environmental menace.
Algae are a diverse group of photosynthetic microorganisms, which are largely beneficial (1); however, when certain toxin-producing suites of microalgae grow excessively, harmful algal blooms (HABs) are produced (1,2). The HABs have recurrently threatened water quality and marine organisms, causing billions in losses,
especially in areas reliant on recreation and seafood harvesting (3).
Unpleasant bloom episodes occur every year on Florida’s coasts, changing the water chemistry and choking the food sources for marine life. Depleted oxygen zones causing large-scale fish and manatee mortality have plagued regional waterways, like the Indian River Lagoon estuary, which spans 181 mi across the east coast of Florida through six counties. This prominent biodiverse habitat houses over 4,000 plant and animal species (4). Impacts from anthropogenic sources have exacerbated the blooms, rendering parts of the estuary unnavigable, thereby devastating the area’s ecotourism. This seagrass-based habitat has now warped into an algae-based habitat, rendering an expensive recovery (4). Government agencies collect samples when algal blooms are observed during their
routine water quality monitoring or when the public reports bloom episodes and fish kills (4,6).
Traditional monitoring methods by engineers include water sampling in the field and algal density estimation by microscopy in the lab; sometimes, they may be unable to sample during harsh weather conditions. These techniques provide limited to no spatiotemporal data and do not solve the need for continuous information. The process is also manual and limited to once a month, which is late and insufficient for proactive HAB mitigation.
In this study, the researcher observed the challenging days in the life of marine engineers by shadowing them during field visits. The current system relies on a host of disparate data, e.g., public health reports, field observations, satellite imagery, and models, to offer insights on a bloom.
Proactive mitigation can only be achieved by understanding the spatial profile and movement of algal blooms in water bodies. Continuous monitoring using IoT (Internet of Things) principles and advanced technologies
Continued on page 10
Sharanya Natarajan attends Edgewood Jr./Sr. High School on Merritt Island.
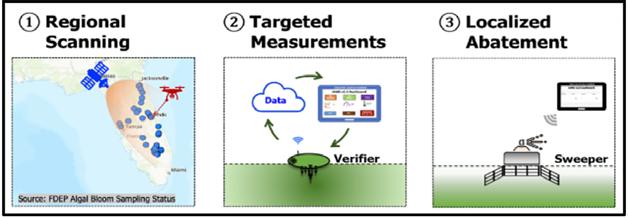
Figure 1. Imtegrated algae mitigation system components by researcher.
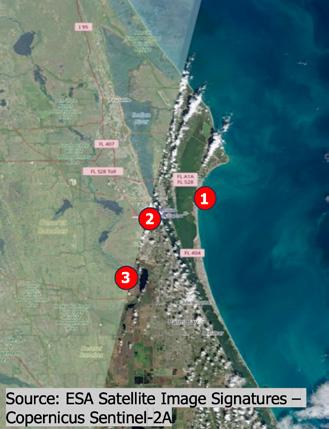
Figure 2. Copernicus Sentinel-2A satellite imagery with three candidate algal hotspots.
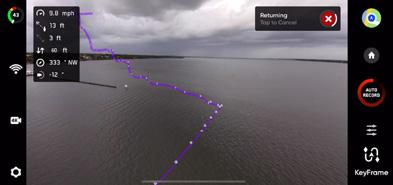
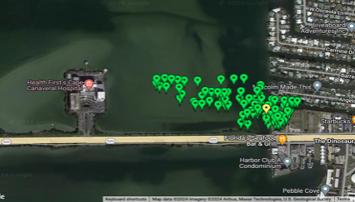
Figure 3. Drone flight path capturing geotagged images at Indian River Lagoon by the researcher.
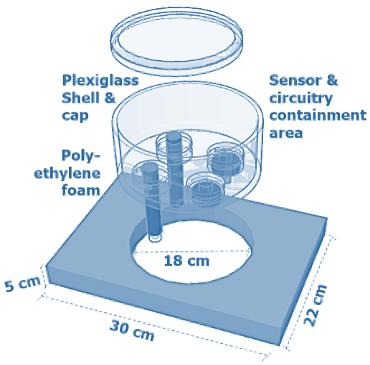
Figure 4. Verifier computer-assisted design by the rearcher.
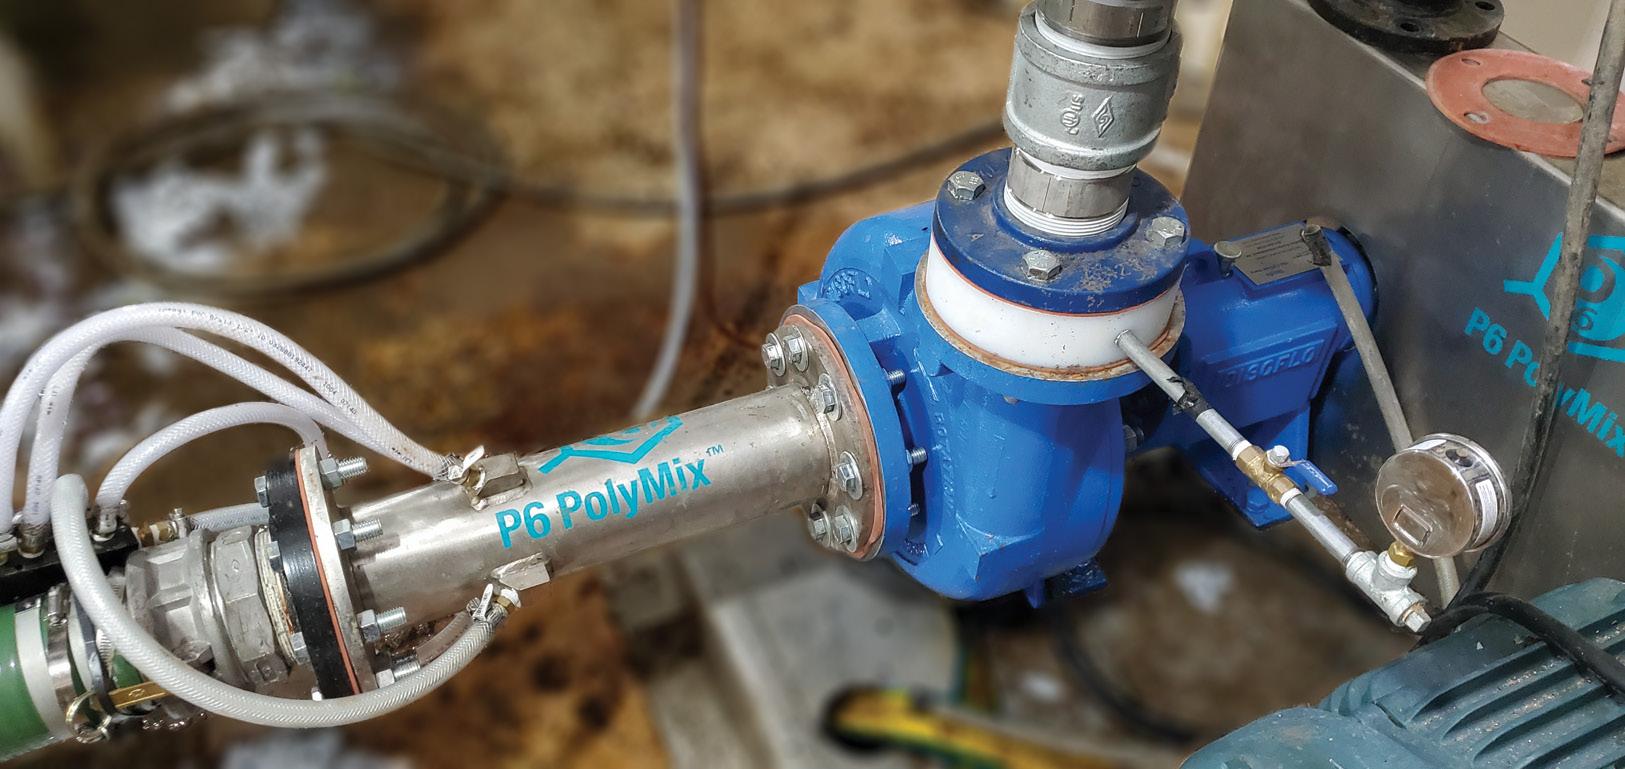
1. POLYMER REDUCTION: P6 PolyMix® Systems reduce polymer consumption by providing complete polymer/sludge mixing in a shear-sensitive manner. This patented mixing process allows long-strand polymer chains to remain intact and unbroken and wastewater floc to remain intact and unsheared. Typical applications result in a 25-50% REDUCTION IN POLYMER CONSUMPTION, thus saving the customer thousands of dollars in polymer expenses. By not breaking up the polymer chains, the dewatering equipment will experience less fouling, providing more reliability and reducing equipment cleaning costs.
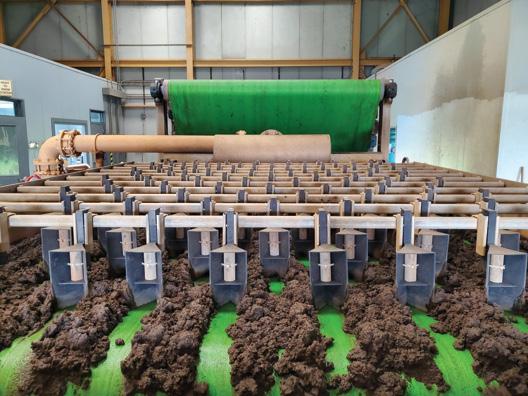
2. DRIER CAKE SOLIDS: P6 PolyMix® technology optimizes the polymer and sludge mixing process, allowing INCREASE DEWATERED SOLIDS CONCENTRATION and INCREASED PERCENT SOLIDS CAPTURED. This unique mixing process results in more efficient sludge hauling, allowing customers to transport less water and more dewatered cake off-site.
3. ELIMINATION OF PUMP MAINTENANCE: P6 PolyMix® technology reduces pump parts and maintenance by utilizing the abrasion-resistant Discflo pumping principles of Boundary Layer/Viscous Drag. This principle can save the customer thousands of dollars in parts and maintenance over the lifetime of the equipment. All P6 PolyMix® systems in the municipal market include a 10-YEAR (extendable to 20 years) 100% WET END WEAR WARRANTY, No other pump manufacturer in the industry provides a wear warranty, let alone a 20-year wear warranty!
4. PUMPS & MIXES: P6 PolyMix® technology uses the unique principles of Boundary Layer/Viscous Drag for mixing polymer versus a mixer/check valve; this, paired with its unique InjeX™ polymer injection mixing chamber, is designed for MINIMAL POLYMER DEGRIDATION, allowing for maximum polymer savings. The hydraulic shear forces within the mixing pump provide a complete homogeneous wastewater polymer slurry fed to the dewatering equipment without breaking the long chain polymers or reducing floc size.
5. LOWER OPERATING PRESSURE AND INSTALLED HORESPOWER: P6 PolyMix® technology dramatically reduces the operating pressure by reducing back pressure within the piping system due to eliminating mixer/check valves. In some applications, customers have had a 75% REDUCTION IN PRESSURE Lower pressure allows the feed pump to operate at lower horsepower. HORSEPOWER SAVINGS OF UP TO 50% OR MORE are possible by installing a P6 PolyMix® system. Customers can see substantial long-term energy savings and reduced upfront capital costs associated with lower installed horsepower.
6. HOW IS IT APPLIED: P6 PolyMix® systems entirely replace bulky, expensive, outdated traditional sludge feed pumps. You can now replace thousands of dollars in equipment and regain valuable real estate space by switching to P6 PolyMix® and utilizing its unique compact design, patented process for eliminating mixer/check valves, and ultra-efficient polymer mixing process. Contact us to learn how P6 PolyMix® can revolutionize the efficiency of your BELT FILTER PRESSES, GRAVITY BELT THICKENERS, ROTARY THICKENERS, SCREW PRESSES, AND CRENTIFUGES.
is imperative to solving current environmental issues (5). To bridge the gap in the siloed techniques largely employed today, an end-to-end engineered solution combining measurements, modeling, and sustainable remediation is essential for local water management teams to target and arrest HABs before they proliferate.
Methods
This research explores water quality issues regionally and locally to enhance the quality of human health and the environment by improving water quality. The engineering goal is to develop an integrated algae mitigation system (IAMS) by triangulating data from aerial surveillance and continuous ground-level measurements to target and abate HABs locally.
This IAMS prototype employs sustainable engineering and technology to suppress bloom proliferation. The system had three components: regional scanning, targeted measurements, and localized abatement (Figure 1). The IAMS uses intelligent data acquired through IoT sensors, and is processed and presented in a meaningful form for a rapid and sustainable response.
Regional Scanning
This component was designed to indicate an existing bloom in a regional waterbody. Initially, visible spectrums from Copernicus Sentinel-2A satellite signatures were observed, and three candidate locations were spotted based on degrees of green intensity: Banana River, a brackish water body; Indian River Lagoon, an intercoastal brackish water body; and Lake Washington, an inland freshwater body (Figure 2). Complementary visual surveillance was conducted using a multispectral camera secured to a certified drone. The drone was flown at about 60 ft above ground on a predetermined flight
path (Figure 3). Images were geotagged every 5 seconds, postprocessed, and stitched to form an Orthomosaic map and a digital surface model. The seamless Orthomosaic map corrected all the geometric distortions and color imbalances. The digital surface model showed the depth, which translated to the algal density.
Targeted Measurements
Based on intelligence gained from regional scanning, this component was designed to target an area on a large waterbody to tangibly measure water quality using IoT principles and confirm the presence of algae. This was achieved using an engineered floatation system called the Verifier. The shell, frame, and IoT circuitry designs were initially sketched in computer-assisted design (CAD), shown in Figure 4. First, the Verifier shell was constructed using an 18-cm plexiglass shell. Four 3.8-cm openings were bored, and O-rings of suitable dimension were fitted. Four rubber stoppers firmly secured the openings and holes were drilled through rubber stoppers to insert sensors. All edges and corners were sealed with a hydrophobic sealant to prevent water intrusions through the shell.
The floatation frame was constructed from a sink-resistant polyethylene foam material measuring 30x22x5 cm. An 18-cm-diameter hole was then cut, and the shell module previously constructed was snug-fitted and capped. Finally, the circuitry was built and included an Arduino MKR1000 Wi-Fi microcontroller connected to five algal parameter sensors: dissolved oxygen, or DO2 (DFROBOT); pH (GAOHOU); total dissolved solids, or TDS (DFROBOT); temperature (Songhe DS18B20); and photo intensity. All algal parameter sensors were connected to a breadboard. During functionality tests, connectivity issues were encountered due to the large number of loose wires; therefore, the circuit was upgraded to a printed circuit board
(PCB) design (Figure 5). Sensors were soldered to a prototyping board and powered by a 5-volt solar battery, which reduced the form factor and eliminated connectivity issues, making it field-worthy. The Verifier was calibrated, and a unified C++ code was written to transmit algal parameter data to an open-source platform on a handheld device (Figure 6).
Localized Abatement
Based on the input from targeted measurements, a remediating system called the Sweeper was designed for a proactive cleanup. Several prototypes were designed during the evolution of the Sweeper (Figure 7). Prototype 1, a flat plate with no holes, was initially developed; however, this had the most significant amount of hydrodynamic drag, determined by the drag force equation, as all the water went around after contact with the plate. The equation calculated the drag force as :
FDrag = (1/2) * D * ρ * A * v^2
where FDrag is the drag force in gm-cm/sec^2; D is the drag coefficient; ρ is the density of water in gm/cc; A is the reference area in cm^2; and V is the velocity of the object in cm/sec
Therefore, an upgraded version, Prototype 2, was developed. This was a semihexagonal plate with square holes and an opening in the middle to house filter materials. In this design, there was 60 percent less drag force than the flat plate; however, this design was thought to rupture due to the formation of wakes and eddies in the corners of the square holes. Finally, the Prototype 3 was engineered as a semihexagonal plate with circular holes. In this design, there was 86 percent less drag force versus the flat plate, as 52 percent of the water passed through the Sweeper. The circular
Figure 5. Breadboard circuit design versus PCB circuit design by the researcher.
Figure 6. Verifier testing with transmission to a handheld device
Figure 5. Breadboard circuit design versus printed circuit board design by the researcher.
Figure 5. Breadboard circuit design versus PCB circuit design by the researcher.
Figure 6. Verifier testing with transmission to a handheld device
Figure 6. Verifier testing with data transmission to a handheld device.
Figure 7. Sweeper evolution by the researcher.
Figure 7. Sweeper evolution by the researcher.
Figure 7 evolution by researcher.
Figure 7. Sweeper evolution by the researcher.
holes enabled a smoother water flow, thereby balancing the pressure and providing symmetry, which maximized the filter life.
This Sweeper, which was 3D printed using recycled plastic, had 2-cm-diameter holes in the surface for filtration (Figure 8). It measured 6 cm tall and 20 cm end-to-end with 8 cm sides. The structure included a 2-cm internal gap for barley straws, a sustainable material for filtration purposes. The Sweeper was mounted to the bow of an underwater remotely operated vehicle (ROV), shown in Figure 9. This carrier ROV was made of high-density, durable floatation material, measuring 25x15x3 cm. It was thrust by four 3-volt motors and had omnidirectional traversing capabilities. Two motors were positioned in the stern for a forward thrust. The port and starboard sides had one motor each to assist with turning. A 3D-printed rudder provided the ride stability for the ROV. The circuitry was housed in a 3D-printed enclosure with a Wi-Fi microcontroller powered by a 5-volt battery. The Sweeper was programmed to be propelled from a mobile device from anywhere. Finally, a centralized hub allowed the ability to access data and manage and control the Verifier and the Sweeper from the cloud. Descriptive and diagnostic analytics were observed in the visualization platform.
Figure 8 dimensions researcher.
Figure 8. Sweeper dimensions by the researcher
Figure 8. Sweeper dimensions by the researcher.
Lab Analysis Testing
Figure 9. Sweeper mounted on ROV CAD by the researcher.
Figure 9. Mounted on the remotely operated vehicle computer-assisted design by the researcher.
Figure 9. Sweeper mounted ROV CAD by the researcher
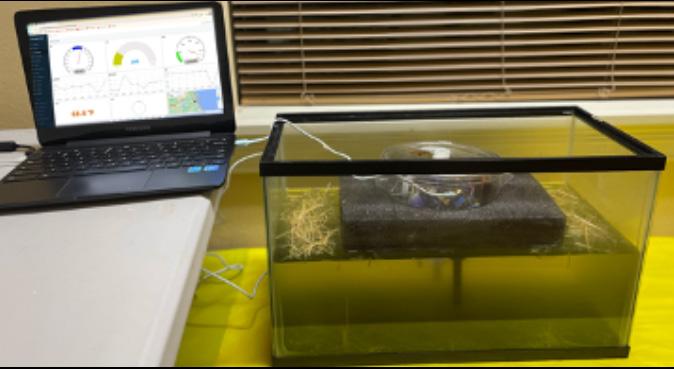
The Verifier was tested for structural and technological integrity (Figure 10). A 51x26x31cm plexiglass tank was used as a pond simulator. Twenty-seven L of dechlorinated water were cultured with Chlorella vulgaris (C. vulgaris) algae (control variable), representing a waterbody with an algal bloom. The Verifier was placed in the pond simulator for the structural integrity test and then tested for leaks. The microcontroller was powered for the technological integrity test, and water quality metrics, such as DO2, pH, total dissolved solids (TDS), temperature, and photo intensity, were transmitted wirelessly to the centralized hub visualization platform.
Stress was induced in the pond simulator environment by adding 10 ml of hydrogen peroxide (H2O2) chemical agent to inhibit algal growth. Algal variations every 60 seconds were observed on the cloud dashboard over five days, and the data were then downloaded for desktop modeling and analytics. The dependent variable was DO2, a leading algal indicator for algal presence. The TDS, an indicator for algal density, was chosen as the independent variable along with other metrics, namely, pH, temperature, and photo intensity. Furthermore, the engineered Sweeper was also tested in the pond simulator during experimentation. Enough barley straw
was inserted in the Sweeper and manually oscillated in the pond simulator to simulate its behavior during transit in a water body.
Field Analysis Testing
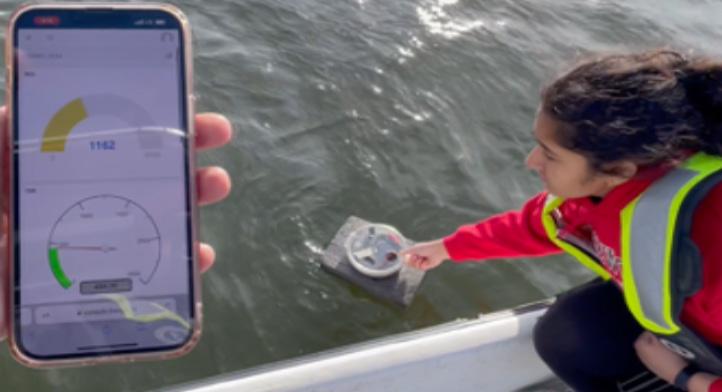
Regional scanning was achieved using a drone attached to a multispectral camera at three locations: Banana River, Indian River Lagoon, and Lake Washington. With assistance from St. Johns Water Quality Management (SJWQM) engineers, the Verifier floatation device used for targeted measurements and the Sweeper used for localized abatement were tested for data transmissivity and remote propulsion in field. Despite small form factors, the Verifier and Sweeper achieved the research objectives (Figure 11). The metrics collected by the Verifier matched SJWQM data from their sondes during collated testing.
Results
Regional Scanning
Surface water hydrology surveys were obtained via imagery. Although the European Space Agency Sentinel-2 imagery could not isolate harmful algae species, it could indicate high biomass areas based on degrees of algal Continued on page 12
Figure 10. Verifier lab analysis testing in C. vulgaris pond simulator.
Figure 11. Verifier field testing at Indian River Lagoon with assistance from St. Johns Water Quality Management..
intensities. A complementary drone multispectral assessment provided an escalated level of spatial accuracy on proliferation. Based on the digital surface model, which captured both natural and artificial features, locations were triangulated for further on-field confirmation and subsequent action.
Targeted Measurements
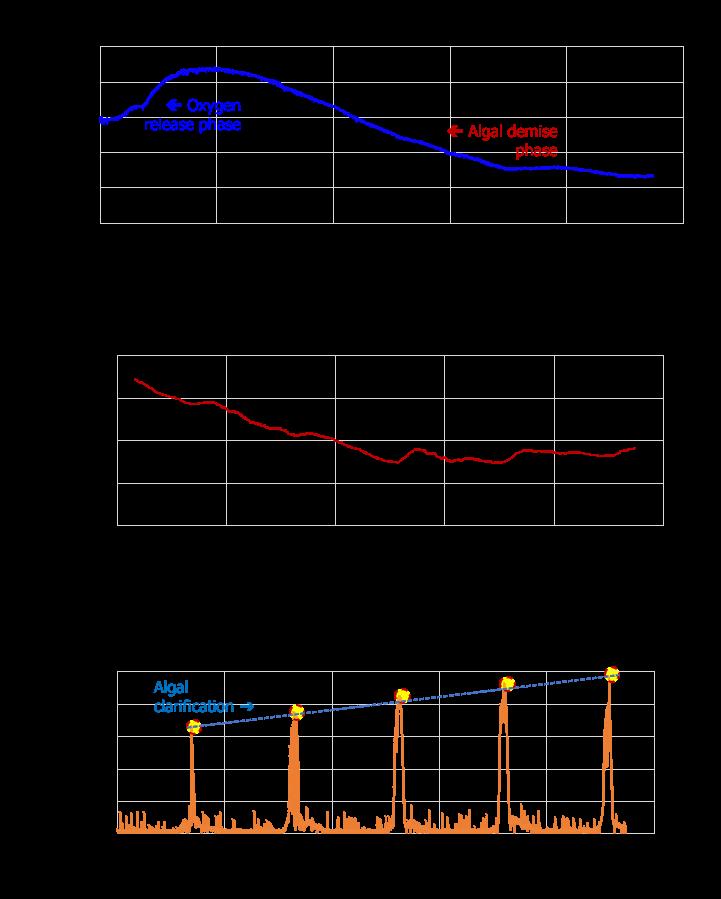
Based on aerial imagery and triangulation, water quality measurements were achieved. Importantly, lab analysis testing results following H2O2 addition were scientifically aligned as the agent suppressed the C. vulgaris algae. The DO2 and pH levels declined temporally over a five-day interval and made the microcosm conditions unsuitable for algae (Figures 12 and 13). Photo intensity peaks grew each day, indicating water clarification (Figure 14). Multiple regression and analysis of variance were achieved to analyze the relationship between a dependent variable DO2 and a set of independent variables (pH, TDS, temperature, pH, and photo intensity). Furthermore, a machine learning model was created to observe the curve of best fit between the DO2-dependent
variable and the TDS independent variable, rather than forcing a closed-form solution.
Localized Abatement
Following inputs from the Verifier measurements, algal abatement was achieved using the Sweeper with barley straw filters. An underwater ROV, which served as the Sweeper carrier, was successfully propelled from a mobile device and remediated the algae from surface water, thereby continuously filtering the water body. Cleanup efforts were monitored using a remote camera.
Discussions
Satellite monitoring for HABs poses challenges, including resolution issues, cloud cover, image processing turnaround times, bandwidth and latency limitations, and species identification (6). Deficiencies of satellite scans could be counterbalanced by pairing them with lower-altitude drone imagery for a detailed spatial resolution, including depth and temporal distribution of the proliferation; however, aerial imagery using drones is constrained by power, area coverage, and algal-type identification
for subsequent mitigation. So, targeted field measurements provide an understanding of the biological characteristics and hydrology of a waterbody.
Understanding the science behind algal chemistry is necessary for engineers to suppress HABs. Algal particles settle naturally after their life cycle, but the process is lengthy. A stress inducement to the system via external agents is necessary to accelerate settling. This study used H2O2, a weakly acidic chemical agent, for algal suppression. The H2O2 is a potent oxidizing agent and exhibits tendencies to suppress algal growth without releasing any residual chemicals. When dispersed in water, H2O2 breaks down, releasing oxygen-free radicals that react with algal cell membranes and dissolve proteins, leading to algal demise (7). In addition, the study also employed sustainable, nontoxic materials, e.g., barley straws for suppression. Per scientific research, decaying barley straws release H2O2, inhibiting algal growth (7); a similar phenomenon was observed in this research.
Model
Multiple regression analysis was conducted to understand the relationship between the DO2-dependent variable and independent variables. An R^2 of 0.89 suggests a strong relationship between the DO2 and the rest of the independent variables. This is supported by the regression equation:
Finally, a machine learning model was created to observe the relationship between a dependent variable (DO2) and an independent variable (TDS) instead of forcing on a closedform solution. The model obtained during hyperparameter tuning was a linear regression model that uses a polynomial basis function (Figure 15). This was 90 percent accurate in predicting DO2 based on TDS, an algal proxy.
A fourth-order polynomial equation was the choice for modeling this dataset:
Further tests in uniform lighting to observe algal spatial proliferation on the topology of the waterbody are necessary for improved image quality. Achieving field testing in different seasons is also necessary for a robust temporal view.
Figure 13. following Figure 14. Photo intensity vulgaris following H2O2
Figure 12. vulgaris following
Figure 12. The DO₂ variations of C. vulgaris following H₂O₂ dosage.
Figure 13. The pH variations of C. vulgaris following H₂O₂ dosage.
Conclusions
Reactive HAB monitoring and sparse mitigation have cost Florida billions, prompting the need for an integrated solution. Currently, standalone techniques are insufficient for HAB mitigation, so there is a need to complement imaging techniques with water quality monitoring for intelligent HAB elimination. An integrated system to seek and abate HABs is essential to take control of water quality. This engineered IAMS, which has three components, provided measurements and remediation features.
variations of C. vulgaris
S First, based on the regional scanning of the three points of interest determined by satellite imagery, complementary aerial surveillance was achieved using a drone. Images were postprocessed, and upon inspection of the optical characteristics of the local area and the surrounding waters, intelligence was gained on algal susceptible zones.
S Next, targeted measurements were achieved using the Verifier floatation device following the actionable data gathered from regional scanning. The Verifier system captured algal parameters and transmitted them to a cloud platform where descriptive analytics were observed.
S Finally, on the localized abatement component, an engineered semihexagonal Sweeper structure with sustainable filters (barley straw) assisted in abating algae using an underwater ROV. Lab analysis testing was achieved using an H2O2 agent, effectively suppressing C. vulgaris algae in the pond simulator. Multiple regression models predicted DO2 with different dependent variables as a set explained 89 percent of the time. Also, a fourth-order polynomial machine learning model predicted DO2 using TDS with 90 percent accuracy. Overall, this proposed solution can help marine engineers proactively tackle blooms for pristine waters to save local economies.
Acknowledgments
I sincerely thank Ms. Lauren Hall, Ms. Melissa Adams, and other marine engineers and data scientists at St. Johns Water Management District for providing access and assistance in conducting collocated field studies at the Indian River Lagoon and Lake Washington. I would also like to thank the Marine Discovery Center for allowing me to share my findings at the 2024 ShORE Symposium, where I was able to discuss my prototype solution and created awareness to solve complex issues in central Florida’s watershed. I am thankful for the overwhelming attention from the scientists, policy experts, and
Figure 14. Photo intensity variations of C. vulgaris following
Figure 15. Fourth-order polynomial regression.
the public who listened, recognized, advised, and supported the protection of the most diverse watershed in the U.S., the Indian River Lagoon. Lastly, I thank Mr. Mark Witsaman for his guidance on electrical circuitry during product development.
References
1. Algal Toxicology. (2023). Center for Earth and Environmental Science. https://cees. iupui.edu/research/algal-toxicology/index. html.
2. Garrett, Matthew, et al. “Harmful Algal Bloom Species and Phosphate-Processing Effluent: Field and Laboratory Studies.” Marine Pollution Bulletin, vol. 62, no. 3, 1 Mar. 2011, pp. 596–601, www.sciencedirect.com/ science/article/pii/S0025326X10005060, https://doi.odying Harmful Algae.” National Centers for Environmental Information (NCEI), 24 Sept. 2018, www.ncei.noaa.gov/ news/monitoring-and-studying-harmfulalgae.
3. Grattan, L. M., Holobaugh, S., & Morris, J.
G. (2016). Harmful algal blooms and public health. Harmful Algae, 57, 2–8. https://doi. org/10.1016/j.hal.2016.05.003.
4. Indian River Lagoon National EstuaryIndian River Lagoon Encyclopedia. (2023, April 8). Indian River Lagoon Project. https://indianriverlagoonnews.org/guide/ index.php/Indian_River_Lagoon_Estuary
5. Natarajan, L. (2022). A Supervisory Control and Data Acquisition System to Mitigate Fugitive Methane Emission in Landfills. Journal of Student Research, 11(3). https:// doi.org/10.47611/jsrhs.v11i3.2975.
6. Stauffer, B. (n.d.). Considerations in Harmful Algal Bloom Research and Monitoring: Perspectives From a Consensus-Building Workshop and Technology Testing. Frontiers. Retrieved July 16, 2019, from https:// www.frontiersin.org/articles/10.3389/ fmars.2019.00399/full.
7. Pęczuła, W. (2012). Influence of barley straw (Hordeum vulgare L.) extract on phytoplankton. Journal of Applied Phycology, 25(2), 661–665. https://doi. org/10.1007/s10811-012-9900-7. S
Figure 14. Photo intensity variations of C. vulgaris following H₂O₂ dosage.
Figure 15. Fourth-order polynomial regression.
Hurricane Procedures and Preparedness
Kevin Shopshire President, FWPCOA
y the time you read this column, we Floridians will already be a month into “hurricane season.” I’m hoping it starts as a quiet month, as I write these columns a month ahead.
We’ve all seen the news stories about hurricane season. This year the local news stations in my part of Florida had a daily countdown to the beginning of the season, but do hurricanes follow their calendar, like the animals that only cross at wildlife crossings?
Be Prepared
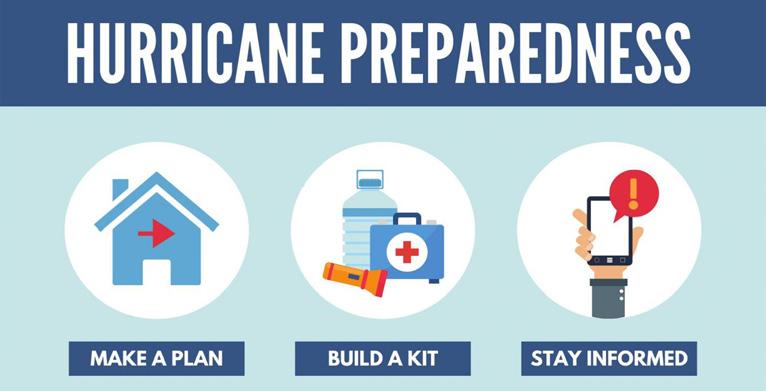
Take care of your home and family first. There are multiple ways you can stay prepared in your personal world. Every television news channel tells you to check their website, but the state of Florida also has an official hurricane preparedness website (www.stateofflorida.com/ articles/hurricane-preparedness-guide/).
In our house, we keep a separate tote in the back of a hall closet, year-round, with a few of the items listed on the websites. It doesn’t take much space, and we all know where it is. We even keep a printed copy of the items within it to aid with the annual inventory check at the beginning of hurricane season. If you time your inventory check right, it’ll coincide with the hurricane and tax relief sales at many stores.
Getting hit by a hurricane is not a matter of “if” in Florida, but “when.” My family has been fortunate in the last few years, but a lot of Florida families have not. Take the time to make sure you have a written plan, it’s understood by your family, and communicated to family and friends outside your home who will go looking for you (when you’re not posting kitty photos to your social media accounts).
If You Have to Be at Work
Yes, most municipal employees have some type of emergency scenario responsibility. As operators, whether water, sewer, storm, or pretreatment, we are emergency “first responders.”
The legislation was passed at the state level to officially recognize us. No one else is going to respond to the sanitary sewer overflow, the water outage, and the stormwater backup and flooding. Your municipality may have different labels, but most of us are required to respond as soon as conditions are safe—if not during the storm.
Does your workplace have a written hurricane procedure? Is it for the entire workplace, or just your division? Here in the City of Rockledge we have developed a wastewater hurricane standard operating procedure. This is a living document, specific to the wastewater/water reclamation division. It includes things like:
S Definitions
S Procedures for preseason, prestorm, during the storm, and after the storm
S Lists of responsibilities, equipment and inventory, details of city lift stations and private lift stations, employees, and city “hot spots”
S Information from other agencies
S Examples of Federal Emergency Management Agency documentation
One of our procedures every year includes gathering comments and revisions from supervisors. All copies are gathered and notes from supervisors are incorporated into the living document. It can seem wasteful to reprint the 30page document every year, but we do it. The new copies are dated and printed to ensure we all have the most current information at our work stations available—even when the power is out and we don’t have access to documents on our internet servers.
Another one of our preseason procedures
includes training. One of our monthly wastewater safety meetings is the review of the current hurricane procedure document with all wastewater employees. It’s easy to watch videos of hurricane damage, wind, etc., and consider yourself trained, but are you trained to respond how your supervisor needs you to for your municipality? Your normal day job may have you stationed at a computer in the operations lab, but what do you do when the SCADA screen is blank, your municipality is 85 percent without power, you see the influent structure overflowing, and it hasn’t stopped raining in two days? You may be running debris removal or running generators to lift stations with field crews in efforts to keep the sewer within the sewer! Is our procedure perfect? No. Is our procedure fit for the whole city? No. Does it help us every year to be prepared for the hurricane situations we’ve encountered in the past? Yes, hopefully. Can we improve? Yes, and we do it every year by reviewing and revising our previous procedures and then sharing the information with employees. I hope you all have some type of departmentspecific hurricane procedure in your municipality. I hope you as supervisors are training your employees regularly in these procedures. Just as your equipment and operations manuals have procedures to ensure your plant is running properly and safely, a hurricane procedure can help improve and maintain safe working conditions. There are many resources out on the internet to aid with hurricane response, but do you have a written copy ready for the internet blackout during the storm?
Stay safe this season. S
(source: www.housedems.ct.gov)
FWEA FOCUS
A New Chapter Begins: Embracing Innovation and Community in Florida’s Water Future
Joan Fernandez President, FWEA
A Heartfelt Hello
It is with immense pride and excitement that I step into the role of president of the Florida Water Environment Association (FWEA). Florida’s vibrant communities, diverse ecosystems, and dynamic challenges make our work both vital and rewarding. As we look ahead, I’m eager to collaborate with each of you to advance our shared mission of safeguarding and enhancing Florida’s water environment.
Stormwater Management: Navigating New Horizons
Stormwater management has always been a cornerstone of our efforts, but today it’s more critical than ever. With urban populations projected to grow and climate patterns becoming increasingly unpredictable, our stormwater systems
face unprecedented pressures. The Water Environment Federation (WEF) “Rainfall to Results” report underscores the need for innovative, integrated approaches to manage stormwater effectively.
In Florida, we’re witnessing impacts firsthand, such as rising sea levels, intensified storm events, and aging infrastructure, that challenge our traditional methods—but with challenge comes opportunity. By embracing holistic, watershed-scale strategies, we can transform stormwater from a liability into a valuable resource.
Looking ahead, WEF and the Water Environment Association of Texas are cohosting the 2025 Collection Systems and Stormwater Conference from July 15–18 in Houston. This landmark event, themed “One Water, One Future: Building Resilience from the Bayou Up!” will explore integrated solutions for stormwater and collection systems in the face of climate change and severe weather events. The conference will feature workshops, technical sessions, and exhibits highlighting innovations in green infrastructure, smart technologies, and climate-resilient design. It’s a fantastic opportunity for Florida professionals to connect with peers and bring back insights that can strengthen our own stormwater strategies.
Embracing Emerging Technologies
Innovation is at the heart of our future success. Emerging technologies offer promising solutions to our most pressing water challenges.
S Digital Twins. These virtual models allow us to simulate and analyze stormwater systems in real time, enhancing our ability to predict and respond to flooding events.
S Artificial Intelligence (AI). The AIdriven analytics can detect anomalies, predict system failures, and optimize maintenance schedules, leading to more resilient and efficient operations.
S Internet of Things (IoT). Networks of sensors provide continuous monitoring of water quality and flow, enabling proactive management and rapid response to issues.
By integrating these technologies, we can create smarter, more adaptive stormwater systems that protect our communities and environment.
The FWEA Emerging Water Technology Committee is at the forefront of exploring and promoting these innovations. Its mission is to facilitate knowledge exchange and collaboration among experts, stakeholders, and innovators in the water community. The committee organizes annual workshops showcasing cutting-edge technologies and supports the communication of technology readiness, including demonstration and field testing. By strengthening collaboration among utilities, vendors, consultants, and local universities, the committee aims to advance the implementation of innovative solutions to address Florida’s evolving water challenges.
If you’re passionate about advancing water technology and wish to contribute, the Emerging Water Technology Committee welcomes new members and volunteers. To get involved please reach out to the committee chair, Jennifer Stokke Nyfennegger of Carollo Engineers, at jstokke@carollo.com. Additionally, you can express your interest by completing the FWEA volunteer interest
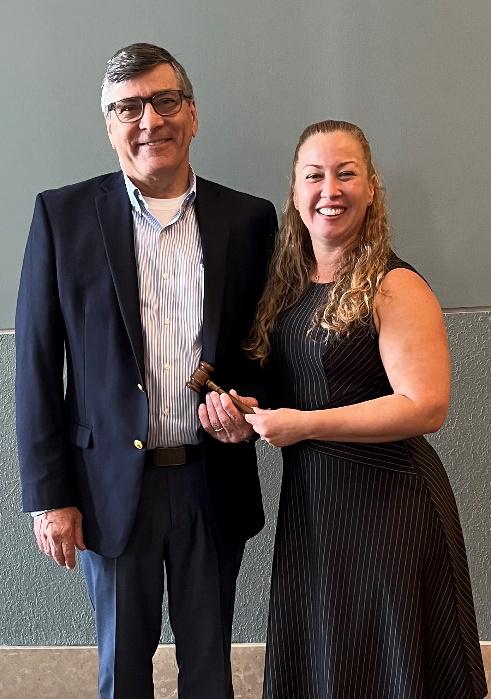
Receiving the FWEA gavel from Joe Paterniti, the outgoing president.
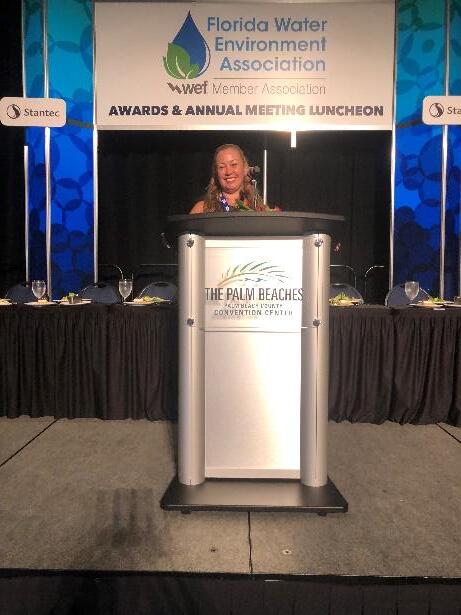
Delivering my acceptance speech at the Florida Water Resources Conference.
form (found at www.fewa.org) and selecting the Emerging Water Technology Committee.
Reflecting on the Florida Water Resources Conference
The recent Florida Water Resources Conference (FWRC), held this year from May 4–7 at the Palm Beach County Convention Center, was a vibrant gathering of professionals dedicated to advancing Florida’s water environment. As a joint conference of the Florida Section of the American Water Works Association, FWEA, and Florida Water and Pollution Control Operators Association, FWRC serves as a cornerstone event for our industry.
The conference featured a diverse array of technical sessions, workshops, and exhibitions. Attendees explored topics ranging from potable water treatment and wastewater processes to stormwater and green infrastructure. Notably, sessions on per- and polyfluoroalkyl substances contamination and nutrient removal provided critical insights into emerging challenges and solutions.
Beyond the technical sessions, FWRC offered numerous opportunities for networking and professional development. Events like the president’s Connecting Everyone reception and the lawn party fostered community engagement and collaboration. The Operations Challenge, often dubbed the “Wastewater Olympics,” showcased the skills and dedication of our industry’s frontline workers.
The conference also emphasized the importance of engaging the next generation of water professionals. The Students and Young Professionals program included resumé workshops, design competitions, and networking events, providing invaluable experiences for emerging leaders in our field. Reflecting on this year’s FWRC, it’s clear that the conference continues to be a vital platform for knowledge exchange, innovation, and community-building within Florida’s water sector.
Upcoming FWEA Events: Engaging Our Community
As we continue our journey together, I encourage you to participate in the exciting events FWEA has planned over the next few months.
S June 5, 2025: West Coast Chapter Spring Quarterly Luncheon. Join fellow professionals for an afternoon of
current water environment topics.
S June 20, 2025: Central Florida 4th Annual Inshore Fishing Tournament. A perfect blend of camaraderie and competition, this event supports our scholarship fund while enjoying Florida’s beautiful waterways.
S August 11, 2025: Deadline for Exhibitor Registration of the 18th Annual Southwest Florida Water and Wastewater Exposition. Don’t miss the opportunity to showcase your innovations and connect with industry leaders at this premier exposition.
These events exemplify FWEA’s commitment to fostering professional growth, community engagement, and the exchange of ideas. I look forward to seeing many of you there and collaborating on our shared goals.
Close Things Out
Before I sign off, here’s a fun fact: Did you know that a single mature oak tree can intercept more than 1,000 gallons of stormwater runoff every year? Just like that oak tree, each of us plays a vital role in protecting and sustaining Florida’s water resources—one drop, one decision, one innovation at a time.
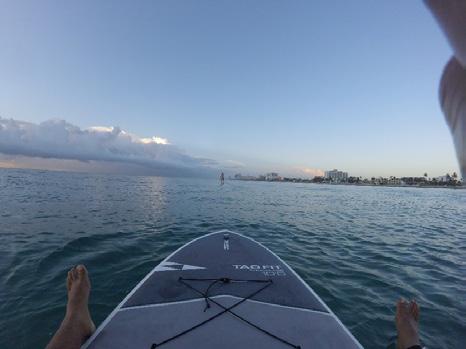
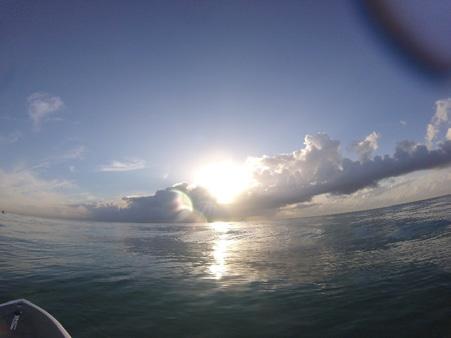
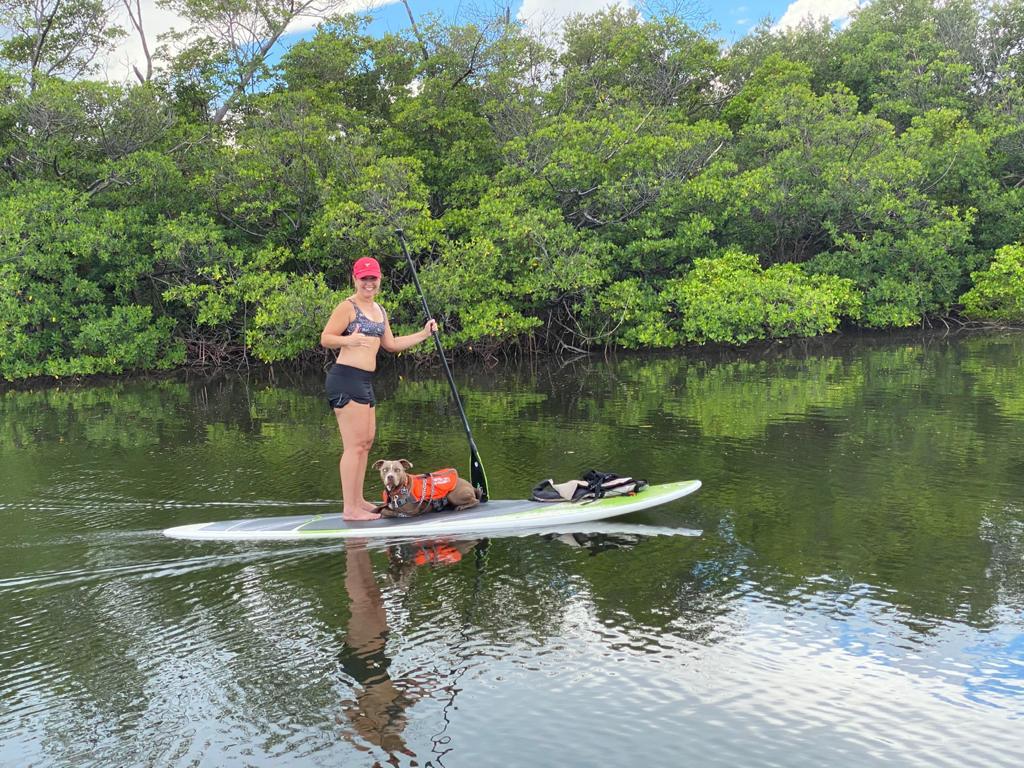
And here’s a little something personal: When I’m not talking about water, I’m probably out near it or on it, whether it’s stand up paddling or just watching a Florida sunset reflect off the surface. Water has always been part of my life, and I’m incredibly honored to help shape its future alongside all of you.
Let’s make this year one to remember— full of progress, partnership, and plenty of reasons to celebrate the incredible work we do. Thanks for being part of the FWEA family! S
Enjoying Florida’s water.
Operators: Take the CEU Challenge!
Members of the Florida Water and Pollution Control Operators Association (FWPCOA) may earn continuing education units through the CEU Challenge! Answer the questions published on this page, based on articles in this month’s issue. Circle the letter of each correct answer. There is only one correct answer to each question! Answer 80 percent of the questions on any article correctly to earn 0.1 CEU for your license. Retests are available.
This month’s editorial theme is Stormwater Management and Emerging Technologies. Look above each set of questions to see if it is for water operators (DW), distribution system operators (DS), or wastewater operators (WW). Mail the completed page (or a photocopy) to: Florida Environmental Professionals Training, P.O. Box 33119, Palm Beach Gardens, Fla. 33420-3119, or scan and email a copy to memfwpcoa@ gmail.com. Enclose $15 for each set of questions you choose to answer (make checks payable to FWPCOA). You MUST be an FWPCOA member before you can submit your answers!
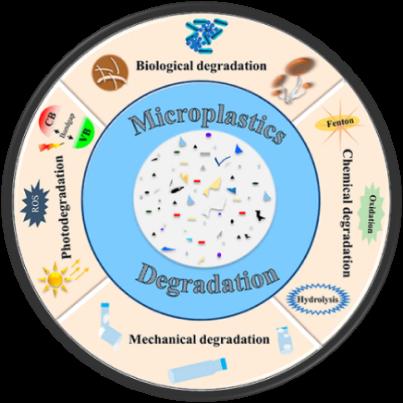
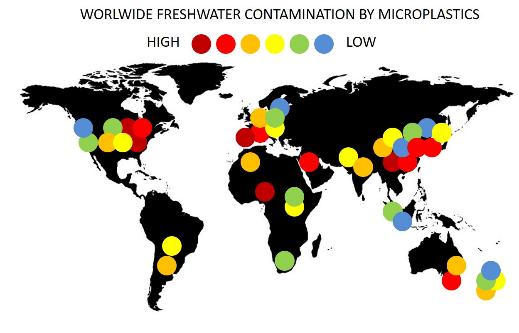
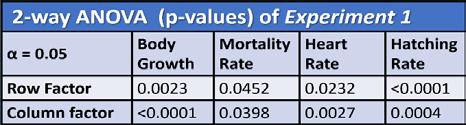
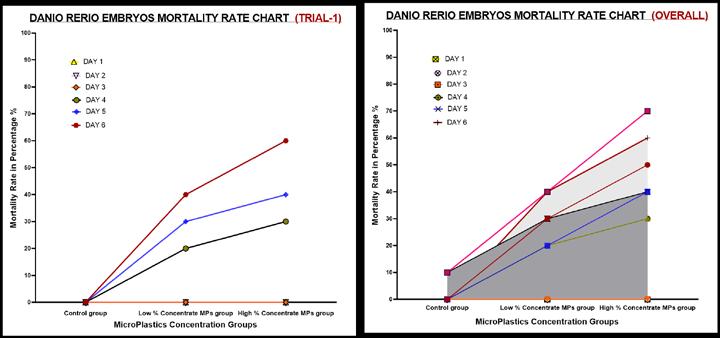
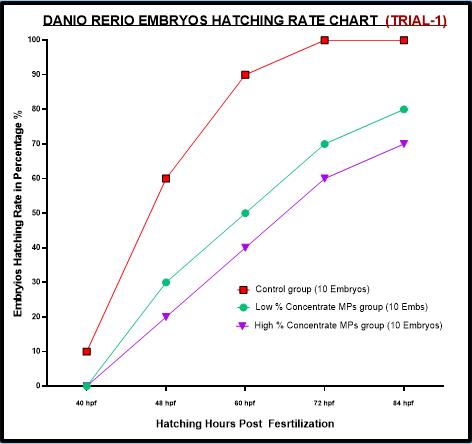
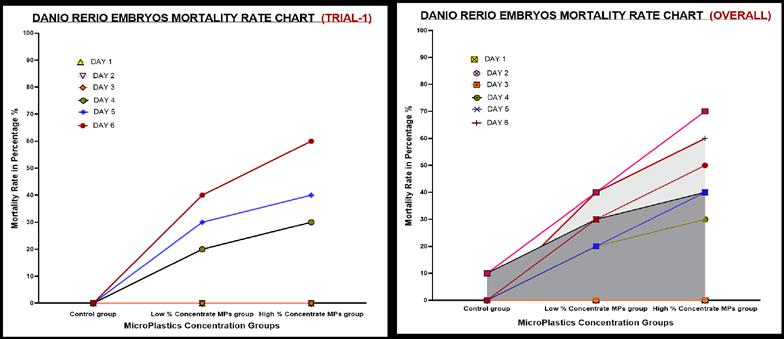
Global Plastic Pollution: Ecotoxicological Effects of Microplastics on Aquatic Organisms
1. What is the main environmental challenge caused by plastic pollution?
a) Rapid biodegradation
b) Persistence and accumulation in ecosystems
c) Immediate elimination by natural processes
d) Lack of chemical additives
2. What is the size range of nanoplastics?
a) Smaller than 1 cm
b) Smaller than 5 mm
c) Smaller than 100 nanometers
d) Smaller than 10 microns
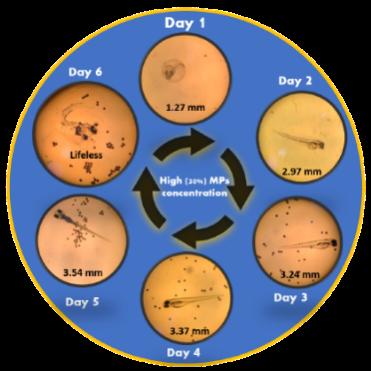
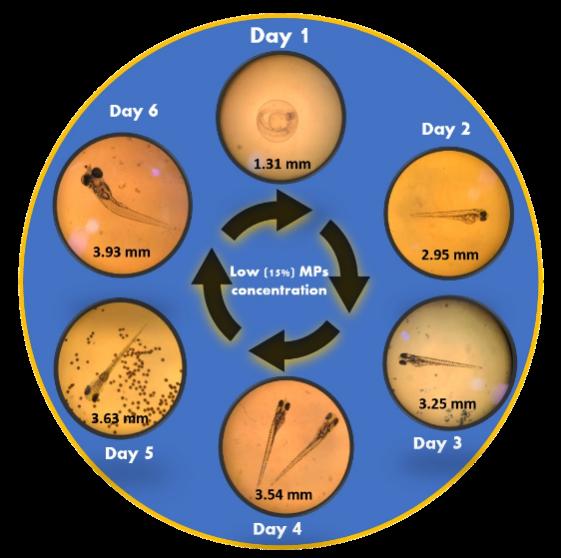
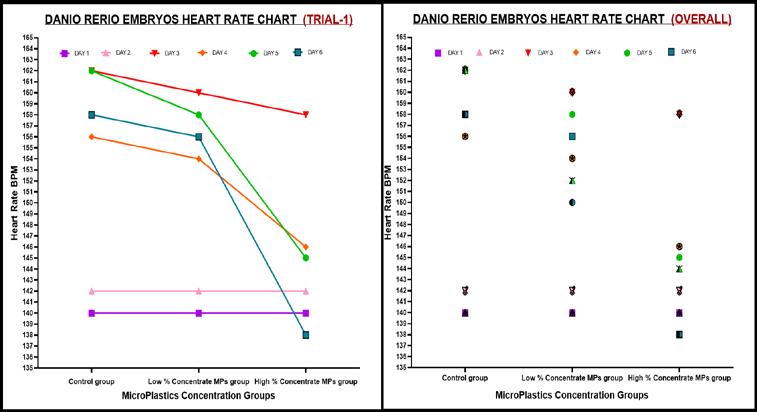
3. What negative effects were observed in zebrafish embryos exposed to microplastics?
a) Increased metabolic activity
b) Spinal curving, reduced heart rate, and pericardial edema
c) Stronger immune system
d) Accelerated growth rate
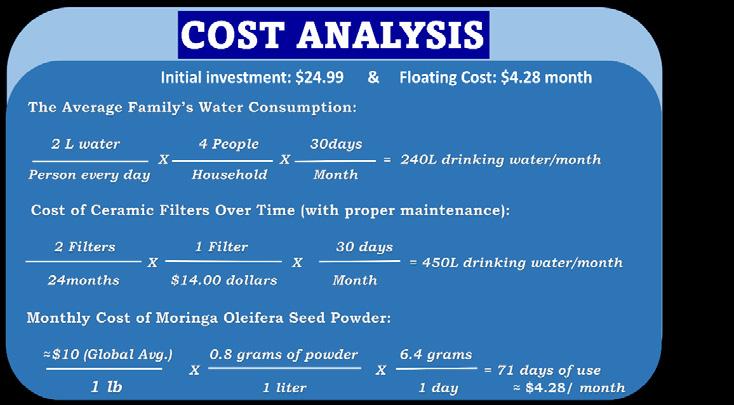
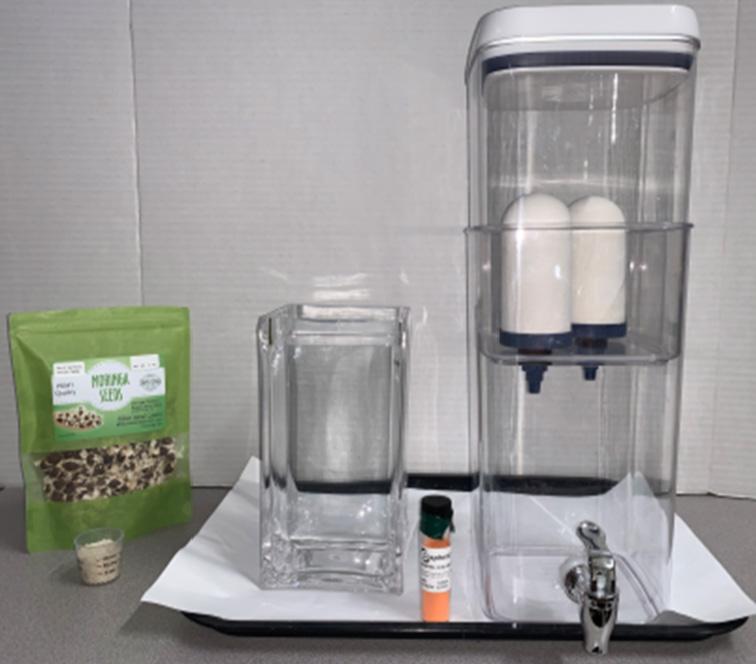
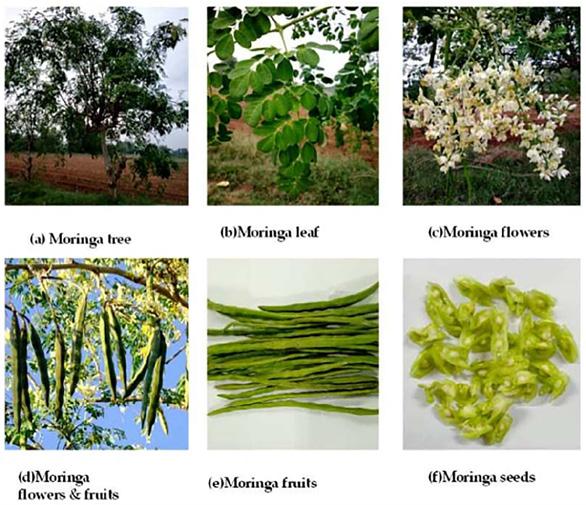
4. How does Moringa oleifera seed powder contribute to water filtration?
a) Dissolves microplastics in water
b) Clumps microplastics together through flocculation
c) Changes the pH significantly
d) Prevents bacteria growth only
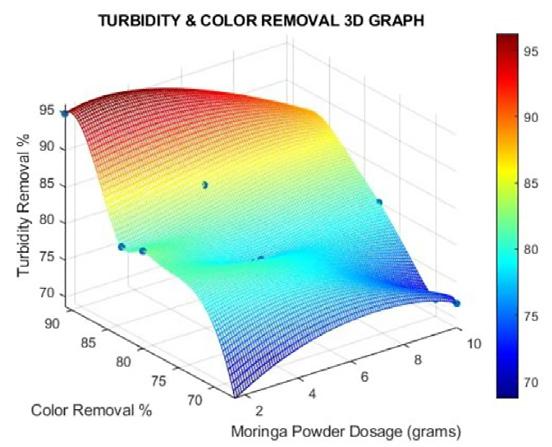
5. What is the estimated purification efficiency of the novel filtration system?
a) 85 percent
b) 99.9 percent
c) 60 percent
d) 75 percent
April 26-29, 2026 | Ocean Center | Daytona Beach
CALL FOR PAPERS
Submissions Dates Announced Soon
Seize the opportunity to share your knowledge and solutions with the water industry.
Join professionals dedicated to improving and sustaining Florida’s water.
Now is the time to start working on your abstracts for consideration as a part of FWRC’s Technical Program.
Visit fwrc.org for technical session updates.
WEBSITE UPDATES
Post-Conference Updates are LIVE!
Have you visited the FWRC website lately?
The 2025 Technical Session PDF Presentations are now available to download!
Visit fwrc.org today and use the quick link on the home page to find a complete listing of all available presentations.
STAY UP-TO-DATE
Connect with us on social today!
fwrc_official
fwrc_official
florida-water-resources-conference
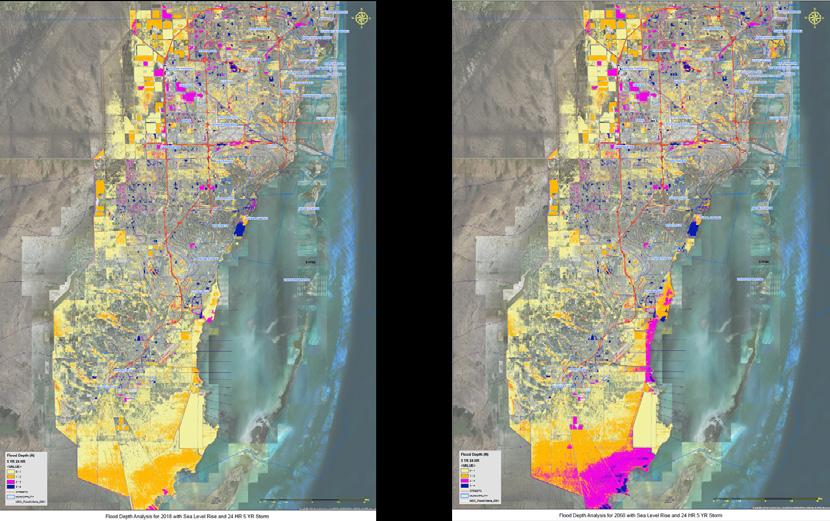
Building Flood-Ready Communities Through Smarter Planning and Technology
Jose Abinazar, Marina Blanco-Pape, Alberto Pisani, and Georgio Tachiev
Ground Zero for Resilience: Why Modeling is a Must
In its commitment to empower stormwater resilience, Miami-Dade County (county) Department of Regulatory and Economic Resources, Division of Environmental Management (RER-DERM) is using geospatial modeling as part of the most recent update of the county’s stormwater master plan. Geospatial modeling tools and techniques were employed to simulate hydrologic events and analyze stormwater system performance under an array of simulated present and future conditions using geographic information systems (GIS), light detection and ranging (LiDAR) data, and Python scripts to aid in the development of mitigation strategies and establish flood protection level of service. Topographic and historical hydrologic data specific to the county were integrated into the hydrologic and hydraulic (H&H) Autodesk XPSWMM, an integrated modeling solution for stormwater and wastewater management supporting urban planning, growth, and flood mitigation efforts, and calibrated against past flood events to analyze and assess the areas susceptible to flooding for design rainfall events, with probabilities ranging between 0.1 to 20 percent.
Data input for the XPSWMM watershed models included current and future H&H conditions, changes in land use, and projected sea level rise (SLR) until 2100. These models underwent an update in 2020 and 2021, covering 780 sq mi of inland and coastal areas, as well as the application of the runoff curve number in TR-55, a set of simplified procedures used for estimating storm runoff volume, peak discharges, and hydrographs in small watersheds primarily in urbanized areas, implemented to enhance infiltration calculations.
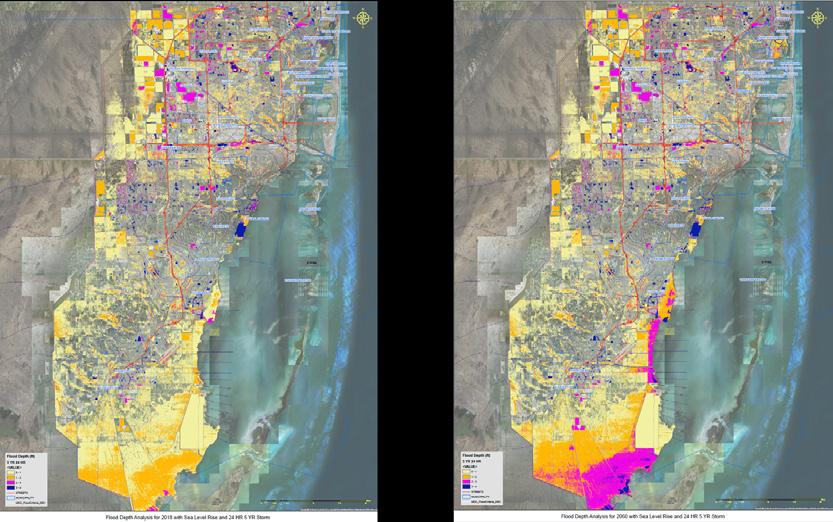
The presented comprehensive approach to manage future flood scenarios in the county encompasses the years 2019, 2040, 2060, 2080, and 2100, with a focus on various return periods (5, 10, 25, 50, 100, 500, and 1000 years) and durations (24 and 72 hours). To facilitate this, flood depth maps with resolution of 5 ft were developed to project potential inundation scenarios and to determine areas with high flood vulnerability within each watershed. These flood hazard maps assist in the decision-making process to provide recommendations for flood mitigation strategies
and required infrastructure improvements to protect high-risk areas that could be affected by future SLR, storm surge, and high-intensity rainfall events. These maps served as a foundational resource for updating the stormwater master plan and were incorporated into the new county flood criteria (CFC) ordinance.
The CFC establishes minimum elevations for developed lots, road elevations, secondary canal bank elevations, and the top of seawalls, which are based on the 10-year/24-hour event under 2060 conditions. The geospatial and flood analysis were also applied to update the water control map (WCM), which is now based on the 25-year/72-hour event under 2060 conditions to ensure the county provides adequate storage and conveyance capacity in its regional drainage system. The spatial analysis was used to aid in the development of alternative mitigation strategies including consideration of backflow preventers, enhancements to secondary canal bank elevations, improvements in the interconnectivity of the stormwater system, and the installation of pump station facilities.
Other applications of geospatial modeling, such as project prioritization, are explored to further improve resilience. This effort also maintained historical continuity by integrating the prior CFC and topography data while significantly raising the minimum CFC elevation from 3.45-ft to 6-ft North American Vertical Datum of 1988 (NAVD88). The enhanced CFC provides a comprehensive and proactive flood risk mitigation tool, ensuring the county’s readiness to address evolving flood challenges and protect its communities. Additionally, the WCM update prioritizes the use of stringent criteria to continuously improve stormwater management based on these modeling findings. This approach seeks to strengthen the county’s resilience to future flood challenges and changing climatic conditions.
The various modeling scenarios present an important tool that supports policy recommendations for state and federal agencies. These updated criteria collectively seek to enhance the robustness of the county’s stormwater management system for extreme rainfall events under future climatic and urban development challenges and allow for streamlined coordination with the South Florida Water Management District (SFWMD) on flood protection enhancements to the primary canal system. Likewise, these
Jose Abinazar, E.I., ENV SP, is a project designer and Georgio Tachiev, P.E., Ph.D., is a consultant with GFT Infrastructure Inc. in Miami. Alberto Pisani, P.E., ENV SP, is a senior professional engineer and Marina BlancoPape, P.E., is division director with Miami Dade County Department of Regulatory and Economic Resources, Division of Environmental Resources Management in Miami.
models are shared with the Federal Emergency Management Agency (FEMA), as the county is a technical cooperating partner, and results are used for updates of the FEMA flood insurance rate maps and flood insurance studies. Areas for future research are suggested based on the results obtained, highlighting the need to continue advancing the application of geospatial models to address hydrological challenges.
Geospatial Modeling Approach: How the Models Were Built
The RER-DERM utilized XPSWMM H&H modeling software (version 2020.1) to create watershed numerical models for the 11 county subwatersheds and integrate various geospatial tools and techniques for a detailed simulation of the stormwater system’s complex hydrological interactions within 780 sq mi of inland and coastal areas. The XPSWMM incorporates onedimensional calculations for simulating the flow from upstream to downstream, capturing the dynamics of stormwater systems and floodplains based on water movement, and enabling a comprehensive assessment of flow patterns, pollutant transport, and the effectiveness of sustainable design practices across a variety of infrastructure and natural environments, including ponds, rivers, lakes, overland floodplains, and aquifers.
The model considers parameters, such as rainfall, infiltration, soils information, land use, runoff, overland flow, watershed storage, canal, and conveyance system flow during storm events, coupled with the influences of tidal and groundwater levels as boundary conditions. Additional advanced technologies applied in the geospatial model and stormwater management program (SWMP) updates include utilization
of GIS, LiDAR data, and Python scripts for postsimulation data processing. A brief description of the various parameters included in the model is as follows:
S Topography data specific to the county were obtained from the digital elevation model (DEM) containing georeferenced digital representation of the ground surface elevations, providing the vertical position above the NAVD 88, with horizontal resolution of 5-ft-sq grid cells. The DEM dataset was provided by the county’s information technology department and is based on classified LiDAR data from 2015 and updated in 2018.
S Hydrologic data from SFWMD, including flood control gate operations, headwater, and tailwater elevations, were retrieved from the SFWMD hydrology database (DBHYDRO) web browser tool, and incorporated into the model boundary conditions, calibration, and validation processes.
S Watershed imperviousness data associated with various land use categories were obtained from several sources, including the county’s planning department and the National Land Cover Database (NLCD), to verify the accuracy of imperviousness data integrated into the model.
S Soil-type data were acquired from the U.S. Department of Agriculture (USDA) Natural Resources Conservation Service (NRCS) soil survey, extracted from databases such as Soil Survey Geographic (SSURGO) and State Soil Geographic (STATSGo), and incorporated in the model to enable precise analysis of hydrogeology and infiltration characteristics across the county. The modeling update employed the curve number methodology outlined in the U.S. Geological Survey publication “Urban Hydrology for Small Watersheds (TR-55)” to compute infiltration from pervious areas.
S The unified SLR projections were based on the 2019 Southeast Florida Regional Climate Change Compact (compact). The tidal elevation scenario used was the observed median sea level for the current National Oceanic and Atmospheric Administration (NOAA) epoch ending in 2001 and adjusted by adding the first harmonic constituent obtained from the Virginia Key NOAA Tidal Station (ID 8723214). Using the increments from the compact projections, the NOAA intermediate high curve was selected as a conservative approach for 2060, 2080, and 2100 SLR estimates.
S Design rainfall events for predicted conditions are based on a combination of current and historical data from NOAA Rainfall Atlas 14 for volumes per storm, and SFWMD 24-hour and 72-hour rainfall distributions.
The topographic, soil, infiltration, and hydrologic data were integrated into the XPSWMM models along with the creation of more than 10,000 links to define the hydraulic and stormwater infrastructure network (canals, streams, ditches, bridges, culverts, pipes, weirs, orifices, pumps, rating curves, gated structures, etc.), to analyze past, current, and future flood events and assess the areas susceptible to flooding for design rainfall events with 0.1, 0.2, 1, 2, 4, 10, and 20 percent occurrence probability (5-, 10-, 25-, 50-, 100-, 500-, and 1000-year return period). The results of these simulations represent baseline conditions essential for the projected flood events with varying recurrence intervals.
For future hydrologic conditions, land use projections were extended to 2030 and groundwater levels were projected to 2040. To account for potential climate change impacts, simulations included the existing (2020) conditions and projected SLR were summarized:
S Year 2040. With outfall boundary conditions relevant to projected SLR in 2040 (tidal conditions for 2020 +0.5 ft of SLR), future land use (2030), and projected future groundwater (2040).
S Year 2060. With outfall boundary conditions relevant to projected SLR in 2060 (tidal conditions for 2020 +2 ft of SLR), future land use (2030), and projected future groundwater (2040).
S Year 2080. With outfall boundary conditions relevant to projected SLR in 2080 (tidal conditions for 2020 +4 ft of SLR), future land use (2030), and projected future groundwater (2040).
S Year 2100. With outfall boundary conditions relevant to projected SLR in 2100 (tidal conditions for 2020 +6 ft of SLR), future land use (2030), and projected future groundwater (2040).
The outfall conditions into Biscayne Bay were developed using historical water elevations and NOAA’s intermediate high SLR projection. For each of the five scenarios (2020, 2040, 2060, 2080, 2100), 10 simulations were executed to develop flood maps for 24-hour storms with recurrence intervals of 5, 10, and 25 years and for 72-hour storms with recurrence intervals of 5, 10, 25, 50, 100, 500, and 1000 years. Flood geospatial mapping was utilized to visualize computed flood depths and surface water elevations for each simulated event in all 11 watersheds. The flood depth was calculated employing a comprehensive XPSWMM 1D hydrodynamic model. This model encompasses the interplay among all the mentioned and analyzed rainfall patterns, soil properties, terrain features, subwatershed geometry, and canal network layout. The maximum stages identified
within each subwatershed were then employed to generate flood maps using spatial interpolation with a resolution of 5 ft.
Key Objectives, Findings, and Regulatory Updates
The primary objectives of the geospatial and H&H XPSWMM modeling are to complete a comprehensive reassessment of the county’s existing stormwater infrastructure and to pave the way for the development of resilient stormwater management strategies capable of addressing future variable pluvial and climatic conditions. These objectives include fortifying critical infrastructure against inundation, conducting comprehensive evaluations of the current system’s performance and capacities, enhancing water quality parameters, and facilitating aquifer recharge initiatives to safeguard and bolster water resources. Additionally, the resulting SWMP aims to optimize operational efficiencies and maintenance protocols while offering directives for potential infrastructure enhancements. The results obtained from the simulation of certain design events and the resulting flood mapping were utilized to update the CFC and WCM as outlined.
Miami-Dade County’s Flood Criteria Updates
The objective of the county’s CFC map is to establish the minimum ground surface elevation requirements for properties. The CFC dictates the minimum finished grade elevation for developed sites, finished secondary canal banks, road elevations, and top of seawalls, with exceptions allowed only for areas subject to higher localized standards. The latest update to the CFC incorporates the highest elevation among the following:
S The prior CFC elevations
S Surface water levels derived from the 10-year/24-hour event in the 2060 future model with SLR
S Groundwater levels corresponding to the 10-year/24-hour event obtained from 30 years of daily groundwater stage observations (19902018)
S Existing topography
Geospatial and flood analysis were applied to update the CFC, which is now based on the 10-year/24-hour event under projected 2060 conditions. Updates to the CFC include:
S Increase in average CFC elevation requirements across all watersheds, measuring precisely 2.55 ft, which accounts for observed SLR between 1983 and 2020, totaling 0.5 ft, and projected SLR from 2020 to 2060, estimated at 2 ft.
S Establishment of a minimum top-of-seawall Continued on page 24
elevation of 6 ft NAVD88 for all coastal areas, with a similar minimum elevation requirement for all lots, unless otherwise specified.
Contractors, engineers, developers, and stakeholders are encouraged to utilize the higherresolution digital files. The county’s CFC map is available for public use through its open data hub at www.gis-mdc.opendata.arcgis.com/ datasets/500625d5715f4279895b85ef570f7de2/ explore. The CFC map can also be found at www. miamidade.gov/environment/library/maps/2021flood-criteria-map.pdf.
Miami-Dade County Water Control Map Updates
The WCM is a representation of existing and planned stormwater infrastructure in the county and is used to estimating adequate storage and conveyance capacity in the regional drainage system. Updates to the WCM include:
S Higher regulatory standards for the level of service to be provided in conveyance and storage systems based on surface water levels from the modeled 25-year/72-hour storm event under 2060 conditions.
S Higher regulatory applicable standards within cut and fill basins for comprehensive flood control measures.
S Updated canal bank elevation criteria aligning with the new CFC based on the 10-year/24hour design event under 2060 conditions, considering existing topography and minimum elevation requirements specified by the county’s public works manual.
These measures collectively reinforce the resilience of the county’s stormwater management system against future climatic and urban development challenges.
The county’s CFC map is available for public use through its open data hub at www.miamidade.gov/environment/library/ maps/2021-water-control-map.pdf.
Flood risk mitigation strategies include:
S Backflow preventers, which prevent reverse flow and protect against tidal flooding.
S Enhancements of secondary canal bank elevations, which are critical in order to provide the desired flood protection level of service.
S Improvements in the interconnectivity of the stormwater system, designed to improve overall system performance.
S Installation of pump station facilities that serve to augment drainage capabilities, particularly in low-elevation areas prone to flooding with limited gravity drainage capacity.
Collectively, these strategies offer comprehensive flood protection measures and enhance the county’s resilience against present and future adverse conditions.
Conclusion
The utilization of geospatial modeling within the recently updated SWMP demonstrates a proactive and comprehensive approach to enhance stormwater resilience by:
S Assessing the necessary updates to regulatory
standards and capital improvements for new development.
S Redevelopment and infrastructure aligning with projected SLR.
S Future hydrological conditions.
S Reinforcing the county’s readiness to address evolving flood risks.
The integration of GIS data, LiDAR data, and advanced modeling techniques has facilitated the identification of highrisk flood areas, the development of flood hazard maps, and the formulation of effective mitigation strategies. The insights gained from this modeling analysis provide a foundation for future policy recommendations and stormwater infrastructure and resiliency improvements. Furthermore, the availability of flood inundation maps offers a great tool for regular maintenance, operations, and storm preparedness.
The consideration of future scenarios underscores the county’s plan to safeguard its communities from flood risks through continued innovation and strategic planning and it remains well-prepared to mitigate future flood events and enhance its resilience in the face of changing environmental conditions.
References
1. Abinazar, J., Blanco-Pape, M., Pisani, A., & Tachiev, G. (2024). “Using Geospatial Modeling to Empower Stormwater Resilience and Flood Mitigation” (unpublished technical paper; presented during Florida Water Resources Conference, April 2024).
2. Miami-Dade Department of Regulatory and Economic Resources, Division of Environmental Resources Management, Water Management Division. “Stormwater Management Program Master Plan” (2021).
Miami-Dade County Department of Regulatory and Economic Resources, Division of Environmental Resources Management (RERDERM). “Building Resilience: Proposed New Regulatory Standards for Managing Stormwater Risks” (2021).
Miami-Dade County Department of Regulatory and Economic Resources. “Water Control and Flood Criteria” (n.d.) Retrieved from: https:// www.miamidade.gov/environment/watercontrol-and-flood-criteria.asp.
XPSWMM Help Documentation. Retrieved from: https://help.innovyze.com/space/ xps/19660802XPSWMM+and+XPStorm+Help+Documentation.
United States Soil Conservation Service.
“Urban Hydrology for Small Watersheds TR55” (1975). S
From Highlands to the Panhandle: Celebrating the People Powering Regions VII, VIII, IX, and XII
ALisa Wilson-Davis Chair, FSAWWA
s part of a yearlong series spotlighting the incredible work being done across the Florida Section, I’m excited to continue recognizing the unique strengths, events, and—most importantly— the dedicated volunteers that make each FSAWWA region thrive. These features aim to celebrate the people behind the programs and highlight the local character that shapes our statewide impact. In this edition, we focus on
Regions VII, VIII, IX, and XII—four regions that, while geographically distinct, share a common spirit of collaboration, innovation, and service to their communities.
Region VII: Professional Excellence Meets Community Impact
Representing Miami-Dade and Monroe counties, Region VII is a shining example of what’s possible when technical excellence meets grassroots engagement. Known for its strong commitment to professional development, student outreach, and inclusive networking, Region VII continues to raise the bar through a wide array of thoughtfully executed events and initiatives.
Behind every successful region and
event is a team of committed leaders. Region VII is proud to recognize:
S Catalina Lopez-Velandia, P.E. – chair
S Raul Alfaro, P.E. – upcoming chair
S Rhyannan Campos – secretary
S Guillermo Rivera – treasurer
S Jose Abinazar – chair, Young Professionals Committee
Plus, an incredible group of active committee chairs, including Diego Barrios, Jonathan Moreno, Eric Corey, Jorge Camacho, Melissa Velez, Jennifer Messemer-Skold, Beth Waters, Lazaro Cabrera, and Samuel Carballo. Region VII delivers a dynamic lineup each year, connecting professionals, empowering students, and giving back to the global water community.
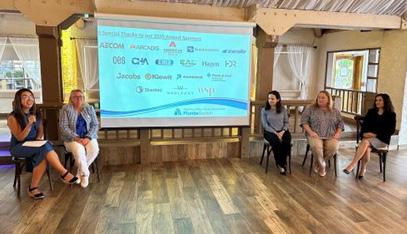
A Lunch & Learn seminar promotes utility and maritime infrastructure leadership in celebration of Women’s History Month.
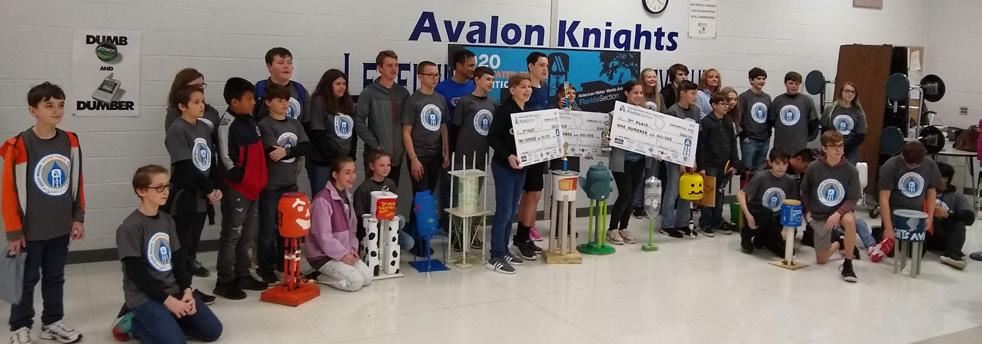
Model Water Tower Competition held on March 15.
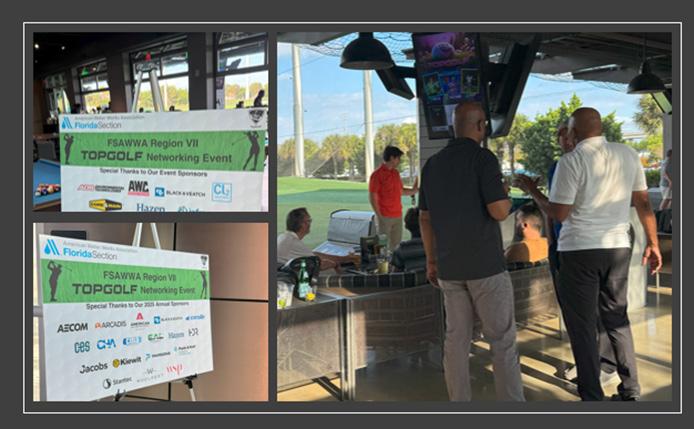
Region VII Topgolf event.
S Topgolf Networking Event – A packed house for a great cause. The proceeds supported Water For People.
S Women in Leadership Lunch & Learn –Featured a powerhouse panel of utility and maritime leaders.
S Model Water Tower Competition –Showcased the next generation of water innovators.
S Baynanza Cleanup – Reinforced the region’s environmental stewardship values.
S Young Professionals Networking Events and Wine Tasting Fundraiser – Built professional connections while raising funds.
S Key West Lunch & Learn – Brought technical education to Monroe County in a relaxed setting.
Region VII stands out for its ability to maintain high levels of engagement across two counties year-round. From student outreach to technical enrichment to supporting global causes, Region VII blends excellence with impact.
By the numbers:
S $5,000 raised for Water For People
S 107 attendees at the wine tasting
S 19 active sponsors
S 25 volunteers at the Baynanza cleanup
and future leaders and encouraging youth innovation in water engineering.
Region VIII: A Diverse Region With Rich History and Coastal Charm
Stretching from the rural interior to the sparkling coastlines of the Treasure Coast, Region VIII is a testament to Florida’s geographic and cultural diversity. This region continues to find new ways to engage local communities while honoring its unique history.
Region VIII thrives thanks to a committed team:
S Pierre Vignier, City of Port St. Lucie (past chair)
S Brittany Bassett, Martin County Utilities
S Jenny Tomes, City of Port St. Lucie
S Brendon Blum, Kimley-Horn
S Peter Kunen, City of Stuart
S Cameron Kenyon, Crom Corporation
S Brad Hasseler, SSA Florida
S Chelsea Lodato, FTC
Notable events and activities of this region include:
S Region VIII launched its Model Water Tower Competition in 2023, engaging youth
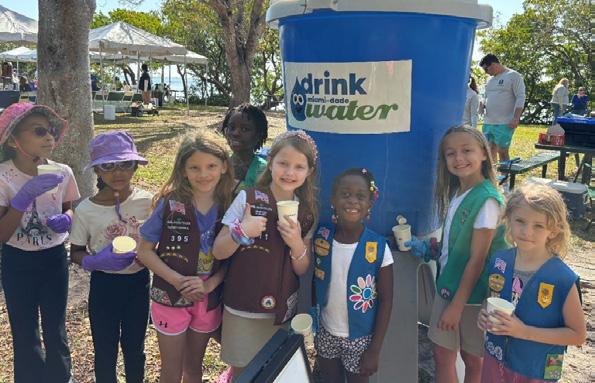
S Hosted an annual Best Tasting Drinking Water contest. The 2025 winner was Martin County Utilities, with Seminole Tribe of Florida Brighton as runner-up.
S Recently held its first annual St. Lucie Mets Social at Clover Park in Port St. Lucie.
S Planned for Spring 2026 – A joint sporting clays event with FWEA Treasure Coast Chapter.
With deep historical roots and a broad service area, Region VIII balances tradition and innovation. It sits at the confluence of south and central Florida and includes both agricultural and coastal areas—allowing for diverse experiences and outreach. Region VIII is home to the following historical highlights:
S Gilbert’s Bar House of Refuge—a beacon for shipwrecked sailors since 1874.
S Pelican Island National Wildlife Refuge— the nation’s first, thanks to local advocacy and President Theodore Roosevelt in 1903.
When visiting Region VIII, these historic treasures are must-sees!
Continued on page 28
S 19 student tower teams
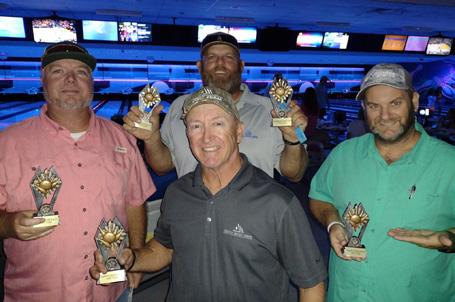
Region IX and XII Annual Bowling Event winners.
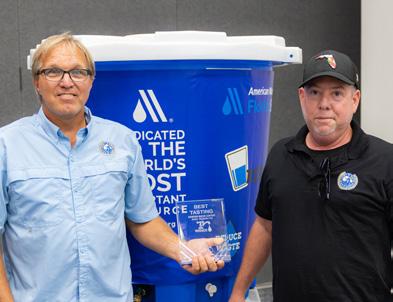
David Voisinet (left) and Derek Watson pose as Martin County Utilities takes home first place in the 2025 Region VIII Best Tasting Drinking Water Contest.
Baynanza cleanup on April 12.
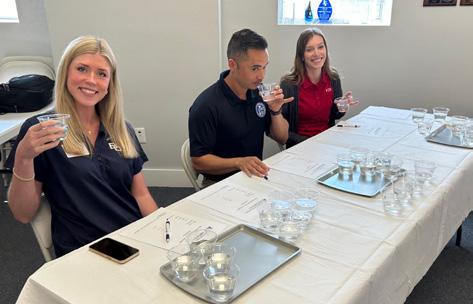
Region IX and XII Best Tasting Drinking Water Contest judges.
Continued from page 27
Regions IX and XII: Northwest Florida’s Tight-Knit Water Community
Regions IX and XII, representing northwest Florida, are known for their strong sense of camaraderie and a collaborative spirit that brings together professionals across a broad geographic area. This dynamic group of two regions thrives on shared events and joint efforts and fosters a sense of community that’s both welcoming and professionally enriching.
Volunteers leading the way include:
S Heath Hardy (HDR Engineering), Region IX chair
S Jeff Brittain (Kimely-Horn), Region XII chair
S Tyler Puckett (HDR Engineering), vice chair
S Monica Wallis (Destin Water Users), past chair and committee member, Water Utility Council chair, and FSAWWA secretary
S Daniel Corliss (Emerald Coast Utilities Authority), secretary/treasurer
S Sean Lathrop, Region XII past chair and volunteer extraordinaire
The strength of Regions IX and XII lies in their consistency and camaraderie and include the following key events:
S Annual Region IX/XII Bowling Event
S Annual Region IX/XII Golf Tournament
S Best Tasting Drinking Water Competition (Region IX/XII)
S Region IX Annual Model Water Tower Competition
These events do more than bring people together—they cultivate lasting relationships, encourage mentorship, and reinforce professional growth. The collaboration across IX and XII reflects a deep-rooted culture of unity, consistency, and care.
A Toast to Our Volunteers
As we celebrate the incredible contributions of Regions VII, VIII, IX, and XII, we are reminded that the Florida Section’s strength lies in its people. The volunteers who give their time, talent, and energy are the heart of our success. Whether it’s leading events, mentoring students, engaging with communities, or supporting global causes, these individuals exemplify the best of who we are. Their commitment doesn’t just sustain our section— it elevates it.
In addition, we look ahead with pride and anticipation to the Florida Section’s upcoming 100-year anniversary. The efforts of your volunteers, whether planning events, mentoring students, or strengthening professional ties, ripple far beyond their communities throughout our section and they exemplify the best of who we are. The dedication of our volunteers today is a continuation of a legacy built over the past century—one rooted in service, innovation, and unity.
To all our volunteers—those who paved the way, those leading today, and those yet to come—a heartfelt thank you. Your leadership, dedication, and passion are the driving forces behind our progress. With every event, every collaboration, and every new volunteer who joins our mission, you strengthen the foundation for the next 100 years.
We’re honoring our past and we’re shaping the future of Florida’s water—together. S
Region IX Model Water Tower Competition at Bennet Russell Middle School.
From left to right, Karl Craig, Marjorie Craig, Brittany Basset, and Mark Rowen enjoying a cool spring evening at the St. Lucie Mets game.
Water tasting judges Gabe Atkinson (left), general manager of Sailfish Brewer, and Elisabet Flores, Spanish teacher at St. Lucie West Centennial High School, carefully assess the clarity of the samples.
LET’S TALK SAFETY
This column addresses safety issues of interest to water and wastewater personnel, and will appear monthly in the magazine. The Journal is also interested in receiving any articles on the subject of safety that it can share with readers in the “Spotlight on Safety” column.
If You Can’t Take the Heat: Heat Exhaustion and Hypothermia
Fresh air and sunshine can be benefits of working outdoors, except when it gets uncomfortably hot. Extremely warm temperatures are much more than a matter of discomfort; they can also cause health hazards—sometimes with deadly consequences.
It’s important that you and your coworkers know how to recognize the symptoms of hypothermia and heat-related illnesses, and how to respond to the effects.
Hypothermia
Hypothermia is a life-threatening condition that occurs when the body core loses heat faster than it can be generated. Obviously, hypothermia can occur in the winter, when the weather is cold, but it can happen during any season; for example, in the summer, when someone is immersed in water that’s colder than body temperature for
an extended period of time, or working in a cold meter pit underground for many hours. The early symptoms include uncontrollable shivering, impaired or slurred speech, and awkward or clumsy body movements. As the body temperature continues to drop, nausea, apathy, confusion, and lethargy can also occur. Often a severely affected victim will lie down, fall asleep, or lose consciousness. The final stages can result in coma and death.
If you identify any of the above symptoms in yourself or someone you are working with, take the following steps immediately:
S Get the victim to a warm location that is sheltered from the wind.
S Remove all wet clothing and anything that might restrict circulation. Cover the victim’s body and head with warm, dry clothing or blankets. Rewarming should be started by applying warm compresses to the chest, neck, and groin. If necessary, bodyto-body contact can be used as a first-aid
measure. This passive rewarming approach may be all that is required for a conscious person who is shivering. Hot water and direct heat should never be applied!
If the victim does not respond and the symptoms become progressively worse, do the following:
S Call 911 immediately in accordance with local emergency plans.
S Monitor the victim’s breathing and start cardiopulmonary resuscitation (CPR) if the breathing seems dangerously slow or stops.
S Keep the victim still until medical help arrives.
Heat-Related Illnesses
When your body heats up faster than it can cool itself, mild to severe illnesses may develop. Air temperature, humidity, and clothing can increase the risk of developing heat illnesses. Age, gender, weight, physical fitness, nutrition, alcohol or drug use, or pre-existing diseases, like diabetes, can also increase the risk.
Heat-related illnesses include:
S Heat rash (prickly heat). The sweat ducts to the skin become blocked or swell, causing discomfort and itching.
S Heat cramps. Muscles cramp up after exercise because sweating causes the body to lose water, salt, and minerals (electrolytes).
S Heat edema. Legs and hands swell after sitting or standing for a long time in a hot environment.
S Heat tetany (hyperventilation and heat stress). Usually caused by short periods of stress in a hot environment.
S Heat syncope (fainting). A person
suddenly loses consciousness because of low blood pressure from the heat, which causes the blood vessels to dilate and gravity moves body fluids into the legs.
S Heat exhaustion (heat prostration). Caused by working or exercising in hot weather and not drinking enough liquids to replace those that are lost.
S Heatstroke (sunstroke). The body fails to regulate its own temperature and it continues to rise, often to 105°F or higher. Heatstroke is a medical emergency. Even with immediate treatment, it can be life-threatening or cause serious long-term problems.
Knowing how to recognize the early symptoms of heat illnesses and knowing how to prevent, control, and respond to the effects can help make everyone’s job safer.
Preventing or Controlling Heat Illnesses
There are several things you can do to avoid illnesses caused by heat exposure:
S Drink about a cup of cool water every 15 to 20 minutes. Avoid caffeine, sugary drinks, and alcohol. Use sports drinks in moderation.
S Limit exposure time to the heat; schedule hot jobs for cooler times of the day. Take frequent rest breaks in cool areas.
S Gradually adapt yourself to the heat. It can take up to 10 days for your body to adapt to high heat.
S Slow your pace and try to mechanize heavy jobs.
S Wear loose, lightweight clothing and a hat, and protect exposed skin.
S Do not use salt tablets.
If skin rash, stomach cramps, fatigue, or dizziness occur, the victim needs to immediately seek rest in a cool shady place, drink lots of water, and repeatedly wet and dry the skin.
First Aid to Follow
If the symptoms increase to excessive sweating; cold, moist, pale, or flushed skin; thirst; extreme fatigue; or headache, nausea, or a rapid pulse, the victim may be experiencing heat exhaustion. The victim should immediately lie down in a cool, shaded place and sip lots of cool water until the symptoms disappear. If the symptoms worsen or the victim becomes unconscious, immediately get medical help according to your utility’s emergency procedures.
Severe heat illness can lead to a heatstroke, which can be fatal or lead to permanent brain damage if the victim does not receive immediate medical treatment. Unfortunately, there’s little warning when a victim reaches this crisis stage.
If a victim’s skin becomes hot, dry, red, or spotted, and the victim experiences confusion, delirium, convulsions, or slips into unconsciousness, the person is likely experiencing a heatstroke and urgently needs medical help. While waiting for that help to arrive, loosen the victim’s clothing and pour water over the entire body. Never try to force an unconscious victim to drink water.
Resources
For more information go to the webMD website on heat-related illnesses at www. webmd.com/first-aid/tc/heat-relatedillnesses-topic-overview, or the national public service site at www.ready.gov/winterweather or www.ready.gov/heat. S
Now Available: AWWA State of the Water Industry Report
Capital improvement funding rises to top priority
The American Water Works Association (AWWA) annual State of the Water Industry report provides valuable insights into the challenges and priorities facing the water sector, which has chosen financing capital improvements as its number one challenge in 2025, overtaking last year’s source water protection.
Utilities of all sizes are struggling to secure funding for essential upgrades and new technologies, with only 41 percent feeling very or fully able to cover costs through rates and fees. Investments in new treatment technologies and green solutions are expected to double in the next one to three years, indicating a growing focus on long-term sustainability.
This year’s report, based on a survey conducted in the fall of 2024, just before the presidential election in the United States, highlights key trends and emerging concerns. The report covers many hot topics, such as infrastructure renewal, financial matters, source
water protection, water quality concerns, hazards and emergency events, workforce issues, and more.
Discover how this year’s report offers a fresh perspective on the water industry’s most pressing challenges. With its comprehensive analysis of current trends and future projections, the report is an essential tool for water community professionals seeking to stay ahead of the curve.
As stewards of public health and the environment, water professionals understand the importance of protecting water supplies, securing physical and cyber systems, and planning for routine and extreme events. By incorporating resilience into a risk management framework, utilities can improve their response and recovery strategies, thereby mitigating the potential for loss of service.
To download the 2025 State of the Water Industry report or request a copy go to www. awwa.org. S
Global Plastic Pollution: Ecotoxicological Effects of Microplastics on Aquatic Organisms
Microplastics Extraction and a Novel Low-Cost Water Filtration Method
This article was a Florida State Science Fair first-place winner in 2022, a Top 300 National Broadcom MASTERS finalist in 2022, a 2023 Stockholm Junior Water Prize national finalist, and part of a larger project that the author presented at the United Nations General Assembly, Water Environment Federation Technical Exhibition and Conference, and International Science Fair 2024.
Persistent Global Plastic Pollution
Global plastic pollution is a persistent environmental challenge, exerting significant and extensive impacts on ecosystems worldwide. The various polymer substances in plastics persevere due to their nonbiodegradable nature, which leads to their accumulation in the environment. Plastic pollution leads to emissions that negatively impact the planet, the world's water aquatic organisms, and human health.
Plastics are mainly depolymerized in ecosystems through diverse processes of degradation (thermal, biological, photooxidative, ozone-induced, and mechanochemical), as shown in Figure 1, that fragment the material's carbonaceous chains, which can be either identical or different (polymer or copolymer) in nature, producing compounds with a size smaller than 5 millimeters (mm), referred to as microplastics (MPs), and smaller than 100 nanometers (nm), referred to as nanoplastics (NPs). The
Abhith Kasala
NPs are endocrine disruptors, carcinogens, and obesogens, and transform into vectors containing toxic chemical additives that bioaccumulate in organisms and biomagnify up the food chain, reaching human ingestion in a "trophic transfer." The transfer of these ubiquitous contaminants from terrestrial to aquatic ecosystems is an unending cycle that requires a two-pronged solution.
The first step to solving any problem is to identify its causes and effects. This helps to understand the problem and develop a solution that addresses both the root cause and the resulting consequences. The project's first stage involves conducting a thorough novel investigation of the problem to comprehend the effects of MPs on aquatic organisms and the underlying causes. The literature and empirical studies were evaluated based on the physical, chemical, and biological effects of MPs and their sources and pathways. The rationale is to investigate the negative effects of MPs on Danio rerio (Zebrafish) embryos to elucidate the effects by using gene-expression assays and quantifying their daily uptake, morphology, and viability. The chemical leaching of plastic additives, like Bisphenol-A, leads to toxicological effects, such as impaired growth, inflammation, reduced heart rate, and edema. The epithelium and intestinal tract have the highest chance of encountering and being affected by MPs. Inducing the MPs caused morphological changes, inflammation, oxidative stress, decreased heart rate, and
Abhith Kasala is a junior at Gainesville High School in the Cambridge Program, a dual enrollment student at the University of Florida (UF), and a scientific researcher in three UF labs.
impaired locomotion, eventually resulting in visible deformities like spinal curving, pericardial edema, and yolk sac edema in the embryos. Acute negative effects are indicated by a strong correlation between increasing MPs concentration and decreased embryo viability. The project's second stage is an experiment that aims to devise an effective engineered solution and construct a prototype for MPs extraction. The experiment fills the knowledge gaps in previous research about MPs filtration. The focus of this research is to investigate the use of natural coagulants, such as Moringa seed powder, as an environmentally friendly alternative to chemical coagulants for community water treatment plants. A scalable two-stage water filtration system utilizes the seed powder as a low-cost and easily accessible organic coagulant for MPs extraction and contaminant removal. The efficacy was evaluated by means of turbidity removal, color removal, and flocculation rate. It holds promise for revolutionizing water treatment in developing countries and other regions with limited access to clean water, providing a safe and sustainable solution to the global water MPs pollution crisis.
Figure 1. Processes of microplastics degradation in the environment.
Figure 2. Worldwide freshwater contamination by microplastics.
Problem Statement
The rationale is to find the effects of MPs on Danio rerio embryos. These embryos have become increasingly popular as a “new lab rat,” especially in the last 10 years, and accessible as test subjects for toxicity testing due to their rapid growth in the initial stages and transparent body for easy visualization. This makes them ideal for measuring and quantifying the effects of various toxins. The most used polyethylene plastic microspheres were chosen to induce with a range of 50 to 100 micrometers (µm). Orange microspheres were selected for easy visualization in the embryos. Assays, such as spinal curvature and changes in heartbeat, are highly quantifiable methods for measuring the effects of induced MPs. Exposure to MPs in the environment (Figure 2) leads to toxic effects on the human body's cells, especially gastric epithelial, kidney epithelial, and spleen. The progression is measured by changes in MPs uptake, morphology, proliferation rate, and viability, and is quantified in cellular assays. The kidneys and small intestine are major filtering organs and have the highest chance of encountering and being affected by MPs.
Sources and Types of Microplastics
Plastics are widely used around the world due to their ease of manufacturing and low cost. The production of plastics has been exponentially increasing every year. The most used plastics include polyethylene, polystyrene, nylon, polypropylene, etc. (Figure 3). Primary, MPs are tiny particles designed for commercial use, such as cosmetics, as well as microfibers shed from clothing and other textiles, such as fishing nets. Secondary MPs are particles that result from the breakdown of larger plastic items, such as water bottles.
Microplastics Characteristics and Influence on Aquatic Life
Pollution from MPs has created numerous hazards to marine life and has already
aroused widespread concern as they never truly decompose—they only become smaller in size, which is extremely problematic. A research study by You Li et al. states, “Plastics are chemically stable and can exist in the environment for hundreds of years or longer. Due to the low price and wide applicability of plastics, the global plastics industry has developed rapidly since the 1950s, with the production of global plastics growing by 4 percent every year. About 10 percent of the waste plastics finally discharge into the ocean through various channels, accounting for about 60 to 80 percent of marine waste, and they are even as high as 90 to 95 percent in some areas.”
Yearly, just 16 percent of plastics are recycled; the rest goes to landfill for incineration or is just dumped, and the plastic that doesn’t make it to the recycling plant often ends up in rivers and ocean. Approximately 8 mil tons of plastics are introduced into the ocean each year. The MPs found in the ocean are derived from a range of plastic particles, including daily necessities and plastic raw materials used in
industries. Marine MPs can have toxic effects on aquatic life, including reducing food intake and delaying growth, causing oxidative stress and abnormal behavior. Nanosized MPs can penetrate biological barriers and accumulate, affecting lipid metabolism and potentially impacting life at the molecular level.
Problem Investigation
Microplastics Embryotoxicity Testing Performed
Ten Danio rerio embryos were placed in each of three glass Petri dishes using a pipette, and a total of six Petri dishes were filled for two trials. Two embryo medium solutions were formulated with microsphere concentrations of 0.75 mL/5 mL egg water (15 percent) and 1.5 mL/5 mL egg water (30 percent). The concentrations were selected considering the volume of the Petri dishes and the number of embryos. The ratio of MPs concentration was estimated to mimic the real-world water polluted environments.
Continued on page 42
Figure 3. Chemical structure of polyethylene terephthalate.
Figure 4. Embryo’s growth cycle comparison.
Figure 5. Embryo’s growth by day comparison.
The contents were vortexed in a 10-mL vial to create a thoroughly mixed solution and transferred into the Petri dishes. In every trial, one dish received and was exposed to the highconcentration solution, another dish received and was exposed to the low-concentration solution, and a third dish received egg water only and served as a control.
Danio rerio embryos were grown and exposed to the polyethylene microspheres for six days postfertilization (162 hours).
Throughout the experiment, the Petri dishes were kept in an incubator at a constant temperature of 28.5° C. The embryos were fed 1
mg of Artemac powder daily, following supplier instructions.
To establish a baseline for chemical leaching, the initial pH of the Petri dishes was measured. Also, the heart rate of individual embryos was recorded to assess metabolic activity. The embryos were imaged under a light microscope at 12-hour intervals. Additionally, a novel low-cost confocal microscopy method was utilized to study the embryos' organs and tissues.
To determine plastic leachate concentration, the second pH measurement was compared with the baseline measurement. The images were analyzed for growth, edema, inflammation, and vertebral deformities,
organizing the data into tables based on the experimental group, days of postfertilization, and MPs concentration.
In the third trial, the same procedure was repeated, and all measurements were averaged to ensure statistical accuracy.
Results
The project’s results show that at the age of four days postfertilization the Danio rerio embryos intake the MPs (polyethylene 1.015g/ cc) at density <120 µm and at concentration levels of 1.5 ml MPs/ 5 mL, shown in Figures 4 and 5. These specific embryos that ingested the MPs exhibited behavioral abnormalities and decreased locomotion, resulting in their increased mortality rate. This shows the leaching of plastic additives/chemicals and why the embryos expressed adverse symptoms after the intake of MPs.
The observed effects included inflammation, impaired locomotion, behavioral abnormalities, reduced metabolic activity, heart rate, and changes in morphology, eventually resulting in visible deformities, such as spinal curving, pericardial edema, yolk sac edema in the embryos, and cell membrane damage in the
To statistically analyze the results of all three trials of the embryotoxicity test, a twoway analysis of variance (ANOVA) of the results was utilized, and the p-values were compared. Figure 6 shows the p-values from a two-way embryotoxicity were α = 0.05. The results presented were supported by the statistical analysis. As shown in Figure 7, embryo mortality increased with MPs concentration. Embryonic heart rate was inversely correlated with MPs concentration, as seen in Figure 8.
Novel Remediation
The Moringa plant is a nutrient-rich green tree of the Moringaceae family with many applications and is grown in many parts of the world, including the United States. The scientific name for this plant is Moringa oleifera (M. oleifera), and it is also known as horseradish tree or drumstick tree. The leaves, fruit, flowers, and youthful branches of this tree are utilized as profoundly nourishing vegetables in various nations, including India. Moringa is recognized as a vibrant and affordable source of phytochemicals, known for its rich content of vitamins, minerals, and antioxidants.
Figure 6. Statistical results.
Figure 7. Mortality versus concentration.
Water Quality Assessment
Microscope images were taken at various stages of the experiment to visualize the removal of MPs. Also, a turbidity sensor, colorimeter, and spectrophotometer were utilized to quantitatively assess changes in turbidity and watercolor before and after the treatment process.
Cost Analysis
This Moringa water filter prototype offers a cost-effective solution ($4.28/month), making it an ideal point-of-use system for communities in need (Figure 9).
Results
The Moringa seed powder was demonstrated to be highly effective; in 3 minutes, the flocculation process could be seen where the Moringa seed powder would clump with the MPs. In the tap water group, after 30 to 40 minutes, the entirety of the floc settled at the bottom of the jar, resulting in clear water above. The pH levels were recorded at 8.47 in the control group and 8.41 in the experimental group, indicating that there were no significant changes to the water’s pH. This suggests that the powder does not release any harmful substances into the water during the flocculation process.
Moringa seeds contain proteins that have active coagulation properties and are being used for turbidity removal in water purification. During the flocculation stage, the positively charged polypeptides found in the Moringa seed powder attract the negatively charged MPs particles, causing them to settle to the bottom of the tank. The flocculation process is aided by coagulating agents and natural organic matter present in the Moringa seeds, which promote the formation of larger aggregates that can be more easily removed from the water. Once the MPs have settled, the surface water is released through a valve and directed into a filtration chamber equipped with two ceramic filters. A prototype of the filtration device is shown in Figure 10. This filtration process can effectively remove plastic particles as small as 0.5 µm, ensuring the purity of the water. Figure 11 is a 3D plot that represents the distribution of the color removal and turbidity removal percentages against the Moringa seed powder dosage.
Designing a Prototype for Real-World Application
The continent of Africa is home to 1.28 billion people, and is a part of the world with
Continued on page 44
Figure 10. Photo of scalable prototype.
Figure 9. Cost per month to operate.
Figure 8. Heart rate versus concentration.
the leading number of deaths caused by unsafe water. In southern Africa, more than 50 percent of the population does not have access to clean drinking water. In many of these countries, the journey to access clean drinking water is extensive. Two thirds of sub-Saharan Africa relies mostly or completely on surface water, which can often be highly polluted with plastics and contribute to Africa's water contamination crisis. To remove MPs and other contaminants from water sources, a filtration system can be implemented utilizing Moringa seed powder as a natural coagulant. The Moringa oleifera tree, shown in Figure 12, is central to the filtration method. A pilot can be run in Magadaville, South Africa, where water sources are contaminated with plastic.
Concrete tanks can be used for water storage; they are exceedingly durable and are at insignificant risk of “floating” (as some plastic tanks can be). They can withstand extreme weather conditions, and are also at minor risk of rusting, corroding, or sustaining damage from tree roots. As there is a choice between precast or custom-poured tanks, if damage should occur, it can be easily repaired. South African water tank suppliers have a range of shapes and sizes available for 50 liters to 40,000 liters of water. It is essential to choose a suitable installation location away from potential obstructions to ensure stability and a level surface near the waterbody. Regular maintenance includes cleaning the tank periodically to remove sediments or algae buildup that can affect water quality.
Pilot Project Implementation
An enhanced community-level pilot project for a water filtration system for the removal of plastic contaminants (Figure 13) is to be conducted in South Africa with the collaboration of international agencies and local support.
This water filtration system is designed by cascading concrete upright storage tanks for the removal of plastic contaminants from the local water sources. The system utilizes Moringa seed powder as a natural coagulant in a multistage process to achieve a 99.9 percent purification efficiency. This system has the capacity to run two to four cycles of filtration with approximately 200 liters each. Hence, 400 to 800 liters per day provide potable water for 200 to 400 people.
Conclusion
This problem investigation showed MPs are pervasive in various ecosystems, including
Figure 12. Moringa oleifera
Figure 11. Moringa powder dosage and percent removal.
Figure 13. Location for Moringa-enhanced water filtration system deployment.
marine, freshwater, and terrestrial environments, which harm the health and development of organisms. The model organism Danio rerio had decreased hatching rate, heart rate, abnormal morphology, and behavior, with decreased viability in various concentrations of MPs, supporting the project’s hypothesis. This highlighted the embryotoxicity of the MPs in the embryos that were in the high MPs concentration medium where there was significantly decreased viability. These findings shed light on the potential risks of MPs exposure during human embryo organogenesis since they have been found in the human placenta. In addition, these findings emphasize the adverse effects of MPs on the human reproductive system, specifically leading to male infertility.
Addressing the issue of MPs in water reservoirs requires collaborative action from individuals, industries, and governments worldwide. Effective strategies must be implemented to prevent MPs ingestion, with a primary focus on mitigating their presence in water sources. In this regard, this novel solution proposes the utilization of Moringa seed powderbased filtration as an effective water filtration method. This prototype consists of a two-stage filtration process. Moringa seed powder contains bioactive compounds that have active coagulation properties and are shown in turbidity/color removal in water purification. In the first stage, the introduction of Moringa seed powder facilitates the sedimentation of contaminants, enhancing the efficiency of the process. This improvement is further improved through the utilization of stirring and the vortex-shaped design at the base of the container. In the second stage, the treated water undergoes filtration via a ceramic filter, effectively eliminating residual contaminants and achieving a purification rate of 99.9 percent. The combination of these stages and the reusability of the powder ensure clean water and longevity of the system.
This scalable, low-cost, and environmentally friendly solution is an innovative technique that has the potential to be a viable alternative to tertiary water treatment. This prototype should be made available through nonprofit organizations for optimal distribution of its benefits to communities. At scale, this solution can expand access to clean drinking water to over 300 million individuals, reduce waterborne illness rates by up to 50 percent, yield healthcare cost savings of over $200 million, and provide jobs for over 50,000 local small-scale farmers in Africa alone.
This innovation holds promise for revolutionizing water treatment in developing countries and communities in need, providing a safe and sustainable solution for the global drinking water scarcity crisis. S
What Do You Know About the Pounds Formula? Test Yourself
Charlie Lee Martin Jr., Ph.D.
1. The daily pounds of phosphorus discharged within the Mississippi River by the Metropolitan Water Resource Recovery Facility in St. Paul, Minn., that discharges 172 million gallons per day (mgd) with a total phosphorus concentration of 0.4 mg/l is a. 514 lbs/day. b. 70 lbs/day. c. 1,434 lbs/day. d. 574 lbs/day.
2. The daily pounds of total nitrogen discharge within the Mississippi River by the Bissell Point Wastewater Treatment Facility in St. Louis, Mo., that discharges 120 mgd with a total nitrogen concentration of 15 mg/l is a. 15,012 lbs/day. b. 1,800 lbs/day. c. 125 lbs/day. d. 112 lbs/day.
3. The daily pounds of carbonaceous biochemical oxygen demand (CBOD) received by the Metropolitan Water Reclamation District of Greater Chicago with an influent flow of 1,400 mgd and CBOD concentration of 74 mg/l is a. 86,400 lbs/day. b. 8,640 lbs/day. c. 864,024 lbs/day. d. none of the above.
4. The daily pounds of total suspended solids (TSS) received by the Point Loma Wastewater Treatment Plant in San Diego with an influent flow of 175 mgd and a TSS concentration of 60 mg/l is a. 1,570 lbs/day. b. 9,570 lbs/day.
c. 870,570 lbs/day. d. 87,570 lbs/day.
5. The concentration of 80,700 lbs of CBOD in the 17.5 million gallons (MG) of effluent discharged by the West Point Treatment plant in Seattle into Puget Sound is a. 553 mg/l. b. 100 mg/l. c. 800 mg/l. d. none of the above.
6. The concentration of 37,947 lbs of TSS in the 910 MG of effluent discharged by the Deer Island Wastewater Treatment Plant in Boston into Boston Harbor is a. 10 mg/l.
b. 5 mg/l.
c. 20 mg/l.
d. none of the above.
7. The concentration of the 75,060 lbs of total nitrogen in the 300 MG of influent received by the Newton Creek Wastewater Treatment Plant in New York City is a. 5 mg/l.
b. 30 mg/l.
c. 10 mg/l.
d. none of the above.
8. The effluent of flow with 1,751.4 pounds of total nitrogen at a concentration of 3 mg/l received by the Columbia River from the Columbia Boulevard Wastewater Treatment Plant in Portland, Ore., is a. 15 MG. b. 35 MG.
c. 10 MG. d. 70 MG.
9. The effluent of flow with 2085 pounds of total phosphorus at a concentration of 1 mg/l received by the White River from the Southport Wastewater Treatment Plant in Indianapolis, Ind., is
a. 250 MG.
b. 150 MG.
c. 100 MG.
d. none of the above.
10. The influent of flow with 33,000 pounds of CBOD at a concentration of 152 mg/l received by the Billings (Mont.) Wastewater Treatment Plant is a. 10 MG. b. 26 MG.
c. 30 MG. d. 40 MG.
Answers on page 54
References used for this quiz:
• Pounds Formula (Flow MGD X CONC X 8.34 lbs/gal)
OZ Lifting Products offers wireless control options for its electric chain hoists and electric builder’s hoists with capacities of 1,000 to 4,000 pounds. Whether upgrading to a new wireless hoist or retrofitting an existing OZ electric series hoist with a plug-and-play wireless adapter, the products give greater control and flexibility. The compact and lightweight design easily connects and pairs to the OZ electric chain hoist or the OZ electric builder’s hoist in minutes, allowing remote control from up to 250 feet away while keeping a line of sight. This upgrade enhances operational efficiency, improves safety by reducing the need for manual control, and is perfect for a variety of lifting applications. Installation is simple, and the system’s range and flexibility streamline operational productivity. (www. ozliftingproducts.com)
RReed Manufacturing offers welldesigned tools for stopping flow in 1/2- to 8-inch polyethylene (PE) pipe. Double-bar PE squeeze-off tools provide two pinch points to increase squeeze confidence and yield optimal flow control, and are reliable and safe tools to use in a ditch. New designs remove operator
NEW PRODUCTS
pain points with reduced weight and durable construction, including hand grooves for lifting, reduced weight, and low-effort squeeze. Sliding bar handles and swing-out bottom bars make for efficient work in tight spaces. Finepitched feed screw thread and custom ball bearing allow for a consistent, smooth squeeze. Grease fittings at friction points make operation the smooth and extend tool life. All PE squeeze tools use positive stops to prevent damage caused by over squeezing. Multiple size/SDR settings on one pair of stops provide convenient over squeeze protection for standard pipe sizes.
(www.reedmfgco.com)
RHermann Sewerin GmbH has developed the SeCorrPhon AC 200 for professional water leak detection. It combines the characteristics of a correlator with acoustic water leak detection, with prelocation, pinpointing, and correlation in one single system. It offers easy-to-read measurement value display and automated filter selection. This product is based on the tried and tested housing and hardware concept of the AQUAPHON A 200, also by Sewerin. Each is ideal for use for leak detection across all sections, materials, diameters, and lengths of
pipelines. Numerous additional functions are also available for complex location scenarios. (www.sewerin.net)
RThe 5E FLEX battery-powered smoke blower from Superior Signal is designed for smoke-testing building plumbing and laterals to quickly find faults, odors, leaks, and inflow. The 5E FLEX is compatible with leading 18- to 20-volt tool batteries utilizing a high-quality power adapter. The smoke blower integrates with existing electric toolsets or can run off any 12- to 24-volt DC power source. This testing is a cost-effective solution and is ideal for hard-to-find faults in commercial, residential, and municipal facilities. While the 5E blower is popular for a variety of plumbing applications, it’s also particularly useful in testing sewer laterals, showing where a fault or leak may occur on private property. Made in the United States, the 5E FLEX comes with an 8-foot industrial grade hose. Used with 1A or 2B Superior smoke candles, it creates 4,000 or 8,000 cubic feet of smoke, respectively. Superior Smoke candles are also sold in convenient SealPac cans that extend shelf life. (www.superiorsignal.com) S
View all courses and register online at go.ufl.edu/FWRJTREEO
INSTRUCTOR HIGHLIGHT
Curt Dwiggins
Program Manager for Water Distribution at the University of Florida TREEO Center
Curt Dwiggins is the Program Manager for Water Distribution at the UF TREEO Center, where he plays a vital role in shaping the future of the water utility industry. Curt began his career in public utilities at the age of 20 with the Coral Springs Improvement District (CSID), a Florida Special District serving the southern portion of Coral Springs. He steadily advanced through the organization, ultimately spending over a decade in management.
Over nearly 26 years at CSID, Curt managed the Field Department for a small but complex water system serving just under 40,000 residents. His responsibilities included oversight of water and wastewater systems, SCADA, GIS, backflow prevention, building permits, and construction management. He also managed contracts, purchasing, and budgeting. During his tenure, Curt earned a Class 1 Water Distribution Operator License from the Florida Department of Environmental Protection (FDEP) and holds a Level B Wastewater Collection Certification.
As the program manager, Curt is deeply committed to training and mentoring the next generation of water utility professionals. He is responsible for updating and maintaining course materials, ensuring that they reflect the latest industry standards and best practices. Curt will be teaching the Water Distribution Systems Operator Level 2 & 3 course August 11–14 and November 3–6, where he will provide interactive instruction and guidance to help students advance their careers in the field.
July 14-17 | Water Distribution Systems Operator Level 2 & 3
Virtual | $699 | CEUs 3.2 DS DW WW
July 15-17 | Introduction to Electrical Maintenance
Gainesville, FL | $625 | CEUs 2.0 DS DW WW
July 21-24 | Train the Trainer: How to Design & Deliver Effective Training
Gainesville, FL | $899 | CEUs 3.2 DS DW WW
Aug 4-8 | Wastewater Class A Certification Review
Virtual | $720
Aug 11-14 | Water Distribution Systems Operator Level 2 & 3
Virtual | $699 | CEUs 3.2 DS DW WW
Aug 18-22 | Water Class A Certification Review Virtual | $720
Aug 26-28 | Water Distribution Systems Operator Level 1
Virtual | $575 | CEUs 2.4 DS DW WW
Sep 3-4 | Effective Utility Leadership Practices
Gainesville, FL | $625 | CEUs 1.35 DS DW WW
EPA Announces It Will Keep Maximum Contaminant Levels for PFOA, PFOS
The agency intends to provide regulatory flexibility and holistically address these contaminants in drinking water
Lee Zeldin, administrator for the U.S. Environmental Protection Agency (EPA), announced the agency will keep the current National Primary Drinking Water Regulations (NPDWR) for perfluorooctanoic acid (PFOA) and perfluorooctane sulfonic acid (PFOS), which set nationwide limits for these “forever chemicals” in drinking water. The agency is also committed to addressing per- and polyfluoroalkyl substances (PFAS) in drinking water while following the law and ensuring that regulatory compliance is achievable for drinking water systems.
“The work to protect Americans from PFAS in drinking water started under the first Trump Administration and will continue,” said Zeldin. “We are on a path to uphold the agency’s nationwide standards to protect citizens from PFOA and PFOS in their water. At the same time, we will work to provide common sense flexibility in the form of additional time for compliance. This will support water systems across the United States, including small systems in rural communities, as they work to address these contaminants. The EPA will continue to use its regulatory and enforcement tools to hold polluters accountable.”
As part of this action, EPA is announcing its intent to extend compliance deadlines for PFOA and PFOS, establish a federal exemption framework, and initiate enhanced outreach to water systems through EPA’s new PFAS OUTreach Initiative (PFAS OUT). This action would help address the most significant compliance challenges EPA has heard from public water systems, members of Congress, and other stakeholders, while supporting actions to protect the American people from certain PFAS in drinking water.
Paired with effluent limitations guidelines (ELGs) for PFAS and other tools to ensure that
polluters are held responsible, EPA’s actions are designed to reduce the burden on drinking water systems and the cost of customer water bills, all while continuing to protect public health and ensure the agency is following the law in establishing impactful regulations.
The EPA has also announced its intent to rescind the regulations and reconsider the regulatory determinations for perfluorohexane sulfonate (PFHxS), perfluorononanoic acid (PFNA), hexafluoropropylene oxide dimer acid (HFPO-DA), and the Hazard Index mixture of these three, plus perfluorobutane sulfonic acid (PFBS) to ensure that the determinations and any resulting drinking water regulations follow the legal process laid out in the Safe Drinking Water Act.
Regulatory Protection With Flexibility and Cost Savings
To allow drinking water systems more time to develop plans for addressing PFOA and PFOS where they are found and implement solutions, EPA will provide additional time for compliance, including a proposal to extend the compliance date to 2031. It plans to issue a proposed rule this fall and finalize the rule in the spring of 2026. Aligned with the intent to provide additional compliance time for water systems, EPA encourages states seeking primacy for implementing the PFAS drinking water regulation to request additional time from EPA to develop their applications. At the same time, EPA will support the U.S. Department of Justice in defending ongoing legal challenges to the NPDWR for PFAS with respect to PFOA and PFOS.
“The EPA has done the right thing for rural and small communities by delaying implementation of the PFAS rule. This decision provides the additional time that water
system managers need to identify affordable treatment technologies and make sure they are on a sustainable path to compliance,” said Matthew Holmes, chief executive officer of the National Rural Water Association. “Our organization greatly appreciates this reasonable and flexible approach, and we look forward to partnering with PFAS OUT to help ensure water systems have the resources and support they need,”
Alan Roberson, executive director of the Association of State Drinking Water Administrators (ASDWA), stated, “We support EPA’s proposed approach to the PFAS regulation to extend the compliance date for systems by an additional two years. With the current compliance date of 2029, states and water systems are struggling with the time frames to complete the pilot testing, development of construction plans, and building the necessary treatment improvements. The proposed extension of the compliance date and increased assistance will address the number of systems that would be out of compliance in 2029 due to not being able to complete all of these tasks on time.”
Enhancing Communication and Outreach
To enhance engagement on addressing PFAS, EPA will launch PFAS OUT to connect with all public water utilities known to need capital improvements to address PFAS in their systems, including those EPA has identified as having PFOA and PFOS levels above EPA’s maximum contaminants levels (MCLs). It will share resources, tools, funding, and technical expertise to help utilities meet the federal drinking water standards. The PFAS OUT will ensure that no community is left behind as EPA and others work to protect public
health and bring utilities into compliance with federal drinking water standards. The PFAS OUT will engage utilities, assistance providers, and local, state, tribal, and territorial leaders to develop effective and practical solutions where they are needed most.
The EPA will continue to offer free water technical assistance through WaterTA, which provides services to water systems to improve their drinking water and help communities access available funding. The EPA WaterTA initiatives work with water systems nationwide to identify affordable solutions to assess and address PFAS, including PFOA and PFOS. Services offered to utilities include water quality testing, development of technical plans, operator training support, design of public engagement and outreach strategies, and support for accessing federal funding opportunities.
Holding Polluters Accountable
Drinking water systems are passive receivers of PFOA and PFOS. Polluters can contaminate the surface waters or aquifers that these systems rely on to provide drinking water to their communities and should be held accountable financially. As announced by Zeldin, EPA intends to take a number of actions to reduce the prevalence of PFAS in the environment, including in sources of drinking water. Progress reducing concentrations of PFAS in drinking water sources can substantially reduce the cost burden for water systems and reduce the cost of living for the communities they serve.
Record of Leadership
Zeldin’s involvement with PFAS dates back to his time in Congress, where he was a founding member of the PFAS Congressional Taskforce and a strong supporter of the PFAS
Action Act, legislation to provide funding to support local communities cleaning up PFAScontaminated water systems. He was, and remains, a staunch advocate for protecting all Americans from contaminated drinking water.
In the process of developing and taking action on a number of these items, Zeldin personally heard from members of Congress on passive receiver issues where local water utilities will foot the bill for contamination and pass those costs onto consumers. This mindset and the need for a “polluter pays” model has guided a lot of the work to be done at EPA in the future.
Background and Recent History
During President Trump’s first term, EPA convened a two-day National Leadership Summit on PFAS in Washington, D.C., that brought together more than 200 federal, state, and local leaders from across the U.S. to discuss steps to address PFAS. Following the summit, the agency hosted a series of visits during the summer of 2018 in communities directly impacted by PFAS. At these visits EPA interacted with more than 1,000 Americans during community engagement events in Exeter, N.H.; Horsham, Penn.; Colorado Springs, Colo.; Fayetteville, N.C.; and Leavenworth, Kan., as well as through a roundtable in Kalamazoo, Mich., and events with tribal representatives in Spokane, Wash.
In 2019, the Trump EPA announced the PFAS action plan. The plan responded to extensive public interest and input the agency received and represented the first time EPA built a multimedia, multiprogram, and national communication and research plan to address an emerging environmental challenge like PFAS. The EPA action plan identified both short-term solutions for addressing these chemicals and long-term strategies that will help provide the tools and technologies
states, tribes, and local communities need to provide clean and safe drinking water to their residents and to address PFAS at the source— even before it gets into the water.
On April 10, 2024, EPA announced the final NPDWR, including standards for PFOA and PFOS. At that time, EPA established legally enforceable levels for these PFAS in drinking water and gave public water systems until 2029 to comply with the MCLs.
On April 28, 2025, Zeldin announced a long list of actions to combat PFAS contamination that included in part the designation of an agency lead for PFAS; the development of ELGs for certain PFAS to reduce discharges to waterways, including upstream of drinking water systems; and initiatives to engage with Congress and the industry to establish a clear liability framework that ensures passive receivers and consumers are protected. This list is the first, but not the last, of all decisions and actions EPA will be taking to address PFAS. There will be more to come in the future across EPA’s program offices to help communities impacted by PFAS contamination.
Funding
The EPA supports water systems in reducing PFAS and emerging contaminants (EC) in drinking water through a range of funding resources. Federal sources include:
S Drinking Water State Revolving Fund (DWSRF)
S EC Small or Disadvantaged Communities (EC-SDC) grants
S Water Infrastructure Finance and Innovation Act (WIFIA)
These can be leveraged to provide supplemental, flexible, low-cost credit assistance to public and private borrowers. For more information go to www.epa. gov.
S
Alan Roberson Lee Zeldin
Matthew Holmes
The Florida Office of Economic and Demographic Research (EDR) has released an updated report detailing Florida’s water supply. According to the report, Florida could experience a water supply shortage as early as 2025, and it’s expected to increase in severity through 2040. The state’s continued rapid economic and population growth underscores the need for a consistent, comprehensive, and coordinated statewide strategy for funding water projects.
Florida will need to invest an estimated $1.7 billion for critical water projects through 2040 to avoid a significant water supply shortage. This price tag is only an estimate for addressing the inferred water supply shortage and does not consider other projects associated with restoration and certain infrastructure (e.g., stormwater and wastewater) needs. Other projects, such as Everglades restoration, are also not part of the estimates because there is a separate plan in place. Thus, the actual costs of protecting Florida’s water resources are almost certainly much higher than what this estimate shows.
In the General Appropriations Act for Fiscal Year 2024-2025, there were 281 water-related member projects identified by Florida TaxWatch totaling $410.3 million that did not go through
NEWS BEAT
one of the proper channels to receive funding. This circumvention of the budgeting process shows the need for a more comprehensive planning process to address selection and funding issues.
Florida will not be able to sustain the continued level of growth it has seen over the recent years without dramatically improving how it selects and funds water projects. With less than 40 percent of the water supply projects having committed funding, the remaining 60 percent will have to come from local, regional, or federal funding sources.
Even though the Legislature has made significant investments in water project grant programs, it’s not enough. To meet the growing demand for managing these resources, the Legislature could consider implementing a fiveyear water project work program, similar to the Florida Department of Transportation Five-Year Work Program.
R
Jacobs was selected by the City of Boynton Beach to evaluate and design upgrades at two water treatment plants to remove per- and polyfluoroalkyl substances (PFAS) from the city’s groundwater supplies to comply with new U.S. federal drinking water regulations.
At a combined treatment capacity of 30 million gallons per day, the two plants provide drinking water to more than 112,000 people. In addition to addressing new PFAS regulations, the facility upgrades will replace aging infrastructure and meet the community’s growing demand for water.
“Considering potential federal compliance deadlines, we’re working with the city to help deliver an effective, long-term PFAS treatment and disposal solution,” said Katus Watson, senior vice president at Jacobs. “We’ve supported the city with its water system challenges for more than 40 years and look forward to planning and designing this next important project for the community.”
Jacobs will evaluate the city’s existing facilities to assess treatment capabilities for PFAS removal and develop a comprehensive facilities plan for the city’s treatment plants, associated source water supply, and residuals management systems. Once the facilities plan is complete, Jacobs will design the improvements and provide construction management services. The city received a loan from Florida’s Drinking Water State Revolving Fund Program for project planning and design.
Continued on page 53
JEA is hiring dedicated professionals to operate a state-of-the art membrane purification facility as part of JEA’s H2.O Purification Program.
Be a part of Florida’s operational history by joining our team today.
Please visit www.jea.com/careers and look for Advanced Treatment Water Facility (ATWF) positions for more details.
WHY Choose US
• Top-tier Operator Pay Scale
• Excellent Benefits
• Advancement Opportunities
• Award-winning Facilities and Operations Team
THE Center
JEA is constructing a 1.0 MGD membrane-based Advanced Treatment Water facility as part of the H2.O Purification Program. “The Center” is designed to exceed water quality goals needed for aquifer replenishment. Operational processes include membrane filtration, reverse osmosis and UV advanced oxidation.
C L A S S I F I E D S
CLASSIFIED ADVERTISING RATES - Classified ads are $22 per line for a 60 character line (including spaces and punctuation), $60 minimum. The price includes publication in both the magazine and our Web site. Short positions wanted ads are run one time for no charge and are subject to editing. ads@fwrj.com
POSITIONS AVAILABLE
Utilities Treatment Plant Operator I or Trainee
$57,208 - $80,496/yr. or $51,889 - $73,012/yr.
Utilities System Operator Foreman
$57,208 - $80,496/yr.
Utilities Lift Station Operator I
$49,418 - $69,536/yr.
Utilities Lift Station Operator II
$57,208 - $80,496/yr.
Utilities System Operators I or Trainee
$44,823 - $63,071/yr. or $42,690 - $60,068/yr.
Apply Online At: http://pompanobeachfl.gov Open until filled.
City of Melbourne
Water Treatment Operator C, B, A or Trainee
Class C
Class B
Class A
Trainee
$44,640 – 74,996
$46,649 – 78,371
$48,748 – 81,898
$38,345 – 63,270
Learn more and apply online at www.melbourneflorida.org https://www.governmentjobs.com/careers/melbourneflorida
City of Melbourne, Operations Supervisor
Reverse Osmosis and Actiflo Surface Water Treatment Plants
Must possess a Class A Drinking Water Treatment Operator License with a minimum of two (2) years in the supervisory capacity of a Class A water treatment facility.
Learn more and apply online at www.melbourneflorida.org
Make a difference in your community Apply today! WWW.Plantation.org
Chief
Wastewater Operator
Looking to be part of the largest growing City in Central Florida and participate in the grand opening of a new wastewater treatment plant?
The City of Wildwood, Florida is searching for Chief Wastewater Operator to manage our wastewater plant operators. Class A operator license preferred plus 5 years experience. Starting salary range: $64,000 - $72,000. Please apply online at www.wildwood-fl.gov or contact Marc Correnti at mcorrenti@wildwood-fl.gov
Okeechobee Utility Positions Available
Wastewater Treatment Plant Supervisor
Lift Station Technician – Electrical Exp
Information regarding job description, salary, benefits go to www.ouafl.com or email: hrmanager@ouafl.com
City of Avon Park
Public Works/Utilities Director
$90,000 - $100,000/yr DOQ
Apply Online at: City of Avon Park Employment ApplicationOpen until filled
City of Avon Park FL – UTILITIES MANAGER
Public Works Utilities Manager
$70,000 DOQ
Apply Online at: City of Avon Park Employment Application–Open until filled
Martin County Utilities
Project Engineer
Project management, civil engineering design and engineering oversight of specific utility projects. Primary function is to manage and review the various activities of consultants, contractors, and staff in the planning, design, and construction of utility capital improvement and infrastructure preservation projects. Complex technical and professional work requires considerable contact with permitting agencies, utilities, and other County departments as well as public and private individuals and organizations. A good level of independent professional judgment and decision making is essential. https://www.government jobs.com/ careers/martinfl/jobs/4870344/project-engineer
Orange County Utilities Senior Engineer
Orange County Utilities is accepting applications for a Senior Engineer position in the Capital Improvement Program of the Engineering Division. Successful candidates will possess strong project management skills and have experience with renewal/ replacement of force main sewer. Excellent benefits and salary commensurate with experience and education. Search Job Code:7037 Apply at: www.ocfl.net/jobs
Orange County Utilities Senior Engineer Orange County Utilities is accepting applications for multiple Senior Engineer positions in the Capital Improvement Program of the Engineering Division. Successful candidates will possess strong project management skills and have experience with renewal/ replacement of gravity sewer and pump stations, septic-to-sewer conversion projects, and management of grants from federal, state, or local agencies. Excellent benefits and salary commensurate with experience and education. Search Job Code:7037 Apply at: www.ocfl.net/jobs
Engineer III: $3,847.73 to $4,232.50
Engineer II: $3,497.95 to $3,847.75
Engineer I: $3,179.63 to $3,497.59
Performs professional engineering work coordinating, planning, developing, drafting, reviewing, inspecting, and managing assigned water, wastewater, and reclaimed water projects.
REQUIREMENTS: Bachelor’s or Master’s degree in, Environmental Engineering or Civil Engineering from an Accredited Board of Engineering and Technology (ABET) accredited college or university.
Engineer III: Five (5) years of professional experience in engineering related to water and wastewater and which includes two (2) years of post-registration experience.
Engineer II: Five (5) years of experience in engineering related to water and wastewater.
Engineer I: A Board of Professional Engineers (BPE) Certification as an Engineer Intern (EI) or Engineer in Training (EIT) is preferred.
Apply at https://career8.successfactors.com/career?company =brevardcou
WATER PLANT OPERATOR
The South Martin Regional Utility, located in Hobe Sound, Florida is looking for a WATER PLANT OPERATOR to provide Water Plant Operator services to the South Martin Regional Utility under the supervision of the Chief Water Plant Operator. Position is classified as Hourly and Non- Exempt. Work in excess of 40 hours per week is likely. This is a skilled technical position responsible for operating and maintaining water treatment plants and water wells and producing safe drinking water in accordance with Federal and State regulatory requirements. Applied practical experience in water treatment facilities, infrastructure and equipment maintenance is preferred. Minimum Class “C” FDEP license required. Job applications and the full job description are available online at the Town’s website, or can be picked up at 2 Bridge Road, Jupiter Island/Hobe Sound, FL.
Completed job applications should be sent to hr@tji.martin.fl.us, or delivered to 2 Bridge Road, Jupiter Island, FL 33455. Open until filled. South Martin Regional Utility is an Equal Opportunity Employer.
The St. Johns River Water Management District is advancing a wide range of science-based initiatives to help ensure a sustainable and resilient water future for central Florida’s growing communities, businesses, and natural resources.
A cornerstone of this effort is the district’s ongoing work to establish and update minimum flows and levels (MFLs), which are science-based thresholds designed to prevent significant harm to rivers, lakes, and springs from water withdrawals. A key focus area is the Wekiva River, which is designated as a scenic and wild river, and its surrounding region, an ecologically rich system home to multiple Outstanding Florida Springs. These springs are not only part of Florida’s iconic natural beauty; they also provide critical habitat and immeasurable natural, recreational, economic, and inherent value. Their Outstanding Florida Springs designation affords them additional protections to support long-term conservation and restoration.
Seven existing MFLs in central Florida are being re-evaluated, and a new one is proposed for the Little Wekiva River to enhance protection of smaller springs like Palm, Sanlando, and Starbuck.
These efforts are part of the Central Florida Water Initiative (CFWI), a collaborative partnership with the St. Johns River, South Florida, and Southwest Florida water management districts; Florida Department of Environmental Protection; Florida Department of Agriculture and Consumer Services; and local governments, utilities, and other stakeholders. With central Florida’s population now exceeding more than 3.4 million people, coordinated regional planning is essential. The district plays a key role in developing comprehensive water supply plans that look 20 years ahead to help ensure sustainable resources for generations to come.
To date, the district has invested $35.7 million in CFWI-area projects that collectively total $204.5 million in value, reflecting the importance of shared funding and collaboration in regional water resource management.
One promising project is the potential expansion of the Taylor Creek Reservoir in eastern Orange and Osceola counties. Constructed in the 1960s as part of the original Central and Southern Florida Flood Control Project, Taylor Creek Reservoir was designed to capture and hold upland stormwater before it reached the St. Johns River, reducing flood stages in the Lake Poinsett area as a flood protection measure. Today, the reservoir provides drinking water and supplies irrigation water. The proposed expansion could provide up to 54 million gallons of drinking water per day to additional utilities, strengthening regional water security through a strong public-private partnership.
The district also partners with local agricultural operations, like Cherrylake in Lake County, which has completed six costshare projects to increase irrigation efficiency, conserve water, and improve water quality. These projects have resulted in more than 1.3 million gallons per day of water savings and significant reductions in nutrient runoff, demonstrating how innovative agricultural practices can benefit both the economy and the environment.
In addition to these efforts, the district continues to invest in water conservation programs and groundwater recharge projects that extend existing supplies and protect natural systems, including Florida’s iconic springs. S
January
March
April
June
October
November...........Water
December
Technical articles are usually scheduled several months in advance and are due 60 days before the issue month (for example, January 1 for the March issue).
The closing date for display ad and directory card reservations, notices, announcements, upcoming events, and everything else including classified ads, is 30 days before the issue month (for example, September 1 for the October issue).
For further information on submittal requirements, guidelines for writers, advertising rates and conditions, and ad dimensions, as well as the most recent notices, announcements, and classified advertisements, go to www.fwrj.com or call 352-241-6006.
Test Yourself
Continued from page 45
1. D) 574 lbs/day.
The pounds of phosphorus discharged within the Mississippi River by the Metropolitan Water Resource Recovery Facility in St. Paul, Minn., that discharges 172 mgd with a total phosphorus concentration of 0.4 mg/l is 574 lbs/day.
2. A) 15,012 lbs/day.
The pounds of total nitrogen discharged within the Mississippi River by the Bissell Point Wastewater Treatment Facility in St. Louis, Mo., that discharges 120 mgd with a total nitrogen concentration of 15 mg/l is 15,012 lbs/day.
3. C) 864,024 lbs/day.
The pounds of CBOD received by the Metropolitan Water Reclamation District of Greater Chicago with an influent flow of 1,400 mgd and CBOD concentration of 74 mg/l is 864,024 lbs/day.
4. D) 87,570 lbs/day.
The pounds of TSS received by the Point Loma Wastewater Treatment Plant in San Diego with an influent flow of 175 mgd and a TSS concentration of 60 mg/l is 87,570 lbs/day.
5. A) 553 mg/l.
The concentration of 80,700 lbs of CBOD in the 17.5 MG of effluent discharged by the West Point Treatment plant in Seattle into Puget Sound is 553 mg/l.
6. B) 5 mg/l.
The concentration of 37,947 lbs of TSS in the 910 MG of effluent discharged by the Deer Island Wastewater Treatment Plant in Boston into Boston Harbor is 5 mg/l.
7. B) 30 mg/l.
The concentration of the 75,060 lbs total nitrogen in the 300 MG of influent received by the Newton Creek Wastewater Treatment Plant in New York City is 30 mg/l.
8. D) 70 MG.
The effluent of flow with 1,751.4 pounds of total nitrogen at a concentration of 3 mg/l received by the Columbia River from the Columbia Boulevard Wastewater Treatment Plant in Portland, Ore., is 70 MG.
9. A) 250 MG.
The effluent of flow with 2085 pounds of total phosphorus at a concentration of 1 mg/l received by the White River from the Southport Wastewater Treatment Plant in Indianapolis, Ind., is 250 MG.
10. B) 26 MG.
The influent of flow with 33,000 pounds of CBOD at a concentration of 152 mg/l received by the Billings (Mont.) Wastewater Treatment Plant is 26 MG.
The Flygt 4320 submersible mixer’s revolutionary design couples a high-efficiency mixer with an integrated variable frequency eliminates the need for an external VFD. A variety of ratings and propeller options meet a broad range of thrust requirements.
Premium Efficiency IE4 levels and fully adjustable speed, the Flygt 4320 delivers the lowest life cycle mixing energy costs.
Superior mixing with adjustability and simplicity, for unsurpassed energy savings.
For more information contact your local Xylem product sales professional. Xylem Products