Business Office: 1402 Emerald Lakes Drive, Clermont, FL 34711
Web: www.fwrj.com
General Manager: Michael Delaney
Editor: Rick Harmon
Graphic Design Manager: Patrick Delaney
Mailing Coordinator: Buena Vista Publishing
Published by BUENA VISTA PUBLISHING for Florida Water Resources Journal Inc.
President: Richard Anderson (FSAWWA) Peace River Manasota Regional Water Supply Authority
Vice President: Joe Paterniti (FWEA) Clay County Utility Authority
Treasurer: Rim Bishop (FWPCOA) Seacoast Utility Authority
Secretary: Mish Clark Mish Agency
Moving?
The Post Office will not forward your magazine. Do not count on getting the Journal unless you notify us directly of address changes by the 15th of the month preceding the month of issue. Please do not telephone address changes. Email changes to changes@fwrj.com or mail to Florida Water Resources Journal, 1402 Emerald Lakes Drive, Clermont, FL 34711
Membership Questions
FSAWWA: Casey Cumiskey – 407-979-4806 or fsawwa.casey@gmail.com
FWEA: Laura Cooley, 407-574-3318, admin@fwea.org
FWPCOA: Darin Bishop – 561-840-0340
Training Questions
FSAWWA: Donna Metherall – 407-979-4805 or fsawwa.donna@gmail.com
FWPCOA: Shirley Reaves – 321-383-9690
For Other Information
FDEP Operator Certification: Ron McCulley – 850-245-7500
FSAWWA: Peggy Guingona – 407-979-4820
Florida Water Resources Conference: 407-363-7751
FWPCOA Operators Helping Operators: John Lang – 772-559-0722, oho@fwpcoa.org
FWEA: Laura Cooley, 407-574-3318, admin@fwea.org
Websites
Florida Water Resources Journal: www.fwrj.com
FWPCOA: www.fwpcoa.org
FSAWWA: www.fsawwa.org
FWEA: www.fwea.org and www.fweauc.org
Florida Water Resources Conference: www.fwrc.org
News and Features
4 Clay County Utility Authority Cuts Ribbon on Advanced Reclaimed
and Pacific Islander
14 Let’s Talk Safety: Walk—and Work—on the Mild Side: Avoiding Slips, Trips, and Falls
Speaking Out—Lisa Wilson-Davis
C Factor—Kevin G. Shropshire
Test Yourself—Charles Lee Martin Jr.
FWEA Focus—Joe Paterniti
Brittanney Adelmann, and Prasad Chittaluru
36 Small Utilities Have Big Challenges, Too—Maria I. Arenas and Jon Bundy
Clay County Utility Authority
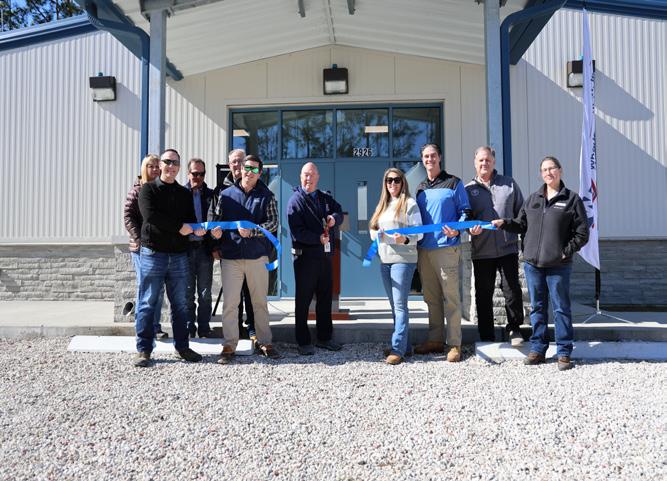
Cuts Ribbon on Advanced Reclaimed Water Demonstration Facility
Project Quench demonstrates a future of sustainable water for a growing population
Clay County Utility Authority (CCUA) recently celebrated the opening of Project Quench, an innovative demonstration facility showcasing how reclaimed water is safely transformed into drinking water using advanced purification technology. The facility is one of several alternative water supply solutions being evaluated by CCUA as part of its ongoing planning processes for future water needs, with the treated reclaimed water currently being used for testing and demonstration purposes only. The project represents a collaborative effort with CCUA, St. Johns River Water Management District, Florida Department of Environmental Protection, and Carollo Engineers.
Project Details
The CCUA serves more than 55,000 water, sewer, and reclaimed water customers in the unincorporated areas of Clay County. The utility operates seven water reclamation facilities, with five producing public access reclaimed water, and 22 water treatment plants. It has been an early adopter of reclaimed water technology, already operating with 70 percent of reclaimed water providing beneficial supplies for irrigation purposes.
Alternative water supply projects typically require long-term planning endeavors and CCUA believes the earliest this would be used is in the mid-2030s, as its served population grows. “Project Quench demonstrates CCUA’s commitment to maintaining a sustainable water supply for our rapidly growing community,” said Jeremy Johnston, CCUA executive director. “This
facility allows us to evaluate potable reuse as one potential alternative water supply, while educating the public about the safety and reliability of these proven treatment processes.”
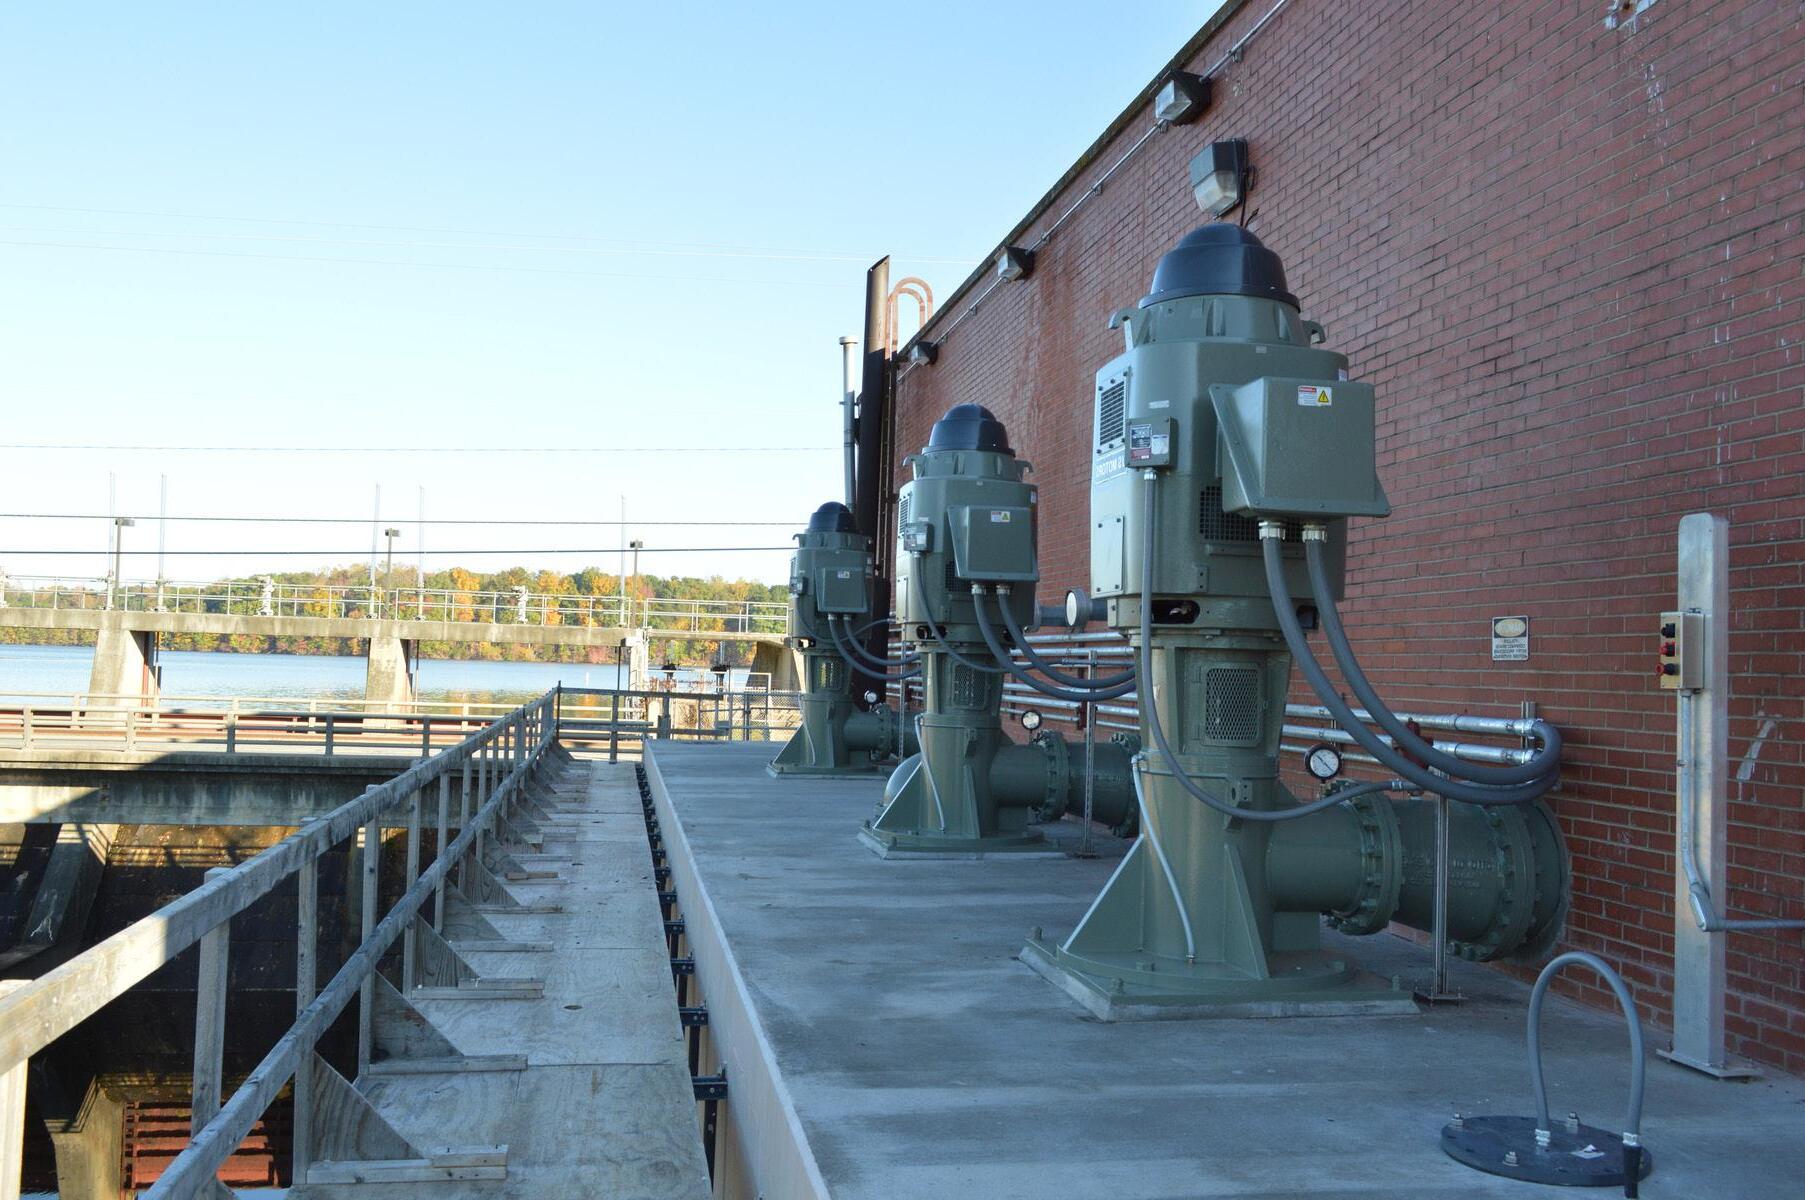
Facility Processes
Designed by Carollo Engineers, with Wharton-Smith Inc. as a contracting partner, the demonstration facility uses a multibarrier approach encompassing six advanced treatment processes to protect water quality. The process begins with ozonation, where water is treated with ozone to break down organic matter and eliminate bacteria. Next, biofiltration passes the water through specialized carbon filters where beneficial microorganisms remove impurities. The water then undergoes ultrafiltration through membranes with pores 100 times thinner than a human hair, capturing microscopic particles and contaminants.
Following ultrafiltration, water flows through granular activated carbon, which acts like a powerful filter to remove any remaining trace elements and organic compounds. The disinfection process then uses high-energy ultraviolet light to inactivate any remaining microorganisms. Finally, chlorination provides lasting protection as the water moves through treatment. Each of these barriers is continuously monitored through advanced control systems to maintain consistent water quality.
“Potable reclaimed water represents the next generation of sustainable water solutions, and Project Quench demonstrates Clay County Utility Authority’s visionary approach to early, thoughtful
planning to meet future water needs,” said Pranjali Kumar, Carollo project manager. “Through tried and true advanced treatment technologies and high-tech monitoring systems, this facility showcases a new, reliable source of drinking water that is safe and protective of public health. This project signals an innovative approach to water sustainability in northeast Florida.”
Training Staff and Educating the Public
Beyond testing the treatment system, Project Quench provides an important platform for CCUA to train operations staff on the latest technology. “The transformation of technology in the treatment of water, wastewater, and reclaimed water has been incredible and we remain committed to training our professional licensed operators on technology we look to implement in the future,” said Johnston. “Not only are we aiming to safeguard available water supplies, but we are also looking to sustain a highly trained professional workforce.”
The permanent facility features a welcoming space for presentations and an open floor plan allowing guests to observe the treatment processes firsthand. As both a training center and educational platform, the facility advances CCUA’s comprehensive strategy to develop sustainable water supply solutions, while building on its successful reclaimed water program.
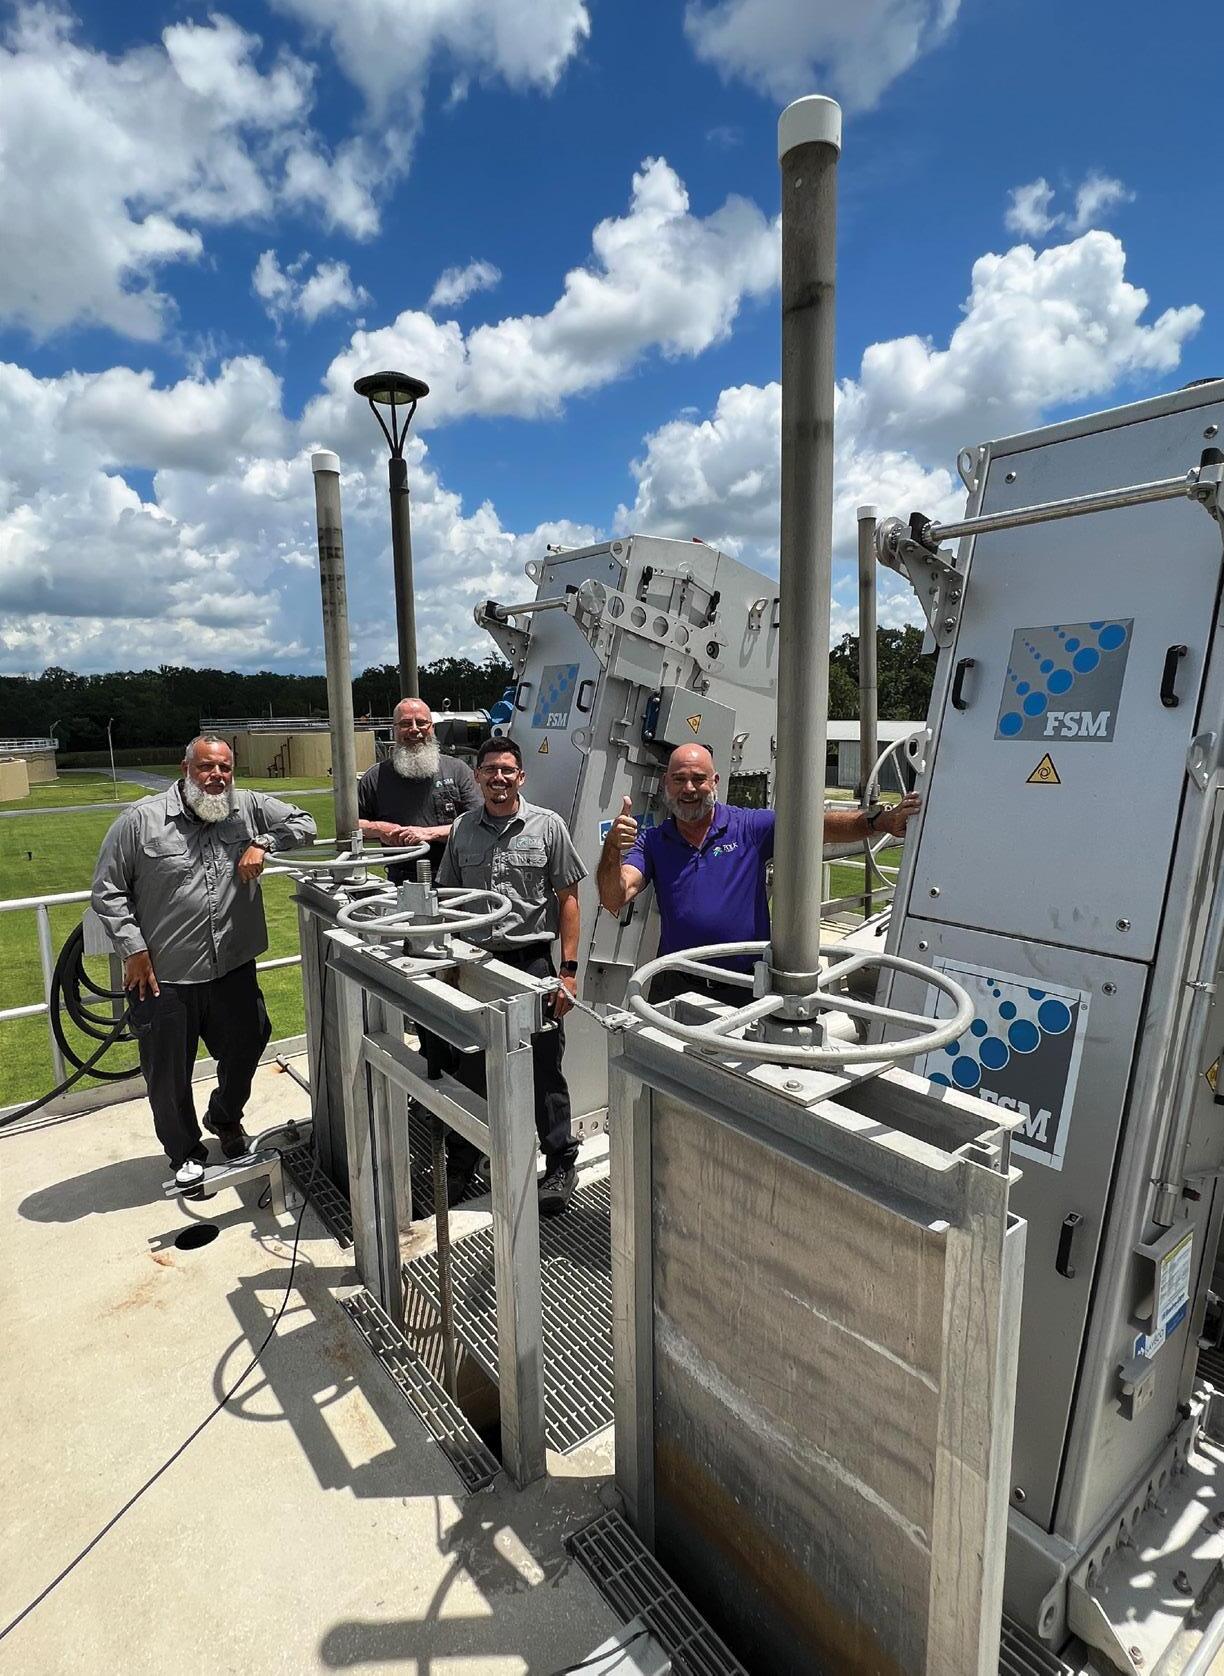
Public tours are now available on request to demonstrate CCUA’s commitment to providing safe, reliable, and sustainable water supplies for S
Trained staff members operate the facility. Staff at the ribbon-cutting.
New Study Maps Water Risks in the US
A new study published in Risk Analysis, a publication of the Society for Risk Analysis (SRA), maps which counties in the United States are most at risk and how ownership and inequality intersect.
This study is the first to combine nationwide geospatial data (on water system violations, ownership of these systems, and social vulnerability) with a nationally representative survey of how people feel about the safety, quality, and reliability of their water.
Vulnerable Populations
About two million people in the U.S. lack access to running water or indoor plumbing in their homes; another 30 million people live where drinking water systems violate safety rules. Water privatization—the transfer of public water systems ownership and/or management to private companies— has been proposed as a potential solution to provide more Americans with safe, clean drinking water. Opponents argue that private companies may prioritize profits over public needs.
To investigate how private versus public water systems affect water quality and equal access to safe, clean water, researchers mapped the distribution of water system ownership and water system violations nationwide.
Here is what they found:
S Counties in West Virginia, North Carolina, Oklahoma, and Pennsylvania were ranked among the top 10 for drinking water quality violations.
S On average, privately owned water systems have more violations than public utilities.
S Counties with the highest levels of water violations among vulnerable populations are more often served by public systems than private ones.
S People’s perceptions of water vulnerability depend on context and ownership.
S In lower-risk areas, people felt more vulnerable when more of their local
systems were private. In higher-risk areas, people felt more vulnerable when more systems were public.
“Policymakers can use our findings to identify and prioritize enforcement efforts in hotspots, make improvements in infrastructure, and implement policies that ensure affordable and safe drinking water, particularly for socially vulnerable communities,” said Alex Segrè Cohen, the study’s lead author and assistant professor of science and risk communication at the University of Oregon. “We found that violations and risks tend to cluster in specific areas across the country.”
Water system violations include failures to comply with regulations under the Safe Drinking Water Act, including health-based violations, such as exceeding maximum levels of contaminants, noncompliance with mandated water treatment techniques, and failure to follow monitoring schedules and communicate required information to customers.
Performance Scoring
Researchers devised a county-level score based on the performance of local drinking water systems. The score was based on data from the U.S. Environmental Protection Agency Safe Drinking Water Information System (SDWIS) and community social vulnerability using the Centers for Disease Control and Prevention Environmental Justice Index. These data were merged with a nationally representative survey of U.S. residents (collected in 2019) that measured how people rated their access to drinking water and the quality and reliability of water systems in their area.
Of the approximately 146,087 public water systems reported to the SDWIS in 2019, this study focused on community water systems (48,690) located in the contiguous U.S., defined as systems that supply water to the same population year-round. Each community drinking water system can consist of multiple facilities; a total of 507,492 facilities make up these 48,690 water systems.
“Our results suggest that privatization alone is not a solution,” said Cohen. “The local context, such as regulatory enforcement, community vulnerability, and community priorities, matters in determining outcomes.”
About SRA
The SRA was established in 1980 and is a multidisciplinary, interdisciplinary, scholarly, international society that provides an open forum for all those interested in risk analysis. Risk analysis is broadly defined to include risk assessment, risk characterization, risk communication, risk management, and policy relating to risk, in the context of risks of concern to individuals, public- and privatesector organizations, and society at the local, regional, national, or global level. Since 1982 it has continuously published Risk Analysis, the leading scholarly journal in the field.
For more information, visit www.sra.org. S
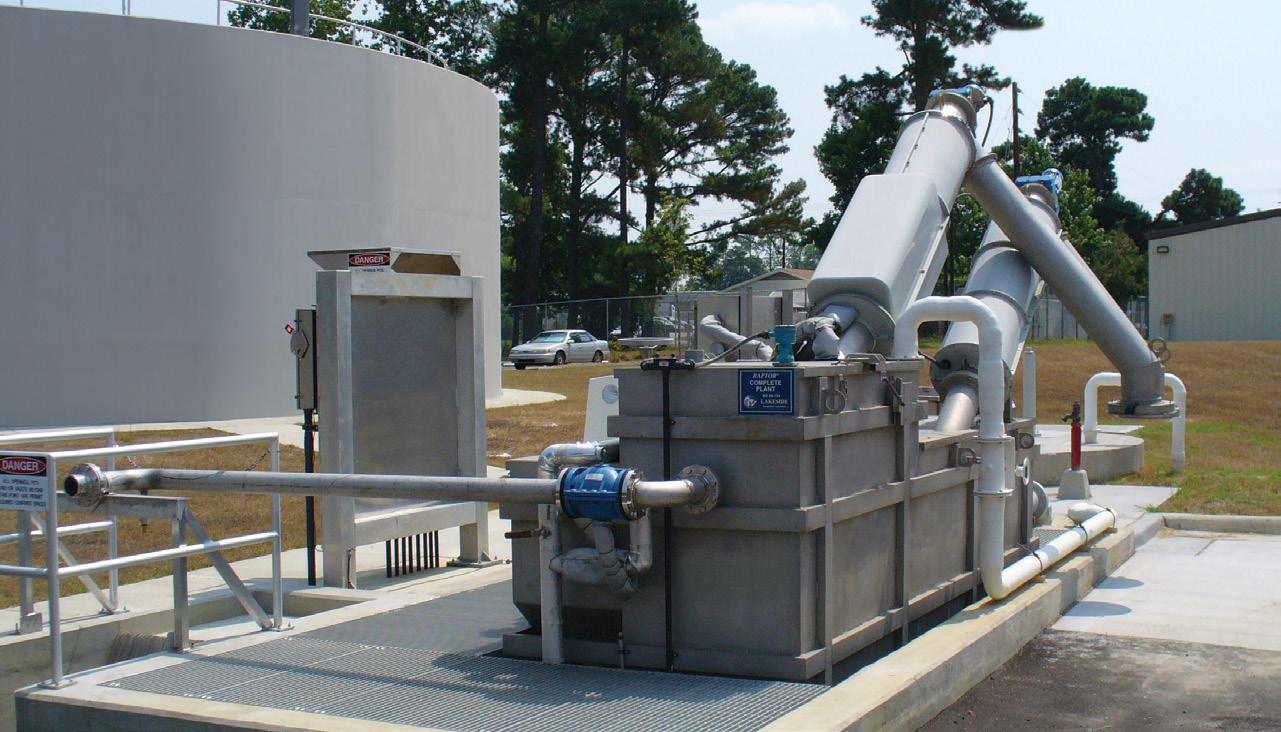
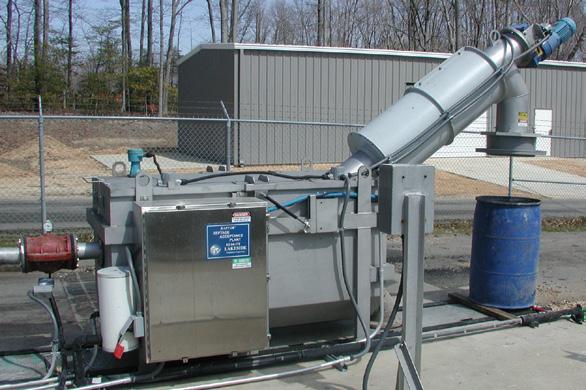
Grow your septage, FOG, and sludge receiving business with a Raptor Septage Acceptance or Complete Plant.
Florida Panhandle Only T: 205.424.7570 www.eshelmancompany.com
Raptor Septage Acceptance Plant
Removes debris and inorganic solids from municipal and industrial septage, FOG, and sludge. This heavy-duty machine incorporates the Raptor Fine Screen for screening, dewatering and compaction. Accessories include security access and automated accounting systems.
Raptor Septage Complete Plant
With the addition of aerated grit removal, the Septage Acceptance Plant is offered as the Raptor Septage Complete Plant.
Speak to one of our experts at 630.837.5640 or email us at sales@lakeside-equipment.com for more product information.
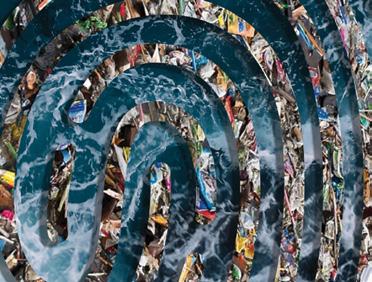
Innovative Research Provides Further Insights Into How Ocean Waves Form
Findings pave the way for improving wave forecasts, helping coastal communities become more resilient as they prepare for floods and storm surge
Scientists at the University of Miami’s Alfred C. Glassell Jr. SUrge-STructure-Atmosphere INteraction (SUSTAIN) Laboratory conducted a first-of-its-kind study into how waves form and increase in windy and hurricane conditions. The research, which reconstructs the two-dimensional profile of pressure and airflow above wavy surfaces, provides new insights into understanding ocean wave growth and its broader implications for weather forecasting and coastal resilience.
The research team simultaneously measured air pressure, airflow, and water elevation in a controlled environment, capturing up to 1,000 data points per second. By analyzing these data, they studied how different factors—wave height, wave frequency, and wind force—affect the movement of air and the transfer of momentum between the air and the ocean’s surface. The aim of the study is to understand how waves develop and how winds interact with the ocean in extreme weather conditions.
Building on these high-resolution measurements, the researchers used the advanced capabilities of the SUSTAIN windwave tank, which is capable of simulating Category 5 hurricane-force winds, to reconstruct the airflow patterns that drive wave growth in strong winds. By employing constant temperature anemometry to capture rapid airflow changes, particle image velocimetry to track the movement of air
and water, and multibeam imaging to map wave structures, they gained deeper insights into the dynamic interactions shaping ocean waves.
“Wind pressure acts like fuel for ocean waves—higher pressure pushes on the front of a wave, making it grow taller and move faster,” said Peisen Tan, the lead author of the study and a recent Ph.D. graduate of the University of Miami Rosenstiel School of Marine, Atmospheric, and Earth Science. “Measuring the pressure over the open ocean is extremely challenging. Our research conducted in SUSTAIN allowed us to document that wind speed alone can be used to estimate this pressure and predict wave growth.”
The researchers found that the traditional models (where the airflow adheres to the water) correctly predict over 90 percent of momentum transfer in airflow over water until separation occurs; however, when airflow separates on the leeward side of waves (blocked from the wind), these models underestimate momentum transfer by more than 30 percent.
“This study marks a significant step in understanding air-sea momentum transfer,” said Brian Haus, a professor in the Department of Ocean Sciences at the Rosenstiel School and a coauthor of the study. “Our experimental approach reconstructed the two-dimensional profile of pressure and airflow above wavy surfaces—an achievement that, to our
knowledge, is a first-of-its-kind breakthrough. These insights can help refine numerical wave models by incorporating airflow separation effects.”
The study, Wind-Wave Momentum Flux in Steep, Strongly Forced Surface Gravity Wave Conditions, was published in the American Geophysical Union’s Journal of Geophysical Research: Oceans in January 2025. The authors include:
S Peisen Tan, Brian K. Haus, Sanchit Mehta, and Sydney Wray, Rosenstiel School of Marine, Atmospheric, and Earth Science, University of Miami.
S Ivan Savelyev, United States Naval Research Laboratory, Washington, D.C.
S Nathan J. M. Laxague, Department of Mechanical Engineering and Center for Ocean Engineering, University of New Hampshire, Durham, N.H.
S Milan Curcic, Frost Institute for Data Science and Computing, University of Miami, Coral Gables.
S Silvia Matt, United States Naval Research Laboratory, Stennis Space Center, Hancock County, Miss.
S Christopher J. Zappa and Lamont Doherty, Earth Observatory of Columbia University, New York, N.Y.
Funding for the study was provided in part by the Office of Naval Research, Naval Research Lab base program unit 73-1Y91. S
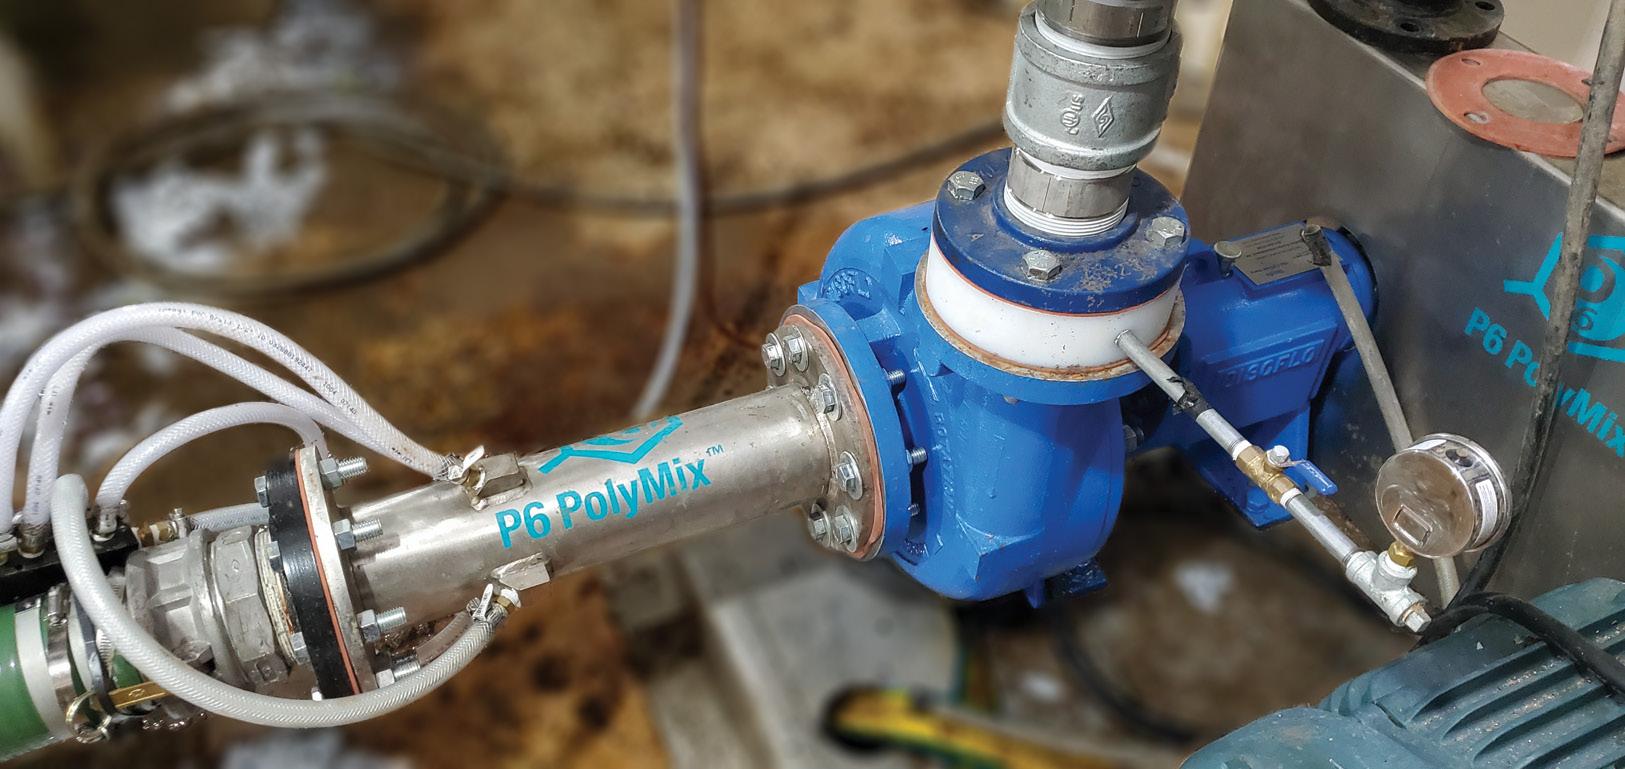
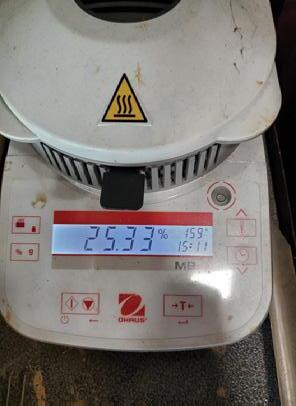
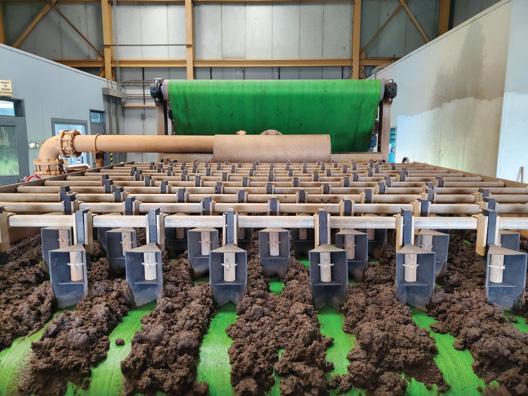
1. POLYMER REDUCTION: P6 PolyMix® Systems reduce polymer consumption by providing complete polymer/sludge mixing in a shear-sensitive manner. This patented mixing process allows long-strand polymer chains to remain intact and unbroken and wastewater floc to remain intact and unsheared. Typical applications result in a 25-50% REDUCTION IN POLYMER CONSUMPTION, thus saving the customer thousands of dollars in polymer expenses. By not breaking up the polymer chains, the dewatering equipment will experience less fouling, providing more reliability and reducing equipment cleaning costs.
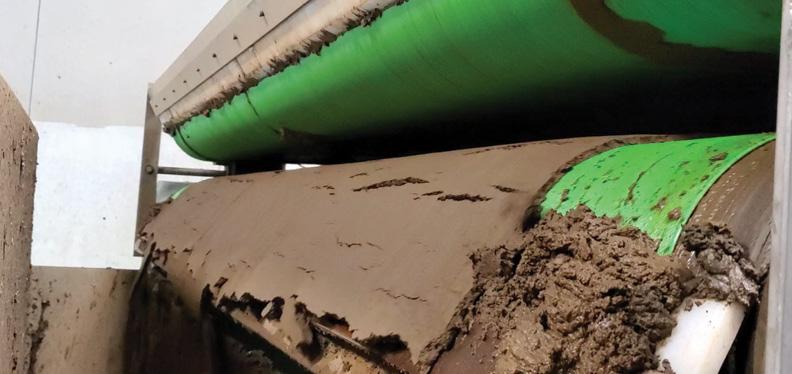
2. DRIER CAKE SOLIDS: P6 PolyMix® technology optimizes the polymer and sludge mixing process, allowing INCREASE DEWATERED SOLIDS CONCENTRATION and INCREASED PERCENT SOLIDS CAPTURED. This unique mixing process results in more efficient sludge hauling, allowing customers to transport less water and more dewatered cake off-site.
3. ELIMINATION OF PUMP MAINTENANCE: P6 PolyMix® technology reduces pump parts and maintenance by utilizing the abrasion-resistant Discflo pumping principles of Boundary Layer/Viscous Drag. This principle can save the customer thousands of dollars in parts and maintenance over the lifetime of the equipment. All P6 PolyMix® systems in the municipal market include a 10-YEAR (extendable to 20 years) 100% WET END WEAR WARRANTY, No other pump manufacturer in the industry provides a wear warranty, let alone a 20-year wear warranty!
4. PUMPS & MIXES: P6 PolyMix® technology uses the unique principles of Boundary Layer/Viscous Drag for mixing polymer versus a mixer/check valve; this, paired with its unique InjeX™ polymer injection mixing chamber, is designed for MINIMAL POLYMER DEGRIDATION, allowing for maximum polymer savings. The hydraulic shear forces within the mixing pump provide a complete homogeneous wastewater polymer slurry fed to the dewatering equipment without breaking the long chain polymers or reducing floc size.
5. LOWER OPERATING PRESSURE AND INSTALLED HORESPOWER: P6 PolyMix® technology dramatically reduces the operating pressure by reducing back pressure within the piping system due to eliminating mixer/check valves. In some applications, customers have had a 75% REDUCTION IN PRESSURE Lower pressure allows the feed pump to operate at lower horsepower. HORSEPOWER SAVINGS OF UP TO 50% OR MORE are possible by installing a P6 PolyMix® system. Customers can see substantial long-term energy savings and reduced upfront capital costs associated with lower installed horsepower.
6. HOW IS IT APPLIED: P6 PolyMix® systems entirely replace bulky, expensive, outdated traditional sludge feed pumps. You can now replace thousands of dollars in equipment and regain valuable real estate space by switching to P6 PolyMix® and utilizing its unique compact design, patented process for eliminating mixer/check valves, and ultra-efficient polymer mixing process. Contact us to learn how P6 PolyMix® can revolutionize the efficiency of your BELT FILTER PRESSES, GRAVITY BELT THICKENERS, ROTARY THICKENERS, SCREW PRESSES, AND CRENTIFUGES.
Rural and Small Systems Guidebook for Effective Utility Management
U.S. Environmental Protection Agency
Many rural and small systems throughout the Unites States face significant management and operational issues. These may include aging or inadequate infrastructure, recruiting and retaining qualified staff, growing or establishing financial reserves, and setting rates that are reflective of their operational costs and capital needs. The Rural and Small Systems Guidebook to Sustainable Utility Management (guidebook) from the U.S. Environmental Protection Agency (EPA) speaks to these challenges.
It’s an important part of a memorandum of agreement (MOA) signed by the U.S. Department of Agriculture (USDA) and EPA. Instituted in 2011, the MOA supports a series of activities to help rural and small water and wastewater systems more effectively provide sustainable services to the communities they serve.
The guidebook helps rural and small water and wastewater systems in their common
Why Should My System Use This Guidebook?
The information in this guidebook can help rural and small systems in several important ways:
• Giving you a simple and objective way to evaluate your system’s strengths and areas for improvement.
• Helping you develop an easy-to-follow plan for improving your operations based on your assessment.
• Helping you better communicate internally and with others, like board members and customers, about your system and its challenges.
• Help build the necessary support for improving your system over time.
mission to become successful and efficient service providers. Because of its dynamic nature, this resource can be used effectively in many different ways:
S By system managers, water systems operations specialists, and staff as a guide for taking actions leading to short- and long-term improvement to system management and performance.
S By technical assistance (TA) providers as they work with individual systems or groups of systems through workshops or other assistance efforts.
S As a resource for system improvement workshops.
S As a resource for guiding conversations about sustainability with utility board members.
S As a resource for communicating and educating utility board members on the importance of effective management.
Guidebook and Workshop in a Box
The guidebook is designed to introduce rural and small water and wastewater systems to the key areas of effectively managed systems. It provides background information on 10 key management areas, as well as instruction and assistance on how to conduct a system assessment process based on these management areas. It also includes information on how to prioritize areas for improvement while developing measures of progress that can help small systems with performance enhancement.
The guidebook is accompanied by a companion resource, Workshop in a Box: Sustainable Management of Rural and Small Systems Workshops. The workshop box is a toolkit for utilities, TA providers, water sector associations, and trainers who conduct their own workshops based on the principles presented in the guidebook. The workshop box provides guidance for workshop preparations, execution, and copies
of all materials to run a successful workshop on utility management improvement.
At each workshop, participants are given an introduction to the 10 key management areas and then asked to conduct a short self-assessment of their operations based on the management areas. Participants also identify management improvement opportunities at their systems based on the assessment. The workshop box further provides an opportunity for participants to share experiences from their systems to better understand how to implement improvements and establish a basis for working with staff and community members to operate more effectively. Participants are also introduced to a compendium of resources that can help them implement the improvements identified during the assessment.
The information presented in these two resources draws on the results of four pilot workshops conducted by EPA and USDA, and more than 140 workshops conducted by USDA, EPA, trainers and TA providers from across all 50 states. It also draws on feedback from managers of rural and small systems who attended those workshops, and feedback from the trainers and TA providers who have conducted the workshops. Additionally, several small systems and water systems operations specialists provided input as the resources were developed.
The guidebook begins by introducing the 10 key management areas of effectively managed systems. A self-assessment follows to help users identify their strengths and challenges and to prioritize where to focus improvement efforts. It ends by discussing improving outcomes in the 10 areas. The guidebook conveys what constitutes high achievement in each area and identifies resources for small systems. The overall approach and steps described in the guidebook are similar to the approach in another initiative, Effective Utility Management (EUM). The EUM has been supported by EPA and several major water sector associations since 2008 and has been used
successfully by medium and larger utilities. The guidebook takes the approach embodied in EUM and adapts it for the needs of rural and small water and wastewater systems.
The Sustainably Managed Utility: 10 Key Management Areas
The 10 key management areas of sustainably managed utilities described help rural and small water and wastewater system managers address many ongoing challenges and move toward sustainable management of both operations and infrastructure. In aiming to increase their long-term sustainability and effectiveness, the eventual goal for systems is high achievement, consistent with the needs and expectations of their communities, in each of the management areas.
The management areas were developed by drawing on information and experience from a wide range of rural and small water system operations specialists and managers from across the U.S. The management areas were further validated through the workshops held with rural and small systems, sponsored by EPA and USDA. Each management area is described as a desirable outcome for a system to achieve. Each can be considered a building block for improving system performance. Through working to improve performance in each of the 10 areas, managers can help their systems to become more successful, resilient, and sustainable for the long term.
The management areas are not presented in the guidebook in a specific order. Together they make up the framework for a complete and well-rounded management approach. By making improvements in any of the areas, at a pace consistent with its most pressing challenges, a system will be able to deliver increasingly efficient, higher-quality services. All areas are equal in the context of the guidebook.
System Improvement Priorities: Self-Assessment
A candid and comprehensive self-assessment is the first step in identifying where a system
rural and small systems identify their strengths and challenges to prioritize where efforts and resources should be focused. It can be completed by a number of different individuals within a utility (managers and staff), or as a team exercise among management, staff, and external stakeholders, such as board members or customers (if appropriate). As an internal team exercise, it’s recommended that all participants complete the assessment on their own, followed by a group discussion about the similarities and differences in results. Although the utility may use the assessment in a number of ways, the goal for all systems should be high achievement, consistent with the needs and expectations of their communities, in each of the management areas.
The self-assessment has three steps:
S Rate achievement for each management area
S Rank the importance of each management area
S Plot results to identify critical areas for improvement
Once completed, the self-assessment exercise can help your system develop a plan for improving management area performance.
Improving Outcomes
To create a successful sustainable management improvement plan, it’s important to have at least a basic understanding of the following items:
S What it means to accomplish “high achievement” in each area.
S The changes a system will need to make to reach this level.
S The challenges that may arise for each management area.
S How to track performance and progress.
This section of the guidebook is designed to help systems develop a strategy for addressing each of these components to become more sustainable and resilient.
10 Key Management Areas
• Product Quality
• Customer Satisfaction
• Employee and Leadership Development
• Operational Optimization
• Financial Viability
• Infrastructure Stability
• Operational Resiliency
• Community Sustainability and Economic Development
• Water Resource Adequacy
• Stakeholder Understanding and Support
How to Succeed in Each Management Area: High Achievement and Common Challenges
Once a system has decided to improve its performance in one or more of the key management areas, the next step is to develop and implement a plan. To create a plan, it’s important to have an idea of what challenges may arise, and what practices can be adopted to address each area.
Found in the guidebook are overviews of challenges and effective practices for five management areas. These areas were discussed in-depth at the small system workshops that served as background for the guidebook. Also included are examples of performance measures for each management area.
It’s important to determine if there external resources that can support the improvement of performance in the management areas.
Creating a Plan
Having gained a more complete understanding of strengths and challenges based on the self-assessment and an idea of what actions can strengthen performance in
Continued on page 12
the management areas, a system will be better equipped to develop an effective and sustainable management improvement plan. Where feasible it’s useful for a single staff member, or “champion,” to have responsibility of overseeing improvement plan development. Various staff members and managers, however, should be involved in its creation, if possible. In drafting a plan, the utility should create specific tasks for addressing its targeted improvement areas, and identify adjustments necessary to make the desired changes.
After completing the self-assessment exercise, the system will select priority improvement areas. The sustainable management improvement plan should be simple, specific, realistic, and complete. The guidebook contains references for a wide range of resources covering all of the management areas. These resources will be useful for identifying the options you have for undertaking management area improvements.
For each improvement action that you identify, the plan should include the following components:
S An easy-to-understand, but still thorough, description of what actions will be taken.
Questions to Consider for Each Management Area
• What will constitute “high achievement” in this area?
• What factors have led to performance gaps in this area?
• What changes will my utility need to make to improve performance?
• Who will need to be involved for changes to take place?
• How will my utility track performance progress?
• What will be the biggest challenges to performance improvement?
S Identification of who will be responsible for taking the action.
S Known resources already on-hand or needed to complete the actions (financial, informational, or other).
S Identification of key challenges that will need to be addressed.
S A timeline with key milestones for the actions in the plan and a date by when the plan will be completed (or acknowledgment if it’s ongoing).
S A review loop to periodically assess progress in implementing the plan and adapting it to changing conditions, e.g., implementing a new billing system, measuring the efficiency of the system as implemented, or refining the system based on the information from the performance measures.
The utility can create its own action plan format based on its needs and circumstances, or use the worksheet in the guidebook. A sustainable management improvement plan does not have to be long or even perfect. What’s most important is that the utility has a plan in place and that it sticks with it!
How You Can Take Action
Results of the self-assessment exercise can be implemented in many different ways to accommodate an individual utility’s regular nearand long-term planning processes. For utilities that are just getting started with planning, or for those that would like to take immediate action outside of their normal planning cycle, example timelines are in the guidebook.
Measuring Progress
As a part of the review loop built into an action plan, the system must determine how to track progress toward achievement of performance goals. For rural and small systems, it’s most feasible to measure internal
performance, rather than trying to gather external data needed for more complex evaluations. Some measurements to consider are included in the “How to Succeed in Each Area” section of the guidebook. It’s important to remember that performance measures should be tailored to the specific needs and goals of each system.
Some points to keep in mind when selecting performance measures include:
S Select the right number, level, and type of measures for the utility’s capabilities and capacity. As a general rule, having a short list of measures is probably best.
S Measuring performance will require some level of resource commitment. Resources can include money, time, and personnel.
S Develop clear and consistent definitions for each measure. How will they be tracked and reported?
S Set reasonable targets based on criteria, such as performance and improvement in previous years or customer expectations. How quickly does the community expect projects to be completed?
S Develop a process for evaluating and responding to the results of measuring progress. Now that the utility knows how it’s doing, how will it use this information to continue to improve its performance?
S Select measures that support the system’s short- and long-term goals. How do these measurements fit into the “big picture” of the utility?
S Periodically report on progress to the board and other key stakeholders in the community.
S Recognize and celebrate progress along the way!
Assessing Accomplishments and Making Improvements
Having created a structure for measuring progress toward meeting improvement goals, a system will need to complete the third step in the review loop: assessing accomplishments (or pitfalls) and making adjustments as needed. Setting aside time on a quarterly, biannual, or annual basis to discuss the progress that has been made toward key management goals is one of the simplest—yet most important—actions that a system can take. By addressing the key questions and modifying the improvement plan on a regular basis, a system will keep the goals— and itself—up to date on current issues and on the path to being a more resilient, sustainable system.
For the complete guidebook go to www. epa.gov.
S
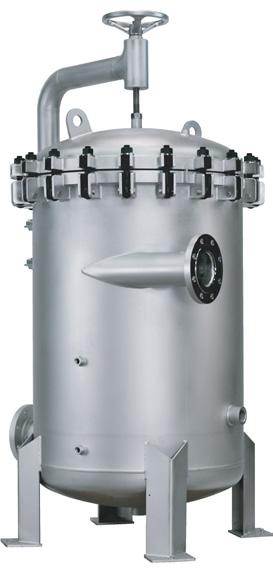
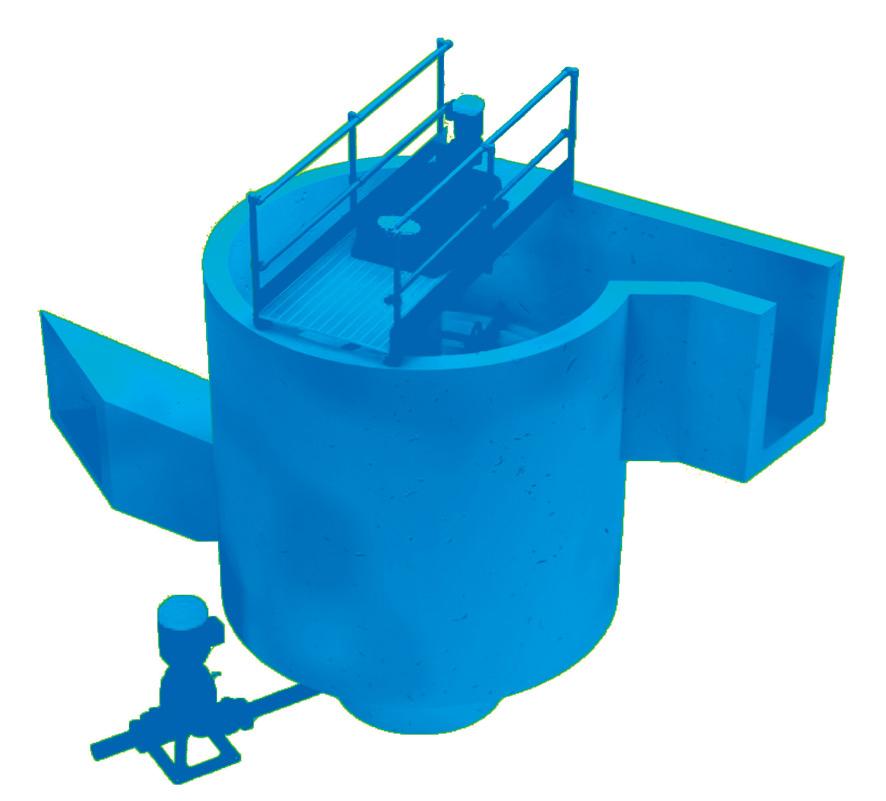
Retrofit Lime Softening and Reduce Waste
Veolia's ACTINA™ Pellet
Softening technology is a compact, robust, and reliable softening system for the removal of calcium hardness, iron, and manganese. This system features no mechanical components inside of the reactor, making it easy and cost effective to operate.
Saving energy, there is no additional waste or sludge thickening/dewatering needed. Waste pellets can be repurposed or disposed of in multiple ways, leading to increased global ecological transformation.
Actina™ is exclusively represented in Florida by MTS Environmental.
Bob Bierhorst Wesley Chapel, FL 813-760-5508
Wade Wood P.E. Tampa, FL 321-299-2395
Eric Peters P.E. Lakewood Ranch, FL 941-773-5051
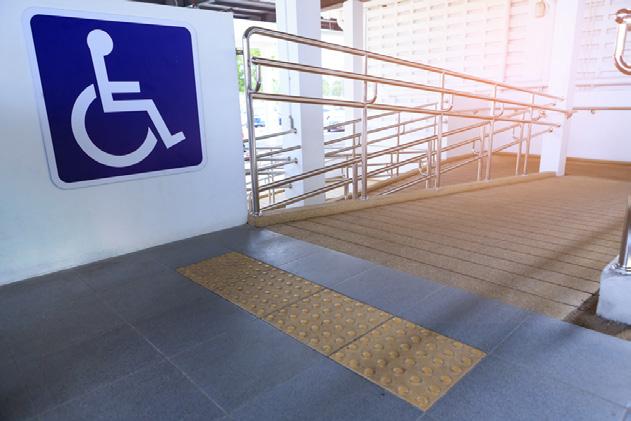
LET’S TALK SAFETY
This column addresses safety issues of interest to water and wastewater personnel, and will appear monthly in the magazine. The Journal is also interested in receiving any articles on the subject of safety that it can share with readers in the “Spotlight on Safety” column.
Walk—and Work—on the Mild Side: Avoiding Slips, Trips, and Falls
Aslip, trip, or fall at work can lead to injuries—and even death. According to the 2022 edition of the National Safety Council’s “Injury Facts,” injuries from these kinds of accidents resulted in more than 250,000 cases involving days away from work, and 865 workers died. These sobering statistics are a stark reminder that workers need to know how to prevent slips and trips.
Construction workers are most at risk for fatal falls from heights—more than seven times the rate of other industries—but falls can happen anywhere, even in the office at a desk job.
Water and wastewater utilities, by their nature, have many potential hazards that can cause slips, trips, and falls. These include slippery surfaces from water or liquid chemicals, and tripping hazards, such as hoses, power cables, and irregular surfaces. These types of incidents account for 15 percent of all accidental deaths and are the cause of 25 percent of all reported on-the-job injuries.
Reasons for Slips
Slips occur when there is too little friction
or traction between feet (footwear) and the walking or working surface, resulting in a loss of balance. Surfaces and situations that can cause slipping include the following:
S Metal surfaces, such as ramps and gang planks
S Mounting and dismounting vehicles, ladders, and equipment
S Loose, irregular surfaces, such as gravel
S Highly polished or waxed floors
S Transitioning from one surface to another, such as concrete to tile
S Sloped, uneven, or muddy walking surfaces
S Loose, unanchored rugs or mats
S Loose floorboards or shifting tiles
S Wet, muddy, or greasy shoes
S Dry product or wet spills
S Natural hazards, such as ice, sand, leaves, and other plant debris
Reasons for Trips
Trips happen when the moving foot of a person strikes an object, causing loss of balance. Situations and materials that contribute to trips include the following:
S Uncovered hoses, cables, wires, or extension cords across aisles or walkways
S Clutter or obstacles in aisles, walkway, and work areas
S Open cabinet, file, or desk drawers and doors
S Changes in elevation or levels—as little as a quarter-inch difference can cause a trip
S Unmarked steps or ramps
S Rumpled or rolled-up carpets or mats, or carpets with curled edges
S Irregularities in walking surfaces
S Thresholds or gaps
S Missing or uneven floor tiles and bricks
S Uneven surfaces or objects protruding from walking surfaces
S Environmental conditions, such as poor lighting, glare, shadows, excess noise, or temperature
S Bulky personal protective equipment, including improper footwear
Reasons for Falls
The Centers for Disease Control and Prevention states that falls can happen in all occupational settings, and circumstances
associated with fall incidents in the work environment can involve the following:
S Slippery, cluttered, or unstable walking/ working surfaces
S Unprotected edges
S Floor holes and wall openings
S Unsafely positioned ladders
S Misused fall protection
To reduce the risk of falling at work, the Occupational Safety and Health Administration (OSHA) recommends paying attention to your surroundings and walking at a pace that’s suitable for the surface you’re on and the task you’re performing. Additionally, walk with your feet pointed slightly outward, make wide turns when walking around corners, and always use the handrails on stairs.
Know Your Surroundings: Institutional Control Measures
Inadequate awareness of irregularities is a major contributor to most accidents. The human factor may be exacerbated by illness, poor vision, medications, or fatigue. Tripping and slipping can also be the result of carrying or moving cumbersome objects or too many objects at one time; walking while distracted by food, or cellphones or other handheld devices; taking unapproved shortcuts; and rushing.
There are many things that a company’s management and workers can do to ensure a safer workplace, including the following:
S Practice good housekeeping; maintain clear, tidy work areas free of clutter.
S Contain work processes to prevent discharge, splatter, or spillage of liquids, oils, particles, and dust onto walking surfaces.
S If obstacles can’t be moved, mark them and reroute traffic around them.
S Secure all electrical and phone cords out of traffic areas; tape them to the floor or place them beneath a ramp.
S Keep work areas, aisles, stairwells, and pathways well lit.
S Mark or highlight step edges and transition areas (changes in elevations) with reflective tape and/or signage.
S Install slip-resistant floors in high-risk areas.
S Provide hand rails along narrow or uneven walkways and stairs.
S Provide effective drainage on work platforms.
S Keep aisles and passageways clear of obstructions and in good repair.
S Clear outside areas of natural hazards, such as leaves, loose gravel, and snow. Treat slippery surfaces, such as ice, with sand or salt.
S Ensure that mats and carpets have nonskid backing and the edges aren’t curling up.
S Install warning signs or hazard cones in areas prone to slipping, tripping, and falling hazards.
Footwear Makes a Difference
Worn out, inappropriate, or improperly fitting footwear is responsible for about 25 percent of slip and fall accidents. Oversized shoes allow the foot to slide and lose contact inside the shoe. This increases the risk of heels catching the edge of a stair tread and reduces the ability to regain control if the shoe slides on a slick surface.
People walk heel first, so make sure to check shoe heels for signs of wear. Badly worn heels are particularly risky; as the heel material wears away, a hard, smooth surface (often plastic or wood) is exposed and becomes the first point of contact with the floor.
Flat-soled shoes help reduce slips and falls
by maximizing the surface area in contact with the floor and minimizing the risk of catching or tripping on a stair tread; for example, shoes with a two-inch raised heel reduce contact with the floor by 40 percent.
For snowy conditions, shoes or boots with hard rubber soles and deep cleats are appropriate; however, they do not perform as well indoors. Slip-resistant shoes for wet or oily surfaces feature a multidirectional tread pattern to minimize hydroplaning and a softer rubber sole to help grip hard-surfaced floors.
Personal Control Measures
All workers should take these steps every day and at all times for a safer workplace:
S Follow safe routes—no shortcuts!
S Don’t wear sunglasses in low-light areas.
S Don’t carry items that obstruct your view.
S Use guardrails and handrails.
S Slow down and pay attention to where you are walking!
Resources
For more information, see OSHA’s recommendations on slips and falls at www. osha.gov/SLTC/etools/hospital/hazards/slips/ slips.html, or visit the National Safety Council website on fall prevention at www.nsc.org/ safety_home/HomeandRecreationalSafety/ Falls/Pages/Falls.aspx. S
Florida Section AWWA Regions IV, V, and VI: Empowering Our Water Community
ALisa Wilson-Davis Chair, FSAWWA
s part of my continued focus on highlighting the incredible work being done across our Florida Section American Water Works Association (FSAWWA) regions, this month’s column shines a spotlight on Regions IV, V, and VI— three dynamic regions powering technical innovation, community engagement, and professional growth throughout central and south Florida.
From award-winning water quality to record-setting outreach events, the volunteers in these regions exemplify the mission of FSAWWA. Their efforts are not only strengthening our water community at the local level, but also building momentum for statewide and national impact.
As an added bonus, this edition also includes a special feature on our Water Utility Council’s joint Tallahassee Fly-in with the Florida Water Environment Association Utility Council (FWEAUC) and participation in the annual AWWA Washington, D.C., Fly-
In—an important advocacy event where water professionals from across the Unites States convene to meet with congressional members on the critical challenges facing our industry.
History
Every year, the incredible volunteers serving on the Region IV, V, and VI boards organize dozens of regional events in support of FSAWWA’s mission of “uniting the water community and providing solutions to effectively manage water, the world’s most important resource.” These dedicated groups serve and support FSAWWA members across a broad swath of central and south Florida.
Region IV: Citrus, Hernando, Hillsborough, Pasco, Pinellas, Polk, and Sumter Counties
Chair: Mike Condran
Region V: Collier, Hendry, and Lee Counties
Chair: Reshma Thummadi, P.E.
Region VI: Broward and Palm Beach Counties
Chair: Emeliz Torrez
As 2025 gets underway, each region is building on decades of leadership and service by hundreds of volunteers. Their boards— comprised of officers, committee chairs, and engaged members—deliver a steady stream of technical training, outreach, fundraising, and networking events for FSAWWA members and the broader community.
The boards of Regions IV, V, and VI are composed of a diverse mix of utility professionals, engineers, manufacturers, contractors, and students. Each volunteer brings unique energy, expertise, and passion to events that serve both industry professionals and the public.
Key regional highlights include:
Region IV
S A 35-member board supports 15 active committees and five officers
S Signature events include the Model Water Tower Competition and the Best Tasting Drinking Water Contest
S Known for broad community engagement and professional development opportunities
Region V
S Emphasizes workforce development and operator training
S Hosts continuing education unit (CEU)earning technical workshops and plant tours
S Partners with local schools for utility open houses and outreach
Region VI
S Known for outreach, coastal cleanups, and developing a partnership with Florida Atlantic University
S Hosts signature events like Beer for Us, Water For People, and the annual Caribbean and Florida Link Up
S Recent expansion of the board with defined leadership roles and new committee initiatives
Regional Events in Action
Region IV
As 2025 continues, the region is building on decades of a legacy established from many hundreds of volunteers who have preceded the current Region IV board members. This legacy has evolved to its current organization of 15 standing committees, each with a chair and a vice chair, and led by five officers. Together they annually organize and host approximately 30 events relating to technical training, community outreach, charitable fundraising, and professional networking that support our FSAWWA members and the community at large.
Highlights include:
S A Technical and Education Committee lunch meeting on artificial intelligence applications in utility management
S A member appreciation Tampa Bay Lightning hockey game
S Three Young Professional (YP) events (plant tour, beach cleanup, networking)
S The Model Water Tower Competition (over 125 students)
S The 6th Annual Fishing Tourney
Eddy, AWWA mascot, in D.C. enjoying the water!
Upcoming Region IV events include:
S Technical and operator workshops
S Water For People fundraiser
S PE roundtable
S YP events
S The 20th annual charity golf event
Region V
This region emphasizes hands-on training and student engagement. Events include:
S Operator training workshops and CEU seminars
S Joint utility open houses with local high schools
S Annual fishing and golf tournaments
S Florida Water Festival participation
Region VI
The 2025 calendar launched with a Region VI volunteers kick-off on February 20, where officers and committee leaders were confirmed:
Officers
Chair: Emeliz Torres
Past Chair: Kara Mills
Secretary/Treasurer: Ryan Kleinkort
Committee Chairs
Newsletter: Angie Ruiz
Technical and Educational: Angie Ruiz, Ryan Kleinkort, and Augustine Alvarez
Special Events: Ana Delarme Salome and Angela Giuliano
Model Water Tower Competition: Tatiana Largaespada and Catherine Hernandez
Best Tasting Drinking Water Contest: Angie Viloria, Kara Mills, Tyler Davis, and Ranthus Fouch
Planned 2025 events include:
S Water conservation poster contests with local elementary schools
S Joint FWEA Southeast Chapter events
S Beer for Us, Water For People fundraiser
S Training sessions and “Lunch and Learns” (one for operators)
S Broward County Water Matters Day
S Annual Caribbean and Florida Link Up
Fun Facts
S Regions IV, V, and VI represent nearly 50 percent of the Florida Section’s total membership, with over 1,200 active members.
S Region IV produced back-to-back statewide Best Tasting Drinking Water Contest winners in 2023 (Citrus County) and 2024 (Zephyrhills)—both of whom
went on to represent Florida at the national contest held during the AWWA Annual Conference and Exposition (ACE).
S The Region V CEU events regularly draw more than 100 attendees, reflecting a strong commitment to operator education.
S In 2024, the Region VI “Beer for Us, Water For People” fundraiser set a new donation record, thanks to strong community partnerships and member support.
Powered by Sponsors
Across all three regions, more than 100 regional sponsors play a crucial role in making these events possible. Their support helps fund education, outreach, and community giving—supporting national initiatives like Water For People, Water Equation, and the Roy Likins Scholarship Fund.
Advocating for Florida’s Water: The Role of the FSAWWA Water Utility Council
The FSAWWA Water Utility Council (WUC) plays a pivotal role in advancing the section’s mission to address the evolving challenges facing Florida’s water utilities. As a cornerstone of FSAWWA’s strategic plan, the WUC works to strengthen the section’s engagement, credibility, and effectiveness with legislators and regulatory agencies— serving as the voice of Florida’s water
professionals at both the state and national levels.
The WUC’s mission is clear: to actively engage with regulators, state legislators, and members of Florida’s congressional delegation on critical issues affecting water utilities. Through strategic advocacy and education, the WUC ensures utilities remain informed, prepared, and represented when it matters most.
A key element of this effort is participation in legislative Fly-Ins from Tallahassee to Washington, D.C., where WUC members meet face to face with lawmakers to share real-world insights and policy recommendations. These conversations help shape more-informed legislation while reinforcing the essential role of local utilities in delivering safe, reliable drinking water.
At the state level, the WUC also partners with influential organizations, such as the Florida League of Cities and the Florida Association of Counties to amplify its impact and broaden its coalition.
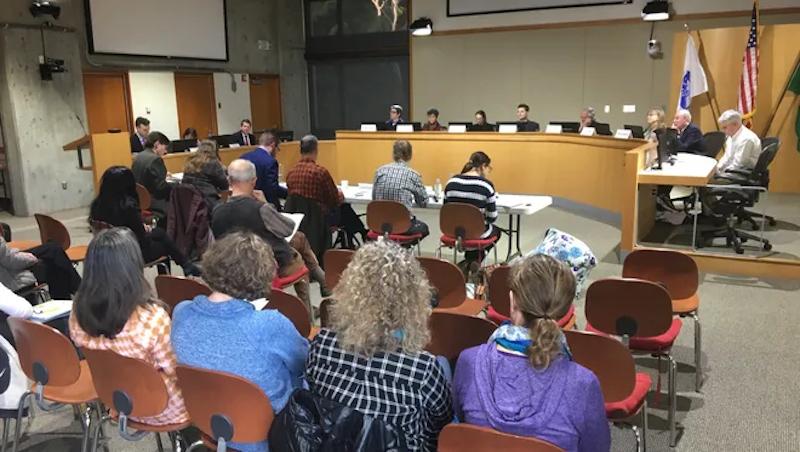
State-Level Engagement: 2024 Tallahassee Fly-In
On February 11, WUC and FWEAUC members traveled to the Florida Capitol to meet with more than 55 state legislators and/ or their staff. These meetings centered on pressing issues including:
S Lead and Copper Rule compliance
S Fluoride discussions and misinformation
S Per- and polyfluoroalkyl substances (PFAS) regulation and impacts
Continued on page 18
Attendees at the kick-off meeting!
Continued from page 17
S Infrastructure funding needs
To support these conversations, fact sheets on tap water, asset management, and potable reuse were distributed, reinforcing key messages with concise, credible information.
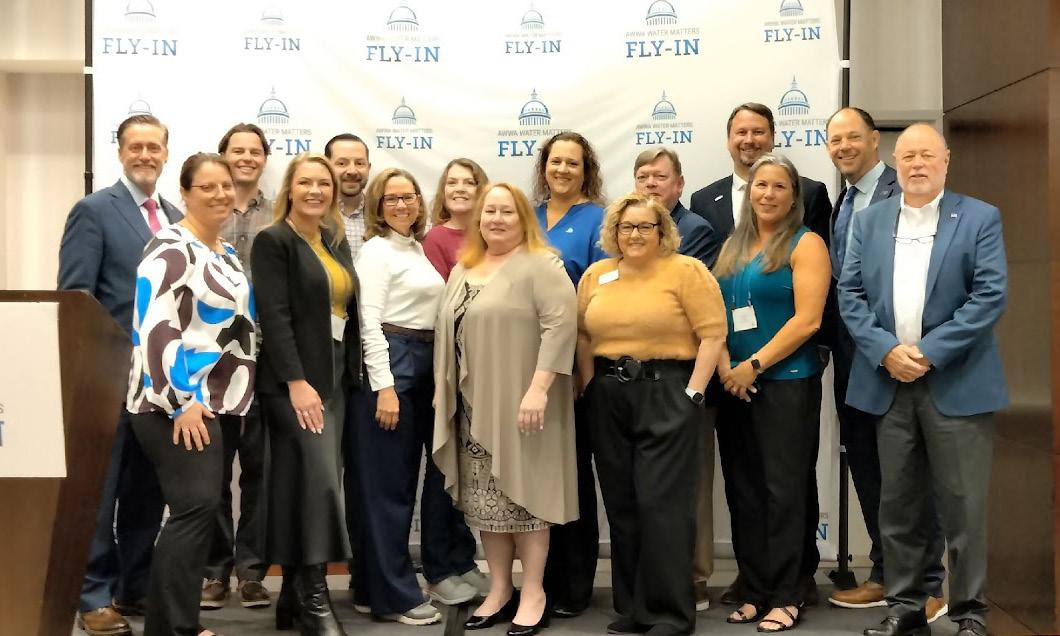
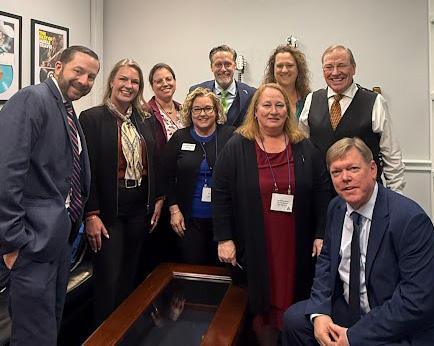
National Advocacy: 2025 AWWA D.C. Fly-In
From April 7 to 9, a delegation of 18 Florida Section members joined water professionals from across the country in
Washington, D.C., for the Annual AWWA D.C. Fly-In—held in conjunction with Water Week 2025. Despite the frigid 29-degree wind chill, Florida’s team visited every congressional office representing the state and held more than 15 meetings with members of Congress and staff. Leading the Florida delegation, Monica Wallis, chair of the Water Utility Council, and Michele Duggan, chair of the Water Utility Council Legislative Committee, also served as key coordinators for the visit.
Key federal policy asks included: S Invest in the Nation’s Water Infrastructure • Fully fund the Drinking Water State
Revolving Fund (DWSRF) and the Clean Water State Revolving Fund (CWSRF) at $3.25 billion each.
• Provide at least $65 million for the Water Infrastructure Finance and Innovation Act (WIFIA).
• Do not use the State Revolving Funds to fund congressionally directed spending.
S Protect Water Systems and Ratepayers From PFAS Cleanup Costs
• Support H.R. 1267, the Water Systems PFAS Liability Protection Act, bipartisan legislation introduced by Reps. Marie Gluesenkamp Perez and Celeste Maloy to ensure that PFAS manufacturers and
Left to right in front are Tyler Tedcastle, Cara Elliot, Kim Kowalski, Lisa Wilson-Davis, and Kevin Carter. Shea Dunifon, Rob Williamson, Monica Wallis, and Rep. Neal Dunn are in the back row.
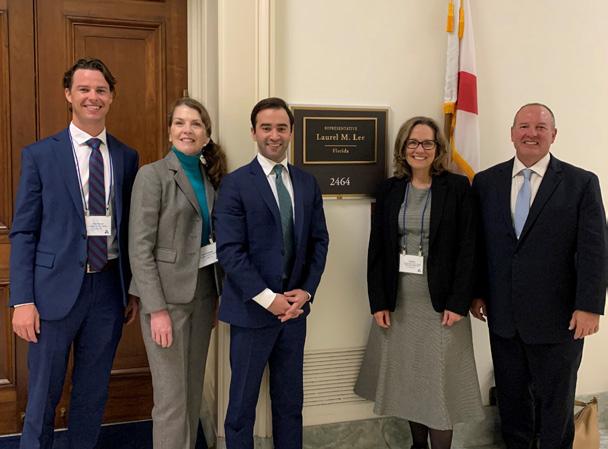
Pictured (left to right) are Drew Boylson, Michele Duggan, Landon Hoffman, Lisa Rhea, and Matt Wotowiec.
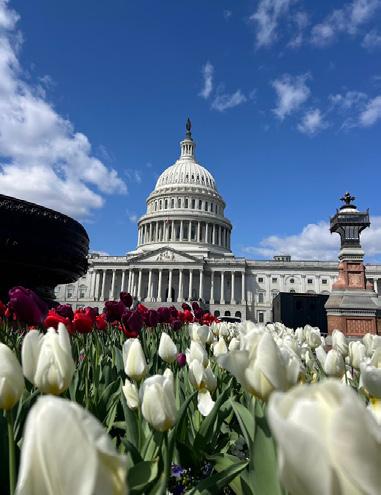
U.S. Capitol building.
Front row (left to right) are Shea Dunifon, Cara Elliot, Lisa Rhea, Lisa Wilson-Davis, Kim Kowalski, Terri Holcomb, and Richard Anderson. Back row (left to right) are Rob Williamson, Drew Boylson, Tyler Tedcastle, Michele Duggan, Moncia Wallis, Kevin Carter, Alan Garri, and Shay Hill.
polluters pay to clean up environmental PFAS contamination. Our own Rep. Neal Dunn is a cosponsor of this important legislation.
S Support a Collaborative Approach to Cybersecurity in the Water Sector
• Support reintroduction of the Water Risk and Resilience Organization (WRRO) Establishment Act, which is bipartisan legislation ensuring water professionals have a voice in federal cybersecurity planning.
S Support a Permanent Low-Income Household Water Assistance Program
• Advocate for and support the permanent Low-Income Household Water Assistance Program (LIHWAP) within the Department of Health and Human Services.
Collaboration Through Water Week
This year’s Fly-In was held alongside Water Week 2025, a collaborative effort among U.S. associations, including National Association of Clean Water Agencies, Association of Metropolitan Water Agencies, Water Environment Association, Water Research Foundation, and WateReuse Association. More than 700 water sector leaders gathered in D.C., including utility executives, engineers, elected officials, and regulators.
Highlights included:
S The Water Week Policy Forum, featuring remarks from U.S. Environmental Protection Agency (EPA) leadership (including Jessica Kramer, nominee for assistant administrator for water), Sen. Mark Kelly (D-Ariz.), and Rep. Jared Huffman (D-Calif.) on national water policy.
S The Water Week Joint Reception hosted at the headquarters of DC Water, the local water utility, providing valuable networking and cross-sector engagement.
Whether in Tallahassee or Washington, D.C., the WUC remains a trusted and effective advocate for Florida’s water utilities. By sharing local knowledge, elevating key issues, and building meaningful partnerships, the WUC ensures that the voice of our industry is heard where it counts most.
Together with our section members, volunteers, and allies, the WUC continues to strengthen Florida’s position as a leader in water quality, sustainability, and responsible infrastructure investment.
Wrapping It All Up
From grassroots events in our local communities to high-level advocacy on Capitol Hill, these stories reflect the full spectrum of how FSAWWA is working to protect, promote, and advance our water resources. The dedication of volunteers across Regions IV, V, and VI serves as a powerful reminder that our collective impact begins at the regional level—where innovation, education, and service intersect to support the greater good.
At the same time, our presence at the
AWWA Annual D.C. Fly-In underscores the importance of raising our voices nationally to ensure sound policy and funding support for water infrastructure, workforce development, and environmental protection.
Whether organizing a Model Water Tower Competition or meeting with members of Congress, Florida Section members continue to lead with purpose, passion, and professionalism.
Thank you to everyone who makes this work possible—you are the heart of our water community. S
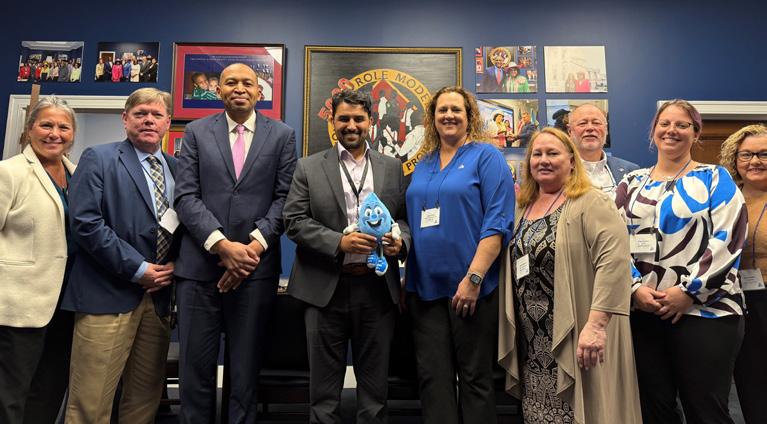
Left to right are Terri Holcomb; Kevin Carter; Derron Bennette; Majeed Alrefaie, Rep. Frederica Wilson’s water policy staff member; Monica Wallis; Lisa Wilson-Davis; Richard Anderson; Shea Dunifon; and Kim Kowalski.
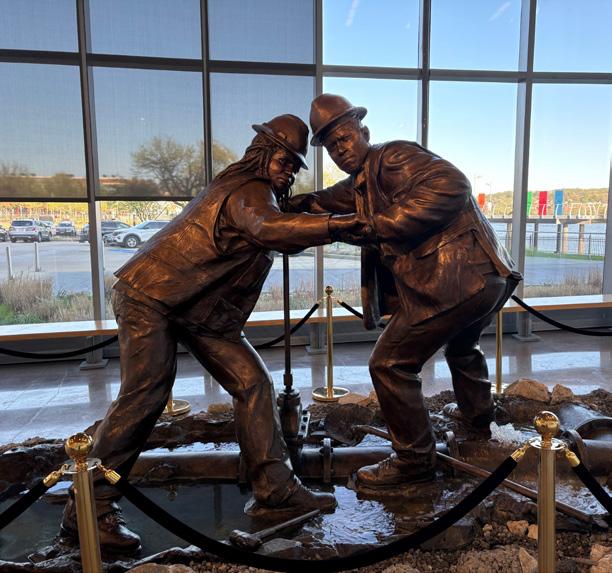
“Water Heroes” statue at DC Water headquarters.
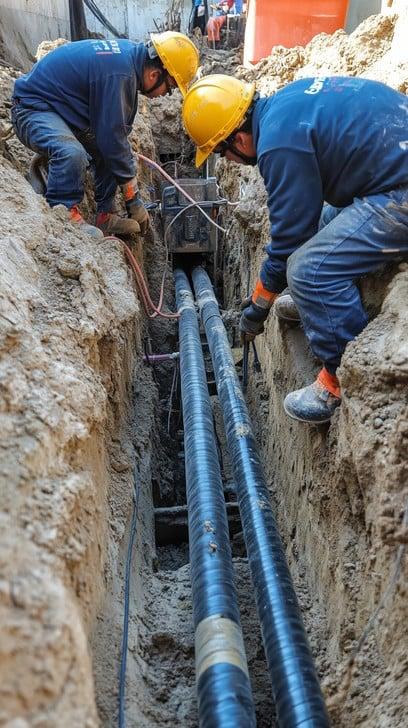
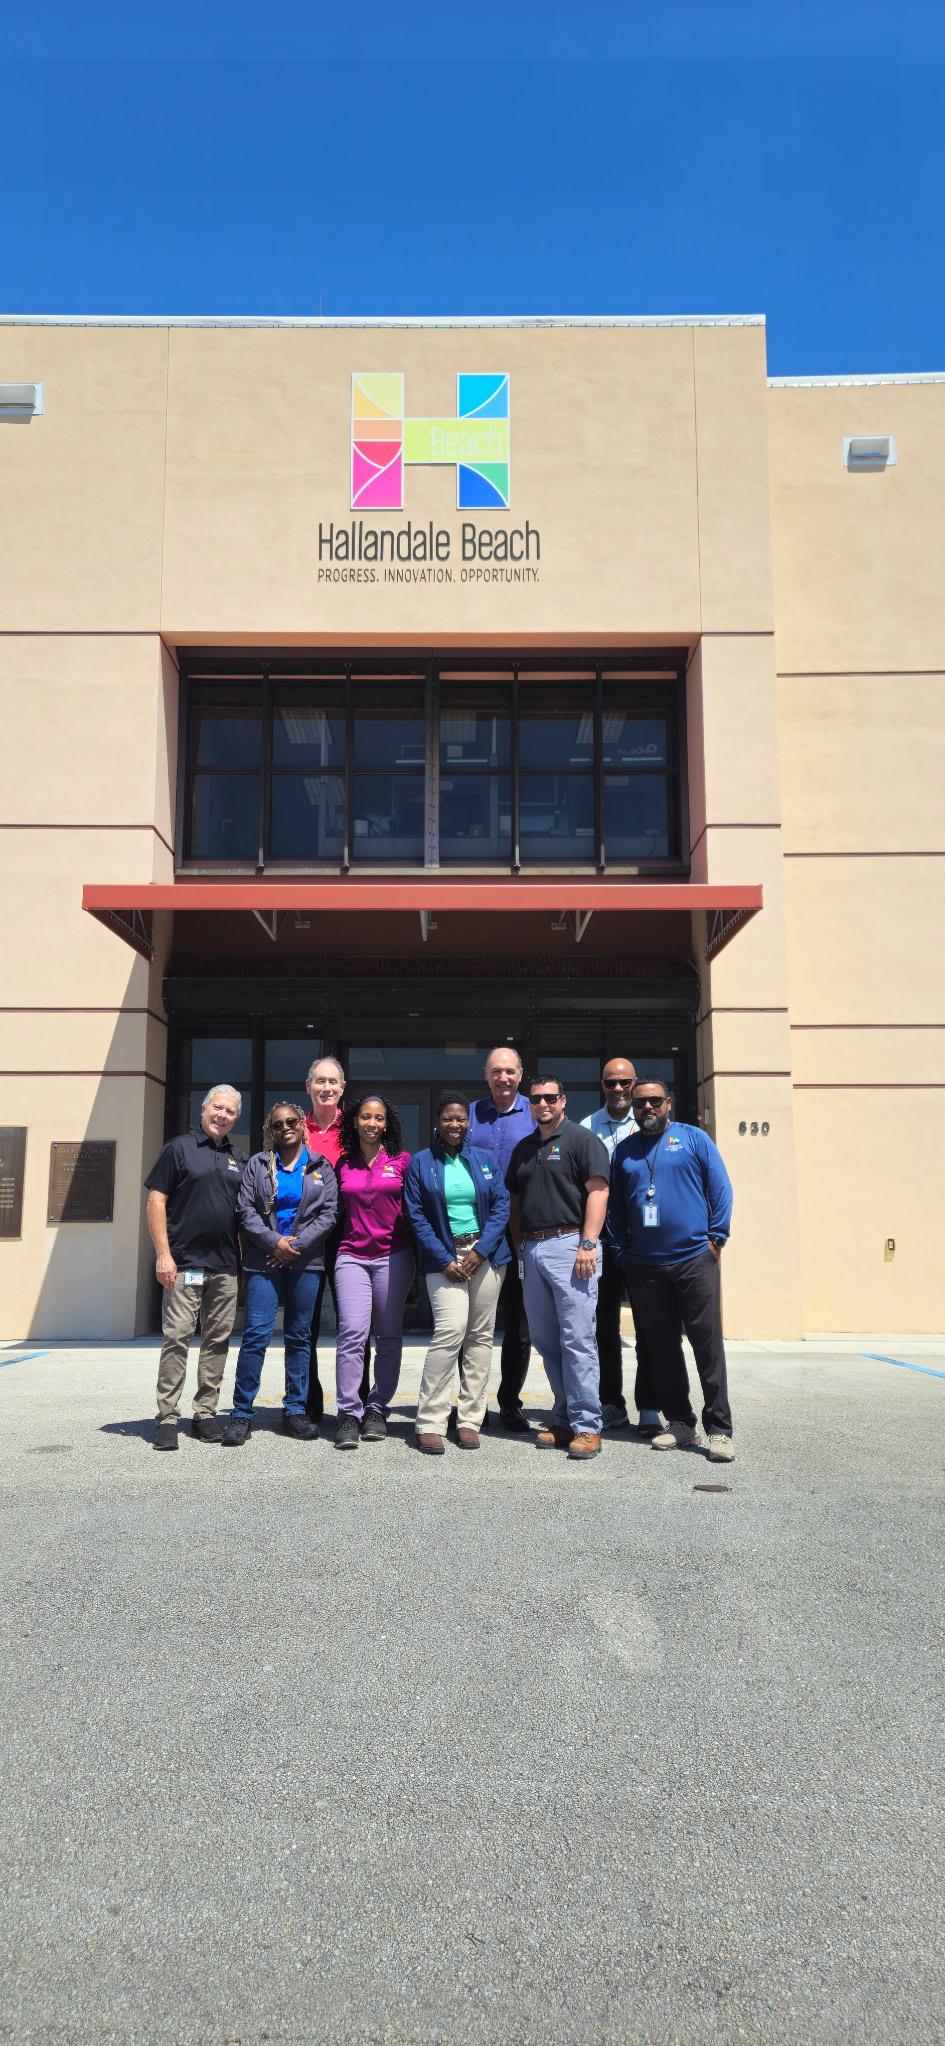
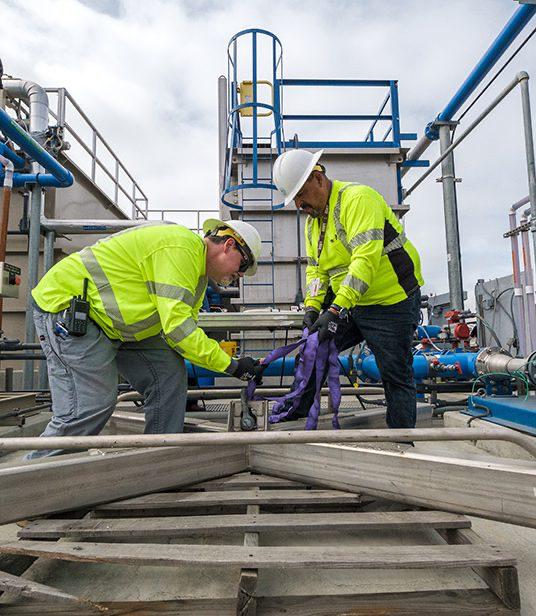
Revitalizing Resilience: How Hallandale Beach Public Works is Transforming Infrastructure With Purpose
When it comes to tackling aging infrastructure, the public works department of Hallandale Beach is proving that innovation, strategic planning, and teamwork can achieve extraordinary results—even for a city just over four square miles in size.
Located in south Florida and home to over 41,000 residents, Hallandale Beach has long wrestled with deteriorating water and sewer systems. With 81 miles of water lines, 27 sewer lift stations, and over 8,000 water meters, the city’s infrastructure had suffered from years of deferred maintenance. That is, until a transformation
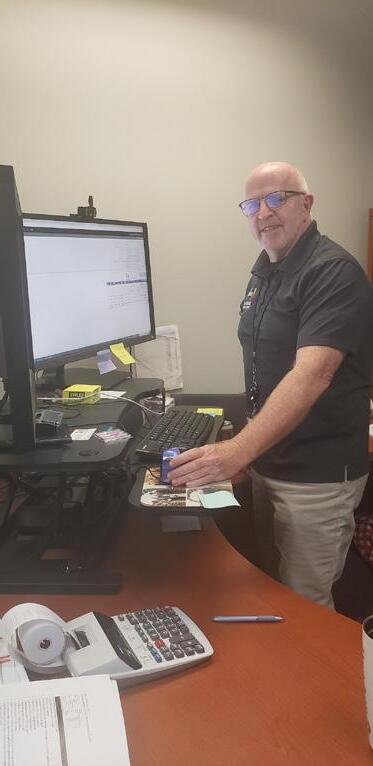
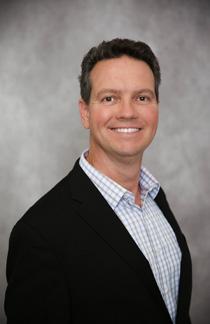
began under the leadership of Jeff Odoms, the department’s public works/utilities director.
Defining the Problem— and a Path Forward
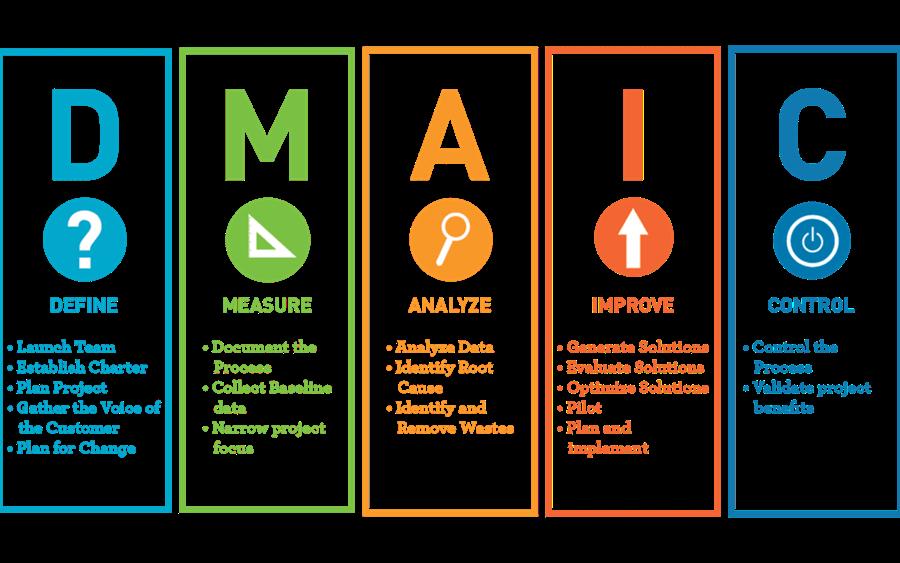
When Odoms took the helm in December 2020, the city’s systems were approaching critical failure. “We inherited a system that was holding on by a thread,” he recalled. Data showed increased water main breaks and surging maintenance costs. With urgency, Odoms formed a cross-functional team of engineers, project managers, and operations leaders who brought not just technical skills—but vision. Together, they launched a citywide rehabilitation effort rooted in practical strategies and continuous improvement, guided by the Lean Six Sigma DMAIC methodology:
S Define
S Measure
S Analyze
S Improve
S Control
reduce variation, and improve quality, became the backbone of the transformation.
Building the Right Team and Securing the Resources
Charles Casimir, assistant director of utilities, and Jeff “JT” Towne, assistant director of administration, played key roles in the turnaround. Their leadership—with support from project managers Manga Ebbe, Naudia Harty, Jesus Padron, and Joselaine Pateau— ensured alignment across planning, design, and construction.
Early wins included securing a $60 million utility bond and over $20 million in grants, enabling targeted water and sewer rehabilitation projects to be built. In parallel, the city launched a $5 million road restoration initiative, resurfacing streets and improving drainage and pedestrian safety.
Measuring and Improving What Matters
This structured approach, which helps organizations identify and resolve problems,
One of the department’s standout tools is a risk probability matrix that scores
Jeff Odoms, director of public works/utilities.
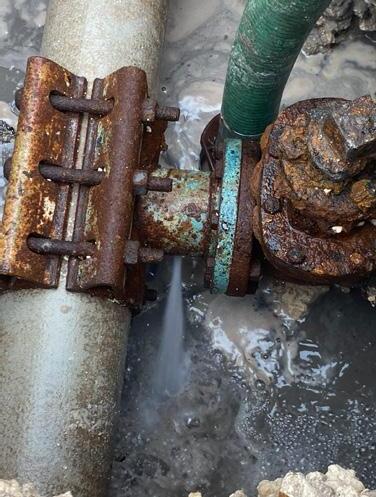
Failure due to age and degradation.
Jeff “JT” Towne, assistant director of administration/finance.
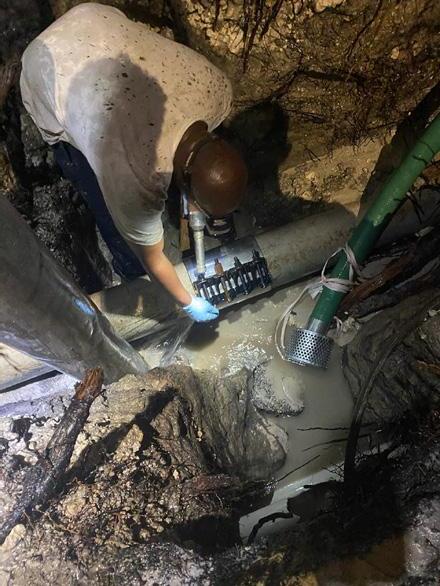
Team making a water main repair.
infrastructure based on failure history, years past life cycle, and population impact. This has enabled the city to prioritize over 85 active capital improvement projects—again, a remarkable feat for a city of its size.
Results speak volumes: within the first year, overdue water main replacements dropped by 20 percent. Meanwhile, the department built out geographic information system-based asset management and piloted smart meter technology to improve operational oversight.
Creating a Culture of Accountability and Transparency
To make these changes sustainable, the public works team institutionalized process controls and standardized maintenance schedules. Regular reviews ensure lessons learned are captured and applied. What’s more, leadership actively promotes a culture where every employee—from technician to director— is engaged in decision making and progress tracking.
“This isn’t just about pipes and valves,” Casimir noted. “It’s about delivering better service to the people who live here.”
Lessons for Public Works Leaders Everywhere
Hallandale Beach’s experience provides several takeaways for fellow public works professionals:
S Leadership and Vision Matter experienced leadership can rally teams around clear goals.
S Data Drive Strategy helps prioritize projects and justify funding.
S Cross-Functional Teams Win When engineering, operations, and administration align, progress accelerates.
S Small Cities Can Lead Big Initiatives Hallandale Beach demonstrates that ambitious, well-executed plans aren’t
City of Hallandale Beach division of engineering members (left to right) are Fernando Paiva, Naudia Harty, Chris Van Vliet, Joselaine Pateau,Kamari Harris, Marc Gambrill, Jesus Padron, Manga Ebbe, and William Cabreja.
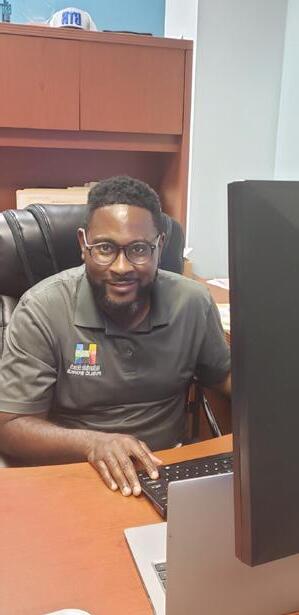
Charles Casimir, assistant director of utility operations.
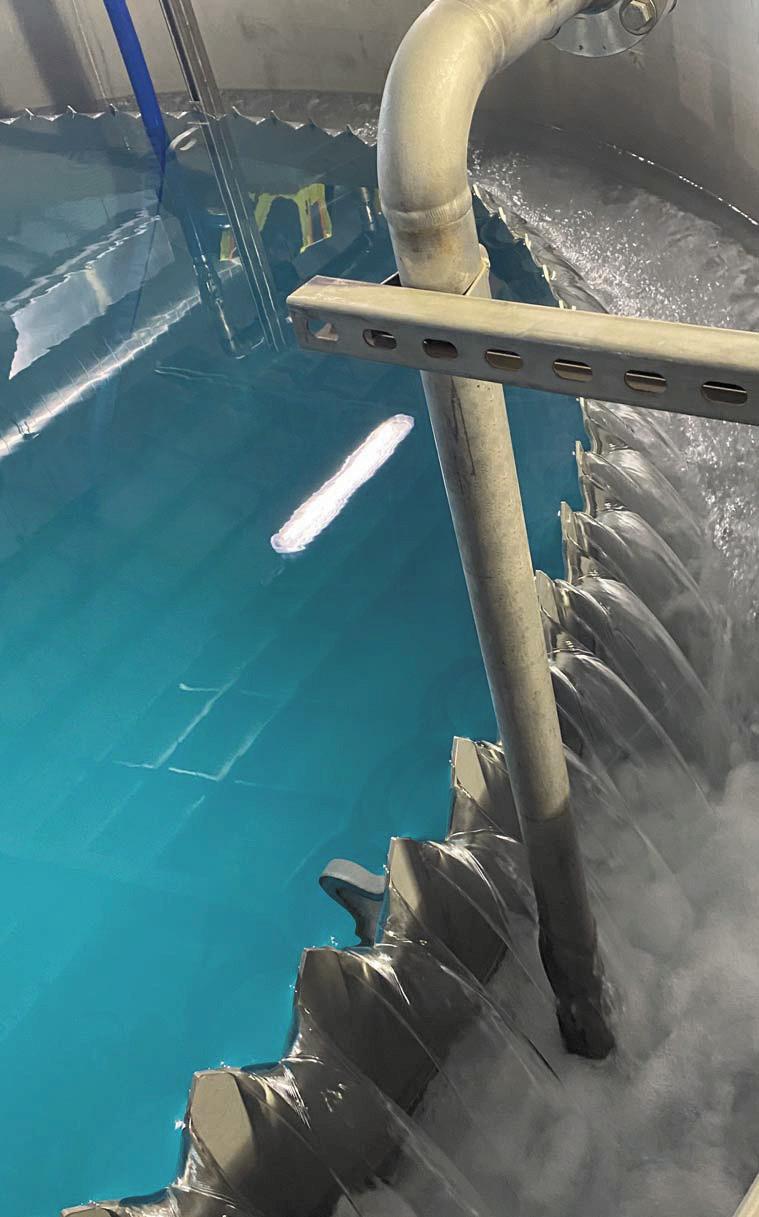
Coral Diseases and Water Quality Play a Key Role for Coral Restoration and Survival Efforts
Coral restoration programs are expanding to revive coral populations and ecosystem services, but local and global stressors, such as coral disease and water pollution, still threaten coral survival
Coral diseases, particularly in the Caribbean, have caused major declines in coral populations, especially affecting staghorn (Acropora cervicornis) and elkhorn (A. palmata) corals, which play a crucial role in reef ecosystems. Despite efforts to identify the pathogens that cause diseases like white band disease and stony coral tissue loss disease, the specific agents remain largely unknown. Coral restoration programs aim to restore these once-abundant coral species, but the effectiveness is threatened by multiple stressors, including increases in disease frequency and nutrient pollution caused from runoff from land-based activities.
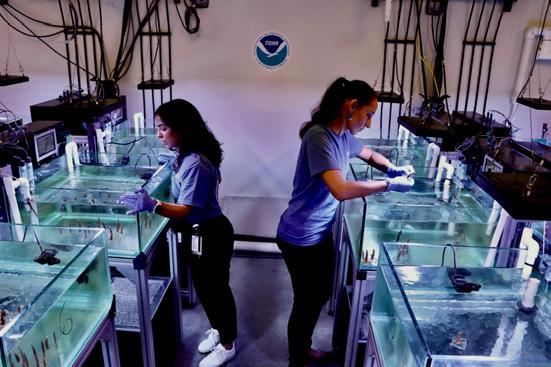
A recent study by scientists at the University of Miami NOAA Cooperative Institute for Marine and Atmospheric Studies (CIMAS), and the Atlantic Oceanographic and Meteorological Laboratory, which examined threatened staghorn coral species (Acropora cervicornis), has uncovered important insights into how different coral genotypes respond to environmental stressors. The findings indicate that while some coral genotypes displayed resistance to either
high nutrient levels or disease, none were resistant to both stressors simultaneously.
The scientists tested 10 genotypes commonly used in coral restoration in south Florida. Coral samples were collected from different offshore nurseries from the Coral Restoration Foundation, Florida Fish and Wildlife, and Rosenstiel’s Rescue a Reef Program and transported to the CIMAS Experimental Reef Lab where they were exposed to two nutrient conditions: normal (ambient) or high ammonium levels for about one and a half months. After this period, each coral was either exposed to a coral diseased tissue slurry or a healthy tissue slurry (i.e., placebo), creating four treatment groups:
S Normal nutrients and placebo
S Normal nutrients and disease
S High nutrients and placebo
S High nutrients and disease
Key findings include:
S Coral genotypes that previously showed disease resistance did not necessarily
suggesting disease susceptibility may change based on disease cause, environment, or route of infection.
S Elevated dissolved inorganic nitrogen, in the form of ammonium, reduced coral survival— even in the absence of disease—highlighting poor water quality as a significant threat.
S When exposed to disease under normal conditions, four genotypes suffered complete mortality, while others showed varying degrees of resilience.
S When both stressors were combined, all genotypes experienced mortality rates ranging from 30 to 100 percent.
The researchers reinforced the urgent need for improving water quality by limiting runoff to support coral conservation efforts. Since coral disease outbreaks often coincide with pollutionrelated stress, reducing nutrient pollution is critical to enhancing coral resilience and increasing the success of restoration projects.
“If water quality issues are not addressed, it will be difficult for both wild and restored coral colonies in Florida to survive,” said Ana Palacio, the lead author of the study and a research scientist at CIMAS. “Our findings highlight the importance of selecting coral genotypes that are resilient to local stressors and ensuring improved water conditions before restoration efforts.”
Coral reefs provide essential ecosystem services, including coastal protection, marine biodiversity, and economic benefits to fisheries and tourism. This study underscores the importance of science-driven policymaking and conservation strategies to safeguard these vital ecosystems for the future.
The study, “Genotypes of Acropora cervicornis in Florida Show Resistance to Either Elevated Nutrients or Disease, But Not Both in Combination,” was published in the journal, PLOS One, on March 26, 2025.
Funding for the study was provided to Palacio, one of the study’s authors, through the National Academy of Sciences National Research Council (NRC) postdoctoral fellowship and the Coral Reef Conservation Program (Grant 31250). S
Stephanie Rosales (left) and Ana Palacio (right) evaluating staghorn coral genotypes during their exposure to elevated nutrients. (photo: Diana Udel, University of Miami)
Operators: Take the CEU Challenge!
Members of the Florida Water and Pollution Control Operators Association (FWPCOA) may earn continuing education units through the CEU Challenge! Answer the questions published on this page, based on articles in this month’s issue. Circle the letter of each correct answer. There is only one correct answer to each question! Answer 80 percent of the questions on any article correctly to earn 0.1 CEU for your license. Retests are available.
This month’s editorial theme is Operations and Utilities Management. Look above each set of questions to see if it is for water operators (DW), distribution system operators (DS), or wastewater operators (WW). Mail the completed page (or a photocopy) to: Florida Environmental Professionals Training, P.O. Box 33119, Palm Beach Gardens, Fla. 33420-3119, or scan and email a copy to memfwpcoa@gmail.com. Enclose $15 for each set of questions you choose to answer (make checks payable to FWPCOA). You MUST be an FWPCOA member before you can submit your answers!
EARN CEUS BY ANSWERING QUESTIONS FROM PREVIOUS JOURNAL ISSUES! Contact FWPCOA at membership@fwpcoa.org or at 561-840-0340. Articles from past issues can be viewed on the Journal website, www.fwrj.com.
Small Utilities Have Big Challenges, Too
Maria I. Arenas and Jon Bundy (Article 1: CEU = 0.1 DS/DW/WW02015452)
1. What is the minimum dose of sodium hypochlorite required for 4-log virus inactivation?
a) 0.75 mg/L
b) 1.25 mg/L
c) 2 mg/L
d) 3 mg/L
2. What is the maximum dose of sodium hypochlorite used at the water treatment plant?
a) 2 mg/L
b) 3 mg/L
c) 4 mg/L
d) 5 mg/L
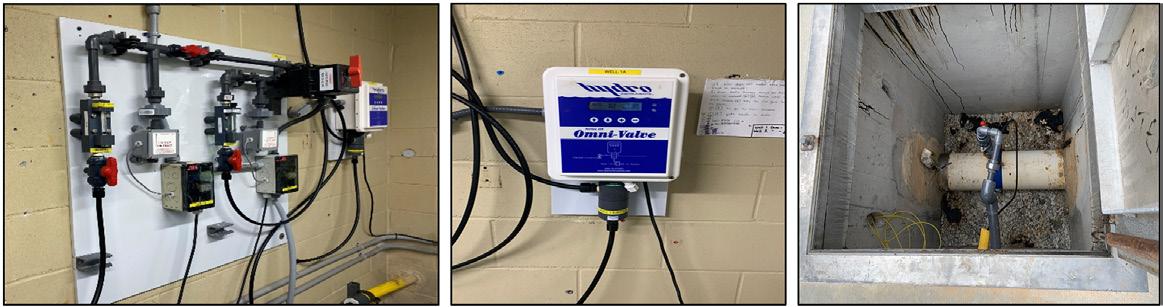
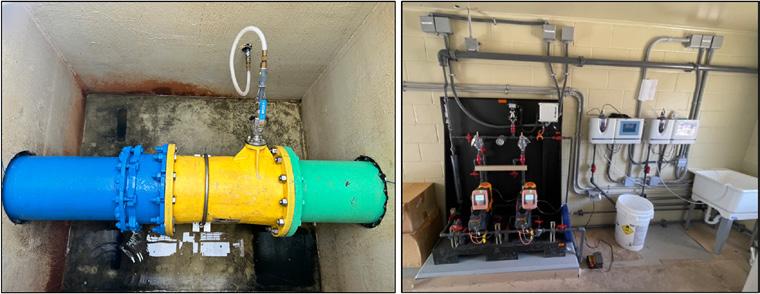
3. What type of disinfection system is used at Well 1A?
a) Chlorine gas system
b) Sodium hypochlorite disinfection system
c) Ultraviolet disinfection system
d) Ozone disinfection system
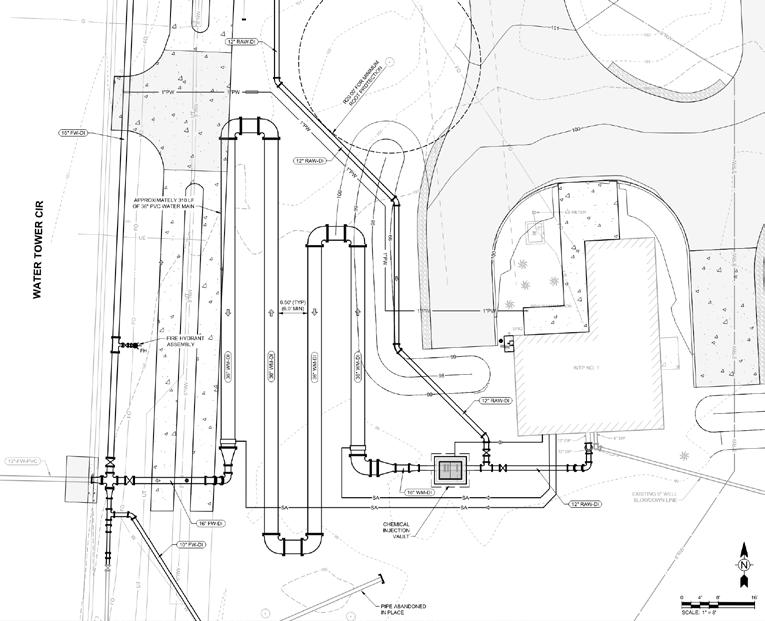
4. What is the maximum process flow rate for the chemical metering pumps?
a) 4,000 gallons per minute (gpm)
b) 6,000 gpm
c) 8,000 gpm
d) 10,000 gpm
5. What is the minimum chlorine residual required to achieve 4-log virus inactivation?
a) 0.75 mg/L
b) 1.25 mg/L
c) 2 mg/L
d) 3 mg/L
Creating a Regional Model of Pipe Failures to Overcome a Paucity of Break Data
Chelsea Lodato, James Barton, Frederick Bloetscher, Brittanney Adelmann, and Prasad Chittaluru (Article 2: CEU = 0.1 DS/DW/WW02015453)
1. What is the main factor identified by the regional model as contributing to pipe breaks?
a) Trees
c) Soil conditions
b) Roads
d) Pipe material
2. What is the main challenge in collecting data for water utilities according to Bloetscher (2019)?
a) High cost of destructive testing
b) Lack of maintenance data
c) Inconvenience of testing
d) Age of infrastructure
3. What is the recommended practice for utilities to improve asset management?
a) Implementing a work order system
b) Ignoring old infrastructure
c) Hiring external consultants
d) Performing destructive
4. What is the proposed general framework for an asset management program for water distribution piping?
a) Collecting and organizing data on physical components
b) Performing destructive testing
c) Hiring external consultants
d) Ignoring old infrastructure
5. What percentage of pipe materials are known in the utilities studied?
a) 50 percent
c) 98 percent
b) 75 percent
d) 100 percent
Water Week 2025 Focuses on Critical Legislative and Regulatory Challenges Facing the Water Sector
Leading organizations urge Congress to take action on PFAS, infrastructure funding, resiliency, and cybersecurity
More than 700 water sector professionals representing national associations and wastewater and drinking water utilities from across the United States visited Congressional offices in Washington, D.C., in April as part of the annual National Water Policy Fly-In during Water Week. Water Week’s anchor event, the National Water Policy Fly-In, is jointly presented by the six host organizations and is also supported by 15 partner organizations across the water and environmental sectors. The event featured speakers from various federal agencies and members of Congress discussing current water priorities.
Challenges Facing the Industry
A joint effort of the National Association of Clean Water Agencies (NACWA), American Water Works Association (AWWA), Association of Metropolitan Water Agencies (AMWA), Water Research Foundation (WRF), Water
Environment Federation (WEF) and WateReuse Association, the 2025 Fly-In celebrated record attendance and called on Congress to address a number of growing challenges facing the water sector, including:
Aging Infrastructure
Federal funding and financing are vital for utilities to advance infrastructure projects; however, future funding levels are uncertain and many key program authorizations will expire after Fiscal Year 2026. Congress must reauthorize key drinking water and wastewater funding programs made possible through the Infrastructure Investment and Jobs Act and prioritize robust annual appropriations for these programs to advance investment in water across the country and ensure everyone has access to clean, safe water.
Affordability
Water and wastewater costs in many communities outpace inflation and income growth, putting disproportionate pressure on
Per- and Polyfluoroalkyl Substances polyfluoroalkyl substances (PFAS) contamination in accordance with the Safe Drinking Water Act and Clean Water Act are enormous and will significantly impact ratepayers. Drinking water utilities face annual costs of as much as $7.5 billion to comply with new drinking water standards from the U.S. Environmental Protection Agency for PFAS. Clean water utilities are also facing significant operational cost increases. The sector calls on Congress to prioritize source control measures that will reduce the amount of PFAS entering water systems and the environment and enact regulations that hold polluters—not local water utilities—financially responsible for cleanup costs.
of U.S. households owe money to their water utility, and as many as 19 million households are challenged by unaffordable water costs. The water sector is pushing for Congress to establish a permanent low-income water assistance program to help utilities modernize infrastructure, while maintaining affordable rates.
Comments From the Organizations
National Association of Clean Water Agencies
Adam Krantz, CEO of NACWA, said: “Water Week is a key time for the public clean water utility sector to bring our message to Washington, D.C., and remind policymakers of the critical work we do and the challenges and opportunities we face. Clean water is and should continue to be a core federal priority. Public clean water utilities are vital institutions to their communities and the nation, and we need Congress to support these services that are essential to the economy, jobs, the environment, and public health.”
American Water Works Association
David LaFrance, CEO of AWWA, said: “Every day, water utilities are on the frontlines, delivering safe, clean water to millions across the nation. We join our Water Week partners to advocate for policies that support the critical work of managing water. On Capitol Hill, we wanted to drive home a clear message to Congress: water matters. We need action on infrastructure funding, PFAS liability protection, and affordability. These are not just water issues, they are public health imperatives, and AWWA is committed to working with Congress to forge practical solutions that protect both the water we drink and the communities we serve.”
Association of Metropolitan Water Agencies
Tom Dobbins, CEO of AMWA, said: “The water sector is strongest when we speak with one voice, so I am proud for AMWA’s Water Policy Conference to convene during Water Week this year. From infrastructure investment to holding PFAS polluters accountable to promoting sound, science-based regulations, it’s critical for policymakers to hear from their local utilities on the challenges they face and to discuss workable solutions.”
Water Environment Federation
Ralph Exton, executive director of WEF, said: “The Federation thanks the passionate and committed water professionals from communities nationwide who unite each year in D.C. during the National Water Policy FlyIn. These dedicated and enthusiastic champions for water are essential for educating members of Congress and federal policymakers about critical issues impacting local water challenges.”
WaterReuse Association
Brian Biesemeyer, interim executive director of WaterReuse Association said: “The association welcomes our members to Washington, D.C., this week to share how water recycling is advancing economic opportunity and protecting public health and the environment. This year, we’re working with Congress and the administration to unleash water reuse opportunities for American industries and communities across the country.”
About the Groups
For over 50 years NACWA has been the nation’s recognized leader in legislative, regulatory, legal, and communications advocacy on the full spectrum of clean water issues. It represents public wastewater and stormwater agencies of all sizes nationwide. Its unique and growing network strengthens the advocacy voice for the public clean water sector and helps advance policies to provide affordable and sustainable clean water for all. Its vision is to advance sustainable and responsible policy initiatives that help to shape a strong and sustainable clean water future. For more information, visit www.nacwa.org.
Established in 1881, AWWA is the largest nonprofit, scientific, and educational association dedicated to managing and treating water, the world’s most vital resource. With approximately 50,000 members, AWWA provides solutions to
with safe drinking water. Go to www.amwa.org.
The WEF is a not-for-profit technical and educational organization of more than 30,000 individual members and 75 affiliated member associations representing water quality professionals around the world. Established in 1928, WEF’s mission is to inspire the water community in pursuit of human and environmental well-being. Its goals are to attract and develop a passionate workforce, cultivate a purpose-driven community to sustainably solve water challenges for all, and lead the transformation to the circular water economy. Visit www.wef.org.
The WRF is the leading research organization advancing the science of all water to meet the evolving needs of its subscribers and the water sector. It’s a nonprofit, educational organization that funds, manages, and publishes research on the technology, operation, and management of drinking water, wastewater, reuse, and stormwater systems—all in pursuit of ensuring water quality and improving water services to the public. For more information, go to www.waterrf.org.
The WateReuse Association is the nation’s only trade association solely dedicated to advancing laws, policy, funding, and public acceptance of recycled water. Its membership includes utilities that recycle water, businesses that support the development of recycled water projects, and consumers of recycled water. Learn more at www.watereuse.org. S
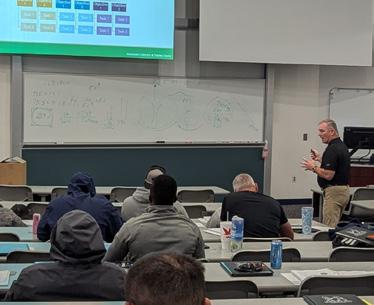
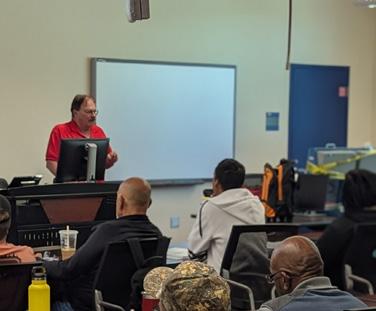
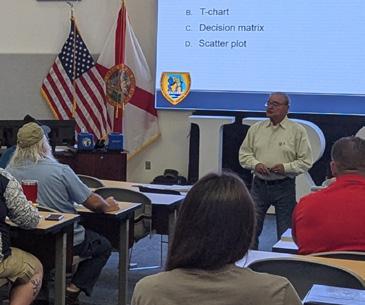
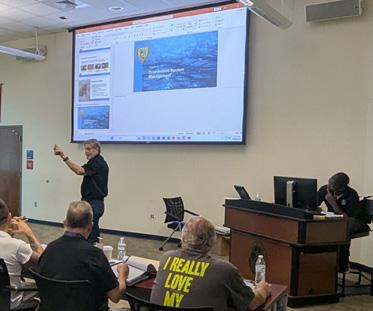
So, How’d You Do at the Short School?
Kevin Shopshire President, FWPCOA
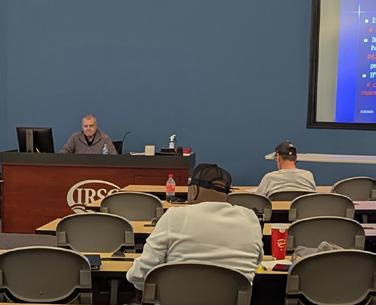
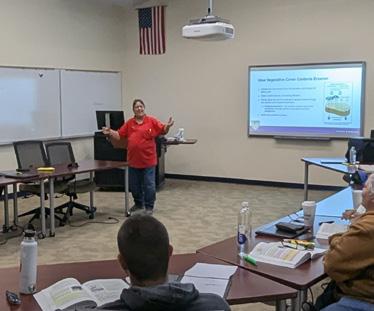
or those of you who are reading my columns, first of all, thank you. Secondly, after reading my February column regarding our FWPCOA Short School, did you go? If so, how’d you do?
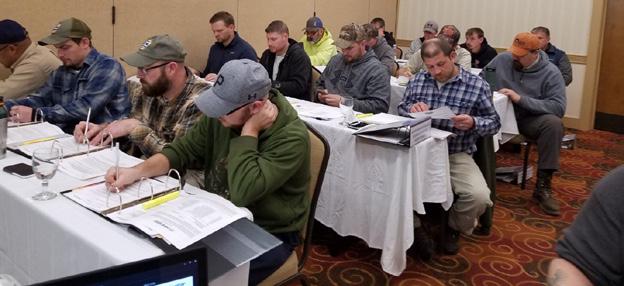
I am proud to say we had a very successful short school in March at the Indian River State College in Fort Pierce. Registration shows over 300 students registered for classes, exams, etc.!
First of all, please note that we have standardized the levels of the classes; where they were formerly C, B, and A, all classes are now level 3, 2, and 1, respectively. I understand some municipalities have job descriptions with
the certificate levels listed. If your municipality is one, be sure those in charge understand the course levels are the same; just the titles have changed.
Here is a recap of our short school, after a weekend of successful Education Committee and board of directors meetings.
Short School Classes
Mr. Al Monteleone, our organization’s Historical (sometimes pronounced Hysterical) Committee chair, with the help of Mr. Glen Whitcomb, our secretary-treasurerelect, taught the backflow repair and tester certification/recertification classes to more than 30 students.
Mr. John O’Brien held the inaugural introduction to direct potable reuse, a fivehour overview course of this new topic to 12 students. He also chairs the Direct Potable Reuse Committee.
Short School Teachers
Reclaimed water distribution courses were taught by Mr. Jody Godsey, Reclaimed Committee chair, and Mr. Steve Schwab, regional director, with five to eight students each.
Stormwater 3 and 2 were taught by Ms. Renee Moticker, Awards Committee chair and Mr. Brad Hayes, former FWEA representative, with 10 to 14 students each. Both are also active board members.
Utility Maintenance 3, a very hands-on course, was taught by our Utility Maintenance Committee chair Mr. Robert (Bob) Case, with about 25 students in attendance.
Water Distribution 3 was taught to a group of 46 by Mr. Glen Whitcomb, with Mr. Isaiah Moss and Ms. Kendra Phillips assisting.
Water Distribution 2 was taught by the legendary (in my opinion) Mr. Ray Bordner, Exam and System Operator Committee chair. Wastewater Collections 3 (previously “C”) had the largest class, with 61 students, taught
Jim Parrish.
Tom King.
Al Monteleone.
Bob Case.
Glen Whitcomb.
Renee Moticker.
by Mr. Jim Parrish, our Education Committee cochair.
Wastewater Collection 2 (previously “B”) was taught by Mr. Tom Hoglan, with Mr. Russ Carson, director of Region III, assisting.
Facility Management, the Level 1 (formerly “A”) of all three stormwater, wastewater collection, and water distribution disciplines was taught by Mr. Tom King (Education Committee cochair) and Mr. Ken Enlow (Bylaws Committee chair), both former FWPCOA presidents.
Getting Involved
My numbers are approximate (as I have the registrations, not the final attendance), but that’s not the point. My point is to demonstrate that none of our teachers are just teachers. They all wear multiple hats in this organization. They all give their time to help our organization and industry grow in multiple ways.
If you attended a class, and want to get involved, please reach out to anyone in our organization, and we will get you involved. We’re always looking for committee members, teachers, etc.
My Thanks
Thank you to everyone involved in our short school. Thank you to the college for hosting us again during spring break. Thank you to the volunteer board, committee members, committee chairs, teachers and new teachers’ assistants, and our FWPCOA staff, Shirley and Darin, whose work continues long after the school ends. If I’ve left your name out, I apologize; if I’ve forgotten to mention any group of volunteers involved in the process, I apologize. You are all appreciated. We can’t do this without our volunteers.
Finally, I’d like to thank all of the students for putting your faith in our in-person training program! Just the fact that you attended shows a goal for self-improvement, whether it’s for pay, experience, work requirements, personal benefit, or any/all of these. Your self-improvement raises the quality of our industry. I sincerely hope you are able to speak positively about your training experience to your colleagues.
If you were not able to attend, our next school, which will be in August, should be announced soon.
As I’ve spoken of previously, our industry is an environmental industry. We are environmental stewards, doing our part to ensure a safe future for this—and the next— generation. And, if all else fails, plant a tree.
See you next month! S
What Do You Know About The Surface Water Treatment Rule? Test Yourself
Charlie Lee Martin Jr., Ph.D.
1. The turbidity level required for slow sand filtration is
a. <1 nephelometric turbidity unit (NTU).
b. <0.3 NTU.
c. <0.5 NTU.
d. none of the above.
2. The turbidity level required for conventional filtration is
a. <0.3 NTU.
b. <0.5 NTU.
c. <1 NTU.
d. none of the above.
3. The turbidity level required for direct filtration is
a. <0.3 NTU.
b. <0.5 NTU.
c. <1 NTU.
d. none of the above.
4. The turbidity level required for diatomaceous earth is
a. <1 NTU.
b. <0.3 NTU.
c. <0.5 NTU.
d. none of the above.
5. The monitoring frequency for turbidity for slow sand filtration is
a. every four hours.
b. every hour.
c. once per day.
d. all of the above.
6. The monitoring frequency for turbidity for diatomaceous earth filtration is
a. every two hours.
b. once per day.
c. every four hours.
d. every six hours.
7. The monitoring frequency for turbidity for direct filtration is
a. every hour.
b. every four hours.
c. every 30 minutes.
d. once a day.
8. The monitoring frequency for turbidity for conventional filtration is
a. once a day.
b. every two hours.
c. every four hours.
d. none of above.
9. Surface water treatment systems are required to achieve a reduction of Giardia cysts equal to
a. 99.9 percent.
b. 99.99 percent.
c. 99.0 percent.
d. 99.999 percent.
10. Surface water treatment systems are required to achieve a reduction of enteric viruses equal to
a. 99.9 percent.
b. 99.999 percent.
c. 99.99 percent.
d. none of the above.
Answers on page 58
References used for this quiz:
• Water Treatment Plant Operation Volume 1, Seventh Edition (CSUS)
Send Us Your Questions
Readers are welcome to submit questions or exercises on water or wastewater treatment plant operations for publication in Test Yourself. Send your question (with the answer) or your exercise (with the solution) by email to: charmartin@msn.com
Creating a Regional Model of Pipe Failures to Overcome a Paucity of Break Data
Chelsea Lodato, James Barton, Frederick Bloetscher, Brittanney Adelmann, and Prasad Chittaluru
To meet the regulatory requirements to protect public health, safety, and welfare a water utility must construct new pipelines, pump stations, and other infrastructure, whether for growth, to improve existing service, or to replace infrastructure that has reached the end of its useful, economic, and/or physical life. Since the benefits of infrastructure systems are broad-based, within the public interest, and have huge initial costs and long payback periods, they are generally constructed with public funds.
Grimsey and Lewis (2002) noted that, since World War II, governments have been the primary constructors of infrastructure projects due to high cost and long payback periods, but these investments in infrastructure spur economic growth, and over 40 studies have been performed (Bloetscher, 2018, 2019). Arrow and Kurz (1970) were the first to develop theoretical work on the contribution of infrastructure to output, finding a correlation between infrastructure development and economic growth. Borcherding and Deacon (1972) shows there is statistically significant income growth as a result of highway, water, and sewer investment. Aschauer (1989) advanced the concept of using elasticity to show that public investment will induce an increase in the rate of return to private capital and, thereby, stimulate private investment expenditure.The study suggests infrastructure expenditures may have been a key ingredient to the robust economy in the United States in the 1950s and 1960s and public infrastructure investments are a primary factor in
Table 1. Basic Information on
fostering economic growth and productivity improvement (Aschauer, 1990). Aschauer (1989) and Munnell (1992) also found a strong positive relationship between infrastructure and growth.
Today, local budget growth rates have changed, as many local officials try to rein in costs as their focus. The Congressional Budget Office (CBO, 2015) reports a decline in real public spending on transportation and water infrastructure since 2003, and both construction and rehabilitation of highways has declined since 1959. The National Council on Public Works has documented deteriorating infrastructure conditions throughout the U.S. in its first assessment grade for infrastructure in the 1980s; note that piping was not discussed in this report. Since then, public infrastructure has been poorly rated by the American Society of Civil Engineers (ASCE) in its report card every four years (2001, 2005, 2009, 2013, 2017, 2021) and most public officials acknowledge the deterioration of the infrastructure the public relies on to support economic growth. At present, state and local governments spend only about 1.8 percent of the U.S. gross domestic product on infrastructure, as compared to 3.1 percent in 1970 (McNichol, 2016) and a large portion of that is for growth, as opposed to repair and replacement.
There is a need for better tools to manage these existing assets to help municipalities gauge the health of their infrastructure, because no one wants to spend money foolishly or wrongly (Goldwater, 2010). The problem is defining where and when to invest.
Bloetscher (2019) found that, for most water utilities, over half the total investment in infrastructure is subsurface piping. The question, however, is how to collect data that might be useful to a utility that does not involve a lot of destructive testing on buried infrastructure, which is costly and inconvenient, and may require the disturbance of assets that, because of age, no one currently working for the utility has any memory of when it comes to the original installation conditions. In addition, most piping requires little maintenance, so little data have been uncovered since installation. All assets, however, deteriorate with time, and given the ASCE grades for infrastructure,
Chelsea Lodato is a project engineer at Florida Technical Consultants in Jensen Beach. James Barton, P.E, is a principal engineer at Florida Technical Consultants in Boynton Beach. Frederick Bloetscher, Ph.D., P.E., is associate dean for undergraduate studies and community outreach in the department of civil, environmental, and geomatics engineering, and Brittanney Adelmann, Ph.D., is a professor in the mathematics department, at Florida Atlantic University in Boca Raton. Prasad Chittaluru, Ph.D., P.E., is president and chief executive officer with Epic Engineering and Consulting Group in Orlando.
utilities and communities must begin to address deferred maintenance. In deciding which lines to replace, the potential consequences associated with the failure of the individual assets need to be determined by an unbiased evaluation. This strategy allows for funding, in terms of both repair and replacement and operation and maintenance dollars, to be distributed accordingly among the vulnerable, most likely to fail, and/or critical assets. Of utmost importance is defining the acceptability of “failure” of the infrastructure. Bloetscher et al. (2023) proposed that the general framework of an asset management program for water distribution piping involve collecting and organizing data on the physical components of a system and evaluating the condition of these components.
Building upon the prior efforts in Bloetscher et al. (2021, 2022), this article outlines efforts to develop a means to costeffectively collect representative data, estimate existing conditions, and come up with a projected risk of failure, and therefore, the risk of failure of public infrastructure using simple, readily available means without the need for significant training and expertise using a more regional model. Too many utilities lack useful break data, which compromises the ability to predict localized failures. In these utilities, the pipe materials are known over 98 percent of the time.
Methodology
Bloetscher et al. (2023) noted that, before a condition assessment can be determined, an inventory of assets needs to be established. Once an inventory is compiled, it can be populated with data from work orders, asbuilt drawings, and local physical data, like soils and the water table. Despite the infrastructure being buried for many years, there is often useful information to be found to be added to a geographic information system (GIS). Where no as-built drawings or work orders are available, data can be gathered from an onsite field investigation, which could take a lot of time or probabilistic modeling. It should be noted that, for a given location, pipe is often installed at different times; knowing the date of installation (often similar to adjacent buildings) a probabilistic algorithm could be constructed (not needed here because virtually all the pipe materials were known).
In Bloetscher et al. (2021, 2022) and Bloetscher (2019), the GIS-based data were used in a regression process to analyze water distribution systems in multiple communities. The process was as follows:
S Step 1 - Create a table of all buried assets.
S Step 2 - Create columns for the variables for which there are data. Note that where there are categorical variables (type of pipe for example), they need to be converted to numerical variables.
S Step 3 - Summarize the statistics for the variables. Note missing data are not permitted and known conditions should be entered directly.
S Step 4 - Identify break frequency in records that should be kept by the utility. Note for many utilities this data may be limited or completely absent.
S Step 5 - Identify correlations between variables.
S Step 6 - Develop a regression equation to determine factors associated with each and the amount of influence that each exerts.
S Step 7 - The equation can then be used to predict the number of breaks going forward based on the information about breaks going back in time.
S Step 8- The data can be used to predict where the breaks might occur in the future based on the past.
Linear and logit regression equations that identify the critical variables were developed for nine series of utilities and the resulting regression equation used to create a factor to predict break likelihood. The utilities were
Continued on page 30
Table 2. Regression Equations Developed for Each Utility
1Number of Breaks = 0.001617163734317+2.93520582458788E-05*Ae2-2.28874210338945E-04*af2+5.15786169166412E03*ag2+1.66341853798395E-03*ah2+2.22933362887419E-03*ai2+1.00156151198285E-02*aj2+2.04919298519084E04*ak2+6.46308145749591E-03*al2+1.35407013100996E-02*am2+5.01918280885909E-04*an2-3.57517432551364E-03*ao21.09618924516312E-03*ap2+1.17552498531525E-02*aq2+2.60435278746286E-03*ar2-1.56264944876879E-03*as2 2BRK_1_2 = 7.34633687188947E-02+1.93982422177599E-04*z2-1.01674448024179E-02*aa2-2.84774500894531E02*ab2+4.02837210278206E-02*ac2-6.91069645988855E-02*ad2+2.89949189106736E-02*ae2+2.47609709735044E-02*af28.79901202806858E-02*ag2+4.61963530832518E-02*ah2-4.39978190384273E-02*ai2-5.68887541854132E02*aj2+4.88180515666322E-02*ak2-6.97211838435718E-02*al2
Table 3. Summary Statistics for All Piping in One Dataset for All Utilities
Table 4. Summary Statistics for All Piping in the Reduced Dataset for All Utilities
combined to attempt a regional model and the following were able to be determined:
S Piping materials even if little else is known
S Pipe diameters
S Soil conditions
S Groundwater is usually known and if a saltwater interface or a pollution plume exists it can be mapped and evaluated for impact on pipe in GIS form
S Tree roots (which will wrap around water and sewer pipes)
S Roads with heavy truck traffic create more vibrations (as do railroads)
If the break history for a water system is known, the impact of these factors can be developed via a linear regression algorithm. This algorithm can then be used as a predictive
tool to help identify assets that are most likely to become a problem.
In a given area, practices are often similar, as the same engineers and contractors are often used for all the piping, which removes a potential variable when trying to compare widely disparate areas. As a result, creating a regional model might help identify potential break risks for those utilities that lack break data of their own. For this project, only southeast Florida water distribution systems were analyzed.
Table 1 outlines the basic information for each. Note age is not easy to find for all pipe segments, and per the prior analyses (Bloetscher 2019, 2023), age was not a determining factor except in one instance.
The utilities have a mix of pipe, including galvanized, cast iron, ductile iron, polyvinyl chloride (PVC), and asbestos concrete. All are
primarily residential, with small commercial areas along major roadways; none are intensive “destination” communities. All utilities have a GIS system of pipe containing at least a portion of the data required for this analysis; the rest were gathered by the investigators. The consequence to predict was the likelihood of breaks, so break data were needed. Two of the utilities had over five years of data, so development of information was thought to be the most robust of the utilities (the others had less than 18 months of break data, and three had virtually none). The XLStat®, an Excel statistical software, was used for the statistical analysis.
Table 2 outlines the regression equations that resulted for each community in the prior studies. Note they are not the same.
When trying to create the regional
Continued on page 32
Figure 1. Breaks and standardized coefficients (95 percent conf. interval).
Table 5. Correlation Matrix for Reduced Data Set
Pred(BREAKS) - BREAKS
Figure 2. Comparison of prediction based on local versus regional model. Most of the values were within the 95 percent confidence level, although a few extreme number of leaks on a pipe (one had 28) were clear outliers.
Figure 3. Confusion plot.
model, Tables 3 and 4 show the summary statistics, when data for all systems are put together. The challenge is that putting all systems together yields a regression equation that is not enlightening because the data sets are so different with respect to size. Of the 137,000 pipe segments in GIS among the nine systems, less than 3,500 actually include breaks and only two exceed 1 percent. As a result, the extensive nonbreak pipe segments exert undue influence on the overall results, especially since only one utility had more than one year of data.
To resolve this problem, a process to create similar sets of data was designed and all pipe segments with breaks were removed. For the remaining 134,000 segments, a random-number generator was created and a series of pipe segments extracted and added to the break segments; in total, 3,000 pipe segments were reanalyzed. The linear regression function for XLStat was used to create an equation to identify the factors associated with each variable and the amount of influence that each exerts. In this case the equation is:
Figure 1 shows the standardized coefficients; trees and soils were the only positive coefficients and all others were negative. Figure 2 shows a comparison of prediction versus actual breaks based on the local-versus-regional model. While it’s hard to read a figure with 6,000 data points, most of the values were within the 95 percent confidence level, although a few extreme number of leaks on a pipe (one had 28) were clear outliers. A logistic regression sequence was run to develop a confusion plot (Figure 3); unfortunately, the model only predicted the correct answer about 52 percent of the time, which is to say, a coin flip. Table 5 shows the correlation matrix for a reduced data set and Table 6 shows the correlation between the regional model and the utility-specific predictions. Note this was more useful, as the larger systems with more breaks had higher correlation, meaning that the paucity of data was the limiting factor. This works against the regional model since there are likely to be many unreported breaks that would have helped to develop a better model.
Plotting the number of breaks versus the correlation, the data suggest that, with more breaks, the prediction will be better (see Figure 4). Looking at each utility, Figure 5 shows that unlike the regional model, asbestos pipe and galvanized pipe were frequently factors, but the regional model identified trees and roads as more likely contributors. It should be noted that many galvanized lines are in rear years and in easements that have not been maintained, so perhaps the model is picking up this issue.
Conclusions
Many utilities cannot properly assess certain assets, like buried pipe, because
assessment is too expensive or yields data of limited value. As noted in Bloetscher et al. (2017, 2019), for many water utilities, over half of their total asset value is in buried infrastructure. The failure of these assets can be minor ongoing irritations, a catastrophic failure, or something in between; however, these assets continue to deteriorate with time and the costs for maintenance will increase as well. The key is to prioritize pipe repair and replacement costs to control operation and maintenance costs and increase system reliability to protect public health, safety, and welfare.
Depending on the accuracy wanted, the data can be gathered in many ways, ranging from onsite field investigation, which could take a lot of time, to using existing maps while verifying the assets using aerial photography, video, or field investigations. The approach used here is to develop a model that can be used with minimal field investigation, but relies on break records. An effort was made to develop a regional model as a means to address the paucity of data that may exit in certain locales, using neighboring data as a supplement. Because three of the systems had very little data on breaks, and at least one was monolithic (all PVC), the regional model, while useful for the larger utilities with more breaks, was less useful for utilities with limited data—there simply was no way to determine if the regional prediction comported well with actual leaks since there was a lack of data.
The result indicates that the collection and maintenance of water main pipe breaks in a database or GIS system is a prerequisite to predicting the pipes most likely to fail—the consequences from a mathematical perspective. Failure to track break data limits the ability to truly assess asset condition, and the lack of
Table 6. Correlation Between the Utility’s Prediction of Breaks and the Regional Model
Figure 4. Comparison of the number of breaks reported versus regional model correlation with
information makes predictive efforts far more difficult. Work orders; construction and repair photographs; tracking information on breaks, costs, and materials; and the accompanying GIS updates are critical to improving future information.
The solution for utilities to implement these challenges involves the following:
S Implementing a work order system to verify all piping materials when excavation and repairs occur.
S Creating scans or all as-built maps so they are not lost.
S Using Lead and Copper Rule information to improve data about piping materials and age.
S Using the property appraiser data to help with asset age.
Ultimately, all of these things should be standard practice for utilities, but are often not priority issues for management or field staff. To improve asset management and reduce the risk of breaks, these priorities should be elevated. For some utilities the ability to track and analyze the data is overwhelming, but there are universities and consultants that can help maintain these databases and provide useful reports to the utility and these options should be explored.
Three other issues are solutions to address the challenge:
S Developing artificial intelligence tools to help predict breaks and material consequences.
S Increasing the datasets.
S Updating models and asset management plans based on new data.
These solutions continue to be developed by the authors. Additional modeling tools, along with better and more-complete datasets are being added to improve the regional models to allow for better prediction for utilities without the needed data (the correlations will just be poor, but that does not mean the model is not working). Additional investigations of the materials and pipe locations are areas for further inquiry, which are also ongoing. Ultimately these tools can be used to help utilities identify capital and maintenance needs going forward.
References
• Arrow, K. and Kurz, M. 1970, Public Investment, the Rate of Return and Optimal Fiscal Policy. Johns Hopkins.
• ASCE 2001. 2001 Report Card for America’s Infrastructure. http://ascelibrary.org/doi/
Continued on page 34
REGIONAL MODEL comparison)
Figure 5. Breaks and standardized coefficients (95 percent conf. interval) for each utility and the regional model.
• Aschauer, D. (1989). Is Public Expenditure Productive? Journal of Monetary Economics, Vol. 23, pp. 177 200.
• Aschauer, David Alan, 1990. Why Is Infrastructure Important? file:///C:/Users/ Frederick/Downloads/conf34b.pdf. http:// www.infrastructurereportcard.org/makingthe-grade/report-card-history/2001-reportcard/, accessed 12/15/16.
• Bloetscher, F., Farmer, Z., Barton, J., Chapman, T., Fonseca, P., and Shaner, M. (2023). Water System Condition and Asset Replacement Prioritization. Journal of Water Resource and Protection, 15, 165-178. doi: 10.4236/jwarp.2023.155010.
• Bloetscher, F., 2019. Public Infrastructure Management: Tracking Inevitable Asset Challenges and Increasing System Resiliency, JRoss, Plantation, Fla.
• Bloetscher, F., Wander, L., Smith, G. and Dogon, N., 2017. Public Infrastructure Asset Assessment With Limited Data. Open Journal of Civil Engineering, Vol.07 No.03(2017), Article ID:79326, 20 pages. 10.4236/ojce.2017.73032.
• Borcherding, T. E., and Deacon, R. T., 1972. The Demand for the Services of Non-Federal Governments. American Economic Review, 62, (1972), p. 842-853.
• Congressional Budget Office 2015. Public Spending on Transportation and Water Infrastructure. 1956 to 2014, CBO, Washington, D.C.
• Goldwater, D., 2010. An Important Tool for Asset Management. Utility Infrastructure Management: Journal of Finance and Management for Water and Wastewater Professional. http://www.uimonline.com/ index/webapp-storiesaction?id=378, (accessed May 2010).
• Grimsey, D. and Lewis, M.K., 2002. Evaluating the Risks of Public-Private Partnerships for Infrastructure Projects. International Journal of Project Management, 20(2002) p107-118.
• McNichol, E., 2016. It’s Time for States to Invest in Infrastructure. Center on Budget and Policy Priorities, Washington, D.C. http://www.cbpp.org/research/state-budgetand-tax/its-time-for-states-to-invest-ininfrastructure, accessed 9/1/2016.
• Munnell, A.H., 1992. Infrastructure Investment and Economic Growth. Journal of Economic Perspectives 6 (4), 189–198. S
Small Utilities Have Big Challenges, Too
Maria I. Arenas and Jon Bundy
The Village Center Community Development District (district) owns and operates the Village Center Service Area (VCSA) Water Treatment Plant (WTP) No. 1, which has a permitted maximum day rated design capacity of 5.667 mil gal per day (mgd) and consists of two well sites (Well 1A and Well 2) and a 0.4-mil-gal (MG) elevated storage tank.
Both Well 1A and Well 2 utilize the Upper Floridan aquifer as their water source and have a pumping capacity of 4,000 gal per minute (gpm) and 2,000 gpm, respectively. The first well house (Well 1A) consists of a raw water supply well, a sodium hypochlorite disinfection system for both well sites, and a diesel generator for standby power. The second well house (Well 2) consists of a second raw water supply well and disinfection is provided by the hypochlorite system inside of the Well 1A building.
The WTP originally utilized a chlorine gas system, but was later converted to supply liquid chlorine via a dedicated ejector assembly for each well. Provisions were installed such that the existing chlorine gas system could be returned to service as a backup; however, no chlorine gas was stored at the well sites. The system consisted of two 500-gal double-wall storage tanks, an Omni valve and vacuum switch for sodium hypochlorite injection control, two dedicated booster pumps for sidestream dilution of the sodium hypochlorite feed (25 gpm), two remote flow meters with control valves (one for each well chemical line), and a chlorine ejector assembly and a chlorine injection vault for Well 2, as shown in Figure 1.
The WTP included two separate injection
points. The first injection point is at an ejector assembly on the discharge of Well 1A inside of the well house; the second injection point is located on the discharge of Well 2 inside an injection vault in the distribution system and upstream of the first customer. This represented several operational challenges:
S The ejector system required a sidestream flow, which when combined with a high pH sodium hypochlorite solution, caused scaling at the injection points.
S The roadside location of the Well 2 injection vault was a safety hazard.
S The two separate injection points limited chemical dosing standardization of the WTP.
Additionally, the existing arrangement did not allow adequate contact time (CT) at either well discharge to achieve 4-log virus inactivation.
To address these operational challenges, the WTP was recently redesigned with a combined raw water supply from both wells with a single injection point within an injection vault located within the Well 1A parcel. In order to provide a direct injection sodium hypochlorite feed system for the combined well flows and provide adequate CT for 4-log inactivation of viruses, the following system modifications and improvements were designed:
S Removal of the existing vacuum system and associated tubing, valving, chlorine ejector, Omni valve, and remote meters with control valves.
S Replacement of the two existing 500gal sodium hypochlorite storage tanks with new double-wall storage tanks with
Maria I. Arenas, P.E., is a project manager and Jon Bundy, P.E., is the central Florida regional manager with Tetra Tech in Orlando.
overflow, drain, vent, fill, and suction piping.
S Removal of the existing booster pump and the carrier water system and injection assemblies.
S Installation of a chemical metering pump skid with two solenoid diaphragm chemical metering pumps: one duty and one standby.
S Installation of chlorine analyzers inside of the Well 1A building and piping/tubing from the sample point locations.
S Installation of a new injection vault within the Well 1A site to combine well flows and provide a single point of injection near the sodium hypochlorite system.
S Installation of approximately 155 ft of 12-in. water main from the existing Well 2 injection vault to connect to the discharge from Well 1A ahead of the proposed injection vault.
S Installation of approximately 60 ft of 12in. water main from the existing Well 1A discharge line to the proposed injection vault.
S Installation of approximately 270 ft of 16-in. water main to eliminate multiple parallel water mains.
S Installation of approximately 310 ft of 36in. snake water main outside of the Well 1A building downstream of the sodium hypochlorite injection vault to provide the
Figure 1. Sodium hypochlorite ejector system and Well 2 injection vault.
chlorine CT required to meet the 4-log virus inactivation on the combined well flow.
Other improvements being made at the VCSA WTP No. 1 included:
S Installation of an asphalt driveway for improved access to the facility for maintenance and deliveries.
S Connection of new chemical metering pumps at the Well 1A building to the existing programmable logic controller (PLC) for flow control.
S Replacing the existing soft starter at Well 2 with a variable frequency drive (VFD).
S A new 250-amp manual transfer switch at Well 2.
S A new 400-amp generator docking station for connection of a portable generator at Well 2.
S Installation of a new exhaust fan at Well 2 to help facilitate air movement and maintain the pump room at ambient temperature for extension of the proposed VFD’s useful life.
Sodium Hypochlorite System Improvements
Yard piping improvements and the installation of a new below grade injection vault were required for combining the well flows and creating a single sodium hypochlorite injection point at the new vault. The vault was located just outside of the Well 1A building and includes a static mixer and sodium hypochlorite injector installed downstream of the combined flows from Well 1A and Well 2. Yard piping improvements consisted of rerouting the Well 2 discharge pipeline to combine with the Well 1A 12-in. water main on the west end of the existing Well A building. This included the installation of approximately 155 lin ft (LF) of 12-in. water main for Well 2 and approximately 60 LF of 12-in. water main for Well 1A to the injection vault.
The new sodium hypochlorite system storage has a total storage of 1,000 gal, which is provided by two 500-gal bulk storage tanks. At the average dose provided by operations staff and an average daily flow of 1,161 gpm (1.67 mgd), the bulk storage tanks are capable of providing up to 30 days of storage. The tank piping was replaced to provide standard ventilation to outside of the well building. A new fill station was added outside the building for easier chemical deliveries.
The existing vacuum system and associated tubing, valving, ejector, Omni valve, and remote meters with control valves were replaced with a direct injection system
Parameter
Design
Chemical Sodium Hypochlorite
Chemical Strength (%)
Chemical Specific Weight (lb/gal as active Cl2)
Dose Basis of Design 4-Log Virus Inactivation per FDEP Chapter 62555
Minimum Dose (mg/L)
Average Dose (mg/L)
Maximum Dose (mg/L)
Average Process Flow Rate (gpm) 1,159
Average Daily Feed Rate (gpd) 28
Bulk Storage Required for 30 Days of Storage (gal) 835
Bulk Storage Available (gal) 1,000
Chemical Metering Pumps
Chemical Metering Pump Type
Quantity
Solenoid Diaphragm
Two (2) (one duty, one standby)
Minimum Process Flow Rate (gpm) 1,000
Maximum Process Flow Rate (gpm) 6,000
Minimum Feed Rate (gph) 0.63
Maximum Feed Rate (gph) 12.0
Manufacturer and Model
Prominent Sigma 1 Series
and chemical metering pumps that can be both flow- and dose-controlled by operations. Solenoid diaphragm chemical metering pumps were installed due to their consistent and accurate output. Two chemical metering pumps were installed: one as a duty pump, and a second as standby. The metering pumps were provided by a pump skid manufacturer
as a duplex metering pump skid package to allow for simple installation. The duplex metering pump skid includes a welded joint constructed skid, metering pumps, piping and unions, wye strainers, tubing, and valves (ball, check, pressure relief, etc.), as well as calibration cylinders, pressure gauges,
Continued on page 38
Table 1. Sodium Hypochlorite System Design Criteria
Figure 2. Site plan improvements for Well 1A.
and flow verification sensors. The chemical metering pumps were designed for dosing a minimum of 1.25 mg/L sodium hypochlorite to a combined well flow of 1,000 gpm (50 percent speed on a 2,000-gpm Well No. 1A pump) and a maximum dose of 4 mg/L to a combined well flow of 6,000 gpm.
A summary of the sodium hypochlorite system design criteria is provided in Table 1.
Two chlorine analyzers were added for measuring free chlorine at different points in the distribution system: one analyzer is dedicated to controlling the sodium hypochlorite dose and providing real-time results as a check to the amount of sodium hypochlorite being dosed, and the second is used to confirm the chlorine residual for 4-log inactivation. The chlorine analyzers were installed inside of the Well 1A building on open wall space near the sodium hypochlorite feed system. Polyethylene tubing was run to sample locations below grade and back to the analyzers for analysis. The chlorine analyzers each have a ½-in. flexible hose drain that is
routed to a utility sink inside of the Well 1A building.
Site plan improvements are provided in Figure 2 and improvements to the sodium hypochlorite system are provided in Figure 3.
4-Log Inactivation Treatment Improvements
The disinfection scheme at the WTP was upgraded to provide 4-log treatment of viruses as required by the Florida Department of Environmental Protection (FDEP).
Demonstration of 4-log inactivation via chemical disinfection requires:
S CT calculations.
S Identification of the disinfectant residual monitoring frequency and monitoring equipment.
S Proposed monitoring locations.
S Evidence whether the groundwater is exposed to the open atmosphere during treatment.
The CT is the product of the residual
disinfectant concentration before the first customer multiplied by the corresponding disinfectant CT, which is the time it takes the water to move from the point of disinfectant dosing to the point of disinfectant residual measurement.
Free chlorine is used to achieve virus inactivation credits in accordance with FDEP requirements. The FDEP requires a 3.4-mg/Lmin CT¹ value for waters with a pH range of 6 to 9 and a water temperature of 18°C. The minimum water temperature was considered for this application to account for the most conservative scenario. Minimum water temperatures for each water management district are listed in the FDEP Guidelines for Four-Log Virus Treatment of Groundwater, with the St. John’s River Water Management District having a minimum water temperature of 18°C for the Floridan aquifer system. In order to achieve a 3.4-mg/L-min CT value at the maximum flow and minimum chlorine residual, the WTP required yard piping improvements with the addition of a snakelike water main configuration, replicating a plug-flow system. In this system, a minimum chlorine residual of 1.25 mg/L was assumed to mimic a low residual scenario. The snake water main was installed in the sodded area to the west of the building, which is mostly free of obstructions, such as trees, buildings, and existing piping. The size and minimum length required of the plug-flow yard piping system was evaluated at various pipe sizes and is summarized in Table 2. If the minimum residual is lower than 1.25 mg/L, the additional volume, i.e., additional pipe length, would be required to achieve 4-log disinfection. As shown in Table 2, the smallest pipe size evaluated was 20 in. due to site constraints and requires the most pipe length to achieve 4-log disinfection. A 24-in. snake requires approximately 695 ft of pipe and a 36-in. snake requires 310 ft of pipe. For this application, a 36-in. plug-flow system was selected in an effort to optimize the limited available space onsite and avoid damaging the existing oak trees in the grass area. Site plan improvements are provided in Figure 2.
Construction Challenges
It was determined that, due to space limitations and the minimum length of snake pipe needed, the WTP needed to be offline for the construction of the yard piping. For this reason, an expedited construction schedule was critical. Construction was planned for a period of low water demand, which typically occurs between December and February for The Villages® community. During this time,
Figure 3. Sodium hypochlorite system improvements.
the distribution system would be supplied by interconnected water treatment plants (WTP 3 and WTP 5) in the VCSA service area to maintain service pressure and meet fire flow requirements. If additional water supply was needed, the adjacent Little Sumter Service Area, also owned and operated by the district, could be used as a supplemental water source. Figure 4 presents the target construction schedule developed during the design of the improvements.
Construction started in June 2023, at which time there were several challenges to meeting the projected schedule. Supply chain issues for electrical equipment created schedule and coordination challenges due to long material delivery times. Since the electrical equipment for Well 2 was scheduled for delivery after the WTP needed to return to service, construction was split in two phases, where Phase 1 focused on yard piping and chemical upgrades (thereby allowing Well 1A to be placed online to serve the WTP), and Phase 2 focused on the electrical upgrades at Well 2 (it will remain offline until construction is complete).
A summary of the revised schedule is as follows:
1. Substantial Completion
a. Phase 1 Upgrades
b. Target End Date: Feb. 29, 2024
c. Upgrades
i. Yard piping
ii. Injection vault
iii. Chemical system
iv. FDEP permit clearance
v. Placing Well 1A online 2. Final Completion
a. Phase 2 Upgrades
b. Target End Date: May 3, 2024
c. Upgrades
i. Well 1A site work
ii. Well 2 electrical and mechanical improvements
Due to material availability, installation challenges, and conflicts with existing utilities, it was not viable to turn the WTP online as scheduled. The Phase 1 upgrades, including FDEP clearance, were finalized on April 1, 2024. During the extended period of time when the WTP remained offline, the district continued to monitor the system’s water demands and the ability of WTP 3 and WTP 5 to provide sufficient water to meet the system
demands. Once Well 1A was brought into service, WTP 1 was used to supply water for continuous safe water provisions to its service area.
Similarly, Phase 2 experienced delays that extended the construction schedule past its target end date. Unforeseen delays include issues with the existing well pump, delayed delivery of the variable frequency drive and automatic transfer switch, and subcontractor scheduling issues. The Phase 2 upgrades, including the mechanical and electrical upgrades, were finalized on Feb. 2, 2025. As such, Well 2 is now operational and servicing the VCSA service area.
This project included additional coordination challenges during construction as there were five different agencies involved in the construction of the project: the owner (district), the owner’s representative (Vikus Water), the owner’s operations team (Jacobs), the engineer (Tetra Tech), and the contractor (Carr and Collier). For this reason, frequent communications were essential to minimize the effects of the challenges encountered during construction and maintain safe and reliable water service. S
TOGETHER, LET’S GET THIS
DONE.
COLLABORATION. THE RIGHT WAY.
Our job is more than delivering pipe. The heavier the lift the stronger AMERICAN performs, making your project smooth from concept to completion. We work with all stakeholders to achieve an overall higher quality project. To learn about our collaborative project approach, call AMERICAN today. And see how our teamwork is far more than the sum of our parts.
DUCTILE IRON PIPE FLOW CONTROL
SPIRALWELD PIPE
STEEL PIPE
OSHA Education Center and University of South Florida Provide Enhanced Construction Safety Training
The Occupational Safety and Health Administration (OSHA) Education Center and the University of South Florida (USF) Training Institute have expanded their mission to ensure the safety of construction professionals with an enhanced 10-hour construction safety training course.
The Education Center is a leading provider of occupational safety and health digital training and the Training Institute is an OSHAauthorized online outreach training provider. This new course is designed to meet the latest OSHA standards and offers cutting-edge content, video simulations, and mobile-friendly features. This comes at a time when construction-related injuries and fatalities are at an all-time high, making it crucial to provide workers with the highest-quality education that helps them perform their jobs as safely as possible.
“Our upgraded 10-hour construction course offers learners state-of-the-art digital training to navigate a broad range of hazards and regulations on the job,” said Andrew Marks, vice president of product at the Education Center. “With more than three times the
number of deaths occurring in construction than any other industry, it’s more critical than ever that outreach training programs step up to meet the needs of today’s workers.”
The course is specifically designed to provide
Since 2012, the OSHA Education Center has been a leader in occupational safety and health training. Its extensive, bilingual course library provides safety training across a range of professional industries, including construction, general industry, mining, hazardous waste management, military
The USF Training Institute provides OSHA-authorized occupational safety and health training to all levels of workers with the goal of improving the safety culture and performance in the workplace and saving
“We invite everyone in constructionrelated industries to take the training to learn about common safety and health hazards at the jobsite and elevate your knowledge and skills regarding occupational safety and health,” said Mylene Kellerman, program director at the
The Education Center and Training Center will continue to roll out enhanced workplace safety and compliance solutions throughout the S
FWEA FOCUS
FWEA Will Recognize Award Winners at Florida Water Resources Conference
TJoe Paterniti, P.E. President, FWEA
he FWEA recognizes utilities and individuals at its annual luncheon, held during the Florida Water Resources Conference (FWRC), for outstanding performance. Some of the achievement recognition awards are summarized here.
Awards
William D. Hatfield Award – WEF
The William D. Hatfield Award is presented to operators of wastewater treatment plants for outstanding performance and professionalism. The award was established in honor of Dr. William D. Hatfield, superintendent of the Decatur (Illinois) Sanitary District. He was president of the Central States Sewage Works Association in 1944-45 and served as president of WEF in 195859.
The criteria for the award are:
S Member of WEF.
S Documentation of a successful system of reports from the operator to his or her superiors that fulfill the information requirements and provide the operator with a forum for suggestions for improvements.
S Use of a good public relations program.
The nominee should have made significant contributions to the dissemination of information regarding advancements in their field.
Biosolids/Residuals Program Excellence Awards
The FWEA Biosolids/Residuals Program
Excellence Awards recognize excellence in all areas of biosolids management. The categories and criteria for selection allow for the consideration of a broad spectrum of programs with sound management, effective communication to stakeholders, and community-friendly practices. The purpose of these awards is to recognize and promote the safe management, public acceptance, and beneficial use of biosolids.
Awards categories include:
S Large Operating Projects (processing more than five dry tons per day)
S Small Operating Projects (processing less than five dry tons per day)
S Technology Innovation and Development
S Research Program
S Public Acceptance Program
Wastewater Collection System of the Year Award
This award recognizes utilities for their exceptional effort and significant accomplishments in fostering excellence in the operation and maintenance of wastewater collection systems. The award is intended to encourage utilities to provide adequate resources and excellent practices within their wastewater collection systems.
Awards are presented in three different categories based on the size of the population served:
S Under 10,000 served
S 10,000 to 100,000 served
S Over 100,000 served
David W. York Reuse Award and OneWater Professional Award
The FWEA Water Resources, Reuse, and Resiliency (WR3) Committee recognizes utilities,
customers, and organizations with the David W. York Reuse Award for their dedication to and achievements in developing, implementing, and/or maintaining exemplary reuse programs. The committee also recognizes a water resource professional for advancing the concept of OneWater in Florida.
Samuel R. Willis Award
The Samuel R. Willis Award recognizes an individual for heroism and is given in recognition of Samuel R. Willis, who, in November of 1976, risked his life to save another human being and, in the process, sustained personal injury.
Earle B. Phelps Award
The FWEA gives the Earle B. Phelps Award annually to recognize outstanding wastewater treatment facilities that have maintained the highest removal of major pollution-causing constituents before discharge to the environment. For the past several years, awards have been given in three treatment categories:
S Advanced Wastewater Treatment Plants
S Advanced Secondary Wastewater Treatment Plants
S Secondary Wastewater Treatment Plants
The awards take into account plant size in their evaluation and nominees will be evaluated against treatment facilities of a similar size and type of treatment. If nominations merit, awards will be given for small-, medium-, and large-size plants within each treatment category.
Utility Management Award
This award is given to utilities that demonstrate effective utility management and best business practices. Applicants need to provide information about their organization, including strategic goals, performance improvements, and optimizations, as well as regulatory compliance.
Environmental Stewardship Award for Odor Control
The utility receiving this award shall demonstrate sound environmental stewardship to the public within their community as a result of an exceptional odor control project or program. The inaugural year for the award was 2015.
Golden Manhole Award
This award is presented to individuals who have made outstanding contributions to the
art and science of collection system operations through the operation, maintenance, design, construction, management, planning, education, training, or certification of collection systems. The nominee must be a member of FWEA and exhibit significant participation in the following areas: operations, maintenance, education, training, certification, design, management, and planning of sewer collection systems.
Leroy H. Scott Award
The Leroy H. Scott Award is given to consider the work of wastewater treatment plant operators who are members of FWEA and made the most significant contribution to his/her fellow operators, or who did the best job in operating a plant, regardless of its size or available equipment.
Young Professional of the Year Award
This award recognizes an outstanding FWEA young professional member.
Public Education Award for Organizations and/or Events
This award recognizes organizations or events/campaigns for significant
accomplishments that foster and support the development of public outreach programs, as well as integrate public education as a core element of wastewater/water utility planning and management. The award is designed to encourage utilities and other organizations to incorporate public education and outreach into their operational plans while also providing examples of successful public education programs and best practices.
Thomas T. Jones Public Education Award for Individuals
The Public Education Award for an individual was renamed the Thomas T. Jones Public Education Award in honor of Thomas Jones, a long-term member and past chair of the FWEA Public Education Committee who passed away suddenly. As a past recipient of the Public Education Award, Tom shared his passion for teaching and promoting environmental awareness to schoolchildren, teachers, and the public. He was a true example of promoting environmental awareness and public outreach—the very purpose of this award.
Ralph H. Baker Award
This award is presented annually to an FWEA member who has done outstanding work in membership recruitment. It honors Ralph Baker, who, for many years, has devoted his energy, wisdom, and humor to advancing the public health interests in Florida.
Safety Awards
Facilities from all over the state of Florida compete for the opportunity to receive a plaque recognizing their excellent safety programs. Awards will be given for exemplary safety programs in all categories (A, B, C, and D) for domestic wastewater treatment plants. Each category will have a first-, second-, and thirdplace winner.
Each year, FWEA encourages utilities and individuals to submit their applications for recognition in the spring, allowing them to be evaluated for inclusion. For more information, nomination forms, and deadlines go to www. fwea.org.
I hope to see you at the lunch at FWRC in West Palm Beach! S
AMWA Announces 2025 Management Recognition Awards Honoring Water Utility Achievements
and Individual Contributions
For more than two decades the Association of Metropolitan Water Agencies (AMWA), headquartered in Washington, D.C., has provided drinking water utility recognition programs that honor extraordinary management and stellar workforce performance.
2025 Awards
The AMWA opened its annual awards program in February 2025 and invites all eligible AMWA member utilities to apply for the awards. The award submission period will close on July 11, 2025.
A distinguished panel of three peer judges will evaluate award applicants this summer and AMWA will present the awards at its 2025 Executive Management Conference to be held October 26-29 in Austin, Texas. In addition, award winners will receive local, national, water industry, and public utility media recognition.
Utility Recognition
The association’s utility recognition program honors extraordinary management and stellar workforce performance through a progressive series of awards that any number of AMWA member utilities may win:
S Gold Award for Exceptional Utility Performance
S Platinum Award for Utility Excellence
S Sustainable Water Utility Management Award
Individual Recognition
The AMWA also honors individual accomplishments in the drinking water field through its President’s Award and Donald R. Boyd Award. Recipients of these awards are determined by the association’s Nominations Committee. Nominations are solicited in the summer by a bulletin from AMWA’s national office.
Award Categories
Gold Award for Exceptional Utility Performance
The AMWA Gold Award for Exceptional Utility Performance recognizes large public drinking water systems that exhibit high levels of performance in the following areas:
S Product quality
S Customer satisfaction
S Employee and leadership development
S Operational optimization
S Financial viability
S Community sustainability
S Enterprise resiliency
S Infrastructure strategy and performance
S Stakeholder understanding and support
S Water resource sustainability
These are the “Attributes of Effectively Managed Utilities” that were identified by a blue-ribbon panel of water and wastewater utility executives commissioned by the U.S. Environmental Protection Agency (EPA), AMWA, and other water-related associations. Gold Award winners also show achievement in the “Keys to Management Success,” which are leadership, strategic business planning, knowledge management, measurement, and continual improvement management.
All AMWA member utilities that have never won a Gold Award are eligible to apply.
Platinum Award for Utility Excellence
Like the Gold Award for Exceptional Utility Performance, the criteria for the Platinum Award for Utility Excellence are also based on the “Attributes of Effective Utility Management” and the “Keys to Management Success.” Applicants are expected to show progress in implementing the attributes and keys, as well as a distinctive level of management expertise and expanded utility achievement.
Continued on page 50
Three years after winning a Gold Award, member utilities are eligible to apply for the Platinum Award for Utility Excellence. Past winners of AMWA’s Platinum Award for Sustained Competitiveness Achievement are also eligible to apply.
Sustainable Water Utility Management Award
The AMWA Sustainable Water Utility Management Award, introduced in 2014, recognizes member utilities that have made a commitment to sustainable management. While there are many opportunities available to water utilities to be managed more sustainably, there is no perfect path to get there. Each water system has its own water resource needs, infrastructure issues, financial position, political issues, energy costs, and other challenges.
This award views sustainability through a triple-bottom-line lens. This means winners will have achieved a balance of innovative and successful efforts in areas of economic, social, and environmental endeavors, such as responsible management of resources, protection of public health, meeting responsibilities to the community, and providing cost-effective services to ratepayers.
A submission does not mean an automatic win. A distinguished panel of three peer judges will review each award application in the summer of 2025, based on its merits scored against the awards criteria outlined in the corresponding application. Each application will receive a pass or fail score.
President’s Award
The AMWA President’s Award is given to individuals who have made outstanding contributions to the improvement of water supply management. Eligibility for this award is limited to individuals currently or formerly representing AMWA member agencies and it recognizes their efforts and dedication in the field of drinking water supply.
The award is presented to individuals who have made outstanding contributions to improving water supply management. Individuals nominated for this award must hold, or have held, a major position with a water supply agency, while actively participating as a member of AMWA.
Donald R. Boyd Award
The Donald R. Boyd Award acknowledges extraordinary personal service in the drinking water field. General criteria may include valuable service that advances public understanding and awareness, water quality research, or more general contributions deserving of recognition. This award confers recognition to individuals who have made important contributions to the water industry, including as water system employees (regardless of AMWA membership), government officials, or private consultants.
The award commemorates Donald R. Boyd, one of AMWA’s founding members and its first president.
Environmental Justice and Equity Award
As the newest addition to AMWA’s award program, the independent Environmental Justice and Equity Award recognizes member
utilities that commit to advancing equity and justice in their communities. The general criteria include:
S Using assessment and planning
S Equity in access and costs
S Civic involvement in decision making
S Integrative strategies
A submission does not mean an automatic win. A distinguished panel of three peer judges will review each award application in the summer of 2025, based on its merits scored against the awards criteria outlined in the corresponding application. Each application will receive a pass or fail score.
About the Association
An organization of the largest publicly owned drinking water systems in the United States, AMWA’s membership provides more than 156 million people—from Alaska to Puerto Rico—with safe drinking water. It’s the only policy-making organization in the U.S. solely for metropolitan drinking water suppliers. The association was formed in 1981 by a group of general managers of metropolitan water systems who wanted to ensure that the issues of large publicly owned water suppliers would be represented in Washington, D.C. Member representatives to AMWA are the general managers and chief operating officers of these large water systems.
The association represents the interests of these water systems by working with Congress and federal agencies to ensure that federal laws and regulations protect public health and are cost-effective. In the realm of utility management, AMWA provides programs, publications, and services to help water suppliers be more effective, efficient, and successful.
Governed by a 22-member board of directors, AMWA represents all regions of the U.S. Its committees on utility management, regulations, legislation, sustainability, and security provide the expertise to achieve the goals of water suppliers, including sustainable operations, regulations based on sound science, and cost-effective laws that support the safety and security of drinking water.
Award Information
For questions on award eligibility or to request an application form, contact Antoinette Barber at 202.331.2820 or at barber@amwa.net. S
Building a Pipeline for Future Water Industry Operations Staff
Brad Hayes
The U.S. Bureau of Labor Statistics has recently estimated that water and wastewater treatment plants will lose approximately 27,550 employees by 2031 due to impending retirements. At present, there are not enough young professionals entering the field to make up for the loss of experienced operators. In Florida, many of these facilities are already stressed by a rapidly growing population and increasing demand for services. Closing this gap in staffing over the next several years will be critical to ensure utilities can meet the demand for safe drinking water, while also maintaining environmental and public health.
One of the key reasons new talent is not currently entering the field of operations and management (O&M) is the general lack of understanding that these positions exist and provide reliable, fruitful careers without the need for a college or higher-education degree. The O&M opportunities provide livable wages with benefits that often include 401(k) matches; health and dental insurance; and holiday, vacation, and sick time pay. These benefits are attractive to many individuals, along with the fact that O&M employees help protect the environment and provide a critical service for the community.
career path is just one hurdle; the other is ensuring
proper training is readily and easily accessible, especially in communities with environmental justice challenges..
Training Programs
One Massachusetts-based organization has recruited, trained, and paired qualified candidates with hiring agencies, filling the need for staff in water and wastewater treatment operations since 2018. The workforce training program targets its recruiting toward individuals who have graduated from high school or a General Educational Development (GED) program through flyers posted around environmental justice-challenged neighborhoods. Those interested in the program are vetted through a multistep application process, which demonstrates their commitment to the program and potential as a future employee. The organization has also collected data on most of the students who have participated in the program, which show they were previously unaware that O&M positions were viable careers and a path toward financial stability.
This workforce training program offers three sessions a year—spring, summer, and fall cycles—in partnership with Boston-area organizations and companies within the industry. The partnerships help plan and provide realworld water conservation projects that aid the
training process and teach students about critical clean water industry careers. Through a phased approach, students learn such skills as benthic macroinvertebrate collection and identification, habitat assessment, trail and brook clearing, and construction of stormwater filtration socks; building and installation of rain barrels, green infrastructure, and invasive species identification and removal; and water quality testing, including E. coli and pH testing.
During the first 10 weeks of the program, students are engaged in paid water conservation work projects for eight hours a week. This handson work helps corps members develop workforce readiness skills, work on real projects that have a positive environmental impact, and build skills related to water and wastewater treatment. In addition to gaining tangible experience, weekly wastewater treatment classes prepare students to sit for the Massachusetts Grade 3 municipal wastewater operator’s license exam if they successfully complete the program. Supplemental instruction videos and sample questions supplement their learning between weekly classes.
Members of X-Cel Conservation Corps (a nonprofit group that collaborates with water organizations) who do not have a high school diploma may also participate in HiSET® preparation classes (held online) three mornings a week. Staff members also help students who
do not have a driver’s license prepare for driver’s education, a learner’s permit exam, and a driving test so they have a license before obtaining a fulltime job.
Members who complete the first phase, pass their high school equivalency exam, and obtain their operator’s license are then placed in an internship with one of the partner organizations to gain additional real-world experience. These paid internships require 20 hours a week for approximately three months, during which time student interns are encouraged to study for higherlevel wastewater operator licenses so they can sit for the exam after completing their internship. In some cases, members were already able to obtain their Grade 3 license, which makes them eligible to apply for wastewater operator positions prior to an internship. Students who would prefer to pursue another path, such as studying other related topics at local community colleges, can continue to receive support and assistance through the program during this second phase of workforce training.
The final phase of the program focuses on job placement assistance. The education, experience, and exam tutoring program prepare the graduates for obtaining full-time employment in the water and wastewater field, and they often find opportunities through the company with which they interned. This model has helped train
more than three dozen Boston-area residents to fill high-demand, essential jobs and provide job and financial security for their future, while also addressing a critical shortage of qualified operators in the industry.
Program Partner
Woodard & Curran has been a corporate partner of this workforce training program from the start. Approximately 15 program graduates have been hired by Woodard & Curran and placed at one of more than 50 water and wastewater treatment plants for which we provide contract operation services. Based on our experience with the training program and operations careers, we are working diligently with state representatives and area organizations to replicate the program in Orlando.
To help launch this effort, we developed the following roadmap:
S Develop Collaborative Partnerships
• Local, state, and federal agencies
• Orlando area utilities and operations firms
• Qualified instructors
S Identify Local Resources
• Student transportation options
• Donated classroom space
• Local water and wastewater facilities for hands-on training
S Source Program Funding
• Identify state funding opportunities
• Apply for workforce training grants
• Annual operations estimate is $500,000
S Recruit Students
• Outreach to area high schools and community college
• Poster and digital advertisements
S Implement Training
• Launch training with first cohort of 12 to 15 students
• Continue with quarterly enrollment
S Assist with Job Placement
• Resume development and interview practice
• Connect program graduates with hiring partner agencies or firms
Once launched, the program has the potential to train upwards of 60 students annually with the intent that everyone who completes the program will be ready for hire at local water and wastewater treatment facilities.
Recreating this type of workforce training in Florida could serve as the basis for similar training programs in other regions across the United States in response to the continuing demand for O&M staff.
Brad Hayes is a senior consultant at Woodard & Curran in New Smyrna Beach. S
NEWS BEAT
Elizabeth Keddy
Elizabeth Keddy, P.E., LEED AP, former senior associate at Hazen and Sawyer and current chair of the FWEA Utility Management Committee and chair of the FSAWWA Region IV Technical and Education Committee, has accepted a position at Hillsborough County Water Resources Department to serve as the capital projects section manager responsible for managing the delivery of the county’s water, wastewater, and reclaimed water infrastructure projects. She is honored to serve her local community in this role.
RJacobs was selected by the City of Boynton Beach to evaluate and design upgrades at two water treatment plants to remove per- and polyfluoroalkyl substances (PFAS) from the city’s groundwater supplies to comply with new U.S. federal drinking water regulations.
At a combined treatment capacity of 30 million gallons per day, the two plants provide drinking water to more than 112,000 people. In addition to addressing new PFAS regulations, the facility upgrades will replace aging infrastructure and meet the community’s growing demand for water.
“Considering potential federal compliance deadlines, we’re working with the city to help deliver an effective, long-term PFAS treatment and disposal solution,” said Katus Watson, Jacobs senior vice president. “We’ve supported the city with its water system challenges for more than 40 years and look forward to planning and designing this next important project for the community.”
Jacobs will evaluate the city’s existing facilities to assess treatment capabilities for PFAS removal and develop a comprehensive facilities plan for the city’s treatment plants, associated source water supply, and residuals management systems. Once the facilities plan is complete, Jacobs will design the improvements and provide construction management services. The city received a loan from Florida’s Drinking Water State Revolving Fund Program for project planning and design.
R
The Idaho National Laboratory (INL) and the state of Florida are collaborating on
an innovative cybersecurity initiative aimed at protecting Florida’s water infrastructure from cyber threats. This effort will create a Center of Excellence, with the goal of establishing a model that can be scaled and implemented across the Unites States. As one of the nation’s most comprehensive and accomplished programs in cybersecurity, the Florida Institute for Cybersecurity Research at the University of Florida (UF) will lend support and expertise to the program.
The partnership’s primary focus is developing a state-of-the-art locks and levees platform designed to bolster cybersecurity defenses for the state’s critical water management systems. This platform will serve as a vital training and simulation environment that will provide cybersecurity professionals with the skills to protect industrial control systems that manage flood control, water distribution, and environmental protection.
The INL has extensive experience developing sector-specific cybersecurity platforms that simulate cyberattacks on critical infrastructure, such as water management systems, electric grids, and chemical processing plants. This expertise will now be applied to the needs of Florida’s water infrastructure. “The Idaho National Laboratory’s longstanding expertise in cybersecurity and operational technology is the key to this initiative,” said Zach Tudor, associate laboratory director for the INL National and Homeland Security directorate.
This project will also benefit from the UF, its Florida Institute for Cybersecurity Research advanced capabilities, and their support in complementary training and research to strengthen Florida’s cybersecurity posture. “This collaboration between the state of Florida and the Idaho National Laboratory is a major step toward securing our critical infrastructure,” said Pedro Allende, secretary of the Florida Department of Management Services, who previously served as deputy assistant secretary for infrastructure, risk, and resilience policy at the U.S. Department of Homeland Security. “The Center of Excellence will set a new standard for cybersecurity in water management systems and serve as a model for other states.”
RVeolia North America has finalized an agreement with Tampa Bay Water (TBW) to lead the design, construction, and operation of a major treatment plant expansion that will increase drinking water
supply capacity for the region, serving more than 2.5 million customers along the Gulf Coast of Florida. This new project will mark a new chapter in Veolia’s nearly three-decade partnership with TBW, which has protected the region’s environment and provided water quality services for the area’s booming population and thriving economy.
According to Veolia, the $181 million expansion at the TBW Regional Surface Water Treatment Plant will increase its daily production of drinking water by as much as 12.5 million gallons, and has been identified as a priority project for the group to meet the demands of future regional growth. Veolia’s proposal was approved under a progressive design-build model, with both parties collaborating throughout the design process to ensure the final proposal meets TBW’s financial, technical, and environmental expectations.
Veolia, through a predecessor company, built the utility’s existing infrastructure and has been providing drinking water services to the region since TBW was founded in 1998. The TBW approved a five-year extension to its operating contract with Veolia in 2023, and both parties finalized their agreement to move forward on the expansion project in March.
The additional infrastructure planned for the TBW plant includes a fifth system of Veolia’s ACTIFLO and ozone treatment processes, supplementing the four already in operation; additional filtration; enhancements to the treated water disinfection, storage, and transmissions systems; and improvements to the filter backwash and solids handling systems.
The expanded system is expected to provide a sustainable capacity of 110 million gallons per day, and a maximum rated capacity of between 140 and 150 million gallons a day. The expansion project exemplifies the goals of Veolia’s global GreenUp strategy, which strives to lead the ecological transformation of the planet by accelerating water quality improvement, hazardous waste treatment and disposal, decarbonization, and technological innovation.
R
Lee Zeldin, U.S. Environmental Protection Agency (EPA) administrator, announced EPA’s decision to expeditiously review new scientific information on potential health risks of fluoride in drinking water. This renewed scientific evaluation is an
Continued on page 57
C L A S S I F I E D S
CLASSIFIED ADVERTISING RATES
- Classified ads are $22 per line for a 60 character line (including spaces and punctuation), $60 minimum. The price includes publication in both the magazine and our Web site. Short positions wanted ads are run one time for no charge and are subject to editing. ads@fwrj.com
POSITIONS AVAILABLE
City of Lakeland Water Utilities –Engineering Manager
Seeking a highly responsible manager in a W/WW Utility engineering department. Employee in this position would perform management of a dynamic team and execution of a utility CIP ($40M+ annually) that includes line extensions/replacements, utility relocations and W/WW plant upgrades or expansions. Salary Range $104k-166k. Apply at https://www.governmentjobs.com/careers/lakelandfl/ jobs/4853566/water-utilities-engineering-manager
Water Treatment Plant Operators
The Water Treatment Plant at the Village of Wellington is currently accepting applications for a full-time WATER OPERATOR and an INSTRUMENT TECH/OPERATOR positions. Apply online. Job postings and applications are available on our website: https://wellingtonfl.munisselfservice.com/employees/ EmploymentOpportunities/
We are located in Palm Beach County, Florida. The Village of Wellington offers great benefits. For further information, call Human Resources at (561) 753-2585.
Utilities Treatment Plant Operator I or Trainee
$57,208 - $80,496/yr. or $51,889 - $73,012/yr.
Utilities System Operator Foreman
$57,208 - $80,496/yr.
Utilities Backflow Technician
$51,889 - $73,012/yr.
Utilities Lift Station Operator I
$49,418 - $69,536/yr.
Utilities Lift Station Operator II
$57,208 - $80,496/yr.
Utilities System Operators I or Trainee
$44,823 - $63,071/yr. or $42,690 - $60,068/yr. Apply Online At: http://pompanobeachfl.gov Open until filled.
Water Reclamation Plant Operator III
This is skilled technical work, with supervisory responsibilities, in the inspection and operation of a water reclamation plant. The person in this position fills the role as the shift leader. Work involves responsibility for the safe and efficient operation of a water reclamation facility, routine adjustments to equipment and machinery operating controls, and inspection of equipment inside and outside the plant site. An employee in this class exercises considerable independent judgment in adjusting machinery, equipment, and related control apparatus in accordance with established procedures and standards to produce a high-quality reclaimed water product. Due to the critical responsibilities of this classification, an employee in this class must be able to report to work outside of normally scheduled work hours to respond to emergency conditions and/or address urgent needs, at the discretion of management.
Minimum Qualifications. Applicants must:
Possess a valid high school diploma or GED equivalency. Possess and maintain a valid Driver License. Possess and maintain a State of Florida Wastewater Operator “B” License. Have at least three years of experience in the operation of a wastewater treatment plant with demonstrable leadership skills. Possess some lead supervisory experience. Be able to perform shift work. Be able to understand and follow oral and written instructions. Be able to communicate clearly and concisely orally and in writing. Acknowledge this position is designated as Emergency Critical (EC) and if hired into the position, you must be immediately available to the department before, during, and after a declared emergency and/or disaster.
Salary Range: $32.10 - $42.74 Hourly, depending on your qualifications.
Apply at www.stpete.org/jobs
Orange County Utilities Senior Engineer
Orange County Utilities is accepting applications for multiple Senior Engineer positions in the Capital Improvement Program of the Engineering Division. Successful candidates will possess strong project management skills and have experience with renewal/ replacement of gravity sewer and pump stations, septic-to-sewer conversion projects, and management of grants from federal, state, or local agencies. Excellent benefits and salary commensurate with experience and education. Search Job Code:7037
Apply at: www.ocfl.net/jobs
City of Avon Park
Public Works/Utilities Director
$90,000 - $100,000/yr DOQ
Apply Online at: City of Avon Park Employment ApplicationOpen until filled
Public Utilities Division Manager
Wastewater Treatment
City of Clearwater - Public Utilities Department
City of Clearwater Government is hiring now for the Public Utilities Division Manager – Wastewater Treatment!
Under administrative direction, the Wastewater Treatment Division Manager provides professional and administrative work managing and overseeing several wastewater treatment facilities and related operations. Ensures compliance, conducts research, and develops improved procedures for sewage and disposal activities.
TARGET ENTRY SALARY: $99,204 - $104,164 DOQ
APPLICATIONS SHOULD BE FILED ONLINE AT:
http://www.myclearwater.com
For Details about this position: See website
Public Utilities - Utilities Mechanic
City of Clearwater - Public Utilities Department
City of Clearwater Government is hiring now for the Public Utilities - Utilities Mechanic!
Under direct supervision, the Utilities Mechanic provides skilled mechanical work at the journeyman level in the repair, maintenance, and reconditioning of machinery and other water, reclaimed water and wastewater system equipment. Maintains water and wastewater facilities, lift stations, and all other Public Utilities mechanical equipment and assists other trades workers and technicians with daily duties.
ENTRY SALARY: $50,104.74 + Additional 5% ASP pay!
APPLICATIONS SHOULD BE FILED ONLINE AT: http://www.myclearwater.com
For Details about this position: See website
City of Melbourne, Operations Supervisor
Drinking Water Facility
Melbourne Florida
https://www.melbourneflorida.org
Continued from page 54
essential step that will inform agency decisions on the standard for fluoride under the Safe Drinking Water Act. This action aligns closely with EPA’s core mission of protecting human health and the environment, while working cooperatively with federal, state, and local partners to ensure all Americans can rely on clean and safe water.
“Without prejudging any outcomes,
City of Melbourne
Drinking Water Production Operator Trainee
Water Treatment Plant Operator Trainee, C, B or A.
Utilities Field Tech Trainee or Utilities Field Tech I
$40,352/yr or $42,452 – $46,862/yr
Apply Online At: https://www.governmentjobs.com/careers/davie Open until filled.
NEWS BEAT
when this evaluation is completed, we will have an updated foundational scientific evaluation that will inform the agency’s future steps to meet statutory obligations under the Safe Drinking Water Act,” said Zeldin.
The National Toxicology Program released a report in August 2024 concluding with “moderate confidence” that fluoride exposure above 1.5 milligrams per liter is associated with lower IQs in children. The
report also concluded that more research is needed to better understand if there are health risks associated with exposure to lower fluoride concentrations.
The EPA is committing to conduct a thorough review of these findings and additional peer reviewed studies to prepare an updated health effects assessment for fluoride that will inform any potential revisions to EPA’s fluoride drinking water standard. S
January
February
March
April
May
June
July
August
September...
October
November....
December
Technical articles are usually scheduled several months in advance and are due 60 days before the issue month (for example, January 1 for the March issue).
The closing date for display ad and directory card reservations, notices, announcements, upcoming events, and everything else including classified ads, is 30 days before the issue month (for example, September 1 for the October issue).
For further information on submittal requirements, guidelines for writers, advertising rates and conditions, and ad dimensions, as well as the most recent notices, announcements, and classified advertisements, go to www.fwrj.com or call 352-241-6006.
Test Yourself Answer Key
Continued from page 27
1. D) none of the above.
The turbidity level required for slow sand filtration is none of the provided answers.
2. A) <0.3 NTU.
The turbidity level required for slow sand filtration is <0.3NTU.
3. A) <0.3 NTU.
The turbidity level required for direct filtration is <0.3NTU.
4. A) <1 NTU.
The turbidity level required for direct filtration is <1 NTU.
5. C) once a day.
The monitoring frequency for turbidity for slow sand filtration is once per day.
6. C) every four hours.
The monitoring frequency for turbidity for diatomaceous earth filtration is every four hours.
7. B) every four hours.
The monitoring frequency for turbidity for direct filtration is every four hours.
8. C) every four hours.
The monitoring frequency for turbidity for conventional filtration is every four hours.
9. A) 99.9 percent.
Surface water treatment systems are required to achieve a reduction of Giardia cysts equal to 99.9 percent.
10. C) 99.99 percent
Surface water treatment systems are required to achieve a reduction of enteric viruses equal to 99.99 percent.