

Welcome from Our Forum Partners

Ent Credit Union is honored to continue its support of the UCCS Economic Forum, which provides vital local and national economic data. It remains a valued resource for area business (including those owned by our members) and public officials as they strategically plan for the future.
Founded in 1957, Ent, Colorado's largest credit union, has been consistently ranked as one of Colorado's best credit unions by many publications, including being named one of the best regional credit unions of 2024 by Newsweek. Ent, a not-for-profit financial, community-chartered credit union is committed to improving members' financial quality of life with better rates, lower fees and unparalleled products and services. With nearly $10 billion in assets, Ent serves more than 550,000 members at 58 convenient service centers across the Front Range. Ent is an Equal Housing Opportunity and Equal Opportunity Lender, insured by the NCUA. Visit Ent.com for more.


TBK Bank is a full-service financial institution dedicated to supporting the communities we serve. With a strong commitment to customer service, we offer a wide range of personal and commercial banking products designed to meet the diverse needs of our clients. From checking and savings accounts to loans and treasury management services, our goal is to help individuals, businesses, and communities thrive.
Founded on the principles of integrity and innovation, TBK Bank is more than just a financial services provider; we are a partner in economic development. We actively participate in community initiatives and support local businesses through tailored financial solutions.
With a focus on personalized service and a deep understanding of the local economy, TBK Bank is proud to contribute to the financial well-being and growth of the regions we serve.
TBK Bank, SSB I Member FDIC I Equal Housing Lender

Workforce Center Fuels Business Growth & Workforce Development with Targeted Training Funds
Pikes Peak Workforce Center A dynamic hub for innovation, the Pikes Peak region continues to grow and attract new companies and encourage business expansion.
Yet attracting skilled talent for these open positions remains a challenge. One growing workforce trend is to focus on providing a quality job. In addition to a livable wage, key components could include a flexible schedule, empowerment of staff, organizational culture, and professional development.
At the Pikes Peak Workforce Center, we’ve had the privilege of offering an ongoing Employee Development Funds program for businesses in El Paso and Teller counties, federally funded by the Workforce Innovation & Opportunity Act.
During two annual funding periods, businesses can submit an application – and priority is given to smaller businesses in in-demand industries. The best part? Companies can select the exact training that will most benefit their business and their staff!
In our most recent program year, we awarded more than $400,000 to 31 companies in the top 7 in-demand industries. This training provided professional development to 256 employees, with skills that will be benefit them with higher wages and better career pathway opportunities at their current and future jobs.
To learn more about this opportunity, visit us at PPWFC.org/funds-for-worker-training
Welcome!
About the UCCS Economic Forum
The UCCS Economic Forum is a community resource for data and analysis to help citizens, businesses and civic leaders understand the economic and business conditions affecting the Pikes Peak Region and make better-informed decisions.
Since its origin as the Southern Colorado Business Economic Outlook Forum in 1997, the annual Forum event has been a fixture on the calendars of business and civic leaders in the Pikes Peak Region.
The Economic Forum is possible because of the ongoing support of partners in the business, government and nonprofit sectors. Economic Forum partners receive a monthly dashboard report with analysis of the latest data on the regional economy and invitations to several partner events during the year.
Throughout the year, the Economic Forum helps inform the community through speaking engagements, media appearances, special projects, the “Weekly Economic Snapshot” video series and a monthly column in the Southern Colorado Business Forum & Digest.
Follow the Economic Forum on LinkedIn!
For more information about partnerships contact us at econfm@uccs.edu


Bill Craighead, Ph.D. Program Director, UCCS Economic Forum
Bill Craighead joined the Economic Forum in 2023 after 18 years as an academic economist focused on macroeconomics. His previous experience includes faculty appointments at the US Air Force Academy and Colorado College. He holds an MA and PhD in Economics from the University of Virginia, and a BA from Carleton College in Northfield Minnesota.

Joe
Craig, Ph.D. Director Emeritus, Chair, UCCS Economics Department
Joe Craig has been a faculty member at UCCS since 2012 and is chair of the Economics Department. He served as interim director of the Forum in 2022-23 and continues to support the Forum as Director Emeritus. His research interests include industrial organization and economic education. He received his MA and PhD from the University of Colorado Boulder, and BA from Kenyon College in Gambier Ohio.

Jennifer Sobanet, Ed.D. Chancellor, University of Colorado Colorado Springs
The University of Colorado Colorado Springs is delighted to be once again collaborating with our business partners to present the 28th Annual UCCS Economic Forum. This event is so much more than just an assessment of our region’s economic health - it’s a celebration of the progress we've made together and a look into the exciting possibilities ahead for our community.
UCCS is incredibly fortunate to be part of such a vibrant and engaged city, surrounded by passionate individuals who make this event possible. A special thank you goes to Dr. Bill Craighead from the College of Business for his insightful data analyses and his impactful presentation.
We are so happy you are here!
Warmly,
Jennifer Sobanet

Thomas
Aicher, Ph.D. Dean, UCCS College of Business & Administration
As the Dean of the College of Business, I am excited to welcome you to the 28th Annual UCCS Economic Forum! UCCS and the Colorado Springs business and civic communities have a long tradition of partnering to achieve regional development and growth. The UCCS Economic Forum is an outstanding example of such partnerships.
This publication serves as a comprehensive resource to help inform and guide local businesses through newly presented economic challenges. We are confident this report will provide timely and valuable economic insight to all those determining the direction of business and government.
The UCCS College of Business delivers a future-oriented business education to support workforce and economic development for southern Colorado, the state, the nation, and the world. We prioritize and empower learners at every stage of their educational journey, develop innovative research that contributes to scientific discovery and effective business practice, and serve as a hub for our community in productive discourse, practical learning, and social responsibility.
Our mission would not be possible without the active endorsement of many stakeholders, stakeholders and partners like you.
Many thanks to Dr. Bill Craighead for his leadership as the Director for the UCCS Economic Forum, and all university staff and volunteers for their efforts and support in facilitating this event.
Sincerely,
Thomas (Tommy) Aicher
WE WOULD LIKE TO THANK OUR 2024
UCCS Economic Forum Partners:
Thank you to all Economic Forum partners. Our work would not be possible without your support.
PLATINUM PARTNER
Ent Credit Union
GOLD PARTNERS
TBK Bank
Pikes Peak Workforce Center
SILVER PARTNERS
Alpine Banks of Colorado
BiggsKofford Certified Public Accountants
City of Colorado Springs
Colorado Springs Airport
Colorado Springs Chamber of Commerce & EDC
Downtown Partnership of Colorado Springs
El Paso County
The FBB Group, Ltd.
GH Phipps
Minuteman Press
Norwood
Pikes Peak Association of REALTORS®
T. Rowe Price
SUSTAINING PARTNERS
Blazer Electric Supply Co.
City of Fountain
Classic Homes
Financial Planning Association of Southern Colorado
FirstBank Holding
Housing & Building Association of Colorado Springs
Independent Financial
InnovaFlex Foundry
MEDIA PARTNERS
The Gazette
KOAA News5
The Colorado Sun
Integrity Bank & Trust
Nunn Construction, Inc.
Sparks Willson
The Eastern Colorado Bank
UC Health Memorial Hospital
US Bank
Vantage Homes Corp.
Visit Colorado Springs
The Southern Colorado Business Forum & Digest
EVENT SPONSORS
Executive Summary
About this Report
This report is intended to be a reference and resource for information about the economy of the Pikes Peak Region. Data from a variety of sources are presented with context and explanation. Due to the lead times in the publication process, the information in this report is current as of early August 2024. Data is subject to revision. Much of the data is for the Colorado Springs Metropolitan Statistical Area (MSA) which is comprised of El Paso and Teller Counties. This is referred to throughout the report as the Pikes Peak Region.
Introduction
Overall, the economy of the Pikes Peak Region has continued to prosper over the past year, though employment growth has slowed as the impact of higher interest rates has been felt.
According to the Bureau of Labor Statistics, in the year to June 2024, the region’s total civilian nonfarm payroll employment had grown by 6,000, a 1.8% increase, with most of that gain in the second half of 2023. That represents a deceleration from the previous year’s increase of 12,000.
As a growing region with high population turnover, real estate and construction play an outsized role in the local economy. After a surge in building permits in 2021 and 2022, the pace of permitting has slowed significantly. Higher interest rates – particularly coming after a period when many homeowners were able to refinance mortgages at very low rates – led to a sharp decline in home sales. This has also impacted other economic activity, such as sales of furniture and appliances.
With national inflation having come down significantly since its mid-2022 peak, the Federal Reserve appears likely to relax its “restrictive” monetary policy stance. Mortgage rates have begun to decrease as financial markets anticipate a lower federal funds rate. This may bring some relief to local construction and home sales.
The cost of housing remains a top concern in the region. The past year has seen some modest improvement. Single-family home prices have stagnated; as incomes rise over time, steady prices translate to modest improvements in affordability. In the market for apartments, the 2021-22 surge in permits mentioned above has yielded additional supply, which has helped bring rents down somewhat from their summer 2022 peak.
While the fate of downtowns and commercial real estate – particularly offices – continue to be a major concern for the national economy and financial system, downtown Colorado Springs has enjoyed remarkable success and Colorado Springs has a much lower office vacancy rate than many other markets.
Travel and tourism activity has been strong, as evidenced by growing collections from the Colorado Springs Lodgers and Auto Rental Tax (LART). The number of travelers using Colorado Springs Airport continues to increase, and the region is seeing a substantial increase in the number of hotel rooms.

Output & Employment
GROSS DOMESTIC PRODUCT
Gross Domestic Product (GDP) measures the total value of goods and services produced in a geographic area in a period of time, typically a year. Real GDP removes the effects of price changes from GDP to measure the quantities of goods and services produced. Estimates at the metro area level are released with a considerable time lag – the most recent data is for 2022.
In 2022, the Pikes Peak Region’s GDP was $47.9 billion, making it the 81st largest metro economy (out of 384) in the United States. At $288.8 billion, the Denver metro area was the 18th largest, while Pueblo ranked 299th, with a $7.8 billion economy.
In recent years, both the regional and state economies have grown faster than the US overall. In per capita
terms, the Pikes Peak Region’s GDP is in the middle of the pack. Colorado’s statewide ranking is elevated by the productivity of the Boulder and Denver metro areas – Boulder’s GDP per capita was $108,738 (8th highest) and Denver’s was $96,722 (15th). Pueblo’s GDP per capita was $46,219, ranking 346th.
While metro figures are not available yet for 2023, the state economy continued to grow faster than the national economy (2.9% vs. 2.5%). Based on strong employment growth during the year, it is likely that estimates for regional GDP growth for 2023 will also show a healthy increase.
National GDP continued to grow in the first half of 2024, with a 2.1% rate of increase, according to the advance estimate for the 2nd quarter.
Region, State, and National GDP
Data: Bureau of Economic Analysis. Ranks in parenthesis (for region, rank is out of 384 Metropolitan Statistical Areas)
CIVILIAN NONFARM PAYROLLS
Total employment is measured with civilian nonfarm payrolls – which are estimated by surveys of business establishments conducted by the US Bureau of Labor Statistics.
Civilian nonfarm payrolls totaled 333,600 in the region. Military employment, which is also very important for the region, is not included in this figure. The Census Bureau estimated there were 36,190 people serving in the armed forces in the region in 2022.
Civilian Nonfarm Payrolls
Data: Bureau of Labor Statistics, Seasonally Adjusted.
EMPLOYMENT BY REGION
The figure shows payrolls for the Pikes Peak Region, Colorado, and the United States scaled to be 100 in February 2020.
After a sharp decline in April 2020, employment recovered rapidly at the national, state and local levels. As of June 2024, employment in the Pikes Peak Region was 9.6% higher than its prepandemic level. In 2023, payrolls increased by an average of 900 per month, which was faster than the 2018-19 pace of 588 per month.
However, while the region had a very strong employment recovery, payroll growth has been slower in the first half of 2024 with an average monthly gain of 267. This may be a sign of the impact of higher interest rates – with the region’s growth and population turnover, interest-sensitive activities such as real estate and construction are particularly important for the local economy.
Employment at the state and national levels has continued to grow so far in 2024, showing a modest
UNEMPLOYMENT BY REGION
The unemployment rate measures the fraction of the labor force that is unemployed. It is calculated based on a survey of households – to be counted as unemployed, a person must be actively looking for work, and the labor force is the sum of the employed plus the unemployed.
As of June 2024, the Pikes Peak Region’s unemployment rate was 3.9% and Colorado’s was 3.8%, which were both below the national rate of 4.1%. The regional and state unemployment rates have risen since lows seen in 2022. This is a sign that the labor market has normalized after being extremely tight during the post-pandemic recovery. It does not reflect a decline in employment – at both the region, state and national level, the number of people employed has increased since August 2022, but the labor force has increased even more, causing the unemployment rate to rise.
The state and regional unemployment rates have tended to be below the national rate – over the past five years, the unemployment rates in the Pikes Peak Region and Colorado been 0.4 and 0.6 percentage points lower, respectively, than the US rate on average.
Region, State and National Employment

deceleration from the 2023 pace. The monthly average increase for the United States has been 217,500, and statewide payrolls have averaged a 4617 monthly gain.

Region, State and National Unemployment
Data: Bureau of Labor Statistics, Seasonally Adjusted
Data: Bureau of Labor Statistics. Seasonally Adjusted.
Output & Employment
JOB OPENINGS
At the national and state level, job openings are measured by the Job Openings and Labor Turnover (JOLTS) data, which is based on a survey of businesses. The job openings rate is the number of open positions that are being actively recruited for as a share of total employment plus openings.
The job openings rates illustrate how tight the state and national labor markets were in much of 2021 and early 2022 as the economy recovered from the pandemic and employers struggled to fill open positions. Since mid-2022, the US job openings rate has trended downward, a sign of the labor market normalizing. At the state level, job openings have also had a generally declining trend, but have consistently been higher than the national rate, indicating that Colorado’s labor market is tighter than the US overall.
Pikes
Although the JOLTS data is not available at the local level, privatesector data that tracks online job listings finds a similar pattern for the Pikes Peak Region, with the number of active postings dramatically increasing in 2021 and remaining elevated through mid-2022. Listings have declined in 2023 and 2024 and are slightly below pre-pandemic levels.
The occupation with the highest number of job postings in the region is registered nurses. There is strong demand for computer skills, with a large number of listings for software developers and other computer occupations, which both have median advertised salaries of over $130,000.
This data also shows a significant demand for lower-wage occupations including retail salespersons and fast food and counter workers.
State and National Job Openings

Data: Bureau of Labor Statistics
Pikes Peak Region Job Listings
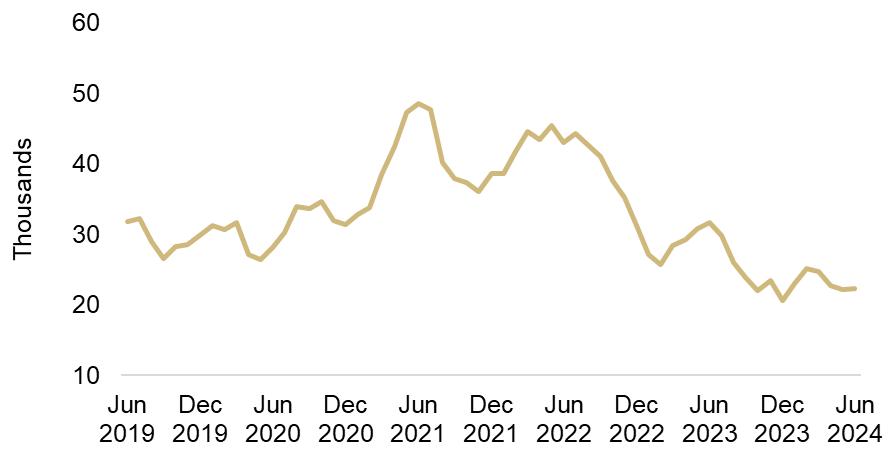
Data: The Conference Board-Lightcast Help Wanted OnLine®, courtesy of Pikes Peak Workforce Center
Wages, Income, and Poverty
WAGES
Average hourly earnings of private-sector workers in the region were just slightly below the national average but more significantly below Colorado’s average, reflecting the very high income and education levels in the state, particularly in the metro Denver area. It is important to bear in mind compositional effects can generate changes in averages –e.g., during the pandemic, average wages jumped as lowerwage workers were disproportionately laid off when many service businesses like restaurants closed.
Wage growth in the region has been modest over the past year, providing further evidence that the local labor market has cooled recently. At the state level, wages have grown considerably faster in Colorado than nationwide. The recent slowdown in local wage growth is in sharp contrast to the prior year (i.e., June 2022 – June 2023), when regional average hourly earnings increased by 10.9%, versus 2.8% and 4.7% for Colorado and the US, respectively.
The median annual wage is the wage received by a worker in the middle of the earnings distribution – i.e., exactly half of earners receive less and half receive more. Median wages in the region are slightly greater than nationwide, though lower than the statewide median (again reflecting the fact that statewide data is heavily influenced by high earnings in metro Denver).
Medians may be more appropriate than averages for making comparisons intended to represent typical wages and incomes in an area, because averages are impacted by the earnings of those at the very top of the income distribution such as entertainment superstars and executives of major corporations. Since these very high earners are more likely to be found in larger cities, average wages and incomes in mid-size cities such as Colorado Springs will be lower, but this does not necessarily mean that wages in the middle of the distribution are lower.
Data: Bureau of Labor Statistics. Not Seasonally Adjusted.
INCOME, POVERTY, AND INEQUALITY
The Pikes Peak Region is relatively affluent as measured by median income. The Census Bureau defines a “household” as any person or group of persons sharing a housing unit, including individuals living alone and unrelated people living together, while a “family” is a group of related persons sharing a housing unit. Looking at either households or families, median incomes in the region are higher than the US overall, and the Pikes Peak Region ranks in the top 25% of metro areas. This data also illustrates that Colorado is one of the most affluent states in the country.
Economists use the Gini index as a measure of inequality – it ranges from 0 (perfect equality) to 1 (perfect inequality). If all households had the same income, the Gini index would be 0, if one household received all the income, the Gini index would be 1. Among US metro areas, the Gini index ranges from 0.3924 (Fairbanks, Alaska) to 0.5431 (Bridgeport-StamfordNorwalk, Connecticut). The Pikes Peak Region has relatively low inequality. This is partly a function of city size as the very
top incomes which contribute to greater inequality are more likely to be found in larger metro areas.
The poverty rate is the share of people who are in families with incomes below official thresholds defined by the Census Bureau. The thresholds depend on family size and the ages of family members. In 2022, the threshold for a single person under 65 was $15,225; for a single parent under 65 living with one child, it was $20,172; for a family of two under-65 adults living with two children, it was $29,678. The official poverty rate is somewhat limited as a measure – it does not account for government benefits, taxes, and regional cost-of-living differences.
The poverty rate for the Pikes Peak Region is considerably lower than the national rate, and it is among the lowest in the country. Colorado also has one of the lowest poverty rates among US states.
Income, Poverty, and Inequality
Data: Census Bureau. Ranks in parenthesis (for region, rank is out of 384 Metropolitan Statistical Areas). Data for 2022. Poverty estimates are from the American Community Survey and differ slightly from estimates from the Current Population Survey.
Housing & Real Estate
MORTGAGES
Low interest rates and an increased demand for residential space partly motivated by the shift to remote work drove a sharp appreciation in home prices in 2020 through mid-2022. Locally, the median sale price of a single-family home rose to a peak of $495,000 in June 2022. Since then, home values have fluctuated, partly in accordance with typical seasonal patterns. but without a clear upward or downward trend.
Elevated prices combined with mortgage rates that are high by the standards of recent history have contributed to affordability concerns. The Federal Reserve Bank of Atlanta estimates the share of local median income needed for mortgage payments – including estimates of insurance and taxes – on a newlypurchased home at the local median price.
By this metric, affordability sharply deteriorated starting in late 2020. Affordability was at its lowest in October 2023 and has since improved slightly.
Higher mortgage rates have chilled homebuyers, while homeowners have been reluctant to sell due to the “lock in” effect of lower rates on existing mortgages. Many homeowners took out or refinanced mortgages when rates were much lower –as of the first quarter of 2024, the average rate on an outstanding mortgage in Colorado was 3.8%, up from a low of 3.5% in the fourth quarter of 2021 through the second quarter of 2022, according to the FHFA National Mortgage Database.
The result has been a significant decline in the volume of home sales in the region between 2021 and 2023.

Median Sale Price, Single-Family Home
Data: Realtor® Services Corp., courtesy of Pikes Peak Association of Realtors® , Zillow
HOME SALES
Declining transactions not only impact real estate agents, but also affect other economic activity, such as sales of furniture and appliances.
In the first seven months of 2024, home sales continued to decline – sales were down 8.0% compared with January-July 2023. However, the number of listings has increased considerably – in July 2024, there were 45.2% more active listings than July 2023. This could portend an increase in the number of sale transactions. It may be an encouraging sign
that July 2024 saw slightly higher sales than July 2023 (+0.7%) – this was the first month with a year-overyear increase in sales since May 2022.
A surge in apartment building has led to greater supply and apartment rents have fallen in the region since their 2022 peak.
According to Apartment List, the median rent for a two-bedroom apartment in June was $1403, down 7.9% from $1524 in August 2022.
Pikes Peak Region Home Sales


Median Rent, Two-Bedroom Apartment
Data: Realtor® Services Corp., courtesy of Pikes Peak Association of Realtors®
Data: Apartment List
Housing & Real Estate
BUILDING PERMITS
The increase in apartment supply is the result of a surge in building permits in 2021 and 2022.
The increase was largely driven by the multi-family category – 3943 multi-family units were permitted in 2021 and 4963 in 2022, compared with an annual average of 1350 in 2016-19. Both multi-family and single-family permits declined in 2023.
In the first seven months of 2024, the number of multifamily dwelling units continued to decline sharply, down 70% from 2023, while single-family bounced back modestly, up 8%. These comparisons should be interpreted with caution, since a building code change that took effect on July 1 of 2023 caused some of 2023’s permitting to be pulled forward into the first half of the year.
COMMERCIAL VACANCY RATES
Commercial vacancy rates provide a gauge of the health of the commercial real estate sector. These figures are for the percentage of space that is vacant and available.
Remarkably, Colorado Springs has avoided the crisis in office real estate brought on by the shift to remote work. Office vacancy rates in Colorado Springs are only slightly above their pre-pandemic level. Meanwhile, Denver’s office vacancy rate was 19.3% in Q2 2024. While Colorado Springs is not seeing a severe direct impact of the office crisis, the region may be indirectly affected as defaults on office mortgages and leases elsewhere create strains in the financial system.
HOMELESSNESS
Estimates of homelessness are provided by the annual point-in-time counts conducted by regional continuum of care organizations that coordinate planning of homeless services. The estimates are from an annual census of the homeless population, usually conducted on a single night in January.
These estimates suggest some progress in recent years in reducing homelessness, despite the rising cost of housing. At 1302, the total count of persons experiencing homelessness in 2023 was down from a peak of 1562 in 2019. The The count of persons experiencing unsheltered homelessness in 2023 was 374, down from a peak of 513 in 2018. Between 2019 and 2023, homelessness increased 15% nationally and 48% statewide in Colorado.


Department of Housing and Urban Development. 2021 is omitted because unsheled homeless were not counted that year.
Percent vacant and available. Data: CoStar Group™, courtesy Olive Real Estate Group, Inc.
El Paso County Homeless Population
Data: Pikes Peak Regional Building Department
Data:
Business
COLORADO BUSINESS CONFIDENCE
The Business Research Division of the Leeds School of Business at CU Boulder conducts a quarterly survey of Colorado business leaders. The survey asks respondents about their expectations regarding the state and national economies as well as industry sales, profits, hiring and capital expenditures. The responses are aggregated into a measure of Colorado business confidence – the Leeds Business Confidence Index (LBCI).
The survey takes place near the end of a quarter and asks for the outlook for the next two quarters. The index is set so that values below 50 represent a negative outlook and above 50 are positive. As of the most recent survey, the overall index was positive for the third quarter of 2024, but turned slightly negative (49.9) for the fourth quarter. Among the components, a positive outlook remained for the state economy and industry sales and profits, but the index was pulled down by negative outlooks for the national economy and industry hiring plans. More details can be found in the Business Research Division’s informative reports, available on their website, www.colorado.edu/business/businessresearch-division
BUSINESS ENTITY FILINGS
The Colorado Secretary of State maintains a database of business entity filings. From this data, the Economic Forum extracts the new entity filings that list places in the Pikes Peak Region as the “principal city.” This data illustrates how the region has participated in the surge in entrepreneurship seen nationally since the pandemic. Quarterly filings increased from an average of 2471 in 201619 to 3925 in 2020-23.
The timing of filings may have been impacted by a fee credit program that reduced the cost of filing between July 2022 and May 2023.


Leeds Business Confidence Index
Pikes Peak Region New Business Entities
Data: Business Research Division, CU Boulder Leeds School of Business
Data: Colorado Secretary of State
Consumers
CITY SALES AND USE TAX COLLECTIONS
Colorado Springs city sales and use tax collections provide a barometer of retail activity in the region. Because of seasonal patterns, the data is represented as a trailing 12-month average.
The combination of post-pandemic recovery and inflation generated a sharp increase in 2021 and 2022. However, collections levelled out in 2023 - collections for 2023 sales were 0.05% lower than for 2022 sales. The total was pulled down by weakness in the building materials category, down 6.1%, and furniture, appliances and electronics, which declined by 7.4%. Both of these categories can be sensitive to interest rates, and this weakness may also be related to the decline in new home transactions. Collections for 2023 sales from grocery stores and restaurants were up 6.3% and 5.2%, respectively.
Revenue has shown modest growth in the first part of 2024 – collections for sales in January through May were up 3.4% over the same period in 2023. The building materials category has rebounded, up 5.1%, while furniture, appliances and electronics has decreased 0.5%. Compared with the same period in 2023, collections were higher for sales in first five months of 2024 from department and discount stores (4.6%), grocery stores (6.0%) and restaurants (3.8%).
NEW VEHICLE REGISTRATIONS
New vehicle registrations in El Paso County have shown some volatility – demand was strong following the pandemic, but sales were affected by supply chain problems in the motor vehicle industry. In the first six months of 2024, 9308 new vehicles were registered –up from 8654 in the same period in 2023.


Colorado Springs Sales Tax & Use Tax Collections
Data: City of Colorado Springs Finance Department. Collections are for Prior Month Sales.
El Paso County New Vehicle Registrations
Data: El Paso County Clerk & Recorder, Colorado Interactive LLC. Excludes all terrain camper trailer, trailer coach and trailer utility categories.
Travel & Tourism
LODGERS & AUTO RENTAL TAX (LART) REVENUE
Collections from Colorado Springs’ 2% lodgers tax on hotel accommodations and 1% auto rental tax – which together constitute Lodgers and Auto Rental Tax (LART) Revenue – provide a barometer of travel and tourism activity.
This data underscores the strong rebound in travel and tourism after 2020 and its continued growth. Revenue in 2022 was somewhat inflated by collections of some delinquent payments in May 2022 – adjusting for this, the increase in 2023 was 5.8%. Revenue in 2023 was 33.7% higher than in 2019. In the first part of 2024, revenue continued to grow –collections for sales in January-May were 7.7% ahead of the same period in 2023.
According to the Longwoods International Travel USA Visitor Profile study, commissioned by Visit Colorado Springs, visitation to Colorado Springs rose to 24.8 million in 2023, up from 24 million in 2022 and 22.5 million in 2019.
With recent completions and new projects adding over 4000 hotel rooms to the area1, the region will have the capacity for continued growth in the number of visitors.
COLORADO SPRINGS AIRPORT ENPLANEMENTS
Colorado Springs Airport enplanements –that is, the number of passengers boarding planes – continue to show strong growth. At 1.18 million, 2023’s enplanements were up 10% over 2022, and 40.2% higher than in 2019. This reflects not only the attractiveness of Colorado Springs as a destination but also the success of the airport in attracting new air service, such a daily Southwest Airlines flight to Baltimore-Washington International (BWI) that started in June 2024. The airport is also upgrading its infrastructure and amenities through its Elevate COS project. Traffic growth has continued this year - through June of 2024, enplanements were up 15.4% over the same period last year.


1Wayne Heilman, "Building Boom: Pace of Hotel Construction Hits Nearly 30-year High in Colorado Springs,” Colorado Springs Gazette, Mar. 31, 2024
Colorado Springs LART Tax Revenue
Colorado Springs Airport Enplanements
Data: City of Colorado Springs Finance Department
Lodging
Auto Rental
Data: Colorado Springs Airport
Population & Demographics
EL PASO COUNTY POPULATION
The region’s population has grown rapidly in recent decades. El Paso County's population increased from 397,889 in 1990 to 740,543 in 2022. The Colorado State Demography Office forecasts growth to continue, with the county’s population reaching 1 million in 2049.
Over the decade 2024-34, the county’s population is forecast to increase by 15.2%. The largest percentage increases are forecast to come at the opposite ends
of the age distribution, with a 17.8% increase in the 0-5 population and the number of persons 65 and up growing by 24.4%
Over the same 10-year period, the State Demography Office forecasts Colorado’s population to increase by 12.1%, and the Census Bureau forecasts a 6.2% increase in the national population.

Data: Colorado State Demography Office. 1990 - 2022 are estimates, forecasts thereafter
El Paso County Population
EL PASO COUNTY AGE
With over-65 population growing faster than the overall population, the share of the population that is 65 will increase. However, while the population is aging, El Paso County’s population will remain younger than the state and national populations.
El Paso County Population Forecasts by Age
Data: Colorado State Demography Office
Share of Population that is 65 and Over
Data: Colorado State Demography Office, US Census Bureau
Population & Demographics
POPULATION CHARACTERISTICS
As measured by median age, the region’s population is young relative to the rest of the state and country. The region stands out for its large share of veterans and share of people in the armed forces, ranking 11th and 13th in these categories out of 384 metropolitan statistical areas. The share of the population that moved from a different state in the past year is relatively high in the region. In part, this reflects the significant presence of the military. Compared with the US overall, a relatively small share of the region’s population is foreign-born or speaks a language other than English at
home. According to Census data on race and ethnicity, the share of persons identifying as Hispanic or Latino, Black or African-American or as Asian is lower in the region compared with the rest of Colorado and the United States. Our population’s shares of American Indian and Alaska Natives and Native Hawaiian and Pacific Islanders are slightly above that of the state and nation.
Selected Population Characteristics
*Persons identifying as having one race. Hispanic or Latino can be of any race. Data: Census Bureau. Data for 2022
Health & Quality of Life
COMMUTE MODES AND TIMES
The region benefits from commute times that are lower than the national and state averages. In terms of commuting modes, the share of workers using public transport in the region is very low, but the percentage that walk to work is higher than state and national figures. The share of residents in the region who typically work from home is higher than the US overall, but lower than the statewide figure. It is noteworthy that among US metro areas, both Boulder and Denver-Aurora-Lakewood are in the top 10 for the share that work from home. These estimates are from a survey question asking respondents how they “usually” travel to work, so likely understate the extent of remote work by missing some “hybrid” arrangements where people work from home, but less than 50% of the time. According to a national study1, as of June 2024, 29.9% of US workers had hybrid arrangements, 12.1% were fully remote and 57.9% were fully on-site.
AIR QUALITY
The region has generally enjoyed good air quality. During the year July 1, 2023 – June 30, 2024, the region’s Air Quality Index (AQI) was good (below 50) on 61% of days, and the region only saw three days with an AQI above 100. The AQI is based on ozone and particulate matter concentrations, and each day’s figure is the highest daily value from monitors in the region. Ozone was the primary pollutant on 88% of days.
Commute Modes and Times
Data: Census Bureau. Data for 2022

US Environmental Protection Agency
Maria,
Air Quality Index (AQI)
Data:
HEALTH
The share of the regional population without health insurance coverage is lower than the US overall, but somewhat above the statewide figure.
It should be noted that this data reflects a period when disenrollments from Medicaid were suspended. Since this policy ended in 2023, Colorado has been among the states with the highest disenrollment rates.
CAUSES OF DEATH
State and national vital statistics data include information on causes of death. Age-adjustment removes the effect of differences in the age composition of different populations to facilitate comparisons.
Relative to the rest of the US, Colorado suffers from relatively high rates of death due to suicide, firearm injury and alcohol, and all of these rates are even more severe in El Paso County.
CRIME RATES
Crime rates are higher in Colorado than in the US overall. The region’s violent crime rate is similar to the state’s, but the rate of property crime is somewhat lower, though still substantially higher than the nationwide rate.
Civilian Noninstitutional Population. Data; Census Bureau. Data for 2022.
Age-Adjusted Death Rates, Selected Causes
Data: Colorado Dept. of Public Health & Environment, CDC. Rates are per 100,000 for underlying cause of death. Data for 2022.
Crime Rates
Data: Federal Bureau of Investigation. Data for 2022.
Schools & Education
EDUCATIONAL ATTAINMENT
Educational attainment in the region is relatively high – the share of the population over 25 with a bachelor’s degree is 42.3%, considerably higher than the national figure of 35.7%. Local educational attainment is somewhat lower than statewide, but Colorado is one of the most highly-educated states in the country. At 45.9%, the share of the state’s population with at least a bachelor’s degree is the second-highest among US states; only Massachusetts is higher, at 46.6% (the District of Columbia is also higher, at 65.4%).
HIGH SCHOOL GRADUATION RATE
Although Colorado’s adult population has very high educational attainment, educational outcomes for the state’s youth are substandard. According to the National Center for Education Statistics, in 2022, Colorado’s four-year high school graduation rate was 82.3%, below the national rate of 86.6%. Among states, Colorado ranked 40th. Note, these figures do not include students who graduated more than four years after entering ninth grade, or those receiving a non-diploma certificate or a high school equivalency diploma. In 2021, the college matriculation rate of Colorado students immediately following high school graduation was 49.9% according to the Colorado Department of Higher Education. This compares with a national figure of 61.8% reported by the National Center for Education Statistics. Since these data are from different sources, the comparison should be interpreted with caution.
FREE AND REDUCED SCHOOL LUNCHES
The percentage of students eligible for free and reduced school lunches provides a proxy for the share of students served by a school district from lowerincome families. Students are eligible for free school lunch if their family incomes are below 130% of the federal poverty guideline, and for reduced-price lunch with incomes below 185% of the poverty guideline.
Data: Census Bureau. Data for 2022
Statewide, 45.8% of students were eligible in 2023-24. Colorado’s rate of eligibility is lower than nationwide – in 2022-23, the share of Colorado students eligible was 42.4%, compared with 53.3% nationwide, according to the National Center for Education Statistics.
Pikes Peak Region School District Data
Data: Colorado Department of Education; Colorado Department of Higher Education (matriculation rates). Data for 2023-24, except matriculation rates (2021) and graduation rates and per student spending (2022-23). Pikes Peak Region totals calculated as average of school district data, weighted by students (except for total students, which is the sum across district totals). *District 49’s state-reported graduation rate is affected by the inclusion of data from the GOAL state-wide alternative education charter school serving over 5500 high-needs students. Without this, its graduation rate would have been 86.3% in 2022, according to the district. Excluding District 49, the weighted average graduation rate for the region is 84.1%.
TEACHER SALARIES, SCHOOL SPENDING & FUNDING
Teacher salaries in all of the region’s districts were below the statewide average of $68,847 in 202324. Note that the data include salaries of charter school teachers, which are generally below noncharter teacher salaries. Of the districts in the region, District 49 and Harrison 2 are most affected, with charter teachers accounting for 42.5% and 33.4% of full-time equivalents (FTEs), respectively.
Colorado’s teacher salaries are somewhat below the national average – according to the National Center for Education Statistics, the average teacher salary in Colorado in 2021-22 was $58,541, versus $66,397 nationwide, and Colorado ranked 28th (note this is a different data source than the table above; the change between 2021-22 and 2023-24 is partly due to inflation).
Statewide, per student school spending was $14,845 in 2022-23, and the regional average
is modestly lower. The most recent national comparison data available from the National Center for Education Statistics is for 2020-21, which reports a national figure of $14,295, with Colorado somewhat lower, at $12,233, ranking 31st.
Colorado also ranks low among states for public funding of higher education. According to the State Higher Education Finance (SHEF) Report, for fiscal year 2023, Colorado’s public higher education appropriations per full-time enrollment were $7,064, ranking 42nd among states and below the national average $11,040.
Schools & Education
EARLY CHILDHOOD EDUCATION (ECE)
The availability of Early Childhood Education places in the region is limited. Between home-based and center-based facilities, there were 9,250 licensed places for infants, toddlers and preschoolers in the Pikes Peak Region. Including slots at centers licensed for both preschoolers and school-age children increases the total to 17,990. The number of available places is far short of the region’s population of 0-4-year-olds, which the State Demography Office forecasted as 47,492 for 2024.
The Colorado Department of Early Childhood rates childcare providers through a quality rating and improvement system called Colorado Shines. Providers are rated at level 1 on being licensed and progress to level 2 by submitting a quality indicator assessment and improvement program and completing required training. Levels 3-5 are based on a points system with measures of (i) workforce qualifications and professional development, (ii) family partnerships, (iii) leadership, management and administration, (iv) learning environment and (v) family health. Of the spaces in categories included in the figure, 38.9% are at providers rated at level 1, 25.9% at level 2, 6.2% at level 3 and 28.9% are at level 4 or 5.
Another indicator of the supply of Early Childhood Education is the number of people employed in ECE occupations relative to the number of young children.
The early childhood education workforce is calculated as the sum of four categories in the Bureau of Labor Statistics annual Occupational Employment and Wage Statistics: (i) education and childcare administrators, preschool and daycare, (ii) preschool teachers, except special education, (iii) special education teachers, preschool and (iv) childcare workers. Measuring this relative to the population under 5 suggests that the availability of childcare is low in the region compared with the state and nation overall1.
The impact of the region’s limited childcare availability can be seen in the labor force participation rate among women with children under 6 in the household. According to the Census Bureau, in 2022, this was 61.9% in the Pikes Peak Region, compared with 73.4% for the United States and 74.0% in Colorado. The Census does not report a comparable estimate for men.
A newly-formed Early Childhood Business Council is working to address this issue in the region, more information can be found on their website, ECBCouncil.org

ECE Workforce Per 100 Children Under 5

1
A different figure is reported for 2021 by the Colorado Department of Early Childhood Colorado Early Care and Education Workforce Data Dashboard. The BLS data is used here to facilitate a national comparison.
Data: Colorado Department of Early Childhood, Aug. 1, 2024
Data: Bureau of Labor Statistics, Census Bureau. Data for 2022
Pikes Peak Region Licensed Childcare Capacity
Macroeconomic Outlook
INFLATION
Inflation has been the dominant macroeconomic concern of recent years, but it has receded significantly since its peak in mid-2022. Measured as the yearover-year change in the Consumer Price Index (CPI), inflation peaked at 9.1% in June 2022 and was down to 3.0% in June 2024. Measured with the “core” CPI, which excludes volatile food and energy prices, inflation was 3.3% in June 2024, down from a peak of 6.6% in September 2022. The Federal Reserve’s inflation goal is a 2% rate of increase in the Personal Consumption Expenditures (PCE) price index, a different measure of prices. PCE inflation typically runs about 0.4 percentage points lower than CPI inflation.
As the economy recovered from the pandemic, increases in prices initially accelerated ahead of wage growth. However, since spring of 2023, wage growth
has been faster than inflation, meaning that wages have been regaining purchasing power lost during the initial 2021-22 inflation surge.
This is reflected in real disposable income – household incomes after taxes and transfers, adjusted for inflation. Real disposable income spiked in April 2020 and March 2021 due to payments sent to households under the CARES (Coronavirus Aid, Relief and Economic Security) Act signed in March 2020 and the American Rescue Plan Act of March 2021.
After March 2021, real disposable income declined as pandemic support programs expired and high inflation eroded the real value of earnings. With the decrease in inflation, the trend in real income turned up in June 2022. As of June 2024, real disposable income had increased 6.4% in the past two years.

Macroeconomic Outlook
However, while real wages and incomes have been rising, households’ “excess” savings – that is the savings greater than the pre-pandemic trend – have been run down. According to estimates by the Federal Reserve Bank of San Francisco, excess savings peaked at $2.1 trillion in August 2021, and were exhausted in March 2024. In June 2024, according to the Bureau of Economic Analysis, the household saving rate was 3.4%, low relative to the average of 6.5% in 2017-19, so some caution about spending on the part of consumers would not be surprising going forward.

INTEREST RATES
The Fed’s efforts to constrain inflation have resulted in higher interest rates. The Fed had lowered its target range for the federal funds rate to 0-0.25% in March 2020 in response to the sharp fall in economic activity during the pandemic. It raised the target in a series of steps beginning in March 2022, reaching 5.255.50% in late July 2023. The intent of such a “restrictive” monetary policy is to cool inflation by reducing demand growth in the economy. The federal funds rate is the rate on overnight interbank loans. Changes in the federal funds rate directly influence other short-term rates, such as the yield on 30-day US Treasury notes. Longer-term rates, such as 30-year mortgage rates, are affected by expectations of future short-term rates. As confidence has risen that inflation has come under control, mortgage rates have started to fall in anticipation that the Fed will be able to shift to a more “neutral” monetary policy stance and reduce the federal funds rate target.

Interest Rates
Data; Freddie Mac, Federal Researve Board
Data: Bureau of Economic Analysis. Seasonally adjusted annual rate.
Real Disposable Personal Income
Avg. 30-year Mortgage Rate Federal Funds Rate
PRIME-AGE EMPLOYMENT RATE
A gradual rise in the unemployment rate – from 3.4% in April 2023 to 4.3% in July 2024 – has sparked concern about an economic downturn, as such modest increases in unemployment have historically been precursors to recessions. However, this increase has primarily been driven by an increase in job-seekers rather than a decrease in the number of persons who are employed (to be counted as unemployed, a person must be looking for work). The share of 25-54-yearolds who are working – the prime-age employment rate – stood at 80.9% in July 2024, tying its postpandemic high from summer 2023 and slightly above its pre-pandemic level. However, a clear softening of the labor market can be seen in other indicators such as a declining hiring rate and decelerating wage growth. Because the full impact of monetary policy changes occur with a considerable time lag, concerns have risen that the Fed has fallen “behind the curve.”
ECONOMIC FORECASTS
Economic forecasts expect continued growth with low unemployment and inflation according to the Survey of Professional Forecasters conducted by the Federal Reserve Bank of Philadelphia.
In the long run, GDP growth depends on the rate of increase in the labor force and gains in labor productivity (output per worker). Given population and productivity trends, growth of around 2% is generally considered healthy for the contemporary US economy. The

forecasts for the unemployment rate are consistent with economists’ estimates of the “natural rate” of unemployment – the level of unemployment consistent with a non-inflationary equilibrium (normal job turnover means that a small amount of “frictional” employment is always expected). At their June 11-12 2024 meeting, the summary of economic projections by participants on the Federal Open Market Committee – the Federal Reserve Board and regional Fed presidents – had a central tendency of 1.7%-2.0% for real GDP growth and 3.9%-4.3% for the unemployment rate in the longer run.
Forecasts for the US Economy
Data: Federal Reserve Bank of Philadelphia, August 9, 2024. Real GDP and the unemployment
Employment-Population Ratio, Age 25-54
Data: Bureau of Labor Statistics. Seasonally adjusted.
UCCS Economic Forum
College of Business and Administration
University of Colorado Colorado Springs (719) 255-3661 business.uccs.edu/economic-forum
University of Colorado Colorado Springs 1420 Austin Bluffs Parkway Colorado Springs, CO 80918 www.uccs.edu
28th