Methodological aspects for passenger mobility analysis using big data

Page 1

TECHNICAL PAPERS

METHODOLOGICAL ASPECTS FOR PASSENGER MOBILITY ANALYSIS USING BIG DATA

Technical Papers are monographic publications with scientific content, which explore issues related to the transport and mobility sector, from the point of view of the technical, environmental, economic, planning and modelling, taking into account the Interaction with innovative technologies. The authors belong to FS Research Centre, the in-house high-competence centre of FS Group for the development of studies and research on mobility themes, with a particular focus on sustainability and climate change, green transformation and decarbonisation of transport, Big Data and the Internet of Things, innovative transport systems, sharing economy, socio-economic and environmental impacts of transport systems, governance, ethics and fairness of mobility. FS Research Centre consists of a team of experts in mobility, transport, economy, environment, territory, data intelligence, geographic information systems and innovative technologies, which develop and use innovative mathematical models and data analysis systems. Publications are often written in collaboration with universities and other research institutes, institutions and public and private actors, both national and international.

ISBN: 978-88-940638-8-2

Ferrovie dello Stato Italiane SpA Piazza della Croce Rossa, 1 – 00161 Roma www.fsitaliane.it

All rights are reserved. No part of this publication can be reproduced, archived, translated, stored or transmitted in any form or by any means – electronic, mechanical, reprographic, digital – other than in the terms provided by the law that protects Copyright.

Ministero delle Infrastrutture e dei Trasporti

Photos

© FS Italiane Archive

© Adobe Stock (1, 11, 16, 25, 28-29, 30, 32, 48-49, 58-59, 60, 61, 62, 70, 72, 75, 76, 82, 93, 122)

2024 March

Opinions expressed are purely those of the authors and can’t be considered as an official position of FS Italiane, the Ministry of Infrastructure and Transport and Istat.

METHODOLOGICAL ASPECTS FOR PASSENGER MOBILITY ANALYSIS USING BIG DATA

PAPERS
TECHNICAL

1 | INTRODUCTION

1.1 Summary of contents

1.2 Bibliography

2 | DEFINITIONS

2.1 Types of indicators and reference infrastructures for data collection

2.2 Definition of Big Data

3 | GUIDELINES AND REFERENCE STANDARDS FOR MOBILITY DATA COLLECTION

3.1 Regulations for passenger transport statistics by mode of transport

3.2 Regulatory references for the production of indicators on mobility behaviour

3.3 Overview of the regulations for passenger mobility statistics on, with reference to statistical production.

4 | MOBILITY DATA SOURCES IN ITALY

4.1 Data from surveys, from administrative sources and other sources

4.2 Complementary sources to complete the knowledge framework

4.3 Reference sources for infrastructure and service representation

4.5 Summary of the main statistical surveys

5 | ANALYSIS OF SEVERAL CASE STUDIES ON PASSENGER MOBILITY

5.1 Analysis of the limitations of the current data sources for passenger mobility

5.2 Improving the information potential of traditional surveys through the use of Big Data

5.3 Bibliography

08 14 22 35 56

8.1 Formats and tools for storing, managing, and analysing Big Data 8.2 Big Data analysis and use for forecasting phenomena of interest 8.3 Use and future prospects of Big Data and Machine Learning in the field of transport

Summary 71 83 101 113 118 6 | THE BIG DATA LIFECYCLE 6.1 Reference architecture 6.2 Roles and Actors 6.3 The standardisation of data access 6.4 Bibliography 7 | EXTRACTION OF INFORMATION 7.1 Experimental analysis 7.2 Conclusions
| ANALYSIS AND MODELLING
| CONCLUSIONS
RECOMMENDATIONS
| ACRONYMS AND DEFINITIONS
8
8.4 Concluding remarks 8.5 Bibliography 9
AND
9.1 Future prospects 10

Mario Tartaglia 1 [0000-0003-3216-8150]

1. FS Research Centre, Florence, Italy

This paper is part of a project that arose in response to the institutional decision-makers’ and the industrial sector’s need for knowledge regarding certain aspects of mobility that are not yet comprehensively covered by the available statistical sources, official or otherwise, and the consequent demand for greater timeliness and continuity of information.

The current historical era, in which this analysis takes place, is referred to by some as the “Fourth Industrial Revolution”[1.1] : an ever-increasing number of people’s daily activities (travel planning, shopping, economic transactions, etc.) are being swallowed up by the “sea” of the digital world, which, in return, emits “waves” consisting of enormous quantities of data. These data have such large volumes and such distinctive features that a new term has been coined to describe them: “Big Data.” They are also characterised by specific properties, the main ones set out below will be explained in greater detail in chapter 2 “Definitions ”:

• Volume - referring to the amount of data.

• Velocity - speed of production.

• Variety - different types of data formats stored (photo, video, json, geo-json, etc. ).

• Veracity - a great uncertainty, because we do not really know the sample from which these data are extracted.

• Value - meaning the potential yet extremely important information value.

• Variability - the variability of even the form of the data, which creates considerable computer problems.

In the analysis of phenomena, therefore, traditional, structured surveys that produce “primary” data are increasingly being flanked by so-called “secondary” data, often originating from Big Data. However, it is important to note that Big Data exists regardless of the scientific questions that are sought to be answered

through its use, and it is often the secondary result of other activities. For instance, within the context of mobility, the information that can be collected from mobile devices is derived from their interaction with antennas and GPS systems for the ultimate purpose of making calls or exchanging messages and/or data, and not for the purpose of tracking people’s movements to investigate their mobility habits. Using human evolution as a metaphor, where human beings went from a nomadic lifestyle, out of the need to hunt and search for food, to a sedentary lifestyle, with the introduction of animal husbandry and agriculture, in the field of data the reverse process is occurring. In fact, while a “cultivator” of information sows the data he then wants to harvest, and therefore plans and structures the survey based on the type of information desired, with the use of Big Data the individual wanders in search of information where he thinks he might be able to find and extract it. In some ways, the use of Big Data for statistical purposes is similar to a recycling and reuse process. The other main difference between Big Data and traditional surveys is that the latter focus on the cause-and-effect relationships present in the phenomena they are investigating, whereas the former analyse the phenomenological aspects (i.e. the kinematic aspects, as far as mobility is concerned), or rather the ways in which they happen, and not the reasons. In short, as shown in Figure 1, Big Data has great potential in terms of providing large volumes of information, but actually has less potential in terms of depth of knowledge. Data obtained from traditional surveys, also known as “small data”, or “thick data” if they are predominantly qualitative, are able to provide more meaningful answers precisely because they are collected based on a plan which is determined by a specific need for knowledge.

METHODOLOGICAL ASPECTS FOR PASSENGER MOBILITY ANALYSIS USING BIG DATA 08
1 | INTRODUCTION

Depth of knowledge

For the purposes of mobility analysis, it is therefore necessary to reflect on how Big Data can be used and how it can be integrated with existing data collection campaigns, and that is where this study comes in.

The goal of the project is to establish and validate a strategy that uses IOT data and Big Data to fill in the information gaps regarding people’s movements within different territorial areas, providing descriptions for each of them:

• the limit of the data’s applicability;

• the quality and reliability of the estimate;

• the definitions to be adopted to identify the characteristics of each domain;

• the representativeness indicators of an O/D matrix of journeys by domain. The study places particular focus on passenger mobility, identifying and expanding upon the main instances reported in the international reference documents, with a disaggregated

territorial focus. Ideally, the work presented here will lead to the establishment and validation of a methodological document, even through the development of prototype elements aimed at creating mobility indicators for people, obtained from IOT/Big Data sources, with particular regard to Mobile Network Data (MND).

The first section of this paper is dedicated to the formal adoption of the definitions of mobility as a pivotal element of the phenomena to be investigated in order to obtain the information needed on the topic (reference population, recurrent mobility, mode of transport, motivation, domains of interest, classification by distance classes, etc.), with reference being made to both the Eurostat Guidelines on Passenger Mobility Statistics1 and to the entire body of statistical information aimed at providing a representation of mobility to the

1. https://ec.europa.eu/eurostat/documents/29567/3217334/Guidelines_on_Passenger_Mobility_Statistics+%282018_edition%29.pdf/f15955e3-d7b4-353b-7530-34c6c94d2ec1?t=1611654879518

INTRODUCTION 09
Data volume
Figure 1 - The relationship between Big Data and traditional surveys (freely adapted from Tricia Wang, 2016) Figure 1 - The relationship between Big Data and traditional surveys (freely adapted from Tricia Wang, 2016)

main users. After the regulatory analysis, the paper then delves into the description of the surveys, with a focus on the output indicators regarding mobility; the differences in the information produced by the various surveys are analysed, and the limitations for which the use of Big Data is sought as a solution are highlighted. The next step regards the determination of the Big Data production and quality control process, starting with the relevant best

1.1 | SUMMARY OF CONTENTS

The main topics covered in the chapters that make up the paper are summarised below.

• Chapter 2: Definitions

There are various types of variables and indicators used to represent mobility, depending on the perspective from which the phenomenon is observed. The traditional sources include activity indicators by mode of transport (of consistency, flow, traffic and performance), those related to the supply and demand of services (equipment, supply and demand levels, quality and satisfaction), and, finally, data regarding individual behaviour and choices (length and duration of journeys, origin/destination, motivations, and modal split). These can be flanked by “new sources”, the so-called Big Data, which arise for purposes other than the statistical representation of phenomena, and whose specific characteristics require them to be processed for statistical purposes using specific techniques, technologies, and professional skills. For both types of sources, it is also necessary to take into account the relevant infrastructures that generate them, based on which the data themselves are encoded.

Chapter 2 therefore contains the main indicators used to represent the phenomenon of mobility and the relevant infrastructures; it in-

practices and guidelines. The potential and limitations of Big Data, namely mobile phone data, are therefore illustrated, with applied examples in which the authors are involved. The applicability limits of the individual data types are clarified at this stage. Finally, a brief review is conducted of the Big Data processing techniques in relation to the increasingly interesting topic of Machine Learning.

troduces certain concepts relating to the world of Big Data, and briefly describes the types of Big Data that can be used within the context of mobility analyses.

• Chapter 3: Guidelines and reference standards for mobility data collection

In Italy, the reference standards for the statistical production of data on passenger mobility are based on a “mode of transport” approach, with a major gap being represented by the absence of standards for road passenger transport statistics; there is also no national regulatory reference for the statistical representation of mobility behaviour. The legislation determining the production of statistics by mode of transport is mainly established at the EU level in the form of Regulations or Directives, which are then transposed by the Italian legislative system. A number of European and Italian guidelines have been developed that are either directly or indirectly related to the production of mobility indicators.

Chapter 3 illustrates the main guidelines, regulations and standards applicable at the European and national levels. Regulatory references are also provided for activities involving the collection of mobility data regulated by guidelines or by law.

METHODOLOGICAL ASPECTS FOR PASSENGER MOBILITY ANALYSIS USING BIG DATA 10

• Chapter 4: Mobility data sources in Italy

Passenger mobility statistics are derived from numerous sources, which can be classified with respect to both their methodological characteristics and their information potential, thus determining whether they are considered “official statistics”, and the types of indicators comprising them, thus determining the perspective from which they represent the phenomenon. We therefore have a diverse set of processes, definitions and insights, which provide an extensive though not comprehensive description of mobility. Moreover, the available sources often respond to information and regulatory needs (see Chapter

3 “Guidelines and reference standards for mobility data collection”) of a different and non-overlapping nature. In addition, in order to produce complex and meaningful outputs, the surveys require considerable investments to be made in terms of resources to be used in a sustainable manner over time. For these reasons, obtaining an organic and comprehensive representation of the phenomenon in question is an important goal to strive for, for which the use of Big Data would certainly be an added value.

This chapter describes the mobility data sources, grouped by survey type (mobility behaviour, supply and demand, and mode of transport). A number of complementary sourc-

INTRODUCTION 11

es useful for establishing transport models and/or evaluating national and international strategies are also identified.

• Chapter 5: Analysis of several case studies on passenger mobility

The available data sources on mobility in Italy create a jagged and multi-faceted picture; on the one hand we have large amounts of data linked to specific sectors, while on the other hand we have comprehensive mobility surveys carried out on small samples. The first group includes data from transport service operators and infrastructure managers, such as railway ticketing data, and motorway and airport data; much of the data fails to overlap with that from other sectors, and only provides insight into mobility with respect to the organisation of that specific transport infrastructure. For example, when the former elements are considered for determining transport demand, and the generation and distribution of travel throughout the territory, the origins and destinations coincide with notable points of the infrastructure, such as train stations, motorway barriers and airports, and thus only provide a partial view of the origins/destinations of the journeys. Surveys such as the ISTAT census and the Isfort Audimob survey, on the other hand, provide very precise information on the origins and destinations of travel, but only on a partial sample of the population, because they are limited with respect to either the purpose of the journey, whether work or school, or with respect to the number of people interviewed.

Chapter 5 describes several limitations of the available data, and identifies a number of possible solutions from the perspective of technical/economic sustainability, examining some of the new prospects introduced by the use of Big Data.

• Chapter 6: The Big Data lifecycle

Due to the characteristics of the data and the processes that generate them, the Big

Data lifecycle requires the establishment of a dedicated pipeline, with entirely new process steps with respect to the traditional statistical processes involving estimates and indicators, such as those carried out on data from surveys or administrative sources. For instance, surveys are designed to meet specific knowledge needs, while administrative sources are selected based on how well they describe the phenomenon in question.

The approach to the use of Big Data requires the introduction of preliminary analysis stages, not only for their selection, but above all for the establishment of new processing methodologies. The use of these data requires personnel with specific skills in analysing large volumes of data, which are high variable and have an intrinsic information value that requires various kinds of technical knowledge in order to be managed. When combined with aspects like data access and privacy, these characteristics make it necessary to implement specific organisational measures, not only with regard to the entire data lifecycle process, but also with regard to the personnel, and the relationships with the suppliers, which are often external to the data user. In particular, the analysis of this type of data requires the introduction of innovative professional figures, such as data scientists, as well as dedicated Software and Hardware architectures. In general, one must be aware that the use of Big Data requires considerable investments, not only in terms of technical capabilities, but above all in terms of the acquisition of knowledge and qualified human resources.

Chapter 6 describes various proposals for standardising the Big Data handling process, starting with the European experience of the ESSnet Big Data project, and goes on to provide the proposed approaches to privacy protection.

• Chapter 7: Extraction of information

This chapter describes the experience gained in interacting with a telephone service pro-

METHODOLOGICAL ASPECTS FOR PASSENGER MOBILITY ANALYSIS USING BIG DATA 12

vider and the relative analysis company in order to acquire and use telephone Big Data to conduct mobility analyses throughout Italy.

The processes described were carried out by Ferrovie dello Stato Italiane Group’s FS Research Centre and Trenitalia Strategy Department, with the support of Vodafone Business and Motion Analytica, using the Vodafone Analytics generated by the Vodafone network (non-personal, anonymised and aggregated telephone Big Data, in full compliance with the GDPR privacy requirements). The first part describes the technical characteristics of the data utilised, and goes on to describe some of the processing operations carried out with the telephone Big Data, highlighting the critical issues encountered in dealing with these new types of data, including those which were resolved and those which remain open.

• Chapter 8: Analysis and modelling

Large amounts of data, in numbers far exceeding those of the samples used for traditional surveys, require new tools and techniques for the representation and extraction of the information, and for the use of that information for conducting analyses and forecasting in the field of transport.

In recent years, the increased interest in Big Data has been accompanied by exciting studies and tools related to artificial intelligence. The main use of Machine Learning in the field of Big Data is for the interpretation and analysis of the large amounts of information con-

1.2 | BIBLIOGRAPHY

tained therein. The other area of development between Big Data and Machine Learning is its application in the field of transport modelling for forecasting purposes; once “trained”, in fact, Machine Learning algorithms make it possible to predict the variables of interest whenever the initial input changes. The implementation and training of these algorithms requires a lot of data, and this need seems to be met by the “volume” characteristic of Big Data. Despite the consensus regarding the need to develop “models” based on Machine Learning and the potential offered by Big Data, the application of Big Data in the field of transport modelling raises certain doubts regarding the replacement of traditional approaches. These doubts regard the new techniques’ ability to reproduce the discretionary nature of user choice, and, above all, the lack of clarity surrounding the model’s functionality; in fact, unlike the traditional theoretical/ experimental approach, in which the laws governing the models are known, with this new system the model consists of a black box, which responds to inputs according to a logic that is not known to the user.

Chapter 8 discusses the main artificial intelligence techniques that arose in the 2000s, their possible applications in conjunction with Big Data in the field of transport, and the benefits and main limitations associated with the new techniques. Due to the speed at which the subject matter changes, the examples provided cannot be considered exhaustive.

INTRODUCTION 13
[1.1] Schwab K., 2016, “La quarta rivoluzione industriale” Franco Angeli

2 | DEFINITIONS

2.1 | TYPES OF INDICATORS AND REFERENCE INFRASTRUCTURES FOR DATA COLLECTION

2.1.1 | TYPES OF INDICATORS FOR REPRESENTING PASSENGER MOBILITY

The phenomenon of passenger mobility is complex and multi-faceted, as it is an important part of every country’s socio-economic fabric, and depends on it at the same time. For this reason, its qualitative-quantitative representation in the fields of research and statistics is also far from linear, having numerous aspects and perspectives, which we will attempt to outline below, highlighting its characteristics, even with regard to the relevant definitions and variables.

Generally speaking, there are four main perspectives in the field of national and international statistics, within the context of which mobility and certain other related phenomena must be represented in support of public and private activities and for the benefit of the community.

a. Representation of the activity and the performance with regard to the companies and infrastructures throughout the country, by mode of transport. This category includes a number of cases:

- consistency/point and flow data: number of passengers (e.g. number of passengers embarked/disembarked per port or airport; number of passengers transported per air route; number of passengers transported per mode and type of flow: national/international EU/Extra EU/ Total);

- traffic data: Vehicle-kilometres (Vkm), which represent the total number of kilometres travelled by different vehicle categories over a reference time period, and within

a defined territorial area (e.g: Total km travelled by passenger cars in Italy over a year; Total km travelled by light vehicles on extra-urban roads over a month, total km travelled by vehicle type, age, and fuel type). Number of vehicles that transited within a territorial area over a period of time (e.g. number of light vehicles transited on the A1 motorway in a month, average number of vehicles/day on road X between the hours of y1-y2, etc.);

- performance data: Passenger-kilometres (Pkm), which represent the total number of kilometres travelled by all passengers by mode of transport, and in relation to a defined territorial area and time frame. These coincide with the Vkm value in the case of a one-to-one correspondence between vehicle and passenger. The Pkm value is generally equal to the sum of the (individual) kms travelled for all the occupants of the vehicle. (e.g.: Passenger-kilometres travelled by rail within a region, during the quarter; Passenger-kilometres travelled within Italy, by private cars, in urban areas, during the reference year).

- The data in this category are generally collected in census form (with the possible application of thresholds or limitations to the field of observation, e.g. with regard to the ‘size’ of the enterprises involved, or other parameters), or through survey points located throughout the country, or else are derived from the processing of data obtained from public or private

14 METHODOLOGICAL ASPECTS FOR PASSENGER MOBILITY ANALYSIS USING BIG DATA

administrative registers. In most cases, these data are not obtained from surveys involving random samples of the reference statistical units.

b. Representation of the level/status of the infrastructure, of the service supply, and of their use and satisfaction. This perspective defines the phenomenon from the standpoint of the potential of the infrastructure and that of the supply/demand and the service planning, as well as from the standpoint of the citizens’ assessment of the quality of the services. These are quantitative and qualitative data, even of an administrative nature, and are related to the establishment of Urban Traffic Plans (UTPs), Urban Mobility Plans (UMPs), and Sustainable Urban Mobility Plans (SUMPs) at the local government level. This group includes:

- Existing infrastructure: the number of infrastructures present within a territorial area (e.g. ports, airports, train stations, fixed installations, funicular railways, cycle paths, electric vehicle charging points, LTZs, public car parks and park-and-rides, installed bicycle racks, road inventory, etc.). Qualitative-quantitative characteristics of the infrastructures present (e.g. length of the rail network, size of the port quays, existing inter-modal connections, port terminal equipment, equipment and characteristics of motorway service areas, etc.);

- Supply: level of mobility supply by type/ mode of transport (e.g. number of ride share vehicles available, number of trains, seats offered for LPT, number of LPT journeys, number of taxi licences, etc.);

- Potential and actual demand: (potential) ticket and pass data (e.g. number of LPT passes by type, train tickets sold, etc.): these express the potential impact of the mobility demand on the territorial area, but do not provide a measure of the transport system’s actual use. (actual)

data on the use of the transport system (e.g. number and territorial reference of authenticated tickets/passes, motorway toll sales, mileage travelled with shared vehicles, etc.);

- Quality and satisfaction level: satisfaction indices and indicators for the various aspects of the mobility services offered (e.g. for the use of LPT, ride share services, high-speed rail, etc.).

c. Representation of the mobility behaviour, journeys, and travels carried out by the population. This is a ‘subjective’ perspective, which describes and quantifies the mobility behaviour of the reference population, the modal choices, the purposes of the journeys, and the structure of the journeys themselves, even with regard to time domains (i.e. business days or holidays) and spatial domains (urban/non-urban, national/international). One of the characteristic features of this representation lies in the possibility of relating mobility behaviour to the socio-demographic characteristics of groups of individuals, which define the reference domains of the sets of indicators. The main reference variables/ indicators are as follows:

- Temporal: duration of the travel (e.g. average travel time in urban areas and on weekdays, per person/day);

- Spatial: length of travel (e.g. average distance travelled per person/day, average length of travel by purpose, etc.);

- Frequency/consistency: numerosity (e.g. average number of journeys per person/ day, average number of journeys per person/year, number of journeys per distance class with and without overnight stays, distribution of journeys by time slot, vehicle occupancy rate). Passenger-km: unlike that listed in case a), here this indicator is represented according to different types of domains (gender, purpose, age, etc.), as indicated in the introduction;

- Flow: Origin/Destination matrices (num-

DEFINITIONS 15

ber of people who habitually move from origins O1, O2, ...On, to destinations D1, D2, ...Dm; commuting matrices, etc.).

d. Representation of mobility-related phenomena. This case includes indicators and variables that contribute to further broadening and characterising the representative picture of people’s movements, or are influenced by the same. The main ones include a number of research and statistics issues:

- Tourism;

- Road accidents;

- Accessibility: experimental studies and models to measure the accessibility of places of interest, of particular importance in urban areas, also related to SDG Area

11. (e.g. share of the population living within a specific distance from places of public interest – e.g. schools, LPT stops, train stations, etc. That distance is generally defined in terms of the duration of travel on foot, or by a specific mode of transport; in this case we’re talking about accessibility for that mode, e.g. bicycle);

- Quantification of the incident population, or rather the population that, for whatever reason, has a relevant ‘impact’ i.e. moves from, to and within a given territory;

- Quantification of the atmospheric emissions of the means of transport;

- Turnover indices, economic results, investments of companies in the passenger transport sector.

16
ANALYSIS USING BIG DATA
METHODOLOGICAL ASPECTS FOR PASSENGER MOBILITY

2.1.2 | INFRASTRUCTURE AND REFERENCES FOR DATA ACQUISITION AND THE CREATION OF MOBILITY INDICATORS

In order to have a framework for the formal adoption of methodologies for creating mobility indicators that’s both theoretical and operational, it is useful to highlight the characteristics of the infrastructural and decision-making system within which the data are collected. Whether from an administrative source or from a statistical survey, the indicators generated or of interest refer to entities of a territorial, infrastructural or economic nature, both from that standpoint of observation and that of subsequent summary representation. Some of these are indicated below:

- Ports; airports; train stations; bus stations;

- Administrative/territorial units (Countries; Regions; Departments; Provinces/Metropolitan Cities; Municipalities; etc.);

- Trunk roads/highways; Motorways; Rail-

2.2 | DEFINITION OF BIG DATA

The concept of “Big Data” is closely linked to the evolution of technology, the massive use and spread of electronic devices that has created the so-called “Internet of Things” (IoT), and the dematerialisation of economic and financial transactions and many everyday activities (online shopping, social interaction, smart working, travel planning, etc.). They are the ‘digital footprints’ that we continuously leave in the system in which we live and operate. There are several defining paradigms in the literature that have sought to give an identity to the concept of Big Data (BD), which essentially consists of massive and persistent streams of data generated for different purposes. The most comprehensive definition is that of the “6V model.” According to this definition, Big Data consists of structured or unstructured information generated by devices, social media, digital platforms, and/or computer systems, charac-

way infrastructures by type;

- Companies/service providers;

- Resident population. It is also worth bearing in mind that the domains within which the indicators are to be calculated take additional classifications and reference entities of the following nature into account:

- Territorial: Functional Urban Areas, distance classes, urban/non-urban area, etc.;

- Modal: mode of transport, prevailing mode of transport;

- Temporal: weekday/holiday, time slots, recurrent mobility, habitual mobility, etc.;

- Socio-economic: gender, age, residence, etc.;

- Other attributes: vehicle age, vehicle fuel type, etc.

terised by the following:

- Volume: the amount of data generated is such that it cannot be handled, manipulated, or processed using common IT systems;

- Variety: the data consist of various types (structured, e.g. according to a layout; semi-structured, with coded and unstructured parts; unstructured, e.g. signals generated by systems, servers, etc.);

- Velocity: data are generated at high velocity, like a continuous flow;

- Veracity: data do not always guarantee reliability in terms of interpretation and translation into information useful for representing other phenomena;

- Value: data potential information generate an economic value;

- Variability: the consistency and coherence of the data flows over time is not

DEFINITIONS 17

guaranteed in terms of representativeness. For statistical research purposes, especially in the area of mobility, the points of contact between these massive data flows and the physical network of movements carried out by the population are useful for assessing whether

they can be used to represent mobility through indicators and models. It is also essential to develop tools, procedures, and methodologies aimed at manipulating and transforming the mass of raw information, in order to render it suitable for statistical and forecasting purposes.

2.2.1 | TYPES OF BIG DATA POTENTIALLY SUITABLE FOR REPRESENTING PASSENGER MOBILITY

As indicated by the definition provided in the previous section, Big Data is generated by numerous types of sources, each of which gives rise to completely different types of data with different drawbacks and advantages, which may or may not lend themselves to representing passenger mobility. Here we will highlight the main types of Big Data that can be further analysed for this purpose, with the focus being placed on their connections with some of the main indicators of interest, both in terms of affinity and divergence. The second part of this paper will discuss case studies involving mobile data in particular.

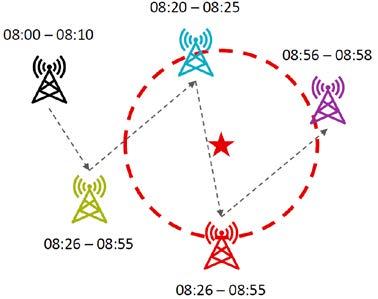
a. Mobile Network Data (MND) or Mobile Phone Data (MPD) There are two types: the first consists of the sequences exchanged at very close frequencies between the SIM cards inserted into the devices and the antennas that spread the signal, which are generated regardless of the occurrence of active events, such as calls, messages, or Internet connections. The second type, on the other hand, consists of the set of SIM-related data generated by the occurrence of those events. Signal data have the advantage of being very frequent, and thus allow the movements of individuals to be tracked more continuously, but are less precise in terms of localisation (due to the technical specifications and the positioning of antennas and cells associated with them); the event-generated data, on the other hand, although less frequent, allow for more precise localisation. Signal data are

generally used in case studies. In general, given the widespread dissemination of mobile telephone services, MND guarantee broad coverage of the population, but their nature and informative power must be analysed in depth in order to prevent their use from leading to a representation of the phenomenon that does not always correspond to reality. This type of data is generally used to extract the following types of information sets: user identifier (anonymised); signal time reference; antenna/hook cell identifier. It is important to bear in mind that some protocols re-establish user anonymisation at high frequency (even every two hours), which makes it impossible to identify mobility behaviour over longer time horizons.

b. Global Positioning System (GPS) data are generated by systems that record the positioning of devices via networks of satellites orbiting the Earth. They contain information on the positioning of mobile devices (Smartphones, Smartwatches, devices installed on vehicles for monitoring or navigation purposes, etc.), which are collected through the Apps installed on them. Unlike MND, they also contain the geographical coordinates of the places visited. Depending on the options selected by the user, they can track movements all the time, only when the relative App is in use, or else can be deactivated entirely (the latter option generally does not allow for the proper use of the App or inhibits it altogether, and is therefore a residual

18 METHODOLOGICAL ASPECTS FOR PASSENGER MOBILITY ANALYSIS USING BIG DATA

option). The collection and processing of data from multiple apps or devices for the same user also allows for a more accurate representation of the movements carried out, with any missing information being filled in by one or more sources. Some of these sources, which record the history and structure of the movements carried out by the person carrying the device (Google Live Traffic, Apple maps, Waze, etc.) are particularly useful for representing mobility from an objective (e.g. traffic congestion) and subjective perspective (e.g. routes most frequently used within a defined territorial area; the algorithms also manage to identify the vehicle used and the places visited with a good level of precision). However, they have certain critical issues, including difficulty in identifying the actual user of the device (multiple accounts on the same device or the same account on several devices can generate overlaps and errors), the possibility for users to deactivate them or to change the routes taken, and, last but not least, difficulties in accessing the data, as they are privately owned.

c. Social network data is information that users voluntarily enter into their social media profiles (Instagram, Twitter, Facebook, WhatsApp, Google, etc.) when describing or recounting information about the activities they perform throughout the day, recording their presence at the virtual places corresponding to the physical places where they perform those activities. While these data are discontinuous, and subject to a margin of error or approximation, they can be useful for verifying mobility events derived from other sources. For this type of data, particular care must be taken to protect confidentiality when accessing the relative information.

d. Floating car data (FCD) is information generated by satellite tracking systems and collected by ‘black boxes’ (OBUs – On Board Units) installed on the latest

generation of vehicles, even for insurance purposes. They are mainly used to quantify traffic, but can also be used for the representation of route data. The information they contain is related to the georeferencing of the movements, time references, speed of travel, etc. This type of data can be used in synergy with traffic and transit data acquired with the implementation and use of “Smart road” systems (V2Icommunication between infrastructure and vehicle - and V2V - communication between vehicles), which envisage the installation of various types of sensors (loops for detecting the passage of vehicles, cameras for automatic plate recognition, sensors communicating with vehicles, etc.) along sections of roadway, with the aim of optimising traffic and routes through digital communication with and between passing vehicles, thus increasing safety levels and promoting the use of self-driving vehicles. The information contained in “smart road” data involves the detection of numerous variables, including: geo-referencing of observation points, vehicle type, distance between vehicles, speed, exact time reference, and reference to detected lanes/roads and direction of travel, with continuous detection and transmission to the data hub at intervals of just a few minutes. The vehicle trip data (recording of an ‘entry’ and ‘exit’ event on the road for the same vehicle, identified and anonymised) are of a sampling type, and can be associated with the reference population, which consists of all the vehicles ‘recorded’ by the sensors on the road section in question.

e. Shared mobility data consists of data acquired from fleets of shared vehicles (cars, motorcycles, scooters, ebikes, etc.). They provide information about the vehicles’ locations at the origin and destination of their journeys (even in relation to interchanges, such as railway and LPT stations), the mileage travelled, and the

DEFINITIONS 19

travel times. The data can be correlated to the socio-economic characteristics of the user. They can be used to generate a representation of the use of different modes of transport in urban areas and the inter-modal choices.

f. Smart card data is information acquired through the use of electronic cards (with built-in RFID, NFC, etc. technologies), which communicate via radio waves with fixed devices used to access various types of places. These devices include electronic passes for local public transport, and cards that combine LPT access with admission to other places of interest (museums, etc.), which are generally used by tourists and visitors. These devices therefore record a wealth of very detailed information about the individual, the places visited, and the means of transport utilised. One limitation in their use for the purpose of representing individual mobility behaviour lies in the fact that, in many cases, they make it possible to record access to or use of a vehicle, but not its trajectory (entry and exit).

g. Points of interest data (POI) are derived from Apps and databases (e.g. Google places) that identify places at specific geographical coordinates classified based on their attributes (e.g. schools, museums, offices, ministries, entertainment venues, shopping centres, etc.). Therefore, when combined with other data sources, such as mobile phone data, this information makes it possible to identify the purposes of the travel, and therefore the motivations for the mobility, with a certain degree of approximation.

h. Land-use data are generally satellite images from which information of various kinds can be derived, which can be used to feed into models for describing and predicting passenger mobility, or to represent related phenomena. One area in which they are used is for accessibility studies. Another type of data that falls under this category are spatial representations created using collaborative systems, in which users voluntarily contribute to defining the structure of the territory and the infrastructure located therein, using applications like the Open Street Map project.

i. Automatic Identification System data (AIS). AIS systems are based on GPS technology and radio channels, and allow for the positioning, and therefore the trajectories, of ships to be determined. AIS data are used for numerous applications to generate statistics, especially maritime traffic and accidents, as well as to estimate emissions. These consist of character sequences that require pre-processing for filtering and decoding in order to be used for statistical purposes. One of the most critical issues lies in the availability of the data, which are held by several public and private entities, thus limiting their accessibility.

20 METHODOLOGICAL
FOR PASSENGER MOBILITY ANALYSIS USING BIG DATA
ASPECTS

2.2.2 | INFRASTRUCTURE AND BIG DATA REFERENCES FOR MOBILITY

In order to identify the points of contact and divergence between the spatial/temporal and conceptual references with which ‘traditional’ data are observed and statistical indicators on passenger mobility, and those related to Big Data that could be used for the same purpose, and produced, a brief examination of some of the latter is useful, as was done in section 2.1.2 for traditional data and indicators.

- Data acquired through personal mobile devices (SIM cards, smartphones, smartwatches, cards, etc.) refer to accounts or account holders, without any certainty that the account holder corresponds to the user of the device. While this correspondence is more likely in some cases (smart cards), it can be all but excluded in other cases, such as corporate Sim cards. This makes it problematic, for example, to relate the data collected to the social/demographic characteristics of the person in movement;

- The data acquired through fixed sensors on the roadway (e.g. traffic counters, smart traffic lights, smart roads) are referenced to spatial entities that, with some difficulty, could be referenced to other geographical entities (e.g. the trunk road

associated with the province or region, if close to the borders);

- Mobile network data acquired with reference to antennas and their cells require complex probabilistic processing in order to be traced back to commonly used geographical or spatial references, especially in high-density areas where cells often overlap or are irregularly shaped.

- As illustrated in the previous section, there are different types of data acquired through sensors installed on vehicles. Floating car data provide information on the passage or trajectories of vehicles, but say nothing about their occupants. GPS coordinates, however, when available, directly refer to well-defined territorial areas (e.g. regions, municipalities), at least up to a certain point. The data associated with the counting of LPT passengers accessing a vehicle (boarding/deboarding counters, excluding smart card type data that require an action by the passenger) provide a measure of vehicle occupancy and passenger-km travelled, but not origin/destination trajectories, as the individual passengers are not identified.

DEFINITIONS 21

3 | GUIDELINES AND REFERENCE STANDARDS FOR MOBILITY DATA COLLECTION

Giovanna Astori 1 , Giovanni Zacchi 2 , Francesca Sieli 2

1. ISTAT, Rome, Italy

2. MIT, General directorate for digitalisation, information and statistical systems, Rome, Italy

3.1 | REGULATIONS FOR PASSENGER TRANSPORT STATISTICS BY MODE OF TRANSPORT

The regulatory sources for statistics production by mode of transport in Europe and Italy are the following:

a. Regulations (EC) 437/2003 and 1358/2003 (Air Transport). The purpose of Regulation (EC) 437/2003 is to establish a sound statistical basis for the establishment of EU air transport policies. The need for comparable, consistent, synchronised, and regular statistical data regarding the levels and dynamics of passenger, freight and postal air transport has led to the determination of all the aspects necessary to produce standardised indicators. The aforementioned Regulation is supplemented by implementing regulation (EC) no. 1358/2003, which contains important methodological information, such as the airport categories subject to reporting obligations, as well as additional definitions, and coding guidelines. The shared collection of data on a comparable or harmonised basis allows for an integrated system that provides reliable, consistent, and timely information. Every EU country must collect statistical data on: passengers, cargo and mail, flights, seats available for passengers, and aircraft movements from all the airports within their territory that have more than 150,000 passenger units per year. Airports with 15,000 to 150,000 passenger units are required to collect less detailed statistics, while those with less than 15,000 passenger units are not required to collect statistics at all. In order to minimise the burden on the declarant, to the extent possible,

the collection of the data is based on readily available sources.

b. Directive no. 2009/42/EC of the European Parliament and of the Council; EU REGULATION no. 1090/2010 of the European Parliament and of the Council; EU REGULATION no. 1239/2019 (Maritime Transport).

In order to ensure a harmonised representation of the maritime transport phenomenon through statistical indicators, the European legislation (Directive 2009/42/EC and EU Regulation 1090/2010) provides for the implementation of a continuous survey of ship arrivals and departures from Italian ports, of goods loaded and unloaded, and of passengers transported. The reference population is the Italian ports, for each of which the ship arrivals and departures, and the embarkation and disembarkation of passengers (and goods), are observed and recorded. The data are collected from companies operating in the sector (shipping agents, shipowners, freight forwarders, etc.).

EU Regulation no. 1239/2019 introduces an interoperable European maritime single window environment (EMSWe) with harmonised interfaces, to simplify reporting obligations for ships arriving at, staying in, and departing from European Union (EU) ports. It aims to improve the European maritime transport sector’s competitiveness and efficiency by reducing administrative burden and introducing a simplified digital information system.

The EMSWe is the legal and technical frame -

22 METHODOLOGICAL ASPECTS FOR PASSENGER MOBILITY ANALYSIS USING BIG DATA

work for the electronic transmission of information about reporting obligations for ships calling at EU ports. It is a network of maritime national single windows with harmonised reporting interfaces and includes data exchanges using SafeSeaNet and other systems, along with services for: user registry and access management; common addressing service; EMSWe ship database; common location database; common hazardous material database; ship sanitation database. The regulation maintains the existing maritime national single window in each EU Member State as the basis for a technologically neutral and interoperable EMSWe.

The European Commission is empowered to adopt delegated acts to establish a new common EMSWe dataset, incorporating and adapting the most relevant requirements in existing national or EU legislation, in order to harmonise the existing national systems and reduce the need for paper media.

c. EC Regulation no. 91/2003; EU Regulation no. 2032/2016; EU Regulation no. 643/2018 (Rail Transport)

EU Regulation no. 643/2018 recasts and replaces EC Regulation no. 91/2003 (as amended). It applies to all EU railways. It establishes common standards for the production of rail transport statistics at the EU level. Member states must provide statistics for all rail transport operations carried out within their territories, and break them down by country if the service is international. Companies may be excluded from the statistics if:

- they operate within industrial zones or ports;

- they provide local tourism services, such as historic steam trains.

The indicators are updated quarterly, annually, or every five years (see Chapter 4 below, entitled “Mobility data sources in Italy”). National information collected by a public or private body may come from: compulsory surveys; administrative or regulatory data; estimation

procedures for statistical purposes; professional organisations operating in the railway sector; specific studies. Eurostat develops and updates the harmonised methodology to ensure quality data. The Commission needs rail statistics to monitor and develop the common transport policy, including the trans-European networks, and to take action to improve rail transport safety. Common standards and concepts ensure that the national statistics are comparable and that duplications are avoided.

d. Other Italian sources

Finally, art. 3 of Italian Law no. 1085 of 1967 states:

“The Ministry of Transport and Civil Aviation shall be responsible for the preparation of a national transport survey, in which the expenditure incurred by the State, other public bodies, and private sector entities for the operation and investment in the areas under the purview of the Ministry of Transport and Civil Aviation, both globally and by individual means, shall be taken into account, for the purposes of determining transport policy directives, and in accordance with the indications of the national economic plan.”

Therefore, every year the Ministry of Infrastructure and Transport (MIT) publishes the National Infrastructure and Transport Survey (NITS), which, in addition to fulfilling the requirements of the aforementioned regulatory source, since its first editions has also contained an increasingly vast and as comprehensive as possible collection of additional indicators produced by multiple sources to illustrate the complex and multi-faceted transport and mobility sector.

GUIDELINES AND REFERENCE STANDARDS FOR MOBILITY DATA COLLECTION 23

3.2 | REGULATORY REFERENCES FOR THE PRODUCTION OF INDICATORS ON MOBILITY BEHAVIOUR

With regard to the production of harmonised indicators on mobility behaviour, the only recent methodological/procedural reference are the Eurostat guidelines on Passenger Mobility Statistics, which do not constitute a commitment on the part of the member states since, by definition, they are merely a system of indications aimed at guaranteeing an information framework that’s harmonised in terms of the quality and comparability of the indicators produced.

Another possible reference at the national level are the guidelines for the preparation of SUMPs (Sustainable Urban Mobility Plans). This document establishes both the strategic objectives to be met by the SUMPs, and the sets of indicators to be used for their evaluation, which include infrastructure and accessibility indicators, the organisation

of services and their levels of satisfaction, mobility supply and demand, and accidents. Unlike the Eurostat Guidelines, the objective here is not strictly related to the production of statistical information, so the methodological elements necessary to achieve that goal are not defined.

In addition, Interministerial Decree no. 179 of 12/5/2021, concerning the “Implementation of the provisions relating to the figure of the mobility manager” defines the information perimeter for the management and optimisation of mobility by company, school and area mobility managers for work purposes (and of school mobility, only on a voluntary basis), in order to reduce the use of private vehicles, with the establishment of Home-to-Work Travel Plans (HTWTs) and the guidelines for their preparation and monitoring.

3.2.1 | EUROSTAT GUIDELINES ON PASSENGER MOBILITY STATISTICS

The handbook is a thematic and methodological support, which examines all aspects useful for delineating the field of observation and ensuring the harmonised production of information on passenger mobility behaviour. It contains: the definitions agreed upon by the Member States to describe the aforementioned phenomena (concepts, variables, classifications, methodologies); the sets of reference indicators (of reference for the provision of estimates to Eurostat, even in relation to projects that can be financed with grant agreements, divided into ‘minimum’ reference indicators, meaning a basic outline of the breakdowns to be adopted in order to provide an overall representation of the phenomenon and ‘optimal’ reference indicators, with a more disaggregated detail of the modalities for certain estimation domains); the

quality parameters; the metadata and procedures used by the Member States already conducting the survey, including facsimiles of the questionnaires used for data collection. The Guidelines are structured along the lines of the mobility categories by distance. In particular, a distinction is drawn between journeys over short distances (‘local’ mobility), and journeys over medium to long distances. This approach identifies two phenomena in mobility behaviour that are complementary yet different, requiring a different definitional and methodological framework for proper measurement and interpretation.

Short-distance journeys (up to 300 km), which include the specific sub-domain of urban mobility, are generally daily journeys of brief duration (minutes, hours), carried out using several modes and for different reasons, and

24 METHODOLOGICAL ASPECTS FOR PASSENGER MOBILITY ANALYSIS USING BIG DATA

have the ‘log’ as an elective survey instrument. Medium- to long-distance journeys, on the other hand, are less frequent, in part involve the use of modes of transport other than local transport (e.g. air), and may or may not involve overnight stays. The retrospective survey is the preferred survey technique for this mobility category.

The sets of indicators identified in the Guidelines are differentiated by these two mobility categories.

The categorisation criteria for the local mobility indicators are based on the “urban” and “non-urban” mobility paradigm (according to the agreed definition, which refers to the Functional Urban Area or FUA. An alternative definition can also be used, where “local mobility” is defined as journeys within 300 km, and “urban mobility” as journeys within 100 km). The indicators for medium to long-distance journeys are based on mobility

by distance classes (medium - 301 to 999 km, and long - over 1000 km), and the journeys are further distinguished based on whether overnight accommodations are involved. The target population is people 15 to 84 years of age.

The basic aspects are the following: journey, trip, distance, duration, mode (or modality) and means, and motivation (according to an agreed classification).

The indicators refer to all days of the week, divided into the domains: working days, non-working days, and total.

While the indicator sets do not involve the elaboration of O/D matrices, the acquisition of specific georeferenced information (addresses and/or coordinates of origin and destination of journeys, postal codes) can be useful for determining both the approximate domains (urban/non-urban mobility) and the distances travelled, with greater precision.

GUIDELINES AND REFERENCE STANDARDS FOR MOBILITY DATA COLLECTION 25

The indicator sets identified in the guidelines are shown in the summary table:

Group of indicators

1. SURVEY QUALITY

2. INDICATORS OF THE NUMBER OF TRIPS/ JOURNEYS PER PERSON

3. INDICATORS OF DISTANCE PER PERSON

Local mobility

• Sample size

• Reference population

• Response rate

Reference mode

• Net sample (number of respondents)

• Share of passengers

• Total number of journeys

Number of journeys per person/day broken down by:

• Urban/total mobility

• Main mode

• Purpose

Average distance per person/day broken down by:

• Urban/total mobility

• Working/non-working day

• Mode

• Vehicle fuel type (passenger car)

• Purpose

4. INDICATORS OF TRIP/ JOURNEY DURATION

5. ANNUAL PASSENGERKMS FOR THE REFERENCE POPULATION

6. VEHICLE OCCUPANCY RATE (FOR PASSENGER CARS AND TAXIS)

Average travel time per person/day broken down by:

• Urban/total mobility

• Working/non-working day

• Mode

• Purpose

Total kilometres travelled (for the reference population and calendar year), broken down by:

• Urban/total mobility

• Working/non-working day

• Mode

• Vehicle fuel type (passenger car)

• Purpose

Vehicle occupancy rate broken down by:

• Urban/total mobility

• Working/non-working day

Medium to long distances

• Sample size

• Reference population

• Response rate

• Net sample (number of respondents)

• Total number of journeys

Number of journeys per person/ year broken down by:

• Distance classes

• Main mode

• Purpose

Average distance per person/ year broken down by:

• Mode

• Vehicle fuel type (passenger car)

• Purpose

Total number of overnight stays

Total kilometres travelled (for the reference population and calendar year), broken down by:

• Mode

• Vehicle fuel type (passenger car)

• Purpose

Vehicle occupancy rate for passenger cars and taxis

Table 1-Indicators identified in the Eurostat Guidelines on Passenger Mobility Statistics

26 METHODOLOGICAL ASPECTS FOR PASSENGER MOBILITY ANALYSIS USING BIG DATA

3.2.2 | ITALIAN LEGISLATION AND GUIDELINES

a. Legislation and guidelines for Sustainable Urban Mobility Plans (SUMPs):

- DM MIT 397/2017 “Identification of the guidelines for sustainable urban mobility plans, pursuant to Article 3(7) of Legislative Decree no. 257 of 16 December 2016” and

- DM MIT 396/2019 “Amendment to the guidelines for the drafting of the sustainable urban mobility plans (SUMPs) referred to in Ministerial Decree 397/2017”.

- Handbook for the drafting of the sustainable urban mobility plan (SUMP) drawn up by the working group of experts from the MIT’s Technical mission structure and the General Directorate of LPT and the Polytechnic University of Milan, published in September of 2022.

These three legislative/procedural sources indicate a series of actions for the preparation and monitoring of Sustainable Urban Mobility Plans (SUMPs). From the Handbook: “[Definition, from Annex I to Ministerial Decree 397/2017] The SUMP is a strategic planning tool that, over a medium to long term time horizon (10 years), provides for a systemic vision of urban mobility (preferably referring to the area of the Metropolitan City, where defined), proposing the achievement of environmental, social and economic sustainability goals through the establishment of actions aimed at improving the effectiveness and efficiency of the mobility system and its integration with urban and territorial planning and developments.”

[...] For metropolitan cities, municipalities and associations of municipalities with more than 100,000 inhabitants, the Italian Guidelines establish the obligation to adopt the SUMP (art. 3.1 of Ministerial Decree no. 397/2017 as amended)

[...] For metropolitan cities and municipalities with populations of more than 100,000

inhabitants, which are not included within the territory of metropolitan cities, the adoption of the SUMP is also a requirement for gaining access to state funding for new mass rapid transport and cycle mobility interventions.

[...] The Italian Guidelines constitute the main legislative reference to be followed for the drafting of the SUMP, and consist of:

A. a standard procedure for the drafting and approval of SUMPs, divided into 8 procedural steps, and laid out in Annex 1 to Ministerial Decree no. 397/2017 as amended;

B. the identification of the reference strategies, the main specific objectives, the actions, and the indicators to be used for monitoring, according to Annex 1 to Ministerial Decree no. 397/2017 as amended.

[...] planning process that can be divided into 2 main blocks: preliminary activities and the actual drafting of the SUMP.

The preliminary activities are laid out in the procedural steps dedicated to:

• The establishment of the interdisciplinary/ inter-institutional working group

• The design of the participatory process

• [...] The drafting of the SUMP is then divided into four clearly defined procedural steps:

• Preparation of the framework of knowledge

• Establishment of the objectives

• Construction of the plan scenario

• Establishment of the monitoring plan

• [...] The Italian Guidelines provide for two other procedural steps:

• Strategic Environmental Assessment (SEA)

• Adoption and approval of the SUMP

The cited references also state that:

[...] The SUMP’s minimum geographical perimeter consists of the administrative boundaries of the entity required to draw up the SUMP.

GUIDELINES AND REFERENCE STANDARDS FOR MOBILITY DATA COLLECTION 27

However, this perimeter can be expanded, and for this purpose reference can be made to the Functional Urban Areas concept adopted by the European Guidelines. There is thus a convergence between the territorial definition adopted by the legislation for SUMPs and that of the Eurostat Guidelines on Passenger Mobility Statistics (see section 3.2.1 above, under the definition of urban mobility).

The preparation of the knowledge framework includes the analysis of the mobility flows using various tools, from the collection of information from LPT operators and vehicle sharing services, to the conduct of direct surveys of

citizens; it also includes the use of transport models for the estimation of one or more O/D matrices (general, by mode of transport, by peak/off-peak hours, etc.).

The procedural plan provides for the establishment of macro-objectives (17 mandatory objectives laid out in the Italian Guidelines, plus possible optional ones), specific objectives useful for the achievement of the macro-objectives, and objectives specific to the local situation.

28 METHODOLOGICAL ASPECTS FOR PASSENGER MOBILITY ANALYSIS USING BIG DATA

Each macro-objective is associated with a set of results indicators, for each of which the sources and targets envisaged over the short (2-3 years), medium (5 years) and long term (10 years) must be established; for details on the macro-objectives, please refer to section 3.4 of the Ministry of Infrastructure and Transport’s Handbook for the drafting of the SUMP2 The mandatory macro-objectives can be complemented with additional macro-objectives, and possibly specific objectives for the territorial system concerned. For each of these, sets of indicators must be established in order to monitor and evaluate the actions undertaken with the Plan.

The European SUMP Guidelines propose common sets of indicators for the mandatory macro-objectives, while the indicators listed in DM 397/2017 (Table 2, Annex 2)3 and the indicators for Sustainable Urban Mobility developed by the European Commission are proposed for the additional macro-objectives and for the specific objectives. The set of indicators for the mandatory macro-objectives is laid out in the Handbook. Among them, those which are of particular interest with regard to the measurement of passenger flows are the ones relating to macro-objectives a.1, a.2 and a.3, which are indicated below with the possible sources:

2. https://www.mit.gov.it/nfsmitgov/files/media/documentazione/2022-11/VademecumPUMS_ver.31122.pdf

3. https://www.gazzettaufficiale.it/eli/id/2017/10/05/17A06675/sg

GUIDELINES AND REFERENCE STANDARDS FOR MOBILITY DATA COLLECTION
29

The legislation stipulates that monitoring must be carried out at least every two years. For this purpose, administrations should equip themselves with a Monitoring Dashboard, or rather a system for collecting and processing data so that they will have a complete overview of the necessary indicators.

b. Legislation and guidelines for Hometo-Work Travel Plan (HTWTs):

- Law 221/2015 “Environmental provisions to promote Green Economy measures and to limit the excessive use of natural resources.” (Art. 5.6, establishment of the figure of the Mobility Manager);

- MITE/MIT Interministerial Decree no. 179 of 12/5/2021 concerning the “Implementation of the provisions relating to the figure of the mobility manager”, as amended;

- Decree Law 16 June 2022 - converted into Law no. 108/2022; Guidelines for the drafting and implementation of Home-to-Work Travel Plans (HTWTs).

Ministerial Decree 179/2021 establishes the institution of the figure of the Mobility Manager (MM) (mandatory in regional cap -

itals, metropolitan cities, provincial capitals, and municipalities with populations of over 50,000 inhabitants), which is tasked with providing continuous professional support for decision-making, planning, and scheduling activities, and for the management and promotion of optimal sustainable mobility solutions:

- Company MM , (for the companies and public administrations referred to under art. 1.2 of Legislative Decree no. 165 of 30 March 2001, with individual local units with more than 100 employees), a figure specialising in the management of mobility demand and the promotion of sustainable mobility within the context of employee commuting;

- Area MM , a figure specialising in providing support to the territorially competent municipality to which he/she is appointed, in establishing and implementing sustainable mobility policies, and in carrying out liaison activities between the Company MMs.

Companies and public administrations that do not fall within this definition can still opt to appoint a company mobility manager.

30
ANALYSIS USING BIG DATA
METHODOLOGICAL ASPECTS FOR PASSENGER MOBILITY

- School MM (art. 8.12bis of Decree Law no. 68 of 16 June 2022 - converted into Law 108/2022):

“Scholastic institutions, either networked or individually, shall appoint a school Mobility Manager from among the teaching staff, without exemption from teaching, or else shall appoint an external professional figure, in a manner consistent with the education plan. The school MM is responsible for:

• promoting a culture of sustainable mobility;

• promoting the use of cycling and pedestrian mobility, and rental and sharing services using electric or environmentally friendly vehicles;

• supporting the Area MM, if appointed, and the competent local administrations in the adoption of sustainable mobility measures, providing elements to facilitate the sustainability of travel for school staff and students;

• reporting any needs relating to school transport and the transport of persons with disabilities to the competent local entity.”

In collaboration with the Company MMs, the Area MM is tasked with preparing the Hometo-Work Travel Plan (HTWT), or rather a tool for planning the systematic home-to-work travel of employees, starting with those for each individual local work unit. To facilitate this task, Guidelines have been prepared, in which the indicators for monitoring are also laid out.

Excerpt from the Guidelines:

“It is necessary to collect all information and data on the staff mobility needs and to know the structural conditions of the company, the available means of transport in the area, and the resources available for the possible

implementation of measures to improve staff mobility. The information and analysis part of the HTWT must contain:

• Analysis of structural business conditions and available means of transport;

• Analysis of home-to-work travel” […]

“In order to establish a framework of the home-to-work travel for the company’s various locations, it is first necessary to categorise the employees based on residence and work schedule type. For the purpose of analysing the territorial distribution of the employees’ residences, the workforce can be broken down by “postal code”, or by “traffic zones”, based on the territorial zoning adopted by the mobility simulation models available from the municipal administration. With regard to work schedules, the personnel can be classified based on typical types of shifts: the reference parameters are working days and shift start and end times.

[...] In order to investigate the elements useful for understanding the employees’ travel habits and needs, as well as their willingness to change, the company mobility manager must also carry out a specific data collection campaign, using a questionnaire to be administered to each employee.”

The drafting of the HTWT thus entails a precise statistical survey phase of habitual mobility. The indications regarding the minimum necessary information to be collected are provided in Annex 3 to the Guidelines 4 , and provide detailed information on both the territorial localisation of the journeys, the means utilised (even in multi-modal combination) and the reasons for these choices, and the structure of the mobility behaviour (timetables, weekly frequency).

4. https://www.mit.gov.it/nfsmitgov/files/media/documentazione/2021-08/2021.08.03_Linee_guida_PSCL_-_finale.pdf

GUIDELINES AND REFERENCE STANDARDS FOR MOBILITY DATA COLLECTION 31
32
METHODOLOGICAL ASPECTS FOR PASSENGER MOBILITY ANALYSIS USING BIG DATA

3.3 | OVERVIEW OF THE REGULATIONS FOR PASSENGER MOBILITY STATISTICS ON, WITH REFERENCE TO STATISTICAL PRODUCTION

An overview of the analysis of the regulatory sources mentioned in sections 3.1 and 3.2 is provided in the table below, in connection with existing or potential statistical production. Specific

Law 1085 of 31/10/1967

Regulations (EC) 437/2003 and 1358/2003

YES

1) Directive no. 2009/42/EC of the European Parliament and of the Council

2) EU REGULATION no. 1090/2010 of the European Parliament and of the Council

3) EU REGULATION no. 1239/2019

YES

Introduces the publication of a collection of statistical information regarding certain phenomena relating to transport and mobility among the institutional duties of the Ministry of Transport

These establish a sound statistical basis for the establishment of European Union (EU) air transport policies with comparable, consistent, synchronised and regular data, with common defining and methodological elements.

YES

1) Local public transport (MIT00018)

2) Maritime connections with the islands (PSN MIT-00024)

Air transport survey (PSN IST00145)

MIT in place

Production and dissemination of maritime transport statistics

Maritime Transport (PSN IST-00818)

ISTAT in place

ISTAT in place

GUIDELINES AND REFERENCE STANDARDS FOR MOBILITY DATA COLLECTION 33
for statistics on passenger mobility PSN Description Statistical production on passenger mobility Producer Implementation of production
standards or guidelines

Specific standards or guidelines

1) EC Regulation no. 91/2003

2) EU Regulation no. 2032/2016

3) EU Regulation no. 643/2018

Eurostat Guidelines on Passenger mobility statistics

YES

Common standards for the production of rail transport statistics at the EU level.

YES

Rail Transport (IST-01646)

ISTAT in place

1) DM MIT

397/2017

2) DM MIT

396/2019

3) Handbook for the drafting of the sustainable urban mobility plan (SUMP)

YES

EU-defined reference methodology for the harmonised statistical production of indicator sets on passenger mobility.

Regulations and guidelines for Sustainable Urban Mobility Plans (SUMPs): these indicate a series of actions for the preparation and monitoring of Sustainable Urban Mobility Plans (SUMPs).

Audimob - Survey of mobility styles and behaviour of residents in Italy (PSN IFT-0001)

1) 2-510 year monitoring of SUMPs

2) Environmental data collection in cities (PSN IST-00907)

ISFORT in place

1) Law 221/2015

2) DM MITE/MIT 179/2021

3) Law 108/2022

4) Guidelines for the drafting and implementation of home-to-work travel plans (HTWTs).

NO Establishment of the figure of the Mobility Manager and implementation and monitoring of Home-toWork Travel Plans (HTWT)

Periodic monitoring of HTWTs

Table 2 – Summary of regulatory sources related to statistical production

1) Metropolitan cities, municipal-ities and associ-ations of munic-ipalities with more than 100,000 inhab-itants (mandato-ry); Optional for other municipal-ities

2) ISTAT

Regional capitals, metropolitan cities, provincial capitals, and municipalities with populations of over 50,000 inhabitants

potential (partly in place)

potential (partly in place)

34
METHODOLOGICAL ASPECTS FOR PASSENGER MOBILITY ANALYSIS USING BIG DATA
for statistics on passenger mobility PSN Description Statistical production on passenger mobility Producer Implementation of production

4 | MOBILITY DATA SOURCES IN ITALY

Giovanna Astori 1 , Mario Tartaglia 2[0000-0003-3216-8150]

1. ISTAT, Rome, Italy

2. FS Research Centre, Florence, Italy

4.1 | DATA FROM SURVEYS, FROM ADMINISTRATIVE SOURCES AND OTHER SOURCES

4.1.1 | MOBILITY BEHAVIOUR SURVEYS

Within the context of Italy’s national statistics system (SISTAN) there are ample and multi-faceted statistical indicators on mobility behaviour, which serve as a good starting point for building a broad information landscape to represent the phenomenon. However, none of the sources identified are exhaustive per se, and there are deviations from the definitions and methodological recommendations contained in the Eurostat Guidelines in many respects. The main characteristics and possible uses for each source are outlined below.

a. Audimob Observatory “Survey on mobility styles and behaviour of residents in Italy” (Isfort)

This is an annual survey primarily dedicated to the observation of the phenomenon of local and urban mobility. As of 2021, its reference methodology has been fully adapted to the Eurostat Guidelines. It includes:

- A reference population of residents 14-84 years of age;

- A quota sample of over 16,000 individuals, optimised with regard to the domains of gender, age and region of residence (with an oversampling for metropolitan cities);

- The observation of all journeys made on the day prior to the interview (covering both weekdays and holidays) through the completion of a log detailing each journey. The socio-economic characteristics of the respondent are also recorded, as well as information on the vehicles available to them;

- The main variables are: time, duration, length, origin, destination, motivation, means of travel utilised (detailed by modal stage), vehicle fuel source if a private car, and other accompanying persons during the journey;

- The survey technique is mixed: CATI (70%) CAWI (30%);

- Non-response is cancelled by replacing the units with quotas.

The indicators published in the Audimob report have an annual time reference and a national territorial reference. The available indicators are shown below for each domain variable:

- Classes of journey length (% distribution);

- Classes of daily journey frequency (% distribution, cluster criterion);

- Purpose of the journey (% distribution);

- Mode of transport utilised (% distribution, sustainable mobility rate);

- Time slots (% distribution);

- Systematic nature of the journeys (% distribution);

- Urban, extra-urban medium- or long-haul and total mobility (average distance, average time, % distribution of the journeys); also in combination: with socio-demographic segmentation (gender, age and occupational status); with territorial segmentation (geographical breakdown, demographic size of municipality); with purpose, time slot, systematic nature; with means of transport. (% distribution of the

MOBILITY DATA SOURCES IN ITALY 35

journeys);

- Gender (Mobility rate %);

- Age groups (Mobility rate %);

- Occupational status (Mobility rate %);

- Geographical breakdown (Mobility rate %);

- Population size of the municipality of residence (Mobility rate %);

- Type of municipality (SNAI classification);

- Smart working in combination: with mobility behaviour (static/proximity/mobile); with purpose, time slot, systematic nature; with means of transport; (% distribution);

- Smart working (average number, length, and duration of the journeys).

As of 2019 (with a post-harmonisation of the 2019 and 2020 data and with the harmonised methodology as of 2021), all indicators foreseen in the Guidelines regarding local mobility have also been provided to Eurostat. For this set of indicators (see Chapter 3 “Guidelines and reference standards for mobility data collection ”) the territorial level is also that of the Country as a whole, with domain detail for local urban and total mobility. The time reference is annual.

b. TUS – Time Use Survey - Multipurpose (Istat).

From SiQual (Survey quality information system – Istat):

“The Time Use Survey is part of the “Multipurpose” household survey system. The main distinctive feature of this survey lies in the fact that, through the compilation of a log, it is possible to know how a 24 hour time period (divided into 10-minute intervals) is broken down by each respondent into miscellaneous daily activities, journeys, places visited, and accompanying people. This survey is considered strategic for obtaining knowledge of how the population organises their home lives from a gender perspective, as it allows for the study of the division of roles in society and families. For this reason, the survey is regu-

lated by Article 16 of Law no. 53 of 2000, “Official statistics on home life: ISTAT ensures a five-year information flow on the organisation of the population’s home lives through the Time Use Survey, breaking down the information by gender and age.”

The survey is conducted every five years. The basic register is the LAC/ANPR.

The PAPI technique is utilised (in part with a reading device, in part self-compiled). Experimental projects are active at the international level for the development of alternative data collection methods, namely involving the use of personal devices (Smartphone Apps, etc.). The field of observation covers the activities performed every day of the week (weekdays and holidays) for an entire calendar year (365 days of activity are observed, the sample is spread out over the entire year).

The questionnaire includes an initial section (A) of individual forms for each of the household members. Among other items, information is requested on the distance from school or work and the time taken to get there, on whether the person regularly participates in certain types of activities in their free time (volunteer work, sports, etc.); among the questions on biographical data, ample detail is requested on nationality and citizenship, even with regard to parents. There is also a general form for the family as a whole, which requests information on the availability of vehicles and their number by type.

Section B of the questionnaire is a daily log, where the respondent must describe (by filling out the fields on the form) all the activities performed (at 10-minute intervals) on a fixed day, from 4 a.m. onwards, for the entire 24 hour period. The information requested includes the means of transport used to travel (including changes of vehicles) and the purpose for the journeys; the possible presence of other persons is also requested for all activities (thus also for travel, which is considered a separate activity). Finally, any non-regular

36 METHODOLOGICAL ASPECTS FOR PASSENGER MOBILITY ANALYSIS USING BIG DATA

journeys to other locations (domestic or foreign) during the observation period are also requested, as well as an indication of the distance travelled. The log must be completed for all family members, regardless of their age. There is also a section C on working time, which is not of interest with regard to the phenomenon of mobility.

The survey also records the occupational status, and whether it was completed on an ‘ordinary’ day, a holiday, illness, etc. (information useful for identifying recurrent mobility) and the condition determining the possible presence of a disability.

With regard to purposes, the processing of travel data is of particular interest for the topic of mobility. The logical scheme adopted in TUS coincides with that laid out in the Eurostat Guidelines, even with regard to the coding of the return journeys home.

The TUS survey can be seen as a useful comparison tool for mobility indicators on broad domains (e.g. mobility by purpose, by mode of transport, by age/gender). For the purpose of representing the mobility phenomenon, however, two factors are not relevant: the territorial reference of the journeys, and the distances travelled. It is therefore not possible to produce any specific information of a territorial nature (geographical or contextual) regarding the places where movements take place, except with regard to the territory of residence of the person making the journey.

Among the indicators published on an annual basis (the latest available are from 2013, with a new edition planned for 2023), those relating to activities classified as “Purpose-Driven Travel”, further broken down based on the reason for the travel, are of particular interest. The reference domains are as follows:

- The day of observation (average weekday/workday/Saturday/Sunday);

- Gender;

- Age class;

- Education level;

- Family size;

- Citizenship (Italian/foreign), only for the aggregated “Purpose-driven travel” mode;

- Working condition, only for the aggregated “Purpose-driven travel” mode;

- Marital status, only for the aggregated “Purpose-driven travel” mode;

- Position within the family, only for the aggregated “Purpose-driven travel” mode;

- Region, only for the aggregated “Purpose-driven travel” mode;

- Demographic size of the municipality, only for the aggregated “Purpose-driven travel” mode;

- Time slots, only for the aggregated “Purpose-driven travel” mode;

- Couple type, only for the aggregated “Purpose-driven travel” mode;

- Means of travel (in the TUS, this is considered a mode of the “places” variable, and is broken down into: walking/bicycle/ motorcycle, moped, scooter/private car/ other private vehicle other than car, and motorcycle/public transport), combined with gender, age, employment status, marital status, position in the household, region, and type of municipality.

The available indicators refer to the “time” variable, i.e.: generic and specific average duration (in hh:mm), time spent on the travel activity as a percentage of 24 hours, percentage incidence of people who performed the travel activity.

c. Permanent Population and Housing Census (Istat)

From the General Census Plan:

“The strategy of the Permanent Census is based on the combination of administrative data and data from sample statistical surveys, with the aim of producing information every year, and limiting the costs and the statistical burden on households. The methodological framework for the Permanent Census has the

MOBILITY DATA SOURCES IN ITALY 37

primary goal of maintaining the high level of classification detail traditionally guaranteed by the Census conducted very ten years for a set of fundamental variables (demographic, social and economic), while at the same time increasing the temporal frequency of the information produced and the timeliness of its dissemination. The transition to a new Census model is made possible by the acquisition, processing, and statistical use of administrative sources which, through data validation processes, generate statistical registers that are updated at a high temporal frequency. The Permanent Census makes use of both the information produced by the statistical Registers that make up the Integrated Register System (IRS), as well as that collected through periodic surveys [...]. In particular, it will make use of two specific sample surveys: one Spatial (S) and one List-based (L). At the level of each municipality, the Permanent Census’ field of observation consists of the usual resident population [...]. The usual resident population includes persons of foreign citizenship legally residing in Italy. [...] Through the sample surveys carried out by Istat and integration with the SIR, the Permanent Census acquires information relating to the household structure, marital status, and demographic, socio/ economic, and territorial mobility characteristics of the usual residents.”

The List-based Survey, which is repeated annually, is aimed at acquiring any information of interest that cannot be deduced from the administrative records used to produce the Basic Register of Individuals (BRI). The L sample consists of 500,000 households. The reference register is the BRI. The survey technique involves an initial contact to engage with the sample unit, by means of a notice sent by mail. The subsequent data collection is based on two channels: CAWI on a dedicated Istat portal (with support from municipal survey centres) and in-bound CATI with a dedicated toll-free number. Non-re -

sponding units are contacted at a later stage with out-bound CATI and CAPI, in order to recuperate the missing responses.

Among others things, the thematic content includes detailed questions on nationality, professional status, and car ownership within the family.

The questionnaire includes a section concerning systematic travel for school and work, in which information is also requested regarding the spatial domain of the travel (with details at the municipal or generic foreign level), namely whether the journeys take place within the same municipality or elsewhere, and whether the reference for departure and return is the home within the municipality of usual residence or another accommodation (and its location at the municipal level); information is also requested regarding the travel times, and the means of transport utilised (up to three indications), in order of importance with respect to the distance travelled by mode. The classification of the transport modes is different from that proposed in the Eurostat Guidelines (and some items are missing, e.g. aeroplane), and the ‘walking’ mode is only considered as exclusive, not being included in the list.

The data on mobility for school and work purposes acquired with the Permanent Census are used to construct commuting matrices, with the O/D pairings broken down at the municipal level (currently available with update to 2011).

Within the commuting matrix, the variable Number of individuals is estimated based on the domains given by the intersection of the following variables:

- Record type S: Province of residence, Municipality of residence, Gender, Purpose of travel, Place of study or work, Usual province of study or work, Usual municipality of study or work, Foreign country of study or work.

- Record type L: Province of residence, Municipality of residence, Gender, Purpose of travel, Place of study or work, Usual

38 METHODOLOGICAL
MOBILITY ANALYSIS USING BIG DATA
ASPECTS FOR PASSENGER

province of study or work, Usual municipality of study or work, Foreign country of study or work, Means of transport, Time of departure, Duration.

The indicators regarding mobility, which are published annually, refer to the following domains:

- Gender;

- Purpose (school/work);

- Commuting area (same municipality as usual residence/outside municipality of usual residence);

- Territory (all municipalities/provinces/ regions).

These indicators represent the size of the resident population that travels on a daily basis. The advantage of using this source mainly lies in the fact that it is a survey with a solid set-up and a very large sample, and it can certainly be considered a benchmark for comparing mobility indicators. For the purposes of knowledge requirements, the most significant gap concerns travel for reasons other than school or work.

d. ADL - Multipurpose Survey of Aspects of Daily Life (Istat).

Excerpt from the Methodological Note: “The ‘Aspects of Daily Life’ survey is part of the integrated system of Multipurpose Household Surveys launched in 1993, the aim of which is to produce information on individuals and households. When supplemented with information from administrative and business sources, the statistical information collected helps determine the information base for Italy’s social framework. Several subject areas are investigated through the survey, which are explored from an individual and family perspective. The information content can be grouped into four major areas: family, home and living area; health conditions and lifestyles; culture, social life and leisure activities; and interaction between citizens and services.” The survey is sample-based, the reference

register is the LAC/ANPR. The reference population includes all individuals (through the household sample unit), with no age restrictions.

The survey is conducted annually between the first and second quarter of the reference year. The technique is mixed (CAWI/CAPI-PAPI), with compilation with an interviewer being limited to non-respondents, who are contacted at a later data collection stage, and households without internet access. The CAWI is accessed through the dedicated Istat Portal, with personal login credentials. The survey model consists of a general form, with which all the socio-demographic information on the household and its members is collected, and specific sections (Family Questionnaire and Individual Questionnaire) by topic.

Among the aspects of daily life of households, the information regarding usual travel for school and work is recorded in a special section. The questions proposed in this section regarding travel are in part similar to those proposed in the Permanent Census model.

In particular, the classification of transport modes coincides, but the ADL survey offers the possibility of indicating more than three means of transport and, subsequently, the prevailing one in terms of distance travelled. It also includes a series of questions on the level of use and satisfaction with public transport, car and bike sharing services, and private vehicles.

The indicators produced refer to individuals who have travelled, and are of two types:

- Number of individuals;

- Percentage of the total number of persons with the same characteristics.

The output domains are given by the intersection of the following variables:

- Purpose (School/work);

- Gender;

- Age class;

- Mode of transport;

- Duration;

- Geographical breakdown;

MOBILITY DATA SOURCES IN ITALY 39

- Region;

- Type of municipality (population size);

- Centre/periphery of metropolitan area.

e. Household expenditures – focus on Travel and holidays (Istat)

The information framework on the available sources would not be complete without an examination of the phenomenon of mobility over medium to long distances, the nature of which differs from that of local mobility in terms of both the indicators of interest and the appropriate survey techniques for observing and representing it. Surveys conducted in this area are generally retrospective.

With regard to this area of mobility, which generally concerns travel for work or personal reasons, the ‘Travel and Holidays’ focus within the survey household expenditures was identified as a current statistical source.

The survey collects data regarding ‘domestic’ and ‘outbound’ components of national tourism, or rather journeys made by Italian residents, both domestically and abroad.

The scope of observation includes journeys with short or long stays (more than three nights) and excursions (day trips with stays of at least three hours, without an overnight stay), made for personal and business reasons. Excursions to foreign countries are surveyed annually, while domestic ones are surveyed every three years. Information regarding overnight journeys is collected annually or every three years, depending on the variables. A complete overview of the phenomenon is thus obtained every three years.

For the purposes of this paper, this survey is not essential, as the information collected largely relates to the descriptive aspects of the stay or other factors linked to the tourism phenomenon and the relative expenditures; it only marginally concerns the aspect of travel in the sense of the transport to and from the destination, which is relevant to the study of mobility.

For each journey, the travel and excursion section of the questionnaire collects information on the destination (municipality or foreign country) and the relative purpose (work/ holidays/other reasons). Any habitual travel is also requested to be indicated. With regard to the variables necessary for the calculation of the indicators laid out in the Eurostat Guidelines, they are not included in the focus:

- The distance travelled to the destination (initial destination of the journey) and/or from the last location to return home;

- The duration of the travel to/from the main destination;

- The means of transport used for the initial travel (and/or the return). The focus requests that the predominant means of transport utilised be specified, but with reference to the travel event, which may not be the same as that used for the transport event (e.g. initial transport by plane, predominant use of hire cars during the journey);

- Presence of any other occupants in the private vehicle during the journey to/from the main destination.

The survey in question entails a high statistical burden on the respondent, also considering the fact that it refers to different entities of analysis (household expenditure – individual travel), and expanding it to also collect information on mobility would require the inclusion of a third entity, namely the transport event. Within the context of the road map for Trusted smart statistics at Istat, an experimental study was carried out regarding the use of telephone data for the estimation of the indicators for the “Travel and Holidays” survey.

f. Other sources from local entities. At the disaggregated territorial level (Regions, Metropolitan areas, and Municipalities), there have been numerous instances of research and production of mobility indicators, carried out either periodically or at irregular intervals. One prototype of these instances was the

40 METHODOLOGICAL
FOR PASSENGER MOBILITY ANALYSIS USING BIG DATA
ASPECTS

smart survey carried out within the context of the HARMONY project funded with H2020 European funds, for which an application within the Urban Functional Area of Turin was used as a case study.

The survey is based on a quota sample of 584 individuals, stratified based on a zoning of the Turin UFA into eight areas (55% in four areas of the municipality, 33% in three areas of the metropolitan area, 12% in the other UFA municipalities), and then according to the following variables:

- Gender (equal parts M-F)

- Age (40% class 18-34, 60% class 35-64)

- Employment status (60% employed, 10% retired, 30% students)

- Number of cars owned within the household (25% no car, 50% one car, 25% two or more cars)

The sample was split over two observation periods, the first and second half of February 2022.

An App developed in Europe and tested in

other case studies was used for data collection (MobyApp).

The survey was organised in three stages:

i. Collection of preliminary and contextual variables on the individual and his or her mobility habits;

ii. Collection of individual travel information, qualified with the following variables: origin, destination, duration, mode of transport, purpose, through the MobyApp. This stage involves validation and integration of the data acquired independently by the App by the respondent;

iii. Questionnaire focusing on individual choices, based on the information gathered during the initial phase.

The respondent is asked to verify and validate the travel data for at least four days during the observation period.

The acquisition and retention of the individual data is carried out in anonymised form (ID assigned to each individual so as to keep their identity separate from the data collected).

MOBILITY DATA SOURCES IN ITALY 41

Overall, the experience was positive, especially in terms of the respondents’ liking of the technique utilised (App acquisition), and could serve as a starting point for further applications.

One information pool that should be monitored is that which could be generated starting with the Mobility Managers’ activities. The Ministries of Ecological Transition and Infrastructure and Transport have regulated the activities of Company, Scholastic, and Area Mobility Managers, whose main task is to establish Home-to-Work Travel Plans (HTWTs), with Interministerial Decree no. 179 of 12/5/2021 concerning the “Implementation of the provisions relating to the figure of the mobility manager,” as amended. Article 6 c.3c of the decree specifies that the activities of the Area MM include:

“the acquisition of data on the origin/destination and entry/exit times of employees and students provided by company and school mobility managers and the transfer of this

data to the municipal and regional public transport service planning bodies.”

The Decree also lays out the Guidelines for the drafting and implementation of HTWTs, which indicate the minimum information on home-study/work travel that the MM must collect in order to establish the plan, such as:

- Usual mode of travel;

- Use of only one means/mode of transport, to be specified;

- Combination of several means/modes of transport, to be specified;

- Distance travelled;

- Duration;

- Availability of means of transport, to be specified;

- Availability of transport service passes, to be specified.

The information underlying the establishment of the HTWTs could be used to represent habitual mobility at the urban and inter-municipal levels.

4.1.2 | MOBILITY SUPPLY AND DEMAND SOURCES

Another area of research and production, which expands on the framework of perspectives from which the mobility phenomenon is observed, is the representation of the supply of mobility infrastructure and services, and the demand for these services by users.

Among existing works, the following are of particular interest:

a. Survey of Environmental Data in Cities

- Urban mobility indicators (Istat)

The survey is conducted annually and collects environmental information on the 109 provincial/metropolitan municipalities, with the Municipality of Cesena being included since 2020 on a voluntary basis. The data and statistical information are aimed at providing an information framework to support the monitoring of the state of the urban environment, and the measures taken by local government

bodies to ensure good environmental quality in the cities. The survey consists of seven questionnaires - Air, Eco-management, Energy, Mobility, Waste, Noise and Urban Greenery. The Mobility section gathers information on the supply and demand of local public transport, sustainable mobility, and infomobility. The reference for the collection of the data, which are conveyed to Istat by the network of Provincial Capitals, is the UTP/SUMP. There is a section dedicated to shared mobility.

The territorial detail of the indicators produced is that of the Provincial Capitals.

For supply, the indicators are the following:

I. Density

II. Network length

III. Number of stops

Distinguished by:

- tram and metro networks;

42 METHODOLOGICAL ASPECTS FOR PASSENGER MOBILITY ANALYSIS USING BIG DATA

- reserved lanes for LPT;

- bus and trolleybus stops;

- tram stops and metro stations;

- funicular railway, cable car and water transport stops or stations.

IV. Availability

V. Utilisation (number)

VI. Seats-km offered

Distinguished by:

- Buses and trolleybuses;

- Electric and natural gas or LPG powered buses;

- Tram cars and metro convoys;

- Funicular cars, cable car cabins, and water transport boats.

VII. Commercial speed of local public transport services

VIII. Active taxi licences

For demand, the indicators are the following:

I. Annual passengers per inhabitant

II. Annual local public transport passengers (absolute values)

For shared mobility and sustainable mobility, the published indicators are the following:

I. Presence of car sharing services

II. Availability of car sharing services vehicles

III. Vehicles used for car sharing services

Distinguished by:

- Car sharing;

- Bike sharing;

- Scooter sharing.

IV. Low-emission vehicles used for car sharing services (absolute values and per 100 vehicles)

V. Density and length of cycle paths

VI. Pedestrian areas

VII. Presence and variation of LTZs and 30 Zones

VIII. Presence of park-and-rides

IX. Number of parking spaces in the parkand-rides.

b. National Shared Mobility Observatory

The Observatory is a network made up of numerous public and private players involved in the development, dissemination, and supply of shared mobility services in Italy. It includes operators of shared mobility services, local authorities, research institutes, and associations. It is promoted by the Ministry of Ecological Transition, the Ministry of Infrastructure and Transport, and the Foundation for Sustainable Development.

It has produced the detailed Shared Mobility Report on the supply and demand of vehicle sharing and ride sharing (company carpooling) services on an annual basis since 2016.

The report offers a representation of the phenomenon at an aggregate level for the Italian territory, with focus on Rome and Milan. It also includes in-depth sections on the mobility behaviour and styles of the users of the services in question (clusters by mix of the means of transport utilised, both owned and shared).

The published indicators for the supply component, with an annual time reference, are the following:

I. Number of vehicles in the fleet

II. Ecological quality of the fleet (vehicle type and fuel type where present)

III. Presence and absence of services in the provincial capitals

The indicators for the demand component are the following:

I. Number of service registrations

II. Number of active services

III. Number of hires performed (by provincial Capital)

IV. Distances (km) (by provincial Capital)

V. Monthly and daily hires (Rome and Milan only)

The types of services are distinguished by:

- Free floating car sharing;

- Station based car sharing;

- Free floating bike sharing;

MOBILITY DATA SOURCES IN ITALY 43

- Station based bike sharing;

- Scooter sharing;

- Push scooter sharing;

- Ride sharing.

For some indicators, the Bike, Scooter and Push Scooter modes are further classified into a single group called Micromobility, as opposed to Car-Sharing.

Within the context of the Observatory’s activities, a pilot survey on urban mobility (Progetto Pollicino – “The Thumbelina Project”) was conducted in the Municipality of Bologna. The purpose of this survey was to collect information on all the travel carried out by the individuals falling within the sample, either using their own means or using shared mobility services.

From the Observatory’s website: “The project’s first field of application was in the city of Bologna, where 2,400 citizens downloaded the IoPollicino app to their phones and consented to the geolocation of their smartphones. A total of about one thousand were involved in the survey, and entered certain essential information, such as the means of transport they utilised and the reasons for their travel, for at least seven days. Of these, six hundred “Thumbelinas”, broken down by age and gender, formed a representative sample of mobility in the city and an outstanding database for analysing people’s mobility behaviour, habits, and styles. The data was collected voluntarily, completely anonymously, and without any form of profiling or scoring (i.e. methods that attribute

a positive or negative score to certain citizen behaviours). In fact, the aim of the analysis was to advance the research on urban mobility behaviour with respect to the traditional sample surveys carried out with telephone or web-based interviews, which, as a general rule, only collect data referring to a single working day of the week, thus not allowing for an analysis of individuals’ mobility on each day of the week, from the time they leave the home until they return.”

It is a smart survey, in which the data is collected via a mobile device App (IoPollicino), and is suitably processed to be rendered anonymous. The app collects the devices’ locations at regular intervals via GPS (so-called bread crumbs). The users must complete the picture of the mobility activities carried out by providing information on other aspects, such as the purpose of the individual journeys. They can also correct the information acquired via GPS if they find any inaccuracies in the reconstruction of their movements (regarding the structure of the movements, the vehicle utilised, etc.). The App-based collection technique makes it possible to record all the journeys made, including those of less than one kilometre, which are relevant in urban areas and are generally excluded from traditional surveys.

Like that illustrated in section 4.1.1, letter f, within the context of the HARMONY project, this initiative could also serve as a prototype experience for a larger-scale smart survey.

44 METHODOLOGICAL
ANALYSIS USING BIG DATA
ASPECTS FOR PASSENGER MOBILITY

4.1.3 | DATA FLOWS BY MODE OF TRANSPORT

Another group includes the consolidated official surveys subject to European regulation that organise transport-related information from a “silo” perspective, or rather distinguishing between the acquisition of data and the production of indicators based on mode of transport.

Limiting the scope of reference to passenger mobility (therefore excluding elements related to the transport of goods), the most relevant methodological aspects can be summarised as follows:

a. Maritime transport (Istat)

The maritime transport survey provides statistics on the transport of goods and passengers for commercial purposes. It consists of a census-type survey of arrivals and departures from Italian ports. The passenger data are displayed for ports that handled at least 200,000 passengers.

The sets of indicators produced by Istat and Eurostat are as follows:

- Annual number of passengers carried (excluding cruise passengers), by flow type (international, domestic, total) and direction (inbound, outbound, total);

- Annual number of passengers Embarked/Disembarked, for the top 20 European ports;

- Annual number of passengers Arriving (disembarked) and Departing (embarked) from all Italian ports, by direction (arrival/departure);

- Embarked/disembarked/Total for NUTS2;

- Quarterly number of passengers transported by all main ports (excluding cruise passengers), by flow type (national, international) and direction (arriving, departing, total);

- Quarterly number of passengers transported by port (Italian), flag, direction (inbound, outbound, total).

The survey does not provide for the preparation of an O/D matrix.

Eurostat estimates several indicators for passenger-km (Pkm), published in the Database table titled “Annual maritime passenger transport in the Exclusive Economic Zones (EEZs) of European countries (domestic, international intra-EU27, international extra-EU27, transit, total) per country.”

Within the context of the road map for Trusted Smart Statistics within Istat, an experimental study is underway for the use of AIS data to increase the data quality of the maritime transport survey.

b. Air transport (Istat)

The new statistical survey on air transport is comprehensive, and collects information on the transport of passengers, freight and mail, including flight stages, available seats, and aircraft movements. The survey units are the airports, and the data are provided by the airport management companies. The quarterly data refer to airports that submit the data on a monthly basis.

The indicators produced by Istat and Eurostat (using Istat and Enac data) are as follows:

- Total passengers (monthly, quarterly, yearly);

- Passengers carried, by route (monthly, quarterly);

- NUTS2 passengers (annual);

- Total passenger-kms (annual);

- National + EU passenger-kms (annual);

- Non-EU passenger-kms (annual);

- Flyover passenger-kms (annual).

The O/D matrix of passengers by country pairs (passengers on board and passengers carried) is available.

c. Rail transport (Istat)

The purpose of the rail transport survey is to collect statistical information on the transport

MOBILITY DATA SOURCES IN ITALY 45

service provided by railway undertakings operating in Italy, in compliance with the provisions of the Regulation of the European Parliament and of the Council no. 643/2018 (which recast all previous legal acts relating to rail transport statistics). The survey is of a census type, and the survey unit is the active railway undertaking, or rather any public or private sector undertaking providing freight and/or passenger transport services by rail. This survey collects data, in varying degrees of detail, on freight and passenger transport, as well as on accidents occurring on the national and local rail network, and on the technical characteristics of the national network infrastructure.

The sets of indicators published by Istat and Eurostat are as follows:

- Total passengers carried, annually and quarterly;

- Annual number of passengers transported by flow type and direction (domestic, international inbound and outbound);

- Annual international passenger transport from border to country of disembarkation;

- Annual international passenger transport from country of embarkation to border;

- Annual number of passengers carried by train speed (up until 2011);

- Average annual distance in km per passenger (domestic/international);

- Total passenger-kms, annual and quarterly;

- Annual passenger-kms by flow type and direction (domestic/international inbound and outbound).

The O/D matrix of passengers transported is also available, with NUTS2 territorial detail, issued every five years.

d. Road passenger transport (Eurostat)

Eurostat regularly publishes a table showing annual country-level estimates for the following indicators:

- Passengers and Passenger-km transported by buses and coaches registered in Italy, broken down into national/national urban/national intercity transport.

Data for international transport is not available for Italy.

46
USING BIG DATA
METHODOLOGICAL ASPECTS FOR PASSENGER MOBILITY ANALYSIS

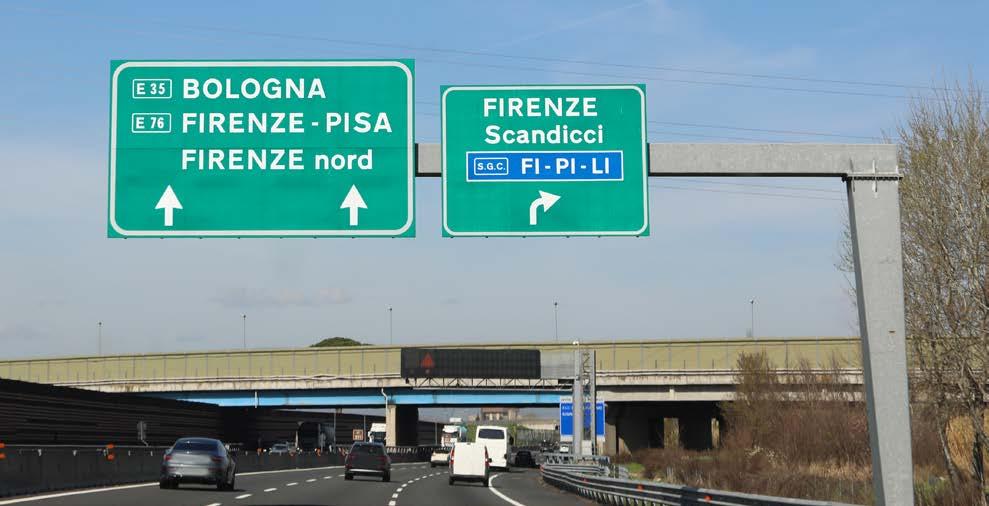
4.1.4 | VEHICLE TRAFFIC

The projects for estimating vehicle traffic have grown significantly in recent years, both at the international level, where Eurostat/ITF/UNECE have prepared a detailed table for the acquisition of vehicle-km indicators for various

M1: Passenger cars - Total.

▪ Petrol

▪ Diesel

▪ Pure electric

▪ Petrol-Hybrid

▪ Diesel-Hybrid

▪ Other fuel - Total

of which :

- Bi-fuel petrol/LPG

- Bi-fuel petrol/CNG

- LPG

- CNG

- Flex fuel

- Other

M2: Mini buses - Total.

▪ Petrol

▪ Diesel

▪ Pure electric

▪ Other fuel

M3: Buses and coaches - Total.

▪ Diesel

▪ Diesel-Hybrid

▪ Pure electric

▪ CNG

▪ Other fuel

N1: Goods vehicles uo to 3.5t - Total.

▪ Petrol

▪ Diesel

▪ Other fuel - Total

of which :

- Bi-fuel Petrol/LPG

- Bi-fuel Petrol/CNG

- Pure electric

N2: Goods vehicles between 3.5t and 12t - Total.

▪ Diesel

▪ Other fuel

N3: Goods vehicles over 12t - Total.

▪ Diesel

▪ Other fuel

L1/L2/L6: Mopeds and light 3- and 4-wheelers - Total.

▪ Petrol

▪ Pure electric

▪ Other fuel

L3/L4/L5/L7: Motorcycles (with or without sidecar), tricycles and quads - Total.

▪ Petrol

▪ Pure electric

▪ Other fuel

T5: Tractor on wheels - Total.

▪ Diesel

▪ Other fuel

road vehicle categories (Odometer reading questionnaire, figure 2) and at the national level, with the study of recent and consolidated data collections.

MOBILITY DATA SOURCES IN ITALY 47
0-2 2-4 4-6 6-88-10 10-15 15-20 Over 20Total Age of the vehicle Vehicle categories by fuel type
Figure 2– Table prepared by Eurostat/ITF/UNECE, Odometer reading questionnaire

The most relevant sources are listed below.

a. AISCAT data on motorway vehicle traffic.

The monthly indicators are the vehicle-km broken down by:

- Motorway companies (both associated and outside the AISCAT);

- Vehicle type (light “motorbikes and two-axle motor vehicles with a ground clearance, at the front axle, of less than 1.30 m”, heavy “two-axle motor vehicles with a ground clearance, at the front axle, of more than 1.30 m, and all motor vehicles with three or more axles.”).

The quarterly indicators are the vehicle-km broken down by:

- Motorway or tunnel;

- Vehicle type (light/heavy).

The data are estimated based on motorway entries and the length of the road.

b. ANAS data on vehicle traffic on the extra-urban roads under its jurisdiction.

From the ANAS website:

“The automatic statistical traffic detection system, consisting of approximately 1,200 counting sections, is distributed throughout the entire Anas network: all the sensors transmit their data to a centralised monitoring system, called PANAMA (Anas Platform for Monitoring and Analysis), which verifies and processes the trends of the Detected Mobility Index. The reliability of the acquired data is ensured by a series of control processes; in particular, two automatic control steps guarantee the consistency and coherence of the

database. The first process aims to highlight any problems within the file transmitted by the local survey station. Any consistency errors encountered as a result of these checks, which cannot be corrected, render the file unusable, and it is therefore rejected by the system.

Once the data are loaded into the database, the PANAMA platform performs the second step, which consists of various procedures for assessing the reliability of the aggregated data, not by eliminating the data entered, but by classifying them using a parameter that verifies their consistency with respect to certain real situations that can actually occur. This parameter makes it possible to exclude uncertain data from the values used to calculate the desired measurements. The veracity of the acquired data, or rather the sensors’ ability to detect the actual traffic passing through that section, is also assessed by Anas personnel by carrying out spot checks. The Anas personnel use a technology that allows for the acquisition of videos of the vehicles actually passing through the section, with the simultaneous superimposition of the string of data recorded by the local control unit. The film is then viewed in the office, at which time all the counting and classification errors are detected, and the quality of the returned data is automatically assessed with respect to the reality of the situation on the road.

“[For the sensor network] There are basically two technologies utilised: inductive loops and microwave sensors, although the system currently also receives traffic data from the Vergilius system for electronic average speed

48
BIG DATA
METHODOLOGICAL ASPECTS FOR PASSENGER MOBILITY ANALYSIS USING

monitoring. Additional technologies have also been implemented, such as dynamic weighbridges, cameras for detecting hazardous goods, and bluetooth trackers for time tracking.”

The data are collected by ‘counting sections,’ which, in turn, are classified by territory (Italy, North, Central, South, Sicily, and Sardinia), and by vehicle types, divided into:

- light vehicles, which include motorbikes, cars with and without trailers, and vans or trucks (with profiles corresponding to types with a load capacity of less than 3.5 t), also with and without trailers;

- heavy vehicles, including all other vehicles, or rather “large” lorries (with profiles corresponding to types with a load capacity of more than 3.5 t), road trains, articulated lorries, and coaches.

The indicators produced on a monthly basis are the “Detected Mobility Indices” (DMI), which correspond to the estimated average number of vehicles detected by the sensors for each domain, defined by:

- vehicle type (total/heavy);

- territorial area (Italy, North, Central, South, Sicily, and Sardinia);

- day of the week (total/workday/pre-holiday/holiday);

- time slot (day 6am-10pm/night 10pm6am).

The “Annual Average Daily Traffic” (AADT) is also published, calculated as the average of the passes in each direction at each station, for all “valid days”, or rather the days of the year when passes are detected without

malfunctions, and if at least 98% of the passes detected in the 288 five-minute intervals into which the day is divided are loaded. This indicator is published for the following domains:

- Location (road, km);

- Municipality;

- Province;

- Vehicle type (light/heavy).

Finally, ANAS produces quarterly and annual reports, available upon request, on the traffic detected by the individual stations. This information is collected in an accurate fashion, according to a scheme that summarises vehicle passages with two indicators (average volumes and average speeds) based on the following aspects’ domains of intersection:

- Flow direction (ascending/descending);

- Vehicle type (light/heavy);

- Time slot (6am-8pm/8pm-10pm/10pm6am).

Finally, data elaborations regarding specific territorial and temporal scopes can be obtained by submitting a request to ANAS.

c. Istat project “Quantification and description of vehicle traffic”

The aim of the project is to estimate the traffic, in terms of vehicle-km, carried out by vehicles of all categories registered in Italy, starting with the data contained in the Overhaul Archive and the vehicle fleet, provided by the Ministry of Transport and the Automobile Club d’Italia (ACI). The estimates will be carried out on an annual basis. They are currently not yet available, as the project remains in the development phase with regard to a number of essential methodological aspects.

MOBILITY DATA SOURCES IN ITALY 49

4.2 |

COMPLEMENTARY SOURCES TO COMPLETE THE KNOWLEDGE FRAMEWORK

4.2.1 |

COMPLEMENTARY SOURCES FOR THE ESTABLISHMENT AND DEVELOPMENT OF TRANSPORT MODELS

Within the context of the production of national statistics, in addition to the sources discussed in the previous section, it has also been deemed appropriate to highlight a number of additional findings and elaborations, which provide a valid support for the establishment of the transport models. Although they will not be examined in detail here, a non-exhaustive list may be useful to complete the overall picture.

a. Vehicle fleet. Holder ACI (PSN ACI00002). Objective: to provide a detailed picture in Italy, by analysing the data of the vehicles registered with the Public Vehicle Register.

b. The car market: first registrations, cancellations, and vehicle transfers. Holder ACI (PSN ACI-00014). Objective: To complete the car market analysis by describing the main characteristics of the used car market, first registrations, and cancellations.

c. Registrations and transfers of ownership. Holder MIT (PSN MIT-00010). Objective: To consolidate and improve the production of statistical information in support of the knowledge and decisions of policy makers, economic operators, and citizens.

d. Valid driver’s licences and new drivers. Holder MIT (PSN MIT-00011). Objective: To consolidate and improve the production of statistical information in support of the knowledge and decisions of policy makers, economic operators, and citizens.

e. Local public transport. Holder MIT (PSN MIT-00018). Objective: dissemination of statistics on local public transport.

f. Inland waterway transport. Holder MIT (PSN MIT-00021). Objective: dissemination of statistics on inland waterway transport.

g. Maritime connections with the islands. Holder MIT (PSN MIT-00024). Objective: dissemination of statistics on maritime connections with the islands.

h. Household expenditure survey. Holder ISTAT (PSN IST-02396). Objective: The household expenditure survey records the expenditures incurred by households residing in Italy to purchase goods and services for family consumption, and is the source of information for the description, analysis, and interpretation of spending behaviour. The transport expenditures section is broken down (with additional subclasses) into: expenditures for the purchase of transport equipment, for the purchase of transport services, for the operation of transport equipment.

50 METHODOLOGICAL ASPECTS FOR PASSENGER MOBILITY ANALYSIS USING BIG DATA

4.2.2 | COMPLEMENTARY SOURCES FOR MONITORING AND EVALUATING POLICIES AND OBJECTIVES

As outlined thus far, mobility is a strategic aspect of the socio-economic fabric of every country, as it constitutes both the cause and the effect of the smooth and resilient functioning of the gears connecting the systems in which businesses, households, and institutions operate.

The measurement of the phenomenon, from different perspectives and with types of indicators, can therefore be found in numerous statistical collections, which use information from existing official sources.

For these purposes, it is worth mentioning a few of particular importance, in order to complete the framework of the information needs and potential that could be assisted with the use of Big Data.

a. The Sustainable Development Goals (SDGs).

From the Istat website:

“On 25 September 2015, the United Nations General Assembly adopted the 2030 Agenda for Sustainable Development, in which it outlines the guidelines for activities over the next 15 years. The 17 Sustainable Development Goals that make up the 2030 Agenda constitute the global action plan to eradicate poverty, to protect the planet, and to ensure prosperity for all.

The Sustainable Development Goals refer to various domains of development relating to environmental, social, economic and institutional issues, laying out a global action plan for the next 15 years. The way forward at the international level is laid out by the Cape Town Global Action Plan: the strategy for taking all the actions necessary to modernise and strengthen the statistical systems at both the national and global levels.

In order to identify a shared statistical information framework, as a tool for monitoring and evaluating progress towards the achieve -

ment of the Agenda’s goals, the United Nations Statistical Commission established the Inter Agency Expert Group on SDG Indicators, which established a set of over 200 indicators.”

The indicators established by the Expert Group are supplemented with additional indicators for the national context (i.e. specific to each country adopting them). For the topic of Transport and mobility, the sections concerned are 3 “Health and well-being” (with regard to road accidents), 9 “Business, innovation, infrastructure,” 11 “Sustainable cities and communities,” and 13 “Combating climate change.”

Istat publishes its SDG Report annually, and an updated dashboard with data and graphs is also available, where the specific indicators can be consulted.

b. Report on equitable and sustainable well-being (BES)

From the Istat website: “The project to measure equitable and sustainable well-being aims to evaluate the progress of society not only from an economic, but also from a social and environmental point of view.

Istat, together with representatives of the third sector and civil society, has developed a multidimensional approach to measure “equitable and sustainable well-being” (Bes), in order to complement the indicators related to production and economic activity with measures of the key aspects of well-being, together with measures of inequality and sustainability. 12 basic domains were identified to measure well-being in Italy.

The detailed analysis of indicators published annually in the Bes Report as from 2013 aims at raising awareness of the Country’s strengths and difficulties. To improve the quality of life of citizens the concept of well-being should

MOBILITY DATA SOURCES IN ITALY 51

be considered as starting point for public policies and individual choices.

In 2016, “Equitable and sustainable well-being” has become part of the economic planning: the Economic and Financial Document (Def) has to include an analysis of recent trends for selected indicators and an impact assessment of proposed policies. Moreover, a monitoring report of the indicators and the outcomes of the assessments is presented to the Parliament every year in February.”

The indicators of interest for the topic of mobility are included in the domain “12 – Quality of services,” and are derived from ISTAT surveys.

Every year, Istat publishes a descriptive report on Italy’s situation with respect to the various thematic domains, and provides an updated dashboard complete with tables and graphs.

c. National Recovery and Resilience Plan (NRRP)

From the website of the Italian Government’s Presidency of the Council of Ministers: “The National Recovery and Resilience Plan (NRRP) Italy Tomorrow, approved by the European Commission on 22 April 2021, is part of the Next Generation EU (NGEU) programme

[…] The Plan is made up of six Missions and has three main objectives. The first is short term in nature and refers to repairing the economic and social damage caused by the pandemic crisis.

Secondly, from a more medium/long-term point of view, the Plan tackles a number of weaknesses that have been weighing down on Italy’s economy and society for decades: the long-standing divides between the country’s geographical areas, gender inequality, weak productivity growth and a low rate of investment in human and physical capital.

Lastly, the Plan’s resources will go towards

driving a comprehensive ecological transition.

[...] Established at the Presidency of the Council of Ministers, the Steering Committee is the political guidance body that coordinates and drives the implementation of the NRRP interventions.

[...] Each Steering Committee meeting provides an opportunity to take stock of the progress of the reforms and investments. They also ensure the timely identification of any obstacles and bottlenecks, so that prompt action can be taken and the scheduled commitments agreed upon with the Commission can be met, which are decisive for the allocation of funds.”

The missions that most directly affect the areas of transport infrastructure and mobility are M1 “Digitalisation, innovation, competitiveness, culture and tourism,” M2 “Green revolution and ecological transition,” and M3 “Infrastructure for sustainable mobility,” even with regard to the digital transformation (MaaS services, public transport service monitoring, etc.).

d. Collections of indicators at the international level.

Numerous data collections have been implemented over time for the monitoring and representation of mobility by international institutions with different institutional duties. One example is the Common Questionnaire UNECE/ITF/Eurostat, the completion of which requires a large collection of indicators on an annual basis, ranging from performance by mode of transport, to road accident statistics, and existing infrastructure.

The NSP envisages a specific work activity (IST-02653) to provide the indicators for these collections: “Processing of national and regional data on transport, environment, and tourism for international institutions (Ocde-itf, Eurostat, Unece, Unwto).”

52 METHODOLOGICAL ASPECTS FOR PASSENGER MOBILITY ANALYSIS USING BIG DATA

4.3 | REFERENCE SOURCES FOR INFRASTRUCTURE AND SERVICE REPRESENTATION

Statistical production and the development of transport models require precise geospatial references with as much detail as possible. As indicated in chapter 2 “Definitions ”:, these references can be of various types, and can differ in the case of data acquired by traditional methods and Big Data.

In order to create a representation of the potentially available infrastructures and services with which mobility is carried out, we have a number of sources at our disposal, of which those mainly utilised at present are indicated.

- The National Transport Survey provides general information on transport infrastructure broken down into different chapters by type, such as Chapter V “Road Transport”, which indicates the extent of the road network by type of road (Motorways, Regional and Provincial Roads, Other Roads of National Interest) at the national and regional levels (Appendix to Chapter V).

- Rail network (source: RFI - Rete Ferroviaria Italiana), map with details railway lines by type and stations;

- Road/motorway network (sources: ANAS, AISCAT), maps with details by road type, with indications of the motorway toll stations;

- Register of Italian ports (source: MITMinistry of Infrastructure and Transport), a detailed and georeferenced list of the 351 main Italian ports;

- Airports in Italy (source: ENAC – National Civil Aviation Authority), map detailing the traffic basins of the Italian airports;

- Data on the transport services offered. In order to complete the picture of the potential offered by the territory to meet the mobility demand, the added value of the sources that provide the spatio-temporal references of the services offered, or rather the timetables for rail, airport, port and long-distance road transport, and the General Transit Feed Specification (GTFS) for local public transport and rail, have been highlighted. Such sources, although strategic for model building, are not always accessible or available throughout the territory.

The aforementioned infrastructure data are available in graphical format (shapefiles for GIS) or accompanied by information that allow for georeferencing; some can be downloaded from institutional websites like the Ministry of Infrastructure and Transport’s Open Data site 5. In addition, in view of European Directive 2007/2/EC (INSPIRE), implemented by Legislative Decree of 27 January 2010 and aimed at establishing a European data infrastructure for the sharing of spatial data related to environmental policies among the various member states’ public sector organisations, transport network data should be made available and shared on the INSPIRE platform6. With regard to GTFS data, on the other hand, some are freely available, as in the case of the Region of Tuscany, which renders all of the GTFS data for its regional public services7, or any that may be provided by service operators, available upon request for study or research purposes.

5. https://dati.mit.gov.it/catalog/dataset

6. https://inspire.ec.europa.eu/

7. https://dati.toscana.it/it/dataset/rt-oraritb

MOBILITY DATA SOURCES IN ITALY 53

4.5 | SUMMARY OF THE MAIN STATISTICAL SURVEYS

Survey

Audimob Observatory

Time Use Survey-Multipurpose (TUS)

Author ISFORT ISTAT

Survey technique CAWI/CATI PAPI

Frequency Annual

Every five years

Uniform EUROSTAT Yes Yes

Geographical spatial reference

Municipality of origin-> Municipality of destination

However, two factors are not relevant for the purposes of representing the mobility phenomenon: the territorial reference of the journeys, and the distances travelled

Mode of travel

Combination of means utilised

Frequency Yes

Reason Yes

Socio-economic

Temporal extent

Original name (ITA)

Means of travel (in the TUS, this is considered a mode of the “places” variable, and is broken down into walking/bicycle/motorcycle, moped, scooter/ private car/other private vehicle other than car, and motorcycle/public transport), combined with gender, age, employment status, marital status, position in the household, region, and type of municipality.

Yes, for some indicators

Average weekday (public holiday)

Osservatorio Audimob Indagine sull’uso del tempo-Multiscopo (TUS)

Table 3 – Summary of the characteristics of the main statistical surveys on passenger mobility

54 METHODOLOGICAL ASPECTS FOR PASSENGER MOBILITY ANALYSIS USING BIG DATA
Sample size 16,000 individuals about 34,000 households spread over 650 municipalities in Italy.
Time reference Time slot and duration
available indicators refer to the “time” variable, i.e.: generic and specific average duration (in hh:mm), time spent on the travel activity as a percentage of 24 hours, percentage incidence of people who performed the travel activity.
The
Yes Yes
characterisation

Permanent Population and housing census

Multipurpose Aspects of Daily Life (ADL) Survey

Household expendituresFocus Travel and Holidays

ISTAT ISTAT ISTAT

CAWI/CATI/CAPI

CAWI/CAPI-PAPI CAPI

500,000 households about 25,000 households spread over about 800 Italian municipalities about 32,000 households residing in approximately 540 Italian municipalities. Annual

Transport mode classification other than Eurostat

-Travel occurs within the same municipality or elsewhere, the departure and return reference is the habitual place of residence.

-Municipality of Origin --> Municipality of Destination

Up to 3 vehicles in order of distance travelled per mode

Region, geographical breakdown

Annual and ongoing throughout every month of the year

The region and geographical breakdown of residence and the region and province, EU foreign country, or non-EU geographical macro-area of the journey’s main destination is recorded

Yes

Possibility of indicating more than 3 means, and then the main one utilised in relation to the distance travelled

Prevalent means of transport used within the context of the journey, which may not coincide with that used for the initial/return journey

Any habitual travel is also requested to be indicated

Work/school Work/school Work/ Holidays/ other reasons

Yes

Average weekday

Censimento permanente della Popolazione e delle abitazioni

Gender/age group

Yes

Indagine Multiscopo Aspetti della Vita Quotidiana (AVQ)

Spese delle famiglie -

MOBILITY DATA SOURCES IN ITALY 55
Annual
Time slot and duration Time spent The travel time to and from the main destination is not recorded

5 | ANALYSIS OF SEVERAL CASE STUDIES ON PASSENGER MOBILITY

Lorenzo Vannacci2[0000-0001-9587-7611] , Martina Farsi2[0000-0002-3132-8071], Giovanna Astori 1

1. ISTAT, Rome, Italy

2. FS Research Centre, Florence, Italy

5.1 | ANALYSIS OF THE LIMITATIONS OF THE CURRENT DATA SOURCES FOR PASSENGER MOBILITY

“Good decision making requires good data and good models, especially for transport planning. This, in turn, requires good data to establish the model base year, a sound representation of travel choice behaviour by users in its formulations and a good estimation of how the future will evolve. Data collection is therefore essential, but it is often perceived by modellers as an endless source of frustration.”

[5.1]

Transport modellers are often confronted with snapshots of the mobility phenomenon that are missing certain portions; in addition to the construction of the models themselves, the main activity consists of the joint interpretation of data of different natures, in order to form a general picture. Time and economic resources are generally limited; interviews of any kind, whether by telephone, online, or in person (i.e. conducted by intercepting the users of the transport system at key points in the network, e.g. on the main access roads to the study area), take time to plan and execute, and have a significant economic cost. The data from the ISTAT census are an indispensable source, as they allow us to obtain a territorial breakdown of the census sections, but are currently only available up to 2011. In this case, the missing piece is occasional mobility; this component, which has become increasingly significant in recent years, must therefore be assessed through other data sources. The Audimob mobility survey, in which travel reasons are investigated, is extremely important for this

purpose; another major difference between the two types of surveys is the output type: the indicators derived from the ISTAT census represent the individuals engaged in the travel, whereas the Audimob survey represents the structure of the journeys themselves, which is determined by the main purpose for which the individual started the travel (e.g. the home to work commute, with a stop for refuelling, is considered as a single journey for ‘work’ purposes, without interruptions). Then again, the Audimob sample is rather small compared to the census sample, consisting of just 16,000 interviews as opposed to the approximately 500,000 households involved in the census survey.

Other information that helps provide an overview of the mobility situation is the data collected by transport infrastructure managers and public transport service operators. In terms of road infrastructure, data are available from the traffic flow survey system for the roads managed by ANAS, which has numerous survey points located throughout the country (see Chapter 4 below, entitled “Mobility data sources in Italy”); even the Regions (e.g. Tuscany and Emilia Romagna) and the Metropolitan Cities themselves sometimes have their own systems of traffic count points on their own roads, which, like the ANAS data, can be obtained for a fee, or even free of charge by submitting a justified request. This type of data provides precise information regarding the georeferencing of the survey location, quantifying the travel flow

56 METHODOLOGICAL ASPECTS FOR PASSENGER MOBILITY ANALYSIS USING BIG DATA

ANALYSIS OF SEVERAL CASE STUDIES ON PASSENGER MOBILITY

passing through that particular section of the network; however, since it is not possible to obtain indications regarding the origins/destinations of the vehicle flows, the data are often used to either correct or validate the matrices obtained from the transport model.

Once again with regard to vehicle traffic, data on passages at motorway barriers are also available; these can be aggregated to represent hourly flows exiting and entering the toll stations, or to generate a daily OD matrix using the entry and exit point information contained on the ticket. This matrix merely provides a partial representation of the vehicle mobility phenomenon, however, as it only refers to users of the motorway system, and the origins and destinations are only the motorway barriers. It should also be noted that there is no single motorway manager.

When integrating motorway data with other sources of vehicle survey data, it must also be kept in mind that the definition of the vehicle types (light/heavy) may not be uniform, as the surveys are carried out using different devices with non-harmonised classification criteria, as described in chapter 4, entitled “Mobility data sources in Italy.”

Ticket data can also be used to reconstruct matrices in the case of rail transport as well, which, like those for the motorways, merely provide a partial picture of the transport demand limited to the specific rail user, and with a territorially restricted to the stations where the journey begins and ends; moreover, journeys involving the purchase of two or more separate tickets (high-speed and regional) are recorded based on the origin and destination of the individual ticket (it is going to be

57

improved to have the real O/D).

As far as public transport by road is concerned, not much data is available; there is a lack of passengers travelling long distances by bus, and it is also difficult to determine the transport supply; at the local level, it is possible to know the total number of tickets sold, and the number of passengers per line is obtained by conducting traditional surveys,

manually counting those on board and who board/disembark at stops, often on specific routes depending on the precise needs of the study. There is still no systematic collection of information carried out using automatic counting devices.

Other surveys that could help enrich the local data set are those derived from SUMPs and home-to-work travel plans. The minimum

58 METHODOLOGICAL
ANALYSIS USING BIG DATA
ASPECTS FOR PASSENGER MOBILITY

contents required for the elaboration of these plans, which are described in section 3.3 of the “Handbook for the drafting of the Sustainable Urban Mobility Plan” for the SUMPs8 and in annex 3 of the Guidelines for the Home-to-Work Travel Plans9, provide for a very interesting overview of the mobility phenomenon at the local level, which however remains limited to the specific project, as there

is no single information system that would make the collected data available for other types of analysis.

With regard to the official data sources , described in the chapter 4 “Mobility data sources in Italy”, the comparison of the mobility estimates obtained is difficult and not very straightforward due to the different purposes of the surveys, which result in

8. https://www.mit.gov.it/nfsmitgov/files/media/documentazione/2022-11/VademecumPUMS_ver.31122.pdf

9. https://www.mit.gov.it/nfsmitgov/files/media/documentazione/2021-08/2021.08.03_Linee_guida_PSCL_-_finale.pdf

OF SEVERAL CASE STUDIES ON PASSENGER MOBILITY 59
ANALYSIS

considerable differences in the data recorded. This aspect emerged clearly from an in-depth study carried out by the FS Research Centre aimed at analysing and comparing mobility statistics from the main national sources. The sources analysed were the National Sustainable Infrastructure and Mobility Survey (NSIMS), the Istat surveys, and the mobility reports published by Isfort within the context of the ‘Audimob’ observatory; Istat being a source for the NSIMS, the comparison was reduced to two terms of comparison: NSIMS-Istat and Audimob. The first critical point in the comparison was the different periods to which the two datasets refer: the comparison with the NSIMS data, which are typically annual, thus forced us to expand the Isfort survey data, which refer to the average weekday/holiday, to a year. The data on the average weekday and the average public holiday were appropriately summarised, with an annual value being obtained through the use of appropriate expansion coefficients. In carrying out this operation, two assumptions were made: the first to estimate the value of certain data (e.g. passenger-km by mode) on the average public holiday not directly published by Audimob, and the second to determine the number of weekdays and public holidays in a year. Another distinctive aspect of the data sources being compared is the territorial sphere to which they refer: the phenomenon investigated through the daily log is predominantly local mobility, with urban

travel being favoured over extra-urban travel. In order to carry out the desired assessments, an additional survey by Isfort was used: journeys of at least 10km outside the municipality of normal residence made during the 7 days prior to the interview are also recorded in a special section of the Audimob questionnaire. These are referred to as Extra-urban travel, and are recorded in the form of average weekly values. These journeys are in addition to those recorded in the daily log; therefore, in the comparison study described here, in reference to the year 2021, after the annual values were obtained through the use of appropriate expansion coefficients, these were also included in the calculation of the overall annual value. The inclusion of the extra-urban data was essential to ensure a proper understanding of the actual mobility captured by the Audimob surveys. Comparisons were made at various levels, ranging from a general comparison of all motorised mobility, to the specific details of the individual modes of transport. The mobility indicators considered in the comparisons were the number of passengers (or journeys) and the passenger-kms. The analysis, which was limited to data for the year 2021, revealed significant differences between the passengers by mode of transport for NSIMS-ISTAT, and those able to be inferred from the ISFORT survey expanded to cover the year; Audimob generally shows a 30% to 60% lower value than the NSIMS value, except for rail transport passengers,

60 METHODOLOGICAL ASPECTS FOR PASSENGER MOBILITY ANALYSIS USING BIG DATA

where Audimob has a 10% greater value. The differences between the two data sets can be partly explained by taking into account the small Audimob observation population, and in part by considering the distinction made between legs and journeys in the same questionnaire. A home-to-work journey made via a combination of means of transport is divided into legs (one for each means utilised), but is still counted as a single journey; therefore, in these cases what NSIMS counts as 2 or more passengers, results as a single passenger for Audimob. This latter motivation seems to be confirmed by the reduction in differences when comparing passenger-kms rather than passengers. The passenger-kms of motorised vehicles as a whole, estimated by expanding the Audimob values to cover the year, are about 30% less than the NSIMS values; the differences between passenger-kms for public transport are smaller, while those of private motorised mobility are more pronounced. In the latter case, it is very likely that there is also an overestimation on the part of the NSIMS, because the starting figure utilised is the vehicle fleet defined by ACI, which, in turn, makes it clear that this figure does not coincide with the actual number of vehicles on the Italian

roads, which is difficult to determine. Based on the analysis just described, it is clear that there is no survey that contains the “absolute truth”, but only surveys that reveal different aspects and temporal and spatial dimensions of mobility. For example, the Audimob log provides a detailed picture of the travel carried out in reference to the average weekday, especially in urban areas, with a precise characterisation of the modal chain and the travel reasons10 ; this is useful for the calibration of generation/distribution and modal choice models, differentiated by user type. Other data sources, on the other hand, such as NSIMS-Istat, provide a quantitative overview of the mobility phenomenon at the national level, or a detailed description of the flow conditions of the vehicle network and/ or the service levels of the infrastructures, such as the data from survey sections. Moreover, the combined use of different data sources is customary for the construction of transport models, in order to calibrate, validate, or provide flow values that have been expanded from the model’s simulation time dimension to the dimension needed for other types of analysis, such as Cost Benefit Analysis, or environmental impact analysis.

ANALYSIS OF SEVERAL CASE STUDIES ON PASSENGER MOBILITY 61
10. Isfort also records travel on public holidays in the latest editions of the Audimob questionnaire.

5.2 | IMPROVING THE INFORMATION POTENTIAL OF TRADITIONAL SURVEYS THROUGH THE USE OF BIG DATA

Big Data used in combination with traditional surveys, specifically data extracted from mobile networks, can help to enrich and bring new information to the puzzle representing the phenomenon, with an approach whereby the elements of interest are combined and

selected based on the needs, not unlike that already adopted for the official statistics. A number of critical issues will be analysed in greater detail in Chapter 7 below, entitled “Extraction of information .”

5.2.1 | CASE STUDIES: AN EXPERIMENTAL APPROACH

One effective application of the combined use of data from traditional surveys and Big Data is the national long-distance transport model developed by Isfort for Ferrovie dello Stato Italiane, which will soon be implemented for medium-distance journeys (under 80 km). The four stages of the model utilise traditional data sources, such as the Audimob survey, ISTAT census data, roadway traffic flow surveys, ticketing data, and train station boarding/disembarkation data, together with various types of Big Data. In particular, Floating Car Data (FCD) from insurance company black boxes and mobile phone data were utilised, the processing of which for transport purposes involved collaboration between the telephone operator Vodafone and the Ferrovie dello Stato Italiane

Research Centre. Furthermore, the analysis of the FCD, supplementing the Audimob data, made it possible to reconstruct the patterns of medium- and long-distance journeys made by car, and to highlight the differences with respect to short-distance journeys. For data fusion purposes, the sample data were incorporated into the population, using the circulating vehicle fleet from the ACI 2019 source, in order to obtain the O/D matrices for journeys of at least 80 km on an average weekday. The telephone data were used to quantify all the journeys made by the resident population and by foreigners present within the country for each day of October 2019, broken down into a number of appropriately identified traffic zones.

62 METHODOLOGICAL ASPECTS FOR PASSENGER MOBILITY ANALYSIS USING BIG DATA

In the example above, therefore, telephone data were used to reconstruct a general matrix of journeys, while the model was used together with pre-existing surveys and other contextual data to reconstruct the broken down matrices. This type of approach corresponds to the first of the two identified by Willumsen [1] for the use of Big Data in mobility analyses; the other involves segmenting the mobility demand detected through Big Data as much as possible, even using Data

Fusion techniques: for example, by combining the journeys detected through telephone data with the scheduled service, or better yet with the service actually carried out by the public services on the days of the analysis in order to verify the journey’s compatibility with the public transport mode, and thus possibly attributing that mode to the journey. This second type of approach is represented by the example described in Chapter 7, entitled “Extraction of information .”

ANALYSIS OF SEVERAL CASE STUDIES ON PASSENGER MOBILITY 63
Figure 3 - Data used in the Isfort National Long Distance Model (>80 km) for Ferrovie dello Stato Italiane - Image FS Research Centre
2019 Basic Model generation Audimob ATECO students Audimob networks service costs times ISTAT/ENAC distances Tourism accessibility MND population age group active non-active accessibility distribution modal choice routes train tickets road traffic flows floating car data Big Data Big Data
Figure 3 - Data used in the Isfort National Long Distance Model (>80 km) for Ferrovie dello Stato Italiane - Image FS Research Centre

5.2.2 | OPPORTUNITIES AND LIMITATIONS IDENTIFIED

Big Data provide new development opportunities for transport modelling:

• they can reduce the need for extensive and costly survey campaigns, or reduce the sample size;

• they reduce the data collection times;

• they allow for a snapshot of mobility to

be taken in a spatially and temporally extensive manner, offering the possibility of capturing its spatial and/or temporal variability, and its response to external stresses, such as in the case of a pandemic.

Validity of the collected data

People’s attitudes

They quickly become obsolete, and this is even more true because of the pandemic.

lengthy interviews increase the statistical burden; respondents tend to simplify and omit descriptions of journeys

Telephone service providers have data available for long periods of time.

In the case of apps, the respondent can choose not to provide georeferencing data, or to provide it only when the app is in use. They do not collect behavioural information, unlike the HTS.

Execution time

Accuracy

They take a long time to collect data

The data are not error-free, and must be re-viewed postacquisition

In just a short amount of time, it is possible to have large amount of data available covering an extended period of time

The distribution of the collected data in time and space depends on the interaction with the cell and the use of the apps; it therefore follows that it is not always possible to precisely identify the beginning and/or end of the journey.

64 METHODOLOGICAL ASPECTS FOR PASSENGER MOBILITY ANALYSIS USING BIG DATA
Travel
Big Data Cost High Sample size at most 2% of the area of interest 15% to 40% in the case of MND, depending on the market breakdown among the various telephone companies.
Household
Surveys
Table 4 – Comparison of traditional and Big Data surveys - Elaboration of the contents of Willumsen, L. (2021), “Use of Big Data in Transport Modelling” [1]

However, they are not without their limitations, as is well pointed out by Willumsen (2021) [5.1], and as revealed by the experiences described in Chapter 7 below, entitled

“Extraction of information .” The table below summarises the limitations highlighted by the author.

Limit Description

Inability to obtain exact start and end times for all the journeys.

Inability to identify short journeys

Sample expansion

Recognition of the purpose of the journey

The distribution of the collected data in time and space depends on the interaction with the cell and the use of the apps; it therefore follows that it is not always possible to precisely identify the beginning and/or end of the journey and its duration.

For the MNOs, this is linked to the size of the cells; in addition, there is also the phenomenon of phantom journeys, or cell jumps (false movements detected due to connections to different telephone cells during the period of observation of the mobile device, which is actually stationary). For app data, this is linked to the frequency/time threshold at which the event stamps are collected.

This poses numerous critical issues; information from telephone contracts is also utilised.

Is difficult, with the exception of systematic work/school travel, because the residential areas often have a mixture of land uses.

It is difficult to distinguish between systematic and non-systematic travel (excluding work/school travel).

Recognition of the mode of transport

Table

This critical issue mainly arises in urban areas

Willumsen [5.1]specifically identifies the joint use of Big Data with existing context data and mobility data as a possible solution to the limitations of Big Data for mobility analyses, introducing the concept of “Data Fusion”: the context data that he identifies includes census data, land use data, points of interest, and data from pre-existing traditional surveys, while the mobility-specific data that he identifies includes traffic data, public transport passenger counts, routes and frequencies, ticketing data, and data from public transport smart cards. As Willumsen himself points out [5.1], attention

must be paid to the differences between the data used in Data Fusion, for example with regard to the different error distributions in the sample data sets being combined. It should also be noted that the basic definitions, starting with that of the term “journey”, may not coincide. The following table shows the definitions of the various elements considered for the mobility analyses from the Eurostat Guidelines on Passenger mobility statistics (GL11), compared with those used in the case study with mobile network data (MND) described in Chapter 7 below, entitled “Extraction of information .”

11. https://ec.europa.eu/eurostat/documents/29567/3217334/Guidelines_on_Passenger_Mobility_Statistics+%282018_edition%29.pdf/f15955e3-d7b4-353b-7530-34c6c94d2ec1?t=1611654879518

65
ANALYSIS OF SEVERAL CASE STUDIES ON PASSENGER MOBILITY
5 – Limits of Big Data from telephony (MNO and app data) - Elaboration of the contents of Willumsen, L. (2021), “Use of Big Data in Transport Modelling” [1]

METHODOLOGICAL ASPECTS FOR PASSENGER MOBILITY ANALYSIS USING BIG DATA

Traditional mobility surveys

Concept Source Thematic definition

Population

Share of mobile population

Population out-side the field of observation

Journey

Eurostat Guidelines on Passenger mobility statistics (GL)

GL

GL

Resident population in Italy aged 15-84

GL

Leg

GL

Share of the reference population that made at least one journey during the observation period

In addition to the definition with respect to age groups, journeys made while carrying out a work activity (e.g. onduty taxi drivers/chauffeurs, lorry drivers during transport activity) should not be observed

A movement from an origin to a final destination, qualified by a place and a purpose or activity

A segment of a journey characterised by a single mode of transport (even on different means of the same mode, e.g. change of LPT line)

Feasibility (YES/ NO/IN PART)

66
Length of the leg/journey GL Km travelled during the leg/journey Duration of the leg/journey GL duration of the leg/journey in minutes Local mobility GL All journeys under 300 km of which urban (2
Urban mobility (1) GL All journeys within a Functional Urban Area Urban mobility (2) GL All journeys under 100 km
alternative definitions):

case study

All persons with a telephone, which roughly corresponds to all those at least 12 years of age

case study

case study

case study

case study

Share of the reference population that made at least one journey of at least 800m during the observation period

Currently not applicable because there are also work-related journeys (e.g. hauliers) among the tracked SIMs

The linking of any intermediate stops if they last less than a predetermined time period within a single origin-destination journey

case study Sum of distances travelled within the journey

case study Duration of the journey of over 800m in minutes

case study

case study

case study

case study

All journeys under 300 km (with a minimum length of 800m)

Not currently applicable, as it consists of journeys made by prevailing means. The possibility of applying the definition from the GL in a further case study should be analysed.

All journeys within a Functional Urban Area (minimum length of 800m)

All journeys under 100 km (minimum length of 800m)

Feasible, but not applied in the case study

Feasible, but not applied in the case study

Feasible, but not applied in the case study

SEVERAL CASE
ON PASSENGER
67
ANALYSIS OF
STUDIES
MOBILITY
MND
Feasibility (YES/NO/IN PART) MND
MND mobility surveys Source
Definition by MND algorithm

Traditional mobility surveys

Concept Source Thematic definition Feasibility (YES/ NO/IN PART)

Mobility over medium distances

Mobility over long distances

Number of overnight stays (for journeys over medium/long distances)

Mode (or modes) of transport

GL journeys of 301 to 999 km

Prevailing mode (or modes) of transport

GL journeys of 1000 km and beyond

GL number of nights spent between the outbound and return journeys

GL Type of vehicle used for the leg (includes ‘on foot’ mode) in part

GL Type of vehicle used for the longest leg of a journey in terms of kilometres travelled (includes ‘on foot’ mode); this is the mode attributed to the entire trip/journey in part

Reason for the journey GL

activity that will take place at the destination, which represents the purpose of the journey.

part Number of vehicle occupants

Table 6 – Comparison between definitions from regulations/guidelines for passenger mobility statistics and definitions from MND mobility surveys from the case study illustrated in Chapter 7 “Extraction of information.”

68
METHODOLOGICAL ASPECTS FOR PASSENGER MOBILITY ANALYSIS USING BIG DATA
Type of fuel used for the
by
(driver or
NO
Car fuel type GL
trip/journey
private car
passenger)
GL total number of people present in a car. NO
Main
in

MND mobility surveys

case study journeys of 301 to 999 km

case study journeys of 1000 km and beyond

case study

case study

case study

Only the prevailing means is currently dealt with in the case study. The distinct modes are train, plane, and other. In order for a journey to be deemed to have been made by train, at least half of the travel distance must be shown to have been made by train. However, if an aircraft is also involved in the same journey, the mode of travel will still be considered air travel alone.

Feasible, but not applied in the case study

Feasible, but not applied in the case study

This could be a topic for further study; the critical privacy aspects are to be evaluated.

Not currently applicable, as it consists of journeys made by prevailing means. The possibility of applying the definition from the GL in a further case study should be analysed

The possibility of applying the definition from the GL in a further case study should be analysed

case study NO

in part

This type of analysis has not yet been addressed. It is well known from the literature that it is difficult to determine, except in the case of recurring journeys such as work/school.

case study NO

69
ANALYSIS OF SEVERAL CASE STUDIES ON PASSENGER MOBILITY
Source MND
Feasibility (YES/NO/IN PART) MND
Definition by MND algorithm

5.3 | BIBLIOGRAPHY

[5.1] Willumsen, L. (2021), “Use of Big Data in Transport Modelling”, International Transport Forum Discussion Papers, No. 2021/05, OECD Publishing, Paris.

[5.2] Tartaglia M., Nourbakhsh S., Vannacci L.,Chindemi A.,Carbone G.,Ferrara M., Sommario W., Marino M. (2023), “Un modello multimodale per la simulazione della mobilità di media e lunga percorrenza delle persone in Italia”- Ingegneria Ferroviaria 3 (marzo 2023), 217-250.

70
USING BIG DATA
METHODOLOGICAL ASPECTS FOR PASSENGER MOBILITY ANALYSIS

6 | THE BIG DATA LIFECYCLE

6.1 | REFERENCE ARCHITECTURE

Data life cycle is described by documenting its main stages. The stages are broken down into individual processes, starting with the integration of the data, which from their initial form (i.e. the “raw” form, corresponding to the structure of the system that generates them) arrive at the final transformation process, which allows for the extraction of the information of interest, or rather their “Value.” This general process is calibrated for each big source based on the specific characteristics in terms of volume, value, velocity and all the other “Vs”, as well as the type of data, and the source generating them12. The process describing the data life cycle typically has a cyclical structure, which allows the final output to be evaluated, corrected and/or improved. In particular, however, cyclicality for Big Data allows for a robust process with respect to any changes in the source, which can be of various kinds, but certainly cannot be controlled by the end user.

Within the framework of the official statistics, the ESSnet Big Data Pilots II project [6.1] was launched by Eurostat, one of the main objectives of which was to establish a standard architecture for the Big Data processing processes (“Process and Architecture” Workpackage).

Based on the results of the previous project (ESSnet Big Data Pilots I), the need to formally establish a reference architecture was identified, with the aim of guiding the investments in

Big Data by the National Statistical Institutes (NSIs) and contributing to the development of standardised solutions and services to be shared within the ESS (European Statistical System) and beyond.

The modelling of the stages of the entire Big Data life cycle, as laid out in the ESSnet Big Data Pilots II project [6.2] as a standard for determining the indicators or, more generally, the estimates that can be obtained through the processing of Big Data, can be useful for establishing a standardised production process, and for determining the resources required for its management. The process standards should not act as a constraint, but should rather help identify all the necessary steps and resources. In modelling the data lifecycle, special attention should be paid to the users involved in the process and their role, particularly in the new Big Data management scenario, with particular regard to their Business interests.

For example:

• NSIs aim to introduce the use of Big Data in their production processes;

• Public and private organisations might be interested in following an established and controlled model of statistics production based on Big Data, guided by the experience gained with official statistics. This model is described below, drawing on the results of the project cited above, as it can be used for the following purposes:

12. human generated, machine generated, business generated.

THE BIG DATA LIFECYCLE 71

• As a framework to be used by Business and IT Architecture experts (following the Enterprise Architects model) in order to align the business and IT needs of organisations interested in implementing it;

• As a language for describing the information system projects that make use of Big Data sources;

• As a tool for top management to plan corporate investments relating to Big Data projects, taking into account the economies of scale offered by Big Data infrastructures and services, even at the international level.

6.1.1 |

EUROSTAT BIG DATA PROCESS STANDARDISATION PROPOSAL: BREAL

The BREAL (Big Data REference Architecture and Layers) model, developed by the “Process and Architecture” Workpackage, was formally established within the context of the European ESSnet Big Data project, and is illustrated below, taken from [6.3].

The BREAL model was formally established based on the layered representation of the Enterprise Architecture [6.4], and includes the description of certain artefacts that constitute it: the principles, functions, processes of the Big Data life cycle, and the possible Stakeholders upon which the Business Layer is modelled, see Figure 4.

A detailed set of general application services are represented and classified, which are proposed to show how the identified business

functions can be implemented. In particular, the data flow proposed for Trusted Smart Statistics is described (see sec. 6.1.2), which models all the steps in the transformation of the data from raw to statistical form, based on a three-level scheme known as the “hourglass model.”

The Project also included a phase in which the general model would be applied to four specific statistical domains in order to test its consistency and applicability. The processes examined were the following:

i. Online job vacancies (WPB);

ii. Online based enterprise characteristics (WPC);

iii. Smart energy (WPD);

iv. Tracking ships (WPE).

72 METHODOLOGICAL ASPECTS FOR PASSENGER MOBILITY ANALYSIS USING BIG DATA

It was also subsequently applied to the modelling process of constructing Mobility indicators and the estimation of the habitually resident population [6.5], analysed by Workpackage I (WPI) with a focus on mobile network data.

The BREAL model’s general architecture followed the typical three-layer scheme of the Enterprise Architecture for the identification of components deemed to be of interest for the modelling, namely for the following:

• the Business Layer, which describes ‘what’ has to be done to manage the Big Data, broken down in terms of “artefacts” representing: principles, business functions, the data life cycle of the specific production process, the actors involved,

and the end users;

• the Application Layer, which describes ‘how’ the functions and services that make up the data lifecycle process can be carried out;

• the Information Layer, which describes ‘how’ the data models or algorithms (operational models) implementing the data transformations and processing operations can be carried out. The classification of the data from “nano-data” and “micro-data” to “macro-data”13

The Technological level that describes the technical solutions at the SW and HW level is not part of the BREAL model, as this is linked to technical aspects, and not modelling aspects.

13. The term “nano-data” generally refers to data sources in which the data refer to events (e.g. trajectories, routes and journeys), defined with a finer granularity than “micro-data”, see https://doi.org/10.1017/dap.2020.7. Whereas micro-data records generally refer to “one to one” statistical units (e.g. individual persons or households), in nano-data sets the number of data referring to a single statistical unit may be “one to many.” Nano-data are also referred to as “granular data” or “behavioural data” in the literature, meaning that they describe the behaviour of a single statistical entity.

THE BIG DATA LIFECYCLE 73
Application/ Information layers Business layer Principles Generic Application Architecture Generic Information Architecture Operational Model Stakeholders Model Life Cycle Support Functions Model Business Functions Model BREAL Generic Architecture BREAL Solution Architecture Online Job Vacancies Online-based Enterprise Characteristics Smart Energy Tracking Ships
Figure 4 : General outline of the BREAL model’s architectural layers.

As shown in Figure 5 the BREAL life cycle model focuses on the representation of the business functions that make up the three main processes, as follows:

• Development and Information Discovery – this process deals with the exploration of the Big Data source, its integration with other data, and the inductive and/or deductive “discovery” of information through the processing of the source itself;

• Production – this process models the steps of creating statistical products through the use of Big Data and other sources;

• Continuous Improvement – this process deals with the monitoring and evaluation of the quality of the use of Big Data sources, with particular regard to the issues of the target population’s coverage and the validity of the models utilised. This is the stage that concludes the cycle, because any evidence of correction or improvement triggers the design of a new Development and Information Discovery and/or Production process.

74 METHODOLOGICAL
FOR PASSENGER MOBILITY ANALYSIS USING BIG DATA
ASPECTS
Continuous Improvement Validation Quality Management (GSBPM) Evaluate (GSBPM) Specify Needs (GSBPM) Trust Management Metadata Management (GSBPM) New Data Sources Exploration (EARF) EARF NEW GSBPM Development and Information Discovery Acquisition and Recording Data Wrangling Data Representation Modeling and Interpretation Integrate Survey & Register Data Enrich Statistical Register Production Deployment Support Statistical Production Shape Output Visual Analyses Disseminate (GSBPM)
Figura 5: The BREAL life cycle.

As highlighted by the colours in Figure 5, some of the business processes taken into account have already been modelled and described by other standardisation models, like GSBPM and ERF. In the analysis of this new model, however, these standards were not

considered complete with respect to the modelling of all the activities to be deployed in the Big Data life cycle analysis. The process has been outlined using the ArchiMate language, which is an open language for modelling Business Architecture.

6.1.2 | DATA FLOW ARCHITECTURE

As previously mentioned, the data management process provides for a “state” at each step of the process in which the data are transformed from raw to statistical data. This model has been formally established as the Generic Information Architecture for Big Data (GIAB), and consists of three layers, represented by the “hourglass model” proposed for Trusted Smart Statistics. The three layers of the hourglass consist of: the base of the hourglass, where the raw data are modelled, the middle section, with the data that represent the point of convergence (i.e. transformation from raw to statistical data), and the top layer, which represents the statistical data use to perform statistical analyses and to calculate the indicators of interest.

In particular, the three levels can be described as follows:

• The Raw Data Layer includes the data acquired and archived by the “Acquisition and Recording” function. In the GIAB model, the concepts are described, but no details are provided regarding formats or other technical specifications that could be useful for capturing and storing raw data.

• The Convergence Layer contains the data referring to the units of interest for analysis purposes. These data are produced as a result of the “Data Wrangling” and “Data Representation” functions of the BREAL life cycle.

• The Statistical Layer includes the concepts that are the objectives of the analysis. These data are mainly produced by “Modelling and Interpretation,” “Integrate Survey and Register Data,” “Enrich Statistical Registers,” and “Shape Output.”

A description of the data and metadata is carried out during the modelling of the three layers. In particular, the source metadata (Lineage), and not only those specific to the individual source, are of considerable importance for Big Data, as are the specific aspects associated with the data supplied by a particular provider (e.g. network data are linked to the telephone network which, although standardised, has specific aspects linked to individual service providers). This model was applied to the processing of mobile network data in the “Reference Methodological Framework” (RMF) [6.6].

THE BIG DATA LIFECYCLE 75

6.2 | ROLES AND ACTORS

Big Data can be produced by a single supplier, i.e. a single platform that generates them (e.g: Twitter, Facebook, etc.), or by various providers that own different platforms that generate them, using shared technologies but with different formats (e.g. mobile network data, website data, etc.).

Unlike traditional data systems, which tend to be stored, developed and distributed for a single organisation, such as the administrative or economic data pertaining to companies, Big Data systems can be distributed by one or more organisations, and used by different end-users, who, depending on their respective interests, produce different products. Consequently, the actors in Big Data systems holding the same roles can come from differ-

ent organisations. The BREAL model classifies the actors involved in the Big Data life cycle as follows:

• IT & Statistical Pipeline Actors - figures having a synergy of skills ranging from statistics to IT;

• Capacity Providers - i.e. data providers;

• Global roles - a set of institutional actors, such as statistical institutes capable of providing Big Data expertise, and actors capable of handling the control and management aspects of a production project, as well as the citizens themselves;

• Audit, Control, and Compliance Actors - a series of actors, often external to the organisation, who perform control functions in relation to various aspects.

76 METHODOLOGICAL ASPECTS FOR PASSENGER MOBILITY ANALYSIS USING BIG DATA

The roles of the various actors and how they relate to each other are shown in Figure 6. Detailed descriptions of the functions they are called upon to implement within the context of the BREAL life cycle model proposed by EUROSTAT are provided in the paragraphs below.

Organisations that want to use Big Data in their production processes must organise themselves by: acquiring new professional figures, such as Data Scientists, growing their

staff with expertise in new fields of knowledge and innovative methodologies and technologies, and equipping themselves with an organisation that covers various areas, including the management of information security and data privacy. In general, they should be aware that the use of Big Data requires considerable investments, not only in terms of technical capabilities, but above all in terms of the acquisition of knowledge and qualified human resources.

THE BIG DATA LIFECYCLE 77
Statistical Institutions Citizens Data Provider Framework Provider Capacity Providers System Orchestrator Other Statistical Institutions Medias G Government Computing Architects Role: BD
Design Information Architects Data Scientists Domain Experts
Figure 6: BREAL actors.
Computing
Role:
DPO Data protection Officer CDO Chief Data Officer Scientific & Academic Communities
IT & Statistical Pipeline Actors Role: BD Preparation Role: Analysis visualisationand
Consistency and Validation
Audit, Control, Compliancy Actors

6.2.1 | NEW PROFILES WITH A SYNERGY OF STATISTICAL AND IT SKILLS

The first actor involved in the Big Data life cycle deals with the study and “discovery” of information that could be obtained from the raw Big Data, and the development of its initial processing operations. Various skills are required for this type of actor to carry out the functions of the “Development and Information Discovery” process. In particular, they are capable of establishing raw data processing algorithms, which are necessary for the acquisition and use of Big Data in a statistical process. This role is labelled within the process as “Big Data Computing Design,” and is covered by figures called “Computing Architects”, with expertise in cloud computing, Big Data storage management and, more generally, IT architecture. The information system architects involved from the beginning in the “acquisition and registration” phase hold a transversal role, as they handle the technical requirements for both the main “Discovery” phases and the “Production” phases.

Once all of the overall IT framework’s components have been set up and provided, both hardware and software, another crucial role is that of the “Information Architects” for the “Preparation of the Big Data.” These actors are mainly dedicated to the data processing (“Data Wrangling”) and representation (“Data Representation”) phases. They provide the data extraction and representation services through reporting (e.g. the distribution of the entire dataset and various views of the analyses carried out on the raw data). The main pre-processing activities provided are the following:

• data validation (e.g. format checks) and data cleansing (e.g. deletion of damaged and duplicate records, selection of the records of interest, etc.);

• data conversion (e.g. standardisation, reformatting, and encapsulation);

• data aggregation and synthesis.

Once the data are available and properly managed, other profiles, such as data scientists are able to identify the potential use of this data for statistical purposes and build the statistical pipeline for analysis through various “Analysis and Visualisation” methods. These activities are carried out during the “Modelling and interpretation” and “Visual analysis” phases.

The various profiles must collaborate throughout the entire pipeline, since, due to the Big Data’s complexity, its processing requires a pool of skills. For example, collaboration between data scientists and information architects is essential during the “Data Wrangling” and “Data Representation” phases.

Within the context of Big Data analysis, the task of the Data Scientist is essential, and spans various areas of analysis, activities and techniques, including:

• “Human-in-the-loop” analysis (e.g. discovery of information, hypotheses for the analysis or determination of the phenomenon, hypothesis testing, etc.);

• the choice of the statistical method for implementation (e.g. machine learning, deep learning, natural language processing, image processing, and neural networks);

• the development and optimisation of the algorithms.

Data scientists should therefore focus on discovering the statistical potential of the Big Data (i.e. performing rapid cycles of hypothesis testing) in order to find the “information value of the data,” by combining two approaches: analysis and visualisation Visualisation can serve two purposes: on the one hand, it helps to understand large volumes of data and to quickly determine how further exploration should be carried out; while on the other hand, it helps to create a simplified representation of the results, which

78 METHODOLOGICAL ASPECTS FOR PASSENGER MOBILITY ANALYSIS USING BIG DATA

can help with decision-making or in communicating the knowledge gained (through simple illustrations or infographics).

Data Scientists therefore also manage several secondary activities, such as:

• exploratory data visualisation for the understanding of the data themselves (e.g. navigation, outlier detection, boundary conditions);

• explanatory visualisation of analytical results (e.g. confirmation, near real-time presentation of the analyses, interpretation of the analytical results);

• explanatory visualisation for “telling the story” (e.g. business intelligence).

Collaboration between data scientists and domain experts is essential during the

6.2.2 | DATA PROVIDERS

The data provider acquires primary data from its own or third-party sources (e.g. web browsers, mobile devices, sensors, etc.). It ensures the persistence of the data, which can often be accessed through mechanisms like web services. Moreover, depending on whether the data is proprietary or under its management, the data provider determines the access policy, as well as the level of detail of the data made available.

The provider is often not the data owner, but is rather their custodian, and manages the access levels based on the privacy levels that it has declared to guarantee, and the authorisations received from the data subject in the case of personal data.

discovery and validation phases in order to make sense of the results. The domain experts should be involved at an early stage when determining the analysis needs and defining the basic concepts of the domain under consideration. Therefore, in addition to helping determine the Use Cases, the domain experts must also be involved in the validation stages, in order to assess whether the data obtained can really support the analysis of interest. The assessment of the data representativeness within the domain of analysis is of particular importance, both in terms of the reference population’s coverage (representativeness of the data) and the definitions of the individual concepts.

Providers can be: companies (e.g. web companies), network operators, or agencies providing data extraction services from sensor systems, and even public agencies.

In general, it is necessary to establish a “Framework Provider”, in which the resources or services for accessing the data are laid out, as are the services for creating the specific data extraction application, in certain cases. The “Framework Provider” essentially manages three activities: the infrastructure framework , the data platform framework , and the data access and processing framework, each relation to the process actors described above.

6.2.3 | PROCESS ACTORS INSIDE AND OUTSIDE THE ORGANISATION

In order to integrate the internal functions , of those interested in creating statistical products, and the external functions , or rather those outside the organisation that produce the statistical outputs and are called upon to participate

in the process, a global function is required, referred to in the BREAL model as the System Orchestrator. This function is dedicated to providing the general requirements that the system must fulfil, even in terms of policy, gov-

THE BIG DATA LIFECYCLE 79

ernance, architecture, and resources, as well as monitoring or auditing, in order to ensure that the system complies with these requirements. It generally consists of a pool of actors that oversee the business environment in which the system operates, including the specification of the business objectives, the contracts of the Data Provider, the conduct of negotiations with the Framework Provider, and the design of the human resources recruitment plan (the internal needs in terms of professional figures,

such as computer architects, information architects, and data scientists).

This set of figures must work synergistically within the company to manage and formally document the needs, to ensure the availability of general resources, and to link the Big Data process to generic functions like “Production Support” and “Dissemination,” which do not differ very much from the same functions performed for data types other than Big Data.

6.2.4 | ACTORS WITHIN THE ORGANISATION WITH SPECIFIC FUNCTIONS

Like all others, production processes that use Big Data need to implement and specify three additional transversal functions: General data management, Security and privacy, and Scientific relevance of the data.

The use of Big Data changes the approach: the data are now collected to focus on a goal. The data collected must therefore be consistent. This is the task of the Chief Data Officer (CDO), who is responsible for simplifying the way the data are accessed, and identifying the data useful for the organisation’s purposes.

In particular, the “Exploration of new data sources” Big Data lifecycle function is carried out by the Chief Data Officer, who is an internal actor within the organisation, and is responsible for the overall management of the data.

In the future, this function will have to respond more and more readily to the needs of users, taking care to identify, study, and analyse new data sources with the greatest information potential with respect to the analysis needs. One

of the characteristics of Big Data is timeliness, or rather the ability to represent events and provide information about them within a very short time frame.

Since many of these sources can involve personal or even sensitive data, there is a need to involve the Data Protection Officer (DPO) in the process, who is in charge of establishing a set of safeguards for all types of Big Data platforms, such as security and privacy controls to protect both the critical and essential operations and resources of organisations, and the confidentiality of personal information. The ultimate goal is to verify that the information system meets the security and privacy requirements established by law, as well as the supplementary measures decided by the System Orchestrator.

The scientific and academic communities can also contribute to the process in order to improve it and enrich it with all the most advanced techniques and methodologies applicable to these continuously evolving data sources.

80 METHODOLOGICAL ASPECTS FOR PASSENGER MOBILITY ANALYSIS USING BIG DATA

6.3 | THE STANDARDISATION OF DATA ACCESS

Many Big Data are held by private entities, and are therefore referred to as privately-held data (PHD). In the case of PHD, it is extremely important to address the issue of access from a legal, organisational and technical perspective.

From a legal standpoint, the European data strategy, and in particular the Data Act14 [6.7] certainly represents a big step forward for the regulation of business-to-government relations, and thus for access to privately-held data. The Data Act emphasises the importance of principles like the mandatory sharing of data for certain public purposes (naturally while upholding privacy and other data rights), as well as the standardisation of data access arrangements, ensuring fair, reasonable, proportionate, transparent, and non-discriminatory conditions.

From an organisational standpoint, in many cases the data may reside with the data’s holder or provider. This entails the need to set up data access processes that can be highly complex. This is a real paradigm shift15, from an approach in which the data are brought into an organisation (pulling data in), to one in which the data reside with the holder/provider and it is rather the processing operations that are pushed out of the organisation (pushing computation out).

The organisational impact of this paradigm shift in data access is considerable, and, in addition to the aforementioned design of new processes, it also entails an investment in the creation of a new data culture, in which the data is no longer held by the organisation that

produces a value-added service from it, but can be rendered available at various points of a supply chain involving numerous actors.

Finally, from a technical standpoint, it is necessary to invest in dedicated systems that enable i. access in a manner determined by the holder/provider, or else ii. processing of data on the holder’s/provider’s premises.

In the first case, if there are no dedicated data exchanges, one important mode of access is via APIs (Application Programming Interfaces), made available by the holders/providers; one example is Twitter’s public API.

In the second case, however, so-called privacy-enhancing technologies (PETs) can be of help, including: homomorphic encryption techniques, Secure Multi-party Computation (SMC), Trusted Execution Environment (TEE), and synthetic data generation. Using PETs, it is possible to carry out privacy-preserving data processing operations on the holder’s/ provider’s premises, without viewing the data in the clear, but rather only the results of the processing operations. These techniques are therefore an important element of the aforementioned “pushing computation out” approach.

In short, legislative, organisational, and technical solutions that allow for access to privately-held data are now becoming available. However, numerous investment fronts remain open, the most important of which is likely that of regulation within the context of the Italian national strategy.

14. European Commission (23 February 2022). Data Act: Proposal for a Regulation on harmonised rules on fair access to and use of data). Brussels, Belgium: European Commission, https://ec.europa.eu/commission/presscorner/detail/en/ ip_22_1113

15. https://content.iospress.com/articles/statistical-journal-of-the-iaos/sji190584

THE BIG DATA LIFECYCLE 81

6.4 | BIBLIOGRAPHY

[6.1] ESSnet Big Data Pilots II: https://webgate.ec.europa.eu/fpfis/mwikis/essnetbigdata/ index.php/Main_Page

[6.2] Eurostat: ESS Enterprise Architecture Reference Framework: https://ec.europa.eu/eurostat/cros/content/WPF_Process_and_architecture_en

[6.3] Deliverable F1 “BREAL: Big Data REference Architecture and Layers Business Layer”: https://ec.europa.eu/eurostat/cros/sites/default/files/WPF_Deliverable_F1_BREAL_Big_ Data_REference_Architecture_and_Layers_v.03012020.pdf

[6.4] Statistical Enterprice Architecture: https://joinup.ec.europa.eu/collection/statistical-enterprise-architecture

[6.5] Deliverable I.6 “A proposal for a statistical production process with Mobile Network Data”: https://cros-legacy.ec.europa.eu/system/files/wpi_deliverable_i6_a_proposal_for_a_statistical_production_process_with_mobile_network_data_18_03_2021_final.pdf

[6.6] “Towards a Reference Methodological Framework for the processing of mobile network operator data for official statistics”, Presentato a “Mobile Tartu 2018”. https://ec.europa.eu/ eurostat/cros/system/files/rmf_mobiletartu2018_ricciato_printout.pdf

[6.7] European Commission (23 February 2022). Data Act: Proposal for a Regulation on harmonised rules on fair access to and use of data. Brussels, Belgium: European Commission, https:// ec.europa.eu/commission/presscorner/detail/en/ip_22_1113

82 METHODOLOGICAL ASPECTS FOR PASSENGER MOBILITY ANALYSIS USING BIG DATA

7 | EXTRACTION OF INFORMATION

1. FS Research Centre, Florence, Italy

2. Ferrovie dello Stato Italiane, Trenitalia, Strategies, Rome, Italy

7.1 | EXPERIMENTAL ANALYSIS

7.1.1 | THE DATA UTILISED

The mobile network data used for the case study described in this chapter were provided by a single telephone service provider with about 23 million Human-type SIM cards in Italy16

At the spatial level, the georeferencing accuracy of the collected data primarily depends on the infrastructure of the mobile radio signal; the basic granularity is linked to the number of telephone cells and their distribution. The telephone service provider in question is present throughout the country, with over 200,000 cells covering about 99% of the population with a 4G signal. Advanced spatial granularity, on the other hand, is linked to additional devices alongside the basic infrastructure; this second type includes 4G and 4.5G signal repeaters, known as Crowd Cells, and Distributed Antenna Systems (DASs), a technology which is still in the consolidation phase and consists of a series of small antennas generally installed within the locations of interest in order to improve the mobile radio service coverage. Further improvement in the spatial accuracy of the measurements with respect to cell coverage can be achieved by accessing complementary data sources and methodologies that offer greater detail. These include sources based on data generated by applications installed on mobile devices, which provide geo-localisation with an accuracy of within just a few metres (AGPS),

as opposed to the coverage offered by mobile network antennas, which are area-based; in the case study at hand, about ten million devices allow for this type of additional spatial calibration. Using the appropriately aggregated data from these sources, it is thus possible to calculate probabilistic maps that allow for a statistical distribution of users to be obtained, with an effective increase in spatial detail throughout the territory with respect to analysis based solely on mobile network cells.

The other fundamental aspect with respect to the accuracy and descriptive capacity of the mobility phenomenon is the temporal granularity of the surveys: the frequency with which the positions of the telephone service providers’ SIM cards are sampled is of fundamental importance for the subsequent process of profiling and thorough analysis. This aspect is decisive, especially in cases where knowledge of actual presence or passage within a limited geographical area is necessary, such as railway stations, motorway toll booths, border crossings, etc. Sparse sampling (for example, every thirty minutes or more) would not allow the actual presence of customers within limited geographical areas to be guaranteed, and would therefore drastically decrease the reliability of the profiling and most of the insights.

The temporal recording of events takes place through two distinct acquisition processes: the

EXTRACTION OF INFORMATION 83
16. Human SIM cards are those which allow for Voice or Voice + Data traffic.

first, called Circuit Switching (CSD), is related to Voice and SMS traffic, which on average produces about ten events/day per SIM/device; the other, called the Packet Switching (PS or TMA), is related to data traffic and the use of APPs and other device activities. This second source allows for a frequency of well under a minute, resulting in about two thousand events per day per SIM/device.

In this context, up to thirty billion positions referenced in time and space, irreversibly anonymised, can be generated in one day. As with any statistical survey, techniques and methodologies must be implemented to eliminate or limit any possible errors. In particular, all sample surveys suffer from two types of error:

• sample error, which simply results from the fact that we are only looking at a portion of the population;

• non-sampling errors, which depend on possible “biases” related to the survey environment. These can be reduced or eliminated if information on their nature is known.

As far as the sampling error is concerned, this can be considered insignificant in view of the large sample size surveyed and the frequency with which the geographical information is collected (several times per minute). The non-sampling errors, on the other hand, need to be constantly checked and reduced using the information found in the field.

Through an appropriate set of proprietary algorithms and expansion techniques, the data collected are carried over to reflect the entire Italian and foreign population in Italy. The process for expanding the sample to cover the entire target population (all people with a phone, which roughly corresponds to all those at least twelve years of age) is based on a Machine Learning model, which takes a series of variables into account, the main ones being:

• local market share of the telephone service provider, obtained from internal market analysis;

• market share by SIM type (business/consumer), obtained from market studies and official reports, such as the telecommunications observatory or AGCOM;

• socio-demographic characteristics of the users from proprietary records. Two levels of data refinement are applied to these indicators:

- use of the information regarding the “real user”: this is done through the operator’s interface points with the customer (contact centre, shop, etc.), through which the actual SIM user’s personal information is updated following interaction with the customers themselves. The real user is the person who actually uses the SIM card, regardless of who has signed the contract;

- correction of any distortions related to different market penetration levels among the different age groups of the population, using official statistics such as ISTAT census data.

The combinations of calibration factors have led to the identification of various classes of inferential algorithms, depending on the types of analysis, thus creating a library broken down by specific domains, such as indoor presence, high-speed mode, spatial presence, and passage through restricted locations. Particular attention has been paid to the methodology of verifying and continuously calibrating the inferential model. In fact, situations where a safe numerical reference for comparison is available are analysed periodically.

A log of the past eighteen months is available, and this makes it possible to compare the phenomenology, considering a complete seasonality cycle, and offers the possibility of measuring year-on-year trends and differentials.

84
USING BIG DATA
METHODOLOGICAL ASPECTS FOR PASSENGER MOBILITY ANALYSIS

7.1.2 | INTERACTION FOR DATA EXTRACTION

7.1.2.1 | MOBILITY ANALYSIS NEEDS

The data required for mobility analyses and studies can be broken down into data describing the mobility supply, socio-economic data, and data describing users’ mobility habits. Transport service and infrastructure data are generally already in the possession of public administrations and service managers, such as those concerning the infrastructure network and the planned runs (GTFS). Socio-economic data are derived from national statistical collections, such as the population census, or other specific surveys. Information on mobility habits is also collected within this context, which is of considerable interest for the development of transport analyses and simulation models. Although the survey is a good starting point, the desired information needs are not met, also because of the limited territorial granularity with which the phenomenon is able to be represented. Hence the need to intercept or create additional sources, which, prior to the arrival of Big Data, only consisted of surveys specifically designed for the studies to be carried out (e.g. surveys of traffic flows in certain sections or of passengers of public services of specific interest).

For territorial administrations, data on mobility habits serve as the basis for the proper planning of infrastructural interventions and management policies. From a design standpoint, these data are necessary for the creation of econometric models, which allow for the evaluation of the transport demand as the supply changes. They come into play during both the model building phase and the phase of assessing the model’s ability to represent the real mobility dynamics (validation). From a management standpoint, they make it possible to monitor the effectiveness of a given transport policy (e.g. the establishment of a congestion charge, or the application of a new ticket rate or a set of actions), as is required for SUMPs, for example.

For transport managers, mobility data allow for the determination of the desired transport demand in order to ensure an adequate supply, and possibly to expand the catchment area of the services.

The supply and demand data described, become indispensable when designing Mobility as a service (MaaS) systems: in order to create an integrated transport system, it is necessary to share and collect all the information of both a static (origin, destination, peak times, etc.) and dynamic nature (real time status of the network and services, estimated travel times, etc.).

Data of various kinds are therefore necessary in the field of transport. Remaining within the context of descriptive data on passenger mobility, the information needed is as follows:

• spatial organisation of the journeys. Origin and destination of the journeys and number of persons/vehicles for each OD pairing;

• temporal distribution within the day of travel;

• travel frequency;

• travel reason (work, school, business, occasional) upon which the willingness to pay for the journey may also depend;

• type of user (age, occupation, etc.);

• modes of transport.

Depending on the analysis to be carried out, other information of interest may include data on the use of terminals in support of travel, such as stations, stops and platforms, as is the case in service level studies.

During the pandemic, the need for snapshots of mobility at a given time, thus allowing for rapid comparisons with the standard conditions, became more evident. This can also be of interest whenever the effects of new transport management measures and policies are to be monitored, in accordance with the philosophy underlying the Sustainable Urban

EXTRACTION OF INFORMATION 85

Mobility Plans. MaaS and Smart Mobility also require real-time knowledge of network flow conditions, disruptions, and estimated travel times.

In order to be used as inputs or comparison sets for simulation models, or to allow for the establishment of a historical series of analyses, the samples used for the collection of the mobility data must be repeatable with similar characteristics, or traceable to previous data collections. One example is the spatial allo -

cation of the journeys; in the transport models, unambiguously defined basic units with limited variability are defined as census sections and administrative units (municipalities, provinces, etc.).

Especially in the field of transport modelling, the individuals included in the samples must be able to be classified from a socio-economic standpoint, in order to allow for the expansion of the population and the analysis of the results.

7.1.2.2 | CREATION OF A COMMON PROVIDER-ACQUIRER LANGUAGE FOR THE EXTRACTION OF MOBILITY DATA

The use of mobile network data to meet mobility information needs requires preliminary data processing operations to be carried out: Big Data provides large amounts of information, which must, however, be “translated” into the indicators typically used by transport surveys and studies. For this reason, in case studies and application experiments, interaction between the user and the provider of the data is necessary in order to identify and determine the measurements to be derived from the data in question, while at the same time refining the methodologies for extracting the data and testing the results.

The first context for the concrete use of mobile network data presented here is that of a nationwide mobility study aimed at supplementing the official data sources, such as the ISTAT surveys, the MIT National Transport Survey, and the Audimob survey. For this type of analysis, the characteristics of the data supply were agreed upon with the company in tasked with processing the data.

The first step was defining the term “ journey”: in this study, “journey” was considered as the concatenation of all possible intermediate stops lasting less than one hour within the

context a single origin-destination desplacement. For example, the chain consisting of the departure from home, stopping to refuel, and then going to work, was considered as a single journey. The distance associated with the journey was estimated as the sum of the distances travelled for that journey. A special zoning methodology was established for the spatial referencing of the journeys: the nationwide study area was broken down using the municipalities boundaries and the ANAS zoning system. The latter was established internally by ANAS for the purpose of constructing a transport model to forecast traffic flows on the ANAS network and on a portion of the remaining national network. The ANAS zoning, in turn, is consistent with the SIMPT zones of the MIT (2004) and the boundaries of the national territory’s division into Local Labour Systems (LLS – 2011). Using these references, small municipalities were then aggregated, while for larger municipalities in metropolitan areas, a more disaggregated zoning was adopted based on districts, wards, or their aggregations (Figure 7). A zoning system consisting of 3000 zones was therefore established.

86 METHODOLOGICAL ASPECTS FOR PASSENGER MOBILITY ANALYSIS USING BIG DATA

The main data extracted from this type of analysis are the following:

• the modal share by train, aeroplane, and other modes;

• the distribution of the users of train, aeroplane, and other modes with respect to the distances travelled;

• the monthly, weekly, and hourly distribution of the journeys;

• the systematic/non-systematic nature of the journeys;

• the percentages of mobile population by region;

• the spatial (O/D) and modal distribution for the journeys at the provincial level, and in detail for certain metropolitan cities. Other type of analysis made using the mobile network data was to determine the users’ presence within four major railway stations: Roma Termini, Milano Centrale, Napoli

Centrale, and Genova Piazza Principe. In particular, the daily behaviour of the users was investigated based on the activities carried out, the day of the week, and the means of arrival and departure from the station. For each of the four railway stations, specific points of interest, such as airports, were also analysed. For this type of activity, the methods for identifying the different types of users were developed:

• HS train mode: the user classified as a train passenger was seen at another station connected by the high-speed service, within a time interval consistent with the high-speed travel time;

• Airport Express mode: the user classified as a train passenger begins or ends their train journey at the Fiumicino airport for Rome, or the Malpensa airport for Milan;

• REG/IC Train mode: the user classified as

EXTRACTION OF INFORMATION 87
Figure 7 - Zoning for the journeys determined from mobile network data

a train passenger does not fall under the previous classifications;

• Other mode: the user is not classified as a train passenger;

• Co-visit: in addition to the railway station, the user also visits other points of interest.

This type of analysis allowed the extraction of the total monthly presences and the average presences per day of the week, as well as the distinction of the types of users based on the above definitions.

Another case study, once again associated with the railway stations, was the analysis of their catchment areas in terms of both origin (where the users who use the specific station to access the rail network come from) and destination (where the users who have arrived by train at the railway station under analysis subsequently go); the journeys for each railway station studied were aggregated based on the origin/destination area, the station access/egress modes, the month, and the systematic nature of the journey Figure 9. According to this definition, like that which takes

place with the calculation of the transport hub access/egress isochrones, the catchment area was not traced back to a specific O/D journey carried out by the passenger, but rather to the individual stations. By way of example, the city of Pavia has been generically considered within the catchment area of the Genoa Piazza Principe railway station; however, while this definition may be appropriate for GenoaRome rail services, it may not be so for the analysis of Genoa-Milan rail services, since the Pavia station itself is a stop for numerous rail services on the Genoa-Milan route.

88
BIG DATA
METHODOLOGICAL ASPECTS FOR PASSENGER MOBILITY ANALYSIS USING
Occasional Total occasional FS Research Centre Il Centro Studi di Ferrovie dello Stato Italiane 52% 50% 51% 48% 40% 31% 27% 48% 50% 49% 52% 60% 69% 73% 67' 35' 48' 43' 23' 35' 42' 33' 21' 24' 37' 29' 17' 18' 21' 37' Roma Termini Analysis of the presences in the station through the processing of Vodafone Analytics (non-personal telephone Big Data, anonymized and aggregated in absolute compliance with the privacy requirements of the GDPR). 8,0 millions 81,4% 18,6% 2,0 millions 6,0 millions 43% 57% average time 30 min Dicember 2023 Analysis of the average waiting time of people arriving and departing from the station Station attendance Types of travelers Time in station High speed Regional, Intercity Airport connection Other services** *Travelers present at the station who do not use train services. **Arrival or departure from the station by private transportation, public services (except train) or on foot. Source: Vodafone for FS Research High speed Regional, Intercity Airport connection Other services**
Figure 8 - Example of railway station presence analysis using mobile network data - source SIMS

As pointed out in chapter 5, Big Data, and particularly mobile network data, allowed carrying out analyses over long periods of time, and the identification of the temporal variability of the mobility phenomena. This broad temporal scope has made it possible, for example, to obtain snapshots of the preand post-covid mobility trends, with total coverage of the Italian territory. This type of analysis that would have been impossible with

traditional surveys, even merely due to the exceptional and unpredictable nature of the pandemic itself. In addition to more traditional sources, such as surveys on travel intentions, the availability of these data in near real time, and for the entire country, also allowed for an adequate provision of transport services during the pandemic, especially long-distance services, which were drastically reduced and then gradually restored as travel resumed.

EXTRACTION OF INFORMATION 89
Figure 9 - Example of the catchment area for the Genoa Piazza Principe railway station
+12% -2% -54% -69% -43% -24% -10% -14% -21% -28% -42% -37% 800 600 400 200 0 January February March April May June July August September October November December -28% -34% -46% -47% -27% -19% 0% +7% +19% +4% +26% +11% 2020
2019 -54% -69% -43% -24% -10% -14% -21% -28% -42% -37% Febbraio Marzo Aprile Maggio Giugno
Agosto Settembre Ottobre Novembre Dicembre -46% -47% -27% -19% 0% +7% +19% +4% +26% +11%
Figure 10 - Mobility trends in Italy over three different years, pre- and post-pandemic 2020 2021 2019
2021
Luglio

Another example is the study carried out on the journeys associated with certain origin/ destination pairings of interest; for two significant months of different periods (winter and summer), the average journeys per day of the week were extracted, as shown in Figure

11 . This type of analysis is useful for quickly assessing the potential demand for transport in relation to an O/D pairing of interest, and its seasonal distribution among the days of the week and time slots (Figure 12).

90 METHODOLOGICAL
FOR PASSENGER MOBILITY ANALYSIS USING BIG DATA
ASPECTS
20 000 15 000 10 000 5 000 0 November 20 000 15 000 10 000 5 000 0 Mon Tue Wed Thu Fri Sat Sun July Average daily journeys A/B C 20 000 15 000 10 000 5 000 0 July 20 000 15 000 10 000 5 000 0 November Average daily journeys C A/B B-C A-C Mon Tue Wed Thu Fri Sat Sun Mon Tue Wed Thu Fri Sat Sun Mon Tue Wed Thu Fri Sat Sun
Figure 11- Example of the temporal characterisation of the journeys in relation to an OD pairing of interest

Thanks to the possibility of recognising mobile devices tha use roaming service, analyses carried out by origin/destination were broken

down by users residing in Italy and foreigners, such as those shown in Figure 13.

EXTRACTION OF INFORMATION 91
Figure 12 - Example of hourly journey distribution analysis
Journeys per month (K journeys) September Foreigners Italians October November May June July 43.1% 54.3% 72.8% 41.7% 58.3% 27.2% 45.7% 56.9% 42.0% 41.3% 58.7% 58.0%
ORIGIN X DESTINATION X Destinations 9,368 5,966 4,571 4,503 2,280 1,080 1,044 912 302 A B C D E F G H I Origins 9,162 5,941 4,353 4,227 2,093 914 841 289 980 A B C D E F G H I Origins 4 000 3 000 2 000 1 000 0 0-5 5-9 9-13 13-16 16-20 20-24 4 000 Destinations Time slots 3 000 2 000 1 000 0 0-5 5-9 9-13 13-16 16-20 20-24 A B C D E F G H I A B C D E F G H I
Figure 13 - Breakdown of the journeys among Italian and foreign SIM cards

7.1.3 | CRITICAL ISSUES THAT EMERGED AND CRITICAL ISSUES THAT WERE OVERCOME

The primary goal in using mobile network Big Data for mobility analysis is to ensure the quantification of the fundamental elements of a transport survey or study: origin and destination, mode and purpose of the travel, daily hourly distribution, seasonal distribution. Compared to conventional surveys, such as telephone or web-based interviews, in-person surveys, physical counts, and so on, the use of Big Data generates sample sizes that are a several orders of magnitude greater, which would suggest a clear advantage. However, it is necessary to address certain limitations relating to the interpretation of the raw data, due to a process that does not allow for the analysis of individual cases, as can be done

In order to remedy this problem, the weighted average (based on the dwell time) of the distances of the cells visited was calculated; if this average was less than 800 metres for more than one consecutive hour, the user was considered to be stationary; otherwise they were considered to be travelling. For stationary users, the “prevailing cell” is also determined, or rather the cell to which the user is connected for the majority of the time, and within which he or she is assumed to be locat-

with small scale surveys, but must necessarily be standardised according to a general algorithm in order to handle the sample sizes.

The first “calibration” element in the transition from raw data to information that has been suitably processed for transport use lies with the definition of the term journey itself. Journeys of less than 800 metres had to be overlooked in order to eliminate certain problems associated with technical signal generation elements, such as the phenomena of “jumping” between cells on the mobile network: in fact, a stationary user can alternate between connections to different cells overlapping in the area where he or she is located.

ed. This type of issue is particularly significant in urban areas, where information regarding small journeys could be lost. The second issue that emerged was that of determining the mode of transport used for the journey. Two areas can be distinguished: urban and non-urban. In the case of the former, no methodology has yet been established to distinguish exactly which means of transport are utilised, since in urban areas different means of transport can not only share similar

92 METHODOLOGICAL ASPECTS FOR PASSENGER MOBILITY ANALYSIS USING BIG DATA
Figure 14 - Determination of mobility radius

routes, but also similar travel speeds due to traffic congestion; for example, journeys by city bus can be confused with journeys by bicycle, and vice versa. In the non-urban context for the case in question, an algorithm for determining the mode of transport was developed through collaboration between analysts and the end users of the mobile network data. The modes identified in the specific study are the following:

• aeroplane;

• train;

• other.

The “aeroplane” mode is assigned to all passengers who carry out an origin/destination journey, departing from an airport after having been detected within the origin area, but before reaching the destination, as well as those who arrive at an airport after having departed and before reaching the destination. In order to determine departures and arrivals, the “teleportation” methodology is utilised (i.e. it is determined whether the user is registered in one of the cells associated with the departure airport and, after a suitable time, is registered in one of the cells associated with the arrival airport, without ever having been detected by the mobile network between these two events).

The “ train” mode is assigned to all passengers who carry out an origin/destination journey and who made a journey by train that began after leaving the origin and before

reaching the destination. Train journeys are identified by analysing users who start and end their journeys at a monitored railway station. The attribution of train mode takes place in steps:

1. The first step of the methodology involves associating a set of reference radio base stations with each of the monitored railway stations. This makes it possible to identify the users who connect to the cells associated with the area of the railway station.

2. The second step involves identifying a series of points called “railway gates”, which correspond to points along the rail network whose mobile network coverage does not reach the main roadways (motorways and main highways). The purpose of identifying these points is to avoid creating discontinuities in the mobile network routes of users travelling long distances. In fact, this behaviour could be caused by a lack of “real” stations along the route. In this manner, it is possible to guarantee the “continuity” of the user’s journey, thus likening the “railway gates” to intermediate stations, but without creating ambiguity between users travelling along the rail network and those travelling by road. The following image shows a series of real railway stations (blue) and the railway gates (red) identified along the rail network.

EXTRACTION OF INFORMATION 93

3. Once the “railway gates” have been identified, the next step is to identify the stations where the journey begins and

ends, as well as all the intermediate stations reached by the user.

94 METHODOLOGICAL ASPECTS FOR PASSENGER MOBILITY ANALYSIS USING BIG DATA
Figure 15 – Identification of the “railway gates” used to identify journeys made by train
Start station End station 1 2 3 4 5 6
Figure 16 - Representation of train mode identification scheme

A train journey is defined as such when the first station (that from which the journey begins) and the last station (that at which the journey ends) at which the user is detected are different, and the user passes through a minimum number of real stations or intermediate gates. The minimum number of intermediate transit points passed through by the user during the journey is determined based on the distance in kilometres between the station of origin and the station of destination.

Once this initial classification of the train passengers has been made, three additional filters are applied in order to further refine their classification:

1. The first level of additional filtering consists of identifying the “road gates”, or rather the points at which trains do

not transit. The ideal train user is not seen passing through any “road gates.”

2. The second level of refinement involves the use of a data-driven methodology for the final validation of the routes. In order to validate the sequence of stations, a graph of the entire national rail network was constructed and compared with possible “theoretical” pathways between two stations.

3. Finally, the last level of refinement for the identification of “train passengers”, which is also data-driven, involves identifying a set of valid intermediate stations for each origin/destination pairing. The ideal train user is seen passing through all the intermediate control stations.

EXTRACTION OF INFORMATION 95
Figure 17 - Rail network buffer location

By combining the information from the filters described above within a statistical model, the subset of users likely to have made a journey by train is obtained.

In addition, in order for the “train” mode to be associated with a journey, the travel distance by train (from the departure station to the arrival station) must constitute at least half of the user’s travel distance between the origin and destination areas. If a user has made a multi-modal journey by both aeroplane and train, the mode of travel will still only be considered “aeroplane”.

Finally, all journeys between an area of origin and a destination that do not meet the conditions to be classified as either “aeroplane” or “train” are classified as “other.”

The determination of the algorithm for identifying the mode of travel described above is actually only the first step in a process with considerable prospects for improvement. One initial refinement of the methodology described above could result from the supplementation of the public transport vehicles’ scheduled timetables, thanks also to their availability in GTFS format, so that recorded routes can be associated with the services on the timetable, although this immediately opens up the question as to whether the scheduled route or the actual route covered is more representative. One ongoing update of the modal algorithm for take air travel scheduling into account is precisely geared towards Data Fusion, in order to correctly associate users that gravitate towards airport areas with passengers.

The other issue that emerged during the application of the method described above, and which is still being resolved, is that of the presence of air travel between adjacent provinces, or rather mode attribution errors likely due to the airport cell covering other destinations, or the behaviour of airport personnel.

It is also important to note that sea journeys have never been taken into account in the analyses conducted to date, because they are not currently of interest to the study in

progress; the modal identification algorithm should therefore be supplemented with a specific process for identifying these modal users. Another critical issue is related to the anonymisation of mobile network data; when the number of users who carry out a certain type of journey does not reach a pre-established minimum value, they are “masked” to prevent their identities from being traced, in order to ensure confidentiality. This clearly has repercussions on the determination of the real set of O/D pairings where non-null journeys are recorded, and on the modes of transport. When expanding the sample to represent the population, the study showed that the same rules that generally apply do not apply to certain Origin/Destination relationships. In particular, for the quantification of train journeys involving certain O/D pairings (e.g. Rome-Milan), when the standard proportion of business SIMs to ordinary SIMs was used, and the results obtained were compared to the rail ticketing data, major discrepancies emerged, presumably linked to the nature of the O/D relationship itself, which has a different composition of users compared to the average, with a greater number of work/ business-related journeys than journeys for other reasons. Another aspect related to the expansion and representativeness of the sample is the inclusion of SIM cards attributable to drivers of medium/long-distance transport services, especially of drivers of freight transport vehicles. These journeys are mistakenly ascribed to the world of standard users, but are in fact attributable to travel of a logistical nature. A methodological investigation is underway to determine whether there is a possibility of filtering these signals. The question of the purpose of the journey remains to be explored. It is known from the literature17 that, in addition to the classification of journeys as recurring and non-recurring, the travel purposes that are able to be most reliably identified from mobile network Big Data are those of home/work, home/school and homebound journeys. Some proposals

96
USING BIG DATA
METHODOLOGICAL ASPECTS FOR PASSENGER MOBILITY ANALYSIS

target the joint use of other data sources, such as satellite images of land use and the locations of Points of Interest; however, even these cases are limited by the considerable intermingling of functions and services in the urban environment.

Other insights, which can be used to obtain a more detailed characterisation of the purpose of the journey, are those associated with the use of Big Data derived from Weblogs and Picocells: the first type uses the list (log)

7.2 | CONCLUSIONS

The table below summarises the experience described above, in which the opportunities and limitations identified in the study conducted using mobile network Big Data are linked;

of websites recently visited by the user to obtain a more detailed characterisation of the activities he or she performs; Picocells, on the other hand, are mobile network cells that are smaller than standard ones, generally placed in places with high concentrations of people, such as shopping centres, whose signals make it possible to identify the places frequented with greater accuracy, and to thus correlate them to the activities likely performed by the user.

the opportunities and limitations are structured according to the basic requirements of the mobility analysis.

EXTRACTION OF INFORMATION 97
17. Luis Willumsen, “Use of Big Data in Transport Modelling-Discussion paper” – International Transport Forum, 2021

TRANSPORT REQUIREMENT OPPORTUNITY

SPATIAL DISTRIBUTION OF THE O/D JOURNEYS

The origin and destination of the journey are able to be determined with extremely precision using the georeferences obtained from app data.

TEMPORAL DISTRIBUTION/ FREQUENCY OF THE JOURNEY

REASON FOR THE JOURNEY

MODE OF TRAVEL

The volume of the data and their availability for extended periods of time allow the monthly, weekly, and hourly characteristics of the journeys to be determined.

Short, urban journeys.

EXPANSION OF THE DATA TO REPRESENT THE POPULATION

Through the implementation of a specific mode attribution algorithm, the following three modes are able to be identified in the non-urban environment: aeroplane, train, and other. Possible implementation of the algorithm with Ship mode, which was not utilised in the study being described.

Urban travel

The sample size in space and time allows for the sampling error to be considered irrelevant. Telephone service providers can also rely on information from SIM-linked contracts and information obtained through direct contact with the user via business interfaces.

Non-urban travel

Table 7 - Summary of the potential and limitations of mobile network Big Data with respect to the study described in the chapter

98
METHODOLOGICAL ASPECTS FOR PASSENGER MOBILITY ANALYSIS USING BIG DATA
SCOPE OF THE LIMIT

Not all devices and users allow for georeferencing from apps.

Privacy protection issue.

The position data associated with mobile network cells is subject to a phenomenon whereby a stationary user appears to be travelling because he or she connects to different cells covering the same area (cell jumps).

Weighted average of the distances of the mobile network cells visited during the reference period

This specific type of analysis has not yet been addressed in the case study. The problem of attributing the particular reason for a non-systematic journey is well known in the literature.

It is difficult to deduce the mode of travel because of the possible overlaps of the various modes in terms of both the speed and the physical location where the journey takes place.

It is not possible to distinguish between cars and mass public transport. There are dubious attributions with respect to the aeroplane mode.

For some users it is not possible to deduce the mode of travel due to privacy protection rules.

It is not possible to distinguish between private and “business” users, such as drivers, commercial vehicles, and public transport vehicles.

Some O/D pairings have particular characteristics (high business presence), for which a different expansion must be carried out to represent the population.

The final matrices will be matrices of passengers net of subsequent transformations carried out by means of private vehicle occupation coefficients.

Data fusion with land use and other types of Big Data, such as POIs

Data fusion con GTFS

Data fusion/Comparison with other data sources, in this case rail ticketing

EXTRACTION OF INFORMATION 99
SOLUTION/
LIMIT
POSSIBLE SOLUTION

As shown in Table 7, the mobile network Big Data under examination can potentially be a valuable resource for mobility analyses; at least to date, however, the data are not ready-to-use, and require the development of a know-how that requires close interaction between the analysis companies downstream

of the telephone service provider and the transport technicians and statisticians in order to determine the quantities, the extraction methods, and any critical issues present, thus obtaining data useful for transport analyses and statistics.

100
METHODOLOGICAL ASPECTS FOR PASSENGER MOBILITY ANALYSIS USING BIG DATA

8 | ANALYSIS AND MODELLING

Tartaglia Mario1[0000-0003-3216-8150], Lorenzo Vannacci1[0000-0001-9587-7611] and Martina Farsi1[0000-0002-3132-8071]

1. FS Research Centre, Florence, Italy

8.1 | FORMATS AND TOOLS FOR STORING, MANAGING, AND ANALYSING BIG DATA

8.1.1 | TOOLS FOR BIG DATA STORAGE AND MANAGEMENT

This section briefly outlines the tools available for the use of Big Data, mainly focusing upon open-source products due to their easy availability, affordability, and greater interoperability (Antoniou et al., 2019)[8.1] .

The raw data can come in very different formats; they can be structured and organised according to the classical schema of tables delineated in a closed manner by rows and columns, and suitable for use in “traditional” databases, semi-structured in formats like Json, GeoJson, HTML and XML, and, finally, unstructured in formats such as photos, videos, or images.

The storage, interpretation, and analysis of the contents of the various formats can be performed using tools such as scripting languages and analysis software, which allow for the useful information to be extracted, transformed into the desired format suitable for analysis, and imported into the storage database.

Python, a scripting and object-oriented programming language, is one of the opensource tools that enables the operations described above; it allows for data extraction, database import, and statistical analysis thanks to the use of specific libraries. It is also used in Machine Learning and web application development processes.

R is another open source tool that can be used for data analysis; compared to Python, this language is more oriented towards statistical analysis and the graphical rendering of data, and is used extensively for data mining.

Python, on the other hand, is more versatile and more suitable for programming tasks in general.

Finally, the commercial software Matlab consists of a programming and numerical calculation platform for algorithm development, data analysis, and modelling. Often likened to R, being a commercial software it does, however, offer certain advantages, such as detailed documentation and more robust development packages, which are nevertheless reflected in the cost of purchasing the software. As far as programming is concerned, Python is considered more flexible than Matlab [8.1]. Finally, with regard to the aspect of data storage, organisation, and interaction, it is necessary to have a database management system, and to establish the type of data representation to be performed by the database (Data model). The most common type of database is the relational database, RDBMS (Relational Database Management System), with which the user can interact using an SQL language. There are several Database management software products of this type: the open source versions include PostgreSQL, a version of MySQL which, when combined with PostGIS, allows for the management of spatial data, as does SQLite together with SpatiaLite, while the commercial versions include Microsoft SQL Server and Microsoft Access.

Other philosophies include NoSQL databases, also referred to as “Not only SQL,” and non-relational databases, which store data in a different way with respect to relational

ANALYSIS AND MODELLING 101

tables. Although they also arose in the 1960s and 70s, like RDBMSs, they were mostly developed in the early 2000s in conjunction with the advent of Big Data and real-time web applications, and the advancements in data storage capacity. With NoSQL databases, it is no longer necessary to establish a specific structure for the data to be stored, and they lend themselves well to changes in the data over time; this makes them more flexible and faster to query than RDBMSs. They also allow for horizontal scaling (scaling out): instead of increasing the power of the machine to handle increasingly large amounts of data (scaling up), the data is distributed over several machines. However, there a potential for loss of data consistency, in the sense that the result of a query on the dataset may not reflect the most recent changes that have occurred in the data, and there is no specific language developed for interacting with the database, like SQL, and it can therefore be more difficult to execute more complex queries and joins (if possible). In addition, the characteristics of the transactions indicated by the acro -

nym ACID (atomicity, consistency, isolation, durability), typically associated with relational databases, are lacking. NoSQL databases, on the other hand, follow a principle known as BASE: Basic Availability, Soft State, and Eventual consistency. The BASE principle is derived from the CAP theorem, which states that it is impossible for a distributed computer system to simultaneously guarantee Consistency (all nodes see the same data at the same time), Availability (the guarantee that every request receives a response as to what has succeeded or failed), and Partition tolerance (the system continues to function despite arbitrary loss of messages). The main types of NoSQL databases used are document databases (MongoDB, COuch DB), key-value databases (Membase, Redis, Amazon Dynamo), wide column archives (Cassandra, Hbase), and graph databases (Neo4J, Infogrid). The use of NoSQL databases is now widespread; social networks, Google Earth, Maps, eBay, Amazon and many other applications are based on this type of technology.

8.2 | BIG DATA ANALYSIS AND USE FOR FORECASTING PHENOMENA OF INTEREST

Having established the general types of tools available for handling these large amounts of data, the descriptions of the techniques for extracting the information of interest (Data mining) are provided below. Since the traditional techniques can be ineffective or time-consuming in analysing large and heterogeneous amounts of data, IT tools and innovative techniques are used to search for structures that are repeated in the available data (Descriptive or Interpretative Data Mining) and/or to predict events or probabilities of occurrence (Predictive Data Mining). Data Mining is part of the Big Data processing process, which consists of several steps: starting with the identification of the objective to be achieved through the use of the select-

ed data, followed by the pre-selection of the data based on the identified objective, and finally the cleansing of the data itself. The processing applied to the data depends on its type and size, as well as the purpose of the analysis [8.7]: in fact, the tools adopted will be different depending on whether the data will serve as input for an interactive system, as in the case of smart cities, or will be used for statistical purposes or market analyses.

In addition to the general classification based on purpose (descriptive and/or predictive), the Data Mining techniques are also broken down based on the following main categories, which in turn comprise various methods and algorithms [8.7]:

102 METHODOLOGICAL ASPECTS FOR PASSENGER MOBILITY ANALYSIS USING BIG DATA

• Classification - this is a supervised Machine Learning approach that uses an initial set of objects as “training” data. This initial set of objects is used to create a model that explains the relationship between a target attribute (based on which the classes are defined) and the other attributes of the objects within the training set. Once tested, the resulting model is used to assign the objects to the predefined classes. The following methods are categorised as such: Bayesian network, Support Vector Machine (SVM), and k-nearest neighbour (KNN).

• Clustering – this is based on unsupervised Machine Learning: the groups are created starting with the distinctive and significant characteristics of the analysed data, based on which a “proximity” function can be defined, which allows the objects to be assigned to one group rather than another. This group includes the partitioning, hierarchical clustering, and Co-occurrence methodologies.

• Association rule mining - this class includes methods that specialise in identifying and creating rules based on the frequency of occurrence of numerical and non-numerical data. This type of data mining is mainly used for market analysis and business strategies.

• Prediction categories - this group includes methods that use time series to

define trends and data behaviour. In this context, SVMs and fuzzy logic algorithms are used to identify the relationships between dependent and independent variables and to derive regression curves for predictions.

• Regression - generally used with supervised learning algorithms. As opposed to the results of the classification and clustering approaches, these techniques result in an output characterised by continuity. In addition to the classical regression techniques (simple and multiple), in the field of Machine Learning there are other types as well, such as logistic and Bayesian regression.

Data Mining is also classified based on its field of specialisation; for instance, the branch focused on the discovery and monitoring of business processes is known as Process Mining, that aimed at extracting parts of text to search for useful information on the Web, and within books, reviews, and articles is known as text mining, and the techniques adopted to determine trends based on which business or marketing decisions can be made are known as Predictive Mining.

The close link between the analysis and use of Big Data and the discipline of Machine Learning is therefore evident, and the Machine Learning methods most frequently used in the field of mobility studies are summarised below.

ANALYSIS AND MODELLING 103

8.2.1 |

MACHINE LEARNING AND THE METHODS MOST FREQUENTLY UTILISED WITHIN THE CONTEXT OF BIG DATA USE FOR MOBILITY REPRESENTATION

Machine Learning involves a combination of statistical sciences, optimisation, and computer sciences [8.1]. It is based on the “historical” need to search for a relationship that links two sets of data, and can allow for predictions to be made about one set using elements from the other. As opposed to the classic search for functional form and the respective coefficients that minimise the error between the estimated and measured value, Machine Learning uses complex systems, in which the independent variables themselves are functions whose values are to be estimated, and are sometimes interconnected, while the functional forms used in the algorithm remain unknown to the user.

The two main macro-sets into which the modelling is organised are supervised and unsupervised Machine Learning. In the first case, a number of known relationships are available (e.g. dependent variable/independent variable), so the model carried out by the Machine Learning can be evaluated, and feedback quantifying the quality of the investigated phenomenon’s reproduction can be returned to the system. In the case of unsupervised Machine Learning, on the other hand, the target variable is not present; in this case, the analysis focuses on identifying common structures within the analysed data and any “similarity” groups.

The first example of Machine Learning dates back to the 1950s [1]; the discipline subsequently underwent alternating phases of development, finally becoming established with the rise of neural networks in 2010. The advent of Big Data thus definitively confirmed the need for advanced data management, visualisation and analysis techniques, which was able to be met by the continuously-evolving Machine Learning techniques. The four main areas of Machine Learning development

in the 2000s are listed below:

1. Rule-based systems. This group of methods involves predefined rules, decision trees, and logic programming, and therefore represent the most interpretable of the various Machine Learning techniques.

2. Kernel-based algorithms. These are based on the concept of proximity: k similar situations are sought in order to solve the problem. The basic issues are the similarity criterion of the situations and the k-number. These methods are also referred to as non-parametric, because the user is not required to define any functional form. The weakness of these types of models is linked to the significant computational cost associated with the matrix inversion required for their application. This is why DNNs have been preferred in recent years, as they allow for training data to be added without necessarily having to reuse the entire dataset.

3. DNNs (Deep Neural Networks). The term “Deep” refers to the fact that they have numerous “overlapping” layers. In fact, DNNs represent an evolution of the initial neural networks, where there was only one layer, and all the neurons were connected to the entire network. A considerable amount of training data is needed in this case as well in order to “harmonize” the numerous layers of neurons. However, the main limitation is related to the poor interpretability of the system’s output parameters; they also lack a theoretical basis, as the applied approach is mainly empirical.

4. Bayesian statistics. Bayesian probability theory makes it possible to predict a variable’s distribution given a set of

104 METHODOLOGICAL ASPECTS FOR PASSENGER MOBILITY ANALYSIS USING BIG DATA

observations. This type of approach requires the structure of the model to be defined either by the operator him/herself, or else automatically (e.g. through Bayesian Network structure learning).

The main benefit of this approach lies in the fact that it combines a formulation based on a known domain, and defined through known functions, with data-driven techniques, thus overcoming the problem of the neural networks’ “opacity.” This type of approach has undergone considerable development since 2010, with the advent of Probabilistic Graphical Models (PGMs).

As far as the field of transport is concerned, the analysis conducted by Kaffash, Nguyen and Zhu (2021) [8.9], aimed at collecting, cataloguing and summarising all the literature relating to Intelligent Transport Systems (ITS), and the use of Big Data and Machine Learning for transport purposes, shows that the most common Machine Learning techniques for analysing and using Big Data for transport studies are neural networks and deep learning. The study shows that the boundaries between the various techniques are becoming increasingly blurred, and there is a tendency to combine the various algorithms. Another major finding is the limitation of the field of use of the data and tools identified above almost exclusively to the forecasting of road traffic flows, their speed, and travel times, and

the assessment of congestion and accidents; 85% of the articles analysed concerned applications in the field of the aforementioned forecasts. The articles highlighted in the bibliographic research cited above also show that these are very often short-term traffic flow forecasts (5-15 minutes), which are therefore useful within the context of computerisation and/or smart city management, in which sensor data are processed and used to instantaneously respond to vehicle flow management, by optimising traffic light cycles or suggesting alternative routes to users. The other fields of application in the Intelligent Transportation System (ITS) sector identified by the article are those related to Recognition, Detection, Safety, and Optimisation. The term “Recognition” refers to the activity of identifying various objects, such as number plates, vehicles, driver behaviour. The term “Detection,” on the other hand, means the possibility of automating the detection of accidents, the recognition of road signs, and the identification of user behaviour that could lead to accidents or congestion problems. The other field of application is “Safety,” in terms of both vehicle and road safety; Big Data are used to obtain information on the accident occurrence scenario, and consequently to calibrate the accident models. Finally, other applications are those related to “optimisation,” in the sense of finding the “optimal” routes, speeds, energy consumption values, and waiting times.

8.2.2 | VISUALISATION OF BIG DATA

The visualisation of the data is an indispensable step in their interpretation, both during the preparation phase, to identify any outliers to be eliminated or groups of related units, as well as during the post-processing phases, to evaluate the results.

The visualisation of Big Data raises two major issues: the first, which also arises with traditional data sets, concerns the need to obtain a good representation, which provides all the

elements useful for understanding the image (legend, labels, identification of the measurements represented, readability of the graph); the second concerns the characteristics of the new data in question, since a single record deals with an enormous amount of information. The multidimensional nature of the new data, which makes classical visualisation techniques, such as histograms and simple two-dimensional scatter diagrams, inappli-

ANALYSIS AND MODELLING 105

cable, requires the use of new and continuously evolving techniques, such as Machine Learning.

In “Mobility patterns, Big Data and Transport analytics” (Antoniou et al., 2019) [8.1], the chapter entitled “Data Science and Data Visualization” identifies two main groups of visualisation techniques. The first group includes methods that allow for the simultaneous visualisation of multiple dimensions, grouped two by two, as in the case of the Scatterplot matrix, or else using multiple dimensional axes, as in the case of Parallel Coordinates

visualisation, in which different vertical axes correspond to different dimensions.

This first group also includes so-called “heat maps,” in which the third dimension is represented by colour, “pixel-oriented” visualisations, in which the pixel unit is exploited to represent as many dimensions as possible with respect to a given record, and “gapminder” visualisations, or rather two-dimensional representations in which dimensions beyond those of the Cartesian axes are inserted using the colours, dimensions and shapes of the point representing the record.

106
ANALYSIS USING BIG DATA
METHODOLOGICAL ASPECTS FOR PASSENGER MOBILITY
Figure 18 - Example of a Heatmap (created with Seaborn-Python [8.11]), representing the number of daily long-distance connections between the main Italian routes.
ANALYSIS AND MODELLING 107
Figure 19 - Example of a scatterplot matrix (created with Seaborn-Python [8.11]), using 2008 and 2019 long-distance OD data. Figure 20- Example of parallel coordinates for the visualisation of the 2008 (blue) and 2019 (yellow) travel characteristics for long-distance OD pairings (created with Plotly-Python).

The second group of visualisation techniques, on the other hand, are dimensionality reduction methods, which are further broken down into methods using linear combination relationships between variables, and methods using non-linear combination techniques, in order to arrive at a reduced set of analyses with respect to the original set [8.12]. The methods of greatest interest in this group are principal

component analysis (PCA), multidimensional scaling (MDS), isometric feature mapping (ISOMAP), Locally Linear Embedding (LLE) and its variants, such as Hessian LLE, t-distributed stochastic neighbour embedding (t-SNE), Kernel PCA, Local Tangent Space Alignment (LTSA), and autoencoder techniques, which are based on neural networks [8.1],[8.12].

108 METHODOLOGICAL
FOR PASSENGER MOBILITY ANALYSIS USING BIG DATA
ASPECTS
Figure 21- A pixel-plot of the traffic data on the A13 in Rotterdam. The colours indicate the average speed of the traffic flow, the rectangle sizes indicate the flow’s value, and the circles identify high speed values (>150 km/h) - Source Pixel-based visualisation of traffic data, by Erik Boertjes, 2017 [8.10].

8.3 | USE AND FUTURE PROSPECTS OF BIG DATA AND MACHINE LEARNING IN THE FIELD OF TRANSPORT

As highlighted by Kaffash, Nguyen and Zhu (2021) [8.9], most of the applications involving the use Big Data in the field of transport that have been tried out thus far have dealt with the prediction of vehicular flows and travel times. However, the use of Big Data in combination with Machine Learning techniques presents numerous opportunities, ranging from the optimisation of flows in terms of routes, speeds, fuel consumption, and waiting times, to road safety, with the identification of potentially hazardous situations thanks to the recognition of network disruptions or elements that can lead to increased traffic hazards, such as particular weather conditions, or the presence of vehicles of non-standard sizes. In the field of transport modelling, the research described in the article entitled “A deep gravity model for mobility flows generation,” by Simini, Barlacchi, Luca, and Pappalardo (2021) [8.13], is of considerable interest, as it illustrates how Big Data and Machine Learning are used to create a distribution model for various areas in England, Italy, and New York state.

Starting with the traditional form of the distribution model based on the gravity law, the distribution problem is assumed to be a classification problem, in which each recorded flow must be attributed to the correct class, corresponding to the destination, and the distribution model is therefore approached as a classifier with two explanatory variables: population and distance. Based on these considerations regarding the actual state of the distribution model, a deep neural network is implemented, with hidden layers. A portion of the available observations are used to train the system, while the remainder are used to evaluate the model’s performance. In addition to the known flows and geographical distances, the network’s inputs also include the origin and destination characteristics available from

OpenStreetMap, such as land use, transport infrastructures, health and education services, and food service facilities. The network’s output consists of a score for each O/D pairing: the higher the score, the greater the likelihood of a flow on that route. Two aspects deemed to be important in the method’s application are the transferability of the results, with the aim of being able to use the model in contexts not foreseen in the training set, and the evaluation of the characteristics that have an impact on the results obtained. With regard to the first element, the use of the available data has been specifically designed to be able to evaluate the model’s response in “unknown” environments, with good final results. The second element is of a structural nature with respect to the use of Machine Learning within the context of transport applications; the lack of knowledge of the rules that determine the deep neural network’s response poses a significant limit to the use of these new techniques, as it hinders the interpretation of the results and the estimation of the model’s reliability. In this study, on the other hand, the influence that the variables entered into the model have on the results is assessed using tools which, in turn, are based on game theory, so that the identification of the trends as the elements change allows for a critical assessment of what has been obtained, as well as considerations regarding the system’s transferability to other contexts.

Another interesting prospect in the field of transport modelling, which has arisen thanks to Big Data and expanded computational and data storage capacities, regards activity-based models; these types of models are based on the principle that transport demand is “generated” by people during the course of their daily activities. There is therefore a shift away from the typical trip-based modelling, which is centred on the journeys made by indi-

ANALYSIS AND MODELLING 109

viduals, to the modelling of the sequences of activities performed by individuals, and therefore the journeys required to perform them. Although the origins of activity-based models date back to the 1970s, they have only been used to a small extent with respect to tripbased models; one of the main limitations is precisely the large amount of data used for calibration, as it is necessary to reconstruct the chain of the individuals’ activities of over the course of the day, a sequence which will then determine the transport choices. Big Data therefore seem to be capable of meeting this need, and this concept is addressed by the study entitled “Mobile phone records to feed activity-based models: MATSim for studying a cordon toll policy in Barcelona” [8.14]. In this study, the transport demand is generated by individuals (“agents”) performing daily activities, each of whom seeks to maximise the utility of their planned daily activities, while at the same time minimising their total travel time.

8.4 | CONCLUDING REMARKS

As described in the preceding sections, the rapid development of computational methods and the widespread availability of “secondary” data, or rather data that exists regardless of the scientific question to be answered (as opposed to primary data from traditional surveys), can also influence the approach applied in the analysis of the data, and namely in the creation of the relevant models. The classic approach starts with the data, established rules, and then creates a model that simulates the phenomena and yields results. It can therefore also be used to predict outcomes for situations that have not yet taken place, if the data characterising the future event are known, as they can be used as inputs for the model.

The alternative the Data Driven approach, in which the process that takes place is the reverse of the classical approach: artificial

As an initial input, the model requires a transport demand consisting of a population of “agents”, and the planning of their activities. The logs of the individual users’ daily activities are reconstructed using “Call Detail Records” (CDRs), which are recorded when the user makes a phone call, sends a message, or connects to data services. The results of this model’s calibration and validation offer good hope for the combination of Agent-Based models with Big Data, in particular from mobile networks; the possible advantages of an Activity-Based model include the various levels at which the analysis can be carried out (aggregated or broken down), and the possibility of investigating how certain management policies impact the mobility habits of the individual users based on the types of activities generally carried out within a typical day, as in the case of the above-mentioned study evaluating the effects of a Congestion Charge.

intelligence of any kind is instructed as to what the data are and the results that are derived from them. The model learns, and subsequently creates the rules, which may not be known to the analyst. The rules are then used with other input data, different from the “training” data, and the results are produced through the application of the same model. With the classic approach, the data are mainly obtained from traditional surveys, while with the second approach Big Data are mainly utilised, precisely due to the need for large datasets to train the model. The main problem raised by the second approach is the lack of knowledge of the rules applied to the phenomenon: while this can be an acceptable element in the description of the reality of the situation, the same cannot be said for the model’s use in the field of forecasting. The classic transport models are often specifically

110 METHODOLOGICAL ASPECTS FOR PASSENGER MOBILITY ANALYSIS USING BIG DATA

used to predict the effects of management or infrastructural interventions that have not yet taken place, modelling user behaviour using the available data collected through targeted surveys, sometimes designed with the specific aim of investigating propensity for change, such as Stated Preference surveys. Big Data that provide a snapshot of the current state of

the situation regardless of the modelling needs do not allow for this kind of insight. However, they do offer the possibility of supplementing and supporting the traditional classic approach, while at the same time allowing artificial intelligence to be used for modelling purposes.

ANALYSIS AND MODELLING 111
Classic approach AI-based approach Survey Data Big Data Rules Model Results Data Results Model Data calibration Rules Model Results New data AI AI
Figure 22- The Classic approach and the Data Driven approach, the role of Big Data

[8.1] Constantinos Antoniou, Loukas Dimitriou, Francisco Pereira, 2019 “Mobility Patterns, Big Data and Transport Analytics. Tools and Applications for Modeling”. Elsevier [8.2]

https://www.mongodb.com/it-it/nosql-explained [8.3]

https://it.wikipedia.org/wiki/NoSQL [8.4]

https://www.rackone.it/blog/news/big-data-con-database-nosql-unintroduzione-pratica/ [8.5]

https://www.next04.it/limportanza-dei-database-nosql-per-lutilizzo-dei-big-data-nelmondo-connesso-dellinternet-of-things/

[8.6] Big Data, NoSQL e Machine Learning: un’applicazione di prediction e recommendation basata sulle API di Amazon

[8.7] Mohsen Marjani, Fariza Nasaruddin, Abdullah Gani, Ahmad Karim, Ibrahim Abaker Targio Hashem, Aisha Siddiqa,And Ibrar Yaqoob,2017 “Big IoT Data Analytics: Architecture, Opportunities, and Open Research Challenges”- IEEE Access

[8.8] https://www.bigdata4innovation.it/data-science/data-mining/data-mining-cose-percheconviene-utilizzarlo-e-quali-sono-le-attivita-tipiche/

[8.9] Sepideh Kaffash, An Truong Nguyen, Joe Zhu, 2021 “Big Data algorithms and applications in intelligent transportation system: A review and bibliometric analysis”. International Journal of Production Economics-Elvesier.

[8.10] Erik Boertjes, Pixel-based visualization of traffic data, https://social-glass.tudelft.nl/visualising-traffic-data/,2017

[8.11] Waskom M., 2021, “seaborn: statistical data visualization”, Journal of Open Source Software,6:60-3021, https://doi.org/10.21105/joss.03021

[8.12] F.S. Tsai, 2010. Comparative Study of Dimensionality Reduction Techniques for Data Visualization. Journal of Artificial Intelligence, 3: 119-134. https://scialert.net/abstract/?doi=jai.2010.119.134

[8.13] Filippo Simini, Gianni Barlacchi, Massimiliano Luca, Luca Pappalardo, 2021, “A Deep Gravity model for mobility flows generation”, Nature Communications

[8.14] Alex Bassolas, José J. Ramasco, Ricardo Herranz and Oliva G. Cantú-Ros,2018, “Mobile phone records to feed activity-based models: MATSim for studying a cordon toll policy in Barcelona” Transportation Research Part A: policy and Practice, volume 121 56-74 8.5

112 METHODOLOGICAL ASPECTS FOR PASSENGER MOBILITY ANALYSIS USING BIG DATA
| BIBLIOGRAPHY

9 | CONCLUSIONS AND RECOMMENDATIONS

The passenger mobility phenomenon requires a complex and well-structured qualitative and quantitative statistical representation. At the same time, the study of transport models requires increasingly detailed information in order to ensure a plausible representation of user behaviour.

The international and Italian regulations offer multiple inputs in this regard, requiring or regulating the production of various types of indicators with different breakdowns, which do not always overlap.

Traditional statistical surveys, which are also numerous and highly diverse in terms of objectives, are rather demanding in terms of resources to be deployed, and the relative statistical burden on the respondents is somewhat high.

At the same time, we are currently experiencing a phase of accelerated technological progress in every aspect of daily life, as a result of which various types of ‘signals’ are constantly being produced, which could be used to help represent various socio-economic phenomena, including mobility.

As reported in more than one reference in the literature, the data per se does not exist until a tool is created to measure and collect it. This applies to traditional surveys, where the tools are the sample, the questionnaire, the collection, encoding, and processing techniques, and so on, as well as to the ‘signals’ mentioned above, which originate from the technology, with objectives that are entirely independent of the representation of the phenomena. It is therefore necessary to develop tools and methodologies suitable for transforming the enormous number of signals (Big Data), and for subsequently processing them to produce statistical information.

The ambitious goal upon which the numerous research studies in this field should be focused is the identification of a number of possible ‘sources’ or signals to supplement the traditional surveys, implementing their ‘reuse’ for statistical purposes to reduce the pressure on the respondents, while at the same time exploiting their information potential, which also makes them suitable for the application of advanced processing techniques in the field of artificial intelligence.

As extensively illustrated, one of the most probed Big Data sources is the mobile network data. By their very nature, they are widespread and far-reaching in time and space, but are closely linked to the technological structure that generates them. The task of attempting to translate them into ‘data’, or rather information that can be used to represent phenomena like mobility, is therefore a very complex one, which is not without unresolved issues.

The research approach in the field of statistics over the past decade and at the international level involves the implementation of Trusted Smart Statistics models, whereby it is no longer the research institute that acquires the basic data that have just been ‘translated’ from the signals, and then processes them to produce indicators, but it is rather meta-information that is acquired, which has already been partially processed by the ‘owner’ of the signals (often a private entity). The aim is to overcome problems regarding resources, sustainability, and the protection of individual privacy. Furthermore, if shared algorithms are established, various actors will be able to receive standardised information assets from the managers/holders of the same.

In this regard, the first step is to determine the

CONCLUSIONS AND RECOMMENDATIONS 113

algorithms, for which it is necessary to initiate a dialogue between the signal owners and the researchers, through which a common ground can be found for the translation of the data into accessible information that represents the phenomenon of interest as closely as possible. The organisation of the work must involve pools of experts of various kinds (data analysts, transport engineers, statisticians, etc.), who can synergistically find solutions that will allow the new data sources to be used based on the research objectives.

In the case studies presented, a number of possible solutions to certain problems were identified, but many remain unresolved. These include the more precise identification of the means of transport utilised, which is currently only distinguishable as ‘aeroplane, train or other’, although this is a complex matter to resolve in the urban context; the determination of the purpose of the travel; the distinction between individual mobility and logistical and passenger transport services (activities of

9.1 | FUTURE PROSPECTS

A new scenario is currently unfolding for mobility analyses, and the possibilities of measuring this phenomenon through new data sources are increasing.

The experiences of this paper’s various authors naturally tend to suggest the use of Big Data within the context of a Data Integration strategy involving the use of other data sources that will allow for any still unresolved problems to be settled. In this paper, therefore, we wanted to describe how traditional data sources, such as questionnaire surveys and administrative sources, currently represent a small portion of the available, but nevertheless important, data. However, there remains a large amount of data held by the private sector (privately-held data), which can

drivers/transporters/taxi drivers, etc.).

Moreover, a set of necessary variables have been highlighted that are envisaged by the regulatory and procedural references, for which the use of mobile network data currently poses a number of more or less significant critical issues. In this sense it would therefore be necessary to carry out more in depth analyses, and work to find solutions, even through the use of multiple information sources.

In conclusion, the work presented here aims to provide an overview of the information needs, the sources of small and big data currently available, the methods of processing and utilising the various sources, and a number of major critical issues that have not yet been resolved by the research in the field. The numerous insights that have emerged could serve as good starting points for new case studies, with the aim of eventually achieving the systematic processing and use of the identified sources, in order to ensure an increasingly satisfactory representation of mobility.

complement and supplement these traditional sources. Together with statistical institutes, public institutions, and citizens, these private sector entities are beginning to actively take part in an ecosystem involving the exchange and management of data, as well as the interests and expectations that determine the behaviour and the relationships between them.

This development was recognised among the European statistical institutes as early as 2014, following the Scheveningen Memorandum18. Since then, the European Statistical System (ESS) has launched several projects, such as the Big Data Task Force of 2016 and 2018, aimed at developing methodological expertise on Big Data, some of the results of 18.

https//ec.europa.eu/eurostat/cros/content/scheveningen-memorandum_en.

114 METHODOLOGICAL ASPECTS FOR PASSENGER MOBILITY ANALYSIS USING BIG DATA

which have been reported in chapter 6. Similar initiatives have also been launched within the context of other projects at the UN level. All of the statistical institutes are currently invested in the establishment of Trusted Smart Statistics (TSS), which represent the latest frontier in the field of statistics. This new system of statistics aims to exploit Big Data sources with new processing methods, even using models like those provided by artificial intelligence (Smart Statistics), all while building an infrastructure of “Trusted” data and results. It’s a system that involves stakeholders from outside the statistical institutes (citizens, private companies, and public authorities), who share various tasks ranging from data processing, to checking results and algorithm code, and the sharing of the results, all while respecting the privacy of citizens and the legitimate business interests of the companies. Thus, a sharing of tasks in the process of producing statistical results, without sharing raw input data, but allowing all the actors to have an explicit insight into how the statistical products of interest were obtained19

The aim of TSS is to create a framework for the production of statistical outputs that makes it possible to track the quality of the various steps that lead from the raw data to the statistical output, even when the entire processing pipeline is not carried out by the statistical institutes, as is the case with other sources. This model can also be applied by other entities interested in obtaining outputs from this type of data.

To this end, in 2022 Eurostat launched a project, known as Multi-MNO (Mobile Network

Operator), aimed at establishing a consortium of private entities and statistical institutes to lay out a generalised process for the production of statistical outputs in the areas of demographics, mobility, and tourism using mobile network data. In particular, the aim of this project is to establish the data processing methodology and to create a framework for the exchange of data that are processed in part by the MNOs, and in part by the statistical institutes, while at the same time respecting the privacy and transparency of the processing algorithms, and tracking the quality of the statistical products. ISTAT was among the winning partners, and the project is scheduled to be completed by 2025.

In 2023, Eurostat launched an ESSNET project, in which ISTAT is also participating, in order to establish strategies for integrating Big Data with other sources, namely mobile network data, with a focus on determining the methods for performing population counts using these data.

All of these projects and funds are aimed at developing TSS solutions in that can be applied to the production processes. The optimisation of the efforts and the formal documentation of the needs of the various production sectors can only be achieved by sharing the experiences gained in various fields by university research and statistical institutes, public institutions, and private entities, as well as the results achieved.

Therefore, traditional surveys will not disappear in the future, but will rather serve the more functional purpose of supplementing data gathered from other sources.

19. https://cros-legacy.ec.europa.eu/system/files/sji190584.pdf

CONCLUSIONS AND RECOMMENDATIONS 115

10 | ACRONYMS AND DEFINITIONS

AADT = Annual Average Daily Traffic

ACI = Automobile Club of Italy

ACID = Atomicity, Consistency, Isolation, Durability

ADL = Multipurpose Survey of Aspects of Daily Life

AGCOM = The Italian Communications Authority (Autorità per le Garanzie nelle COMunicazioni)

AIS = Automatic Identification System

ANPR = The Italian Register of the Resident Population (Anagrafe Nazionale della Popolazione Residente)

API = Application Programming Interface

BASE = Basic Availability, Soft State, Eventual consistency

BD = Big Data

BES = Report on Equitable and Sustainable Well-being

BREAL = Big Data REference Architecture and Layers

CAP = Consistency, Availability, Partition tolerance

CAP = Italian Postal Code

CAPI = Computer Assisted Personal Interviewing

CATI = Computer-Assisted Telephone Interviewing

CAWI = Computer Assisted Web Interviewing

CDO = Chief Data Officer

CDR = Call Detail Records

CSD = Circuit Switch

DAS = Distributed Antenna System

Data Fusion = Integration of multiple data sources

DMI = Detected mobility indices

DPO = Data Protection Officer

EMSWe = European Maritime Single Window environment

ESS = European Statistical System

FCD = Floating Car Data

FUA = Functional Urban Area

GIAB = Generic Information Architecture for Big Data

GL = Guidelines

GPS = Global Positioning System

GTFS = Global Transit Feed Specification

HS = High Speed

HTWT = Home-to-Work Travel Plan

IOT = Internet of Things

IRS = Integrated Register System

ITS = Intelligent transportation system

LAC = Municipal Registry Lists

LLE = Locally Linear Embedding

LLS = Local Labour System

LPT = Local Public Transport

LTSA = Local Tangent Space Alignment

LTZ = Limited Traffic Zone

MaaS = Mobility as a Service

MDS = Multi-Dimensional Scaling

MIT = Ministry of Infrastructure and Transport

MM =Mobility Manager

MND = Mobile Network Data, also referred to as MPD

MPD = Mobile Phone Data, also referred to as MND

NITS = National Infrastructure and Transport Survey

NSI = National statistical institutes

NSIMS = National Sustainable Infrastructure and Mobility Survey

NSP = National Statistical Plan

NUTS = Common nomenclature of European territorial units for statistics

O/D -OD = Origin/Destination

OBU = On Board Unit

Pax-km = Passenger km

PCA = Principal Component Analysis

PET = Privacy-Enhancing Technologies

PHD = Privately-Held Data

Pkm = Passenger km

POI =Point of Interest

PS =Packet Switching

RDBMS = Relational Database Management System

REG/IC = Regional/Intercity

RMF = Reference Methodological Framework

118 METHODOLOGICAL ASPECTS FOR PASSENGER MOBILITY ANALYSIS USING BIG DATA

SDG = Sustainable Development Goals of the United Nations

Shared mobility = shared bikes/cars/scooters and other types of shared vehicles

SIM = microprocessor-based device for mobile telephony, which stores the unique number associated with the mobile phone user

SiQual = Survey Quality Information System

SISTAN = National Statistical System

Smart survey = A statistical survey carried out through commonly used IT devices, usually mobile phone APPs

SMC = Secure Multi-party Computation

SNAI = National Strategy for Interior Areas

SQL = Structured Query Language

SUMP = Sustainable Urban Mobility Plan

TEE = Trusted Execution Environment

TMPIS = Transport Monitoring and Planning Information System

t-SNE = t-distributed stochastic neighbour embedding

TSS = Trusted Smart Statistics

TUS = ISTAT Time Use Survey

UMP = Urban Mobility Plan

UTP = Urban Traffic Plan

Vkm = Vehicle km

WPI = Habitually resident population

119 ACRONYMS AD DEFINITIONS

This Technical Papers volume presents the analysis carried out for SISTAN purpose by FS, Istat and MIT. The analysis investigates the possibility of using Big Data, and in particular Mobile Network Data, to study people’s mobility. fsitaliane.it

FS Research Centre Il Centro Studi di Ferrovie dello Stato Italiane
Issuu converts static files into: digital portfolios, online yearbooks, online catalogs, digital photo albums and more. Sign up and create your flipbook.