Prepared for: Katrina Pierce, Development Manager Lincolnshire, FSB 29th November 2024 v1.0


Prepared for: Katrina Pierce, Development Manager Lincolnshire, FSB 29th November 2024 v1.0


• The Federation of Small Businesses (FSB ‘The Client’), as the appointed Employer Representative Body (ERB) led the development of the Greater Lincolnshire and Rutland Local Skills Improvement Plan (‘The LSIP’) in 1H 2023.
• The LSIP set out 40 actionable priorities to enhance and change post-16 technical education or training in the area, to more closely align with the skills needs of local employers and the local economy.
• The LSIP has now entered Phase 2, which runs from September 2023 to June 2025 and focuses upon taking forward and implementing the actionable priorities identified. Progressing the actions referenced in the LSIP is supported by a £3.5m allocation from the Local Skills Improvement Fund (LSIF), which is shared between 11 FE Colleges across the area.
• Habit5 - a research agency accredited as a Company Partner by the Market Research Society (MRS) – conducted primary market research to deliver insights that informed the development of the LSIP. The agency is now conducting primary and secondary research, to both inform and evaluate progress on the LSIP throughout Phase 2.

We understand that the research needs to achieve the following outputs:
• Deliver contextual data and evidence on the challenges, barriers and opportunities in play generally in the UK economy and specifically within Greater Lincolnshire & Rutland, that may influence progressing and implementing the actionable priorities identified in the LSIP.
• Across each of the eight major LSIP themes of: Work readiness and essential skills, Digitisation and smarter working, Construction, Engineering, Decarbonisation and Green Skills, Local Socio-Economic Conditions, Leadership & Management, Local Skills System – conduct research with relevant employers to establish their awareness, perceptions, consideration, future intent and impacts, regarding any ideas being developed or initiatives being implemented, that are designed to address one or more of the actionable priorities.

• Evidence and insights from particular demographic cohorts that comprise: Women & Girls, Ex-forces, Former offenders, Career changers and NEETs, that help inform solutions that enable more of them to fill occupational gaps in the key sectors of Construction, Engineering, Decarbonisation and L&D.
All of the above outputs should aid and support the writing and production of the annual report by FSB on: progress, engagement, collaboration and impact of the LSIP, which is due to be published in June 2025.
ONS estimates for 2021 indicate that there are 40,905 enterprises located in Greater Lincolnshire and Rutland.
The senior business decision makers in these enterprises with responsibility for employee recruitment, development and training, represent the population to be researched.
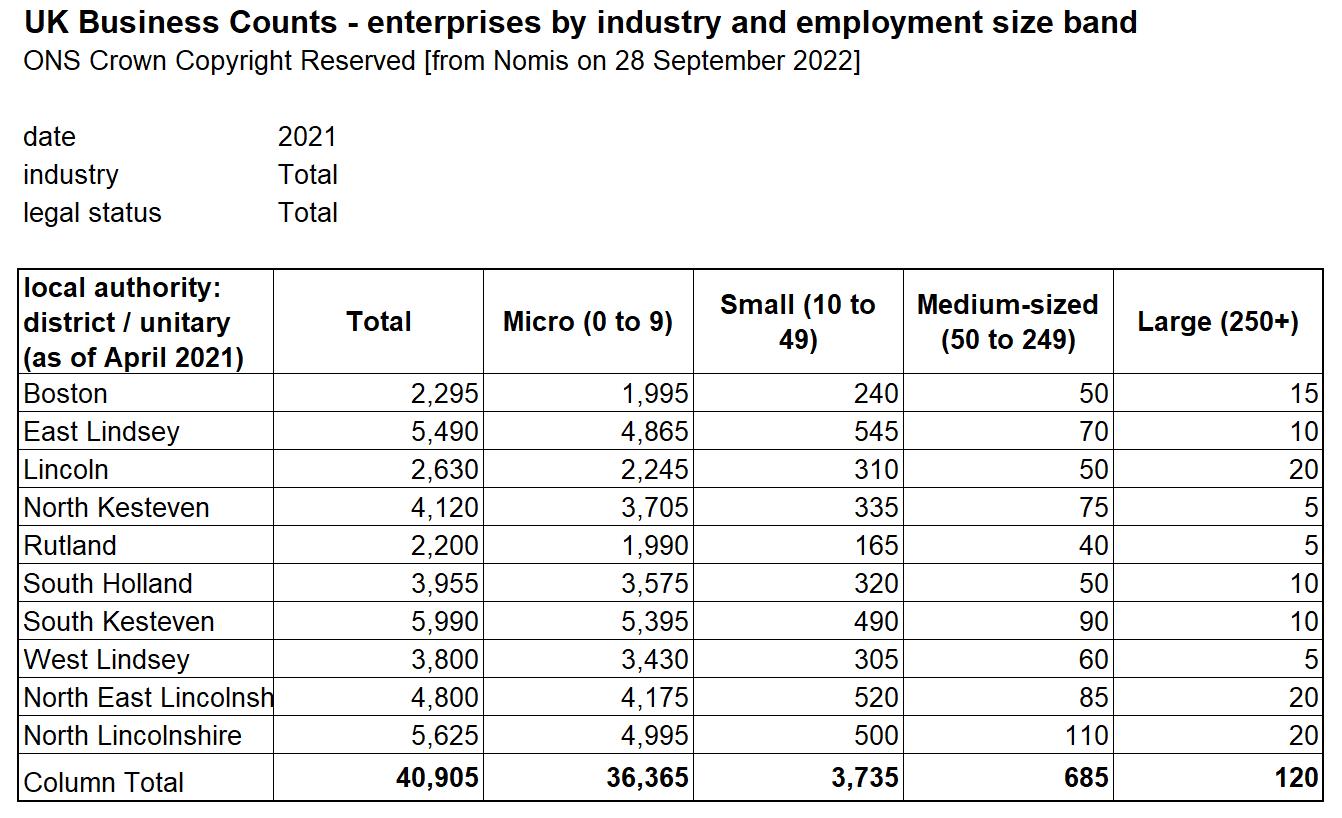
NB All figures are rounded to avoid disclosure. Values may be rounded down to zero and so all zeros are not necessarily true zeros.


The Online Survey featured FSB branding on the start and end pages.
A responsive design was used to build the survey.
38% of participants completed the survey using a desktop or laptop PC and 61% used their smartphone.


The bespoke Online Survey with Employers was conducted between 26th September – 4th November 2024.
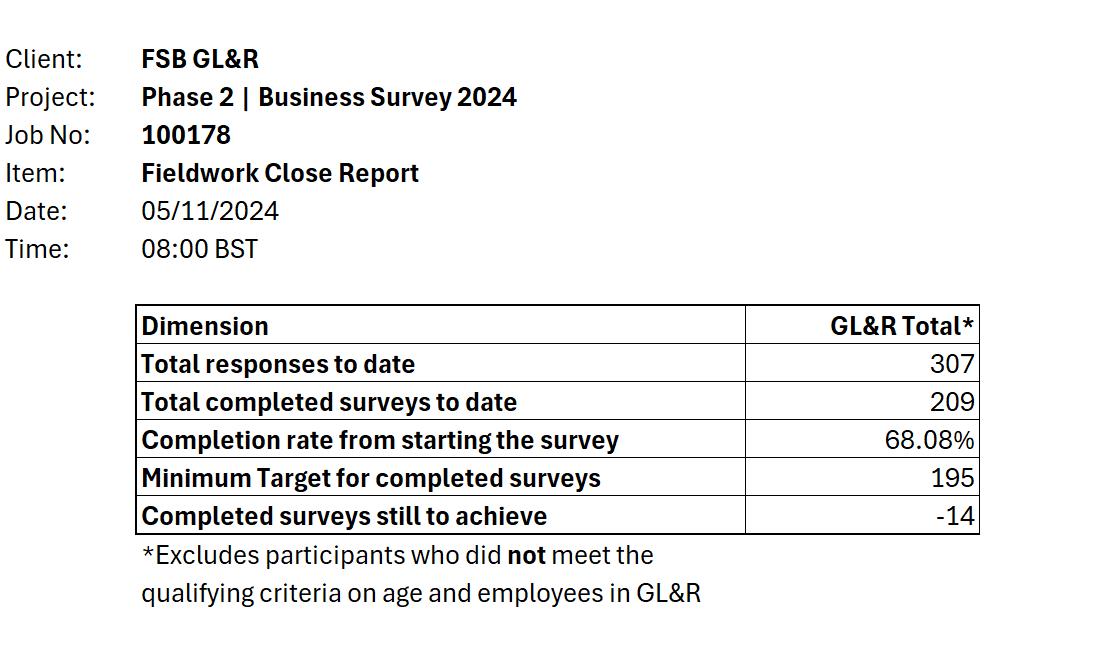
209 fully completed surveys were achieved, as a further 27 were substantially complete (answering 20+ questions), in total 236 unique responses from Employers were taken into analysis.
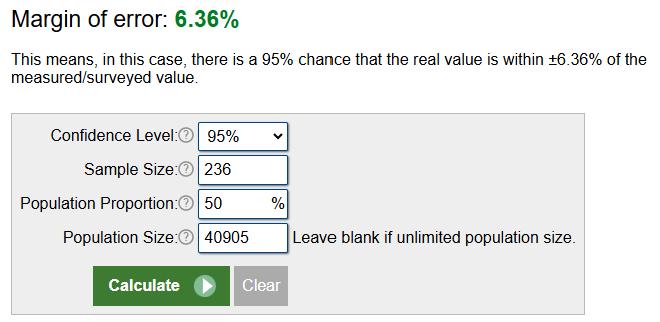
This size of sample delivers a Confidence Interval of ±6.36 at the 95% Confidence Level, which we regard as acceptable given the degree of difficulty involved in engaging this time poor population.

Age Band | The sample in Phase 2 has a younger profile than in Phase 1, with 35-49 year-olds now the mode age band and far fewer participants aged 65+.
Please confirm which age band you fall within.
Phase 1 Phase 2
49 is the average age of business owners based on data submitted on over 5 million people to the Companies House, People with Significant Control (PSC) register.
Source:
https://www.finder.com/uk/busines s-owners-uk
Analysis conducted by finder.com
The higher proportion of the sample drawn from females is as a result of the high level of reliance upon Access Panel Data in Phase 2, compared with FSB and partner organisation recruited participants in Phase 1.
NB The comparatively small reachable population being researched, ruled out the application of quotas, as every individual participant was important.
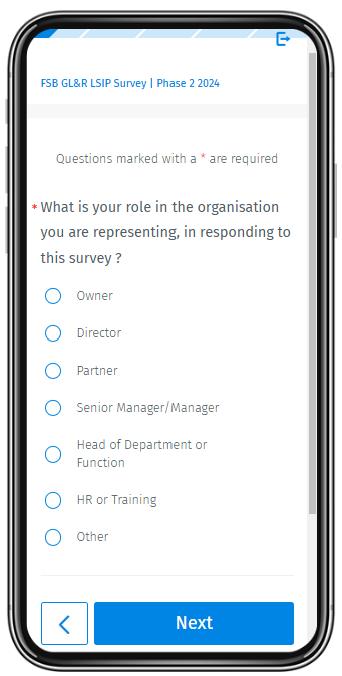
What is your role in the organisation you are representing, in responding to this survey ?
Size | The Phase 2 sample more closely reflects the distribution of employees rather than business entities, with 42% of the sample drawn from Large employers.
The comparatively very small number of survey completes recruited from the FSB member base will have contributed significantly to the proportional fall in share for Sole Traders, Micro and Small Businesses.
Financial services and insurance
Catering and hospitality
Business administration and support services
Scientific and technical
Creative and design
Arts, entertainment and recreation
Advertising, PR and marketing
Accounting, legal and professional
Environmental and energy Real estate
Agriculture, animal care, fishing and forestry
Mining and quarrying
Which industry sector does your organisation primarily operate within?
Sector | As was the case in Phase 1, the Phase 2 Survey incorporates input from representatives of 21 different industry sectors.
Base: Hair and beauty (n=0), Mining and quarrying (n=1), Protective services (n=0), Agriculture, animal care, fishing and forestry (n=2), Digital (n=3), Environmental and energy (n=3), Real estate (n=3), Accounting, legal and professional (n=5), Advertising, PR and marketing (n=5), Arts, entertainment and recreation (n=5), Creative and design (n=4), Scientific and technical (n=4), Business administration and support services (n=7), Catering and hospitality (n=7), Financial services and insurance (n=8), Construction and the built environment (n=10), Transport and logistics (n=12), Public administration and local government (n=14), Wholesale and retail (n=16), Engineering and manufacturing (n=24), Health and care services (n=23), Information and communication (n=23), Education or training provider (n=26), Other (n=31), Sample Size = 236
District | 15% of the Phase 2 sample work in organisations who are not based in GL&R but have employees in the area.
As in Phase 1, City of Lincoln provides the highest share of participants with 22%.
Which district, from those listed below, is your organisation based in (e.g. head office or primary location)?
The share of participants from North Lincolnshire at 13% is up +4% from Phase 1, whilst the share for East Lindsey-based businesses has fallen by -8% and West Lindsey by -6%.
| A much higher proportion of the organisations based in: South Holland (56%), Boston Borough (55%) and City of Lincoln (47%) are large enterprises.
Which district, from those listed below, is your organisation based in (e.g. head office or primary location)? | By Size of organisation
of workforce | The markedly higher representation from large enterprises means that far fewer of the businesses represented in the Phase 2 sample have 100% of their employees based in GL&R.
Approximately, what percentage of your overall workforce is based in Greater Lincolnshire & Rutland?
Location of workforce | As might be expected, nearly two-thirds (65%) of the Micro businesses have all their employees based in GL&R, compared with just 10% of the Large enterprises.
Approximately, what percentage of your overall workforce is based in Greater Lincolnshire & Rutland?
Recruitment | Whilst the sample comprises a higher share of larger enterprises, incidence of recruiting at least one FTE, increased by +22% compared with Phase 1.
Approximately, how many Full-time Equivalent (FTE) employees have you recruited to your organisation over the last 12 months?
Base: None (n=22), 1 (n=12), 2-5 (n=26), 6-10 (n=35), 11-20 (n=27), 21-30 (n=18), 31-40 (n=13), 41-50 (n=19),
| Where they exist at all, 2-5 longstanding unfilled vacancies is the mode situation, with 70% of participating business having at least one such position.
Approximately, how many current vacancies do you have that have remained unfilled for three months or more?
Base: None (n=70), 1 (n=21), 2-5 (n=56), 6-10 (n=30), 11-20 (n=12), 21-30 (n=9), 31-40 (n=9), 41-50 (n=4), 51-100 (n=4), More than 100 (n=3), Don't know (n=18), Sample Size = 236
Unfilled Vacancies by
Recruitment agencies (+7%), Job centres (+8%), Events… (+2%) and/or a Talent pool database (+5%) have risen, as use of other methods has reduced.
How do you typically seek to recruit employees to your organisation?
(Please select all that apply).
General online advertising through (Indeed, local news…
Targeted social media advertising (LinkedIn etc)
Working with recruitment agencies (including agency…
Referral, word of mouth, introductions by existing…
Working with local universities Job centres
Working with apprenticeship providers
Events, job fairs, milk round, etc
Working with local colleges
Re-hiring former employees
Talent pool database
Working with local schools
Phase 1 Phase 2
Base: Other (n=8), Working with local schools (n=28), Talent pool database (n=30), Re-hiring former employees (n=34), Working with local colleges (n=36), Events, job fairs, milk round, etc (n=46),
Working with apprenticeship providers (n=46), Working with local universities (n=47), Job centres (n=54), Referral, word of mouth, introductions by existing employees (n=96), Working with recruitment agencies (including agency labour providers) (n=97), Targeted social media advertising (LinkedIn etc) (n=103), General online advertising through (Indeed, local news sites etc) (n=125), Sample Size = 236
Recruitment
perceptions |
Whilst 17% of participants believe that recruiting new employees has got easier over the last 12 months, 36% think this has got harder.
Over the last 12 months, would you say that recruiting new employees to your organisation has been...?
LSIP engagement/Actively engaged
LSIP engagement/Back seat
LSIP engagement/Monitored progress
LSIP engagement/Not engaged
LSIP Polarities Groups/Limited impact from LSIP
LSIP Polarities Groups/Inactive on LSIP
LSIP Polarities Groups/LSIP Change Agents
LSIP Awareness Groups/High awareness of LSIP
LSIP Awareness Groups/Reasonable awareness of…
LSIP Awareness Groups/Limited awareness of LSIP
LSIP Awareness Groups/No Awareness of LSIP
Primary location/City of Lincoln
Org size/Large (250+ employees)
Org size/Medium (50 to 249 employees)
Org
(11 to 49 employees)
Trader
Recruiting Easier
Much the same
Recruiting Harder
Over the last 12 months, would you say that recruiting new employees to your organisation has been...? | Profile
Recruitment
that feel recruitment has got easier, are more likely to be: Large, based in Lincoln, with high awareness of the LSIP, engagement with the LSIP and perceive the LSIP has had a positive impact.
Why recruitment is easier now | The Top 5 factors: Ability to offer better pay/package (43%), Better quality applications (41%), More applicants with… right experience (41%), right qualifications (30%) and/or right behaviours (27%).
Please select any factors from the list of options below, that you feel have contributed to making recruitment of new employees to your organisation, easier over the last 12 months? (Please select all that apply) | Base Recruitment Easier/Much Easier
Able to offer more attractive pay and benefits packages
Overall better quality of applications for vacancies
More applicants with the right experience
More applicants with the right qualifications
More applicants with the right behaviours
More applicants with the right technical skills (Including…
More applicants in the desired location
Easier to achieve a suitable volume of applications for…
Improved succession planning
More applications from younger workers
More “work ready” applicants
More or better quality applicants for management-level…
Base: Other (n=0), More or better quality applicants for management-level roles (n=4), More “work ready” applicants (n=5), More applications from younger workers (n=5), Improved succession planning (n=6), Easier to achieve a suitable volume of applications for vacancies (n=7), More applicants in the desired location (n=8), More applicants with the right technical skills (Including language skills) (n=9), More applicants with the right behaviours (n=10), More applicants with the right qualifications (n=11), More applicants with the right experience (n=15), Overall better quality of applications for vacancies (n=15), Able to offer more attractive pay and benefits packages (n=16), Sample Size = 37 26
Employee Retention | 21% of Employers believe that retaining staff has been Easier/Much easier over the last 12 months, but 24% think the opposite that it has got Harder/Much harder.
Over the last 12 months, would you say that retaining existing employees within your organisation has been...?
Employee Retention | Organisations who are highly aware and actively engaged with the LSIP, medium size, based in Lincoln or North East Lincs much more widely feel retention has been easier over the last 12 months.
LSIP engagement/Actively engaged
LSIP Polarities Groups/Limited impact from LSIP
LSIP Polarities Groups/LSIP Change Agents
LSIP Awareness Groups/High awareness of LSIP
LSIP Awareness Groups/Limited awareness of LSIP
Primary location/North East Lincolnshire
Primary location/City of Lincoln
Org size/Medium (50 to 249 employees)
Over the last 12 months, would you say that retaining existing employees within your organisation has been...? | Profile
Base: Org size/Medium (50 to 249 employees) (n=54), Org size/Large (250+ employees) (n=95), Industry sector/Health and care services (n=23), Industry sector/Information and communication (n=23), Industry sector/Wholesale and retail (n=16), Primary location/City of Lincoln (n=47), Primary location/North East Lincolnshire (n=29), LSIP Awareness Groups/No Awareness of LSIP (n=52), LSIP Awareness Groups/Limited awareness of LSIP (n=75), LSIP Awareness Groups/High awareness of LSIP (n=36), LSIP Polarities Groups/LSIP Change Agents (n=22), LSIP Polarities Groups/Inactive on LSIP (n=89), LSIP Polarities Groups/Limited impact from LSIP (n=113), LSIP engagement/Not engaged (n=99), LSIP engagement/Monitored progress (n=64), LSIP engagement/Back seat (n=30), LSIP engagement/Actively engaged (n=33), Sample Size = Variable
Why retention is easier | Investing in training & development (47%), Affording better wages/benefits (47%) and Flexible working (41%) are the three most widely selected reasons why staff retention has been easier over the last year.
Please select any factors from the list of options below, that you feel have contributed to making retaining existing employees easier over the last 12 months?
(Please select all that apply) | Base where Easier or Much Easier
We've invested in training and development for the workforce
We've been able to afford better wages and/or employee benefits…
Employees value and benefit from flexible working
Our succession planning has improved
More employees have built up the right experience
Our company culture has been enhanced
We have a better understanding of the workplace training and…
Our approach to the mental health of employees has improved
More employees feel equipped with the right technical skills
More employees are 'work ready'
More employees have the right qualifications for their roles
Transport links for employees have improved
More employees are confident in how to behave in a work setting
Base: Other (n=2), More employees are confident in how to behave in a work setting (n=9), Transport links for employees have improved (n=10), More employees have the right qualifications for their roles (n=13), More employees are 'work ready' (n=15), More employees feel equipped with the right technical skills (n=15), Our approach to the mental health of employees has improved (n=16), We have a better understanding of the workplace training and development options locally (n=16), Our company culture has been enhanced (n=17), More employees have built up the right experience (n=18), Our succession planning has improved (n=18), Employees value and benefit from flexible working (n=21), We've been able to afford better wages and/or employee benefits packages (n=24), We've invested in training and development for the workforce (n=24), Sample Size = 51
Perceptions of provision | 44% of Employers feel that provision has Improved or Improved Significantly over the last 12 months, with just 12% seeing any Deterioration.
What do you think has happened regarding the provision of training and skills development to support your organisation, over the last 12 months?
Perceptions of provision | Employers that are: well aware of LSIP, engage with the LSIP even to a limited extent, and/or are a Large enterprise, much more widely perceive improvement in provision, over the last 12 months.
LSIP engagement/Monitored progress LSIP engagement/Actively engaged
LSIP engagement/Not engaged
LSIP Polarities Groups/Limited impact from LSIP
LSIP Polarities Groups/Inactive on LSIP
LSIP Awareness Groups/High awareness of LSIP
LSIP Awareness Groups/No Awareness of LSIP LSIP Awareness Groups/Limited awareness of LSIP LSIP Awareness Groups/Reasonable awareness of LSIP
What do you think has happened regarding the provision of training and skills development to support your organisation, over the last 12 months? | Profile
Base: Org size/Large (250+ employees) (n=92), Industry sector/Engineering and manufacturing (n=24), Industry sector/Information and communication (n=21), LSIP Awareness Groups/No Awareness of LSIP (n=46), LSIP Awareness Groups/Limited awareness of LSIP (n=74), LSIP Awareness Groups/Reasonable awareness of LSIP (n=62), LSIP Awareness Groups/High awareness of LSIP (n=34), LSIP Polarities Groups/Inactive on LSIP (n=82), LSIP Polarities Groups/Limited impact from LSIP (n=112), LSIP engagement/Not engaged (n=93), LSIP engagement/Monitored progress (n=63), LSIP engagement/Actively engaged (n=33), Sample Size = Variable
More
and innovative ways to train or study (43%), Better understanding of needs and reqs (43%) and Courses relevant to needs (39%), are the three most widely selected reasons why provision is felt to have improved in the last 12 months. In what way(s) would you say that the provision of training and skills development to support your industry sector has improved over the last 12 months?
(Please tick all that apply) | Base where Improved or Improved Significantly
More flexible and innovative ways to train or study (e.g.…
Better understanding of our needs and requirements
Courses and provision more relevant to our needs
More funding on offer to support training and skills
New courses, skills bootcamps, etc
More courses, skills bootcamps, etc
More up-to-date technology/equipment in local colleges
Training and education providers more visible and…
More engagement from training and education providers
More places available on courses
Better handling of apprenticeships by education providers
More people interested in pursuing apprenticeships in our…
More places available on skills bootcamps
Don't know
Base: Other (n=2), Don't know (n=3), More places available on skills bootcamps (n=12), More people interested in pursuing apprenticeships in our sector (n=18), Better handling of apprenticeships by education providers (n=19), More places available on courses (n=23), More engagement from training and education providers (n=29), Training and education providers more visible and accessible (n=30), More up-to-date technology/equipment in local colleges (n=32), More courses, skills bootcamps, etc (n=34), New courses, skills bootcamps, etc (n=35),
More funding on offer to support training and skills (n=35), Courses and provision more relevant to our needs (n=39), Better understanding of our needs and requirements (n=43), More flexible and innovative ways to train or study (e.g. online, virtual reality, etc) (n=43), Sample Size = 101
A perceived lack of understanding (52%), Less funding (41%), Providers less visible and accessible (38%) and Less relevant courses (38%), are the four most commonly selected reasons for decline.
In what way(s) would you say that the provision of training and skills development to support your industry sector has deteriorated over the last 12 months?
(Please tick all that apply) | Base where Deteriorated or Deteriorated Significantly
Lack of understanding of our needs and requirements
Less funding on offer to support training and skills
Education and training providers less visible and accessible
Courses and provision has become less relevant to our…
Fewer people interested in pursuing apprenticeships in our…
Poor handling of apprenticeships by education providers
Poor transport links to sites where training is provided
Less up-to-date technology/equipment in local colleges
Less engagement from training and education providers
Insufficient flexibility and innovation in the ways to train…
Fewer courses or skills bootcamps on offer
No new courses or skills bootcamps
Fewer places on courses
Lack of flexibility in how to spend the Apprenticeship Levy Other
Fewer places on skills bootcamps
Don't know
Base: Don't know (n=1), Fewer places on skills bootcamps (n=2), Lack of flexibility in how to spend the Apprenticeship Levy (n=2), Other (n=2), Fewer places on courses (n=4), No new courses or skills bootcamps (n=4), Fewer courses or skills bootcamps on offer (n=5), Insufficient flexibility and innovation in the ways to train or study (e.g. online, virtual reality, etc) (n=6), Less engagement from training and education providers (n=6), Less up-to-date technology/equipment in local colleges (n=6), Poor transport links to sites where training is provided (n=7), Poor handling of apprenticeships by education providers (n=8), Fewer people interested in pursuing apprenticeships in our sector (n=9), Courses and provision has become less relevant to our needs (n=11), Education and training providers less visible and accessible (n=11), Less funding on offer to support training and skills (n=12), Lack of understanding of our needs and requirements (n=15), Sample Size = 29 34
Understanding among providers | In Phase 2, 31% more Employers believe that providers of post-16 technical education in GL&R have an ‘Adequate’ or better understanding of the skills needs and challenges faced by their organisation.
How would you rate the level of understanding that providers of post-16 technical education in Greater Lincolnshire & Rutland have of the skills needs and challenges faced by your organisation?
Phase 1 Phase 2
Phase 2 Mean Rating = 3.08
Phase 1 Mean Rating = 2.35
The mean rating for the level of understanding providers are felt to have of the Employers skills needs and challenges has improved from 2.35/5.00 to 3.08/5.00.
Understanding among providers | There is still work to do here, as 42% of the Micro Businesses represented felt that providers had ‘limited’ or ‘minimal’ understanding of their skills needs.
How would you rate the level of understanding that providers of post-16 technical education in Greater Lincolnshire & Rutland have of the skills needs and challenges faced by your organisation? | By size of organisation
Provider relationships | The proportion of Employers with at least one provider relationship, has risen by +16% in Phase 2, to reach 82%. Incidence of relationships with ‘a training provider’ and/or ‘a University’ have both increased in Phase 2. Does your organisation have a relationship (new or existing) with any of the entities listed below? (Please tick all that apply)
Provider geography | +6% more of the training providers being engaged with are based in GL&R, but +4% more of the University relationships are now with HEIs outside the area.
Please indicate whether or not the entity(ies) below, that your organisation has a relationship with, are based in Greater Lincolnshire & Rutland.
Provider relationships | In Phase 2, exactly two thirds (Up +11% on Phase 1) of Employers are not looking to make any changes to the provider relationships that they have in place, as ambiguity on this subject has fallen (-12%).
Is there anything you would like to change about the relationship your organisation has with a Secondary School, College, University and/or training provider?
However, as was the case in Phase 1, around a quarter of Employers do wish to change some aspect of their relationship(s) with providers.
Provider relationships | Exactly half of Micro Businesses would like to change some aspect(s) of their relationship with providers, falling to around a fifth for Small Businesses & MSEs.
Is there anything you would like to change about the relationship your organisation has with a Secondary School, College, University and/or training provider?
| By Size of organisation
Only 16% of Large Companies wish to change their relationship with providers in some way, with 73% content with how things are.
Better knowledge of the subjects being taught
Constituency
Enhance partnerships with schools and training providers through workshops, mentorship, and internships, fostering smoother education-to-employment transitions. for them to provide the courses the industry requires on our doorstep
Greater connection and communication particularly with them to us, my experience is this is actively sought from our side rather than theirs.
Have more work lined up on a more regular basis and not spread out throughout the year
I would like to have more of a relationship with the local schools and colleges
Improve alignment and understanding of the business strategy and the strategy of the Secondary School and University
Internship and Apprenticeship Programs
It has gained a closer working relationship
It would be good if their experts could provide advice/support to small local businesses
More contact with each other
More input
More staff ,
More support system for young disabled people
More training courses
organize more workshops in secondary schools.
Stronger ties and be more proactive
Teaching people
The college doesn't engage. They believe they do, and they request feedback, but then nothing happens.
The military is very restricted in the level of contact allowed with education establishments, which makes informing the potential future workforce difficult
The only thing that I would change is the way I have to do my work the trainee
They Constituency get involved and offer more training funds or organisations that can help to work in collaboration with a Lincolnshire college for 16-18 funding Training
Try and get them better qualifications more job experience we would like to develop a partnership with Lincoln uni to employ their excellent graduates in our organisation
We'd like to have more contact and be more involved in a way that is mutually beneficial
Please very briefly describe what you would like to change about the relationship your organisation has with a Secondary School, College, University and/or training provider?
Provider relationships | Improved communication, proactive contact and engagement from Providers, remains a recurring theme in Phase 2, as it was in Phase 1, within the free text answers provided on changes that Employers would like to see in their relationship(s).
Awareness of LSIP | 16% of the Employers researched claim ‘High Awareness’ of LSIP, 27% ‘Reasonable Awareness’, 27% ‘Limited Awareness’ and 24% ‘No Awareness’.
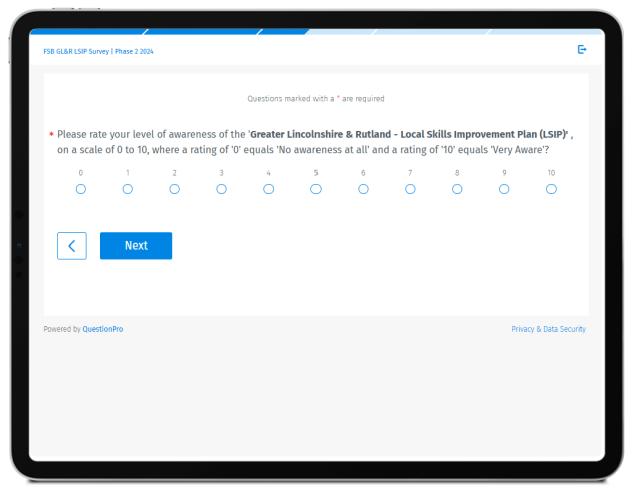
Please rate your level of awareness of the 'Greater Lincolnshire & Rutland - Local Skills Improvement Plan (LSIP)' , on a scale of 0 to 10, where a rating of '0' equals 'No awareness at all' and a rating of '10' equals 'Very Aware'?
Awareness of LSIP | Medium Size Enterprises are the most likely to be Highly Aware of LSIP (20%), with awareness levels lower among Micros, but overall more consistent across the different sizes of employer than might have been imagined.
Please rate your level of awareness of the 'Greater Lincolnshire & Rutland - Local Skills Improvement Plan (LSIP)' , on a scale of 0 to 10, where a rating of '0' equals 'No awareness at all' and a rating of '10' equals 'Very Aware’? | Awareness Groups by Size of Organisation
No Awareness of LSIP Limited awareness of LSIP Reasonable awareness of LSIP High awareness of LSIP
Large (250+ employees)
Medium (50 to 249 employees)
Small (11 to 49 employees)
Micro (less than 10 employees)
Self-employed/Sole Trader
Base: Self-employed/Sole Trader (n=26), Micro (less than 10 employees) (n=20), Small (11 to 49 employees) (n=35), Medium (50 to 249 employees) (n=56), Large (250+ employees) (n=98), Sample Size = 235
LSIP Awareness | Employers based in North Lincolnshire (20%), Lincoln (20%) and Boston (20%) are the most likely to claim ‘High Awareness’ of the LSIP.
Please rate your level of awareness of the 'Greater Lincolnshire & Rutland - Local Skills Improvement Plan (LSIP)' , on a scale of 0 to 10, where a rating of '0' equals 'No awareness at all' and a rating of '10' equals 'Very Aware’? | By District based in (Min. 10 participants)
Employers in South Kesteven (50%), South Holland (44%) and North Kesteven (30%) are the most likely to have ‘No Awareness’ of the LSIP.
LSIP Personal Engagement levels | 15% of the Employer sample can be considered ‘Actively Engaged’ in the LSIP, 13% have taken a ‘Back Seat’ as colleagues have led on LSIP, 28% have done no more than ‘Monitored Progress’, with 44%
‘Not Engaged’ in any way.
LSIP Personal Engagement Segments Actively Engaged Back Seat Monitored Progress Not Engaged
Please select the statement below that best reflects your personal level of engagement to date with the 'Greater Lincolnshire & Rutland - Local Skills Improvement Plan (LSIP)'.
I have been actively engaged with the consultation on, and/or implementation of, the LSIP.
I have taken a back seat, as one of my colleagues has led our involvement on the LSIP.
I have monitored the progress of the LSIP closely, to understand how it may assist us.
I have not engaged in any way with the consultation on, or implementation of, the LSIP.
Base: I have not engaged in any way with the consultation on, or implementation of, the LSIP. (n=104), I have monitored the progress of the LSIP closely, to understand how it may assist us. (n=65), I have taken a back seat, as one of my colleagues has led our involvement on the LSIP. (n=31), I have been actively engaged with the consultation on, and/or implementation of, the LSIP. (n=35), Sample Size = 235
Employers: based in Lincoln or NE Lincs, working in a Large enterprise, and/or operating in the Information and communication sector are much more likely to be Actively Engaged with the LSIP.
Please select the statement below that best reflects your personal level of engagement to date with the 'Greater Lincolnshire & Rutland
- Local Skills Improvement Plan (LSIP)’. | Profile of LSIP Personal Engagement Segments
Base: Org size/Small (11 to 49 employees) (n=35), Org size/Medium (50 to 249 employees) (n=56), Org size/Large (250+ employees) (n=98), Industry sector/Education or training provider (n=26), Industry sector/Engineering and manufacturing (n=24), Industry sector/Health and care services (n=23), Industry sector/Information and communication (n=23), Primary location/City of Lincoln (n=51), Primary location/North East Lincolnshire (n=32), Primary location/South Holland (n=16), Primary location/South Kesteven (n=18), Sample Size = 235
Employers based in South Holland or South Kesteven and/or operating in Health and care services are much more likely to have Not Engaged with the LSIP in any way.
A fifth of employers claim to have modified their approach to training informed by the LSIP and over 1 in 10 indicated that they have changed the way they engage with providers, as a result of the LSIP.

Change Agents
We have changed the way we engage with local education or training providers as a result of the LSIP
We have modified our approach to training, informed by the LSIP
Attended an event relating to the LSIP and/or the LSIP Report.
Limited impact from LSIP
Inactive on LSIP
Read through the LSIP Report in some detail.
Had a brief look through the LSIP Report.
Downloaded or sourced a copy of the LSIP Report.
None of the above
Base: We have changed the way we engage with local education or training providers as a result of the LSIP (n=26), Had a brief look through the LSIP Report. (n=44), We have modified our approach to training, informed by the LSIP (n=47), Attended an event relating to the LSIP and/or the LSIP Report. (n=51), Downloaded or sourced a copy of the LSIP Report. (n=51), Read through the LSIP Report in some detail. (n=55), None of the above (n=95), Sample Size = 233
Thinking now about the LSIP Report pictured above, please indicate below if you have taken any of actions listed. (Please tick all that apply)
Please rate your level of awareness of the 'Local Skills Improvement Fund (LSIF)’, on a scale of 0 to 10, where a rating of '0' equals 'No awareness at all’ and a rating of '10' equals 'Very Aware'?
62% of Employers have ‘No awareness at all’ or ‘Limited Awareness’ of the LSIF. This is likely to indicate that the same will apply to investments made by Providers using these funds.
Base: 0 (n=46), 1 (n=15), 2 (n=14), 3 (n=14), 4 (n=12), 5 (n=22), 6 (n=23), 7 (n=21), 8 (n=35), 9 (n=14), 10 (n=16), Sample Size = 232
Importance of training | 37% of the Employers researched indicated that their business attaches ‘Great Importance’ (9-10 rating) to training and skills development.
Please rate the level of importance that your business would currently attach to training and skills development, on a scale of 0 to 10, where a rating of '0' equals 'No Importance at all' and a rating of '10' equals 'Great Importance'?
However, 30% of Employers participating gave a rating of 0-6, indicating they considered that their business attaches ‘No importance’ or at best ‘Limited importance’ to training and skills development. Ratings here are likely to draw upon both personal frustrations and comparative perceptions.
Please rate the level of importance that your business would currently attach to training and skills development, on a scale of 0 to 10, where a rating of '0' equals 'No Importance at all' and a rating of '10' equals 'Great Importance’? | By size or organisation
(50 to 249 employees)
(11 to 49 employees)
(less than 10 employees)
Increasing size will often correlate with several other factors that can influence the level of importance attached to training:
- Greater number of staff to train
- Larger budgets to fund that training
- Personnel to cover whilst colleagues are being trained
- In-house specialist trainers, etc.
Importance of training | Participants working for employers based in South Kesteven (61% 9-10 ratings), Boston (45%) or South Holland (44%) are more likely to attach ‘Great Importance’ to training and skills development.
Please rate the level of importance that your business would currently attach to training and skills development, on a scale of 0 to 10, where a rating of '0' equals 'No Importance at all' and a rating of '10' equals 'Great Importance’? | By district based in (Min. base = 10)
In aggregate at least, employers based in NE Lincs (29%), North Lincs (30%) or East Lindsey (30%) are less likely to place ‘Great Importance’ on training and skills development –higher incidence of low or limited skill roles?
Importance of training | Across the larger industry sectors, participants working in ‘Engineering and manufacturing’ (mean rating 8.39) and Information and comms (8.22) were the most likely to feel that their business attached a high level of importance to training and skills development.
Please rate the level of importance that your business would currently attach to training and skills development, on a scale of 0 to 10, where a rating of '0' equals 'No Importance at all' and a rating of '10' equals 'Great Importance’? | By size industry sector (Min. 10 participants)
Engineering and manufacturing
Information and communication
Public administration and local government
Construction and the built environment
Health and care services
Education or training provider
Transport and logistics
Wholesale and retail
Base: Hair and beauty (n=NaN), Protective services (n=NaN), Creative and design (n=4), Wholesale and retail (n=16), Catering and hospitality (n=7), Arts, entertainment and recreation (n=4), Transport and logistics (n=12), Advertising, PR and marketing (n=5), Other (n=29), Education or training provider (n=26), Financial services and insurance (n=8), Health and care services (n=22), Construction and the built environment (n=10), Public administration and local government (n=14), Accounting, legal and professional (n=5), Agriculture, animal care, fishing and forestry (n=2), Environmental and energy (n=3), Information and communication (n=23), Real estate (n=3), Engineering and manufacturing (n=23), Scientific and technical (n=4), Business administration and support services (n=7), Digital (n=3), Mining and quarrying (n=1), Sample Size = 231
budget level | Where known the mode total training budget across all employers was £20,000-£49,999, with 27% citing a higher amount and 38% a lower amount than this.
Please indicate which of the bands below, the total training budget in your organisation for the current financial year, would fall within.
£500,000 to £999,999 £1m + Don't know
£250,000 to £499,999
£100,000 to £249,999
£50,000 to £99,999
£20,000 to £49,999
£10,000 to £19,999
£5,000 to £9,999
£1,000 to £4,999
Less than £1,000
No training budget in place
Training budget level | 55% of Micro businesses indicated that they have a training budget of less than £5,000, or no training budget in place at all.
Please indicate which of the bands below, the total training budget in your organisation for the current financial year, would fall within. | By size of organisation
training budget in place
Don't know
Change in training budget | 36% of the employers felt that the training budget in their organisation had increased YOY, at least in line with inflation, 38% felt it had stayed the same and 25% believed that it had reduced.
What do you believe has happened to the total training budget in your organisation, in your current financial year, compared with the previous financial year? | Base - where known 85% of participants answering
Accessing Training | Only 13% of employers regard accessing training and skills development support as ‘Very Easy’ (9-10 rating), over half (51%) deliver a rating of between 0-6 suggesting that they regard this as at least ‘Quite Difficult’.
Please now rate how easy or difficult you find it is for your business to access the training and skills development support you require, again on a scale of 0 to 10, where a rating of '0' equals 'Very Difficult' and a rating of '10' equals 'Very Easy'?
Base: 0 (n=12), 1 (n=5), 2 (n=6), 3 (n=13), 4 (n=15), 5 (n=35), 6 (n=29), 7 (n=35), 8 (n=49), 9 (n=11), 10 (n=19), Sample Size = 229
Training | Delivering a mean rating of just 4.85/10.00, it would appear that Micro businesses find accessing training comparatively more difficult than other sizes of organisation.
Please now rate how easy or difficult you find it is for your business to access the training and skills development support you require, again on a scale of 0 to 10, where a rating of '0' equals 'Very Difficult' and a rating of '10' equals 'Very Easy’? | By size of organisation
Medium (50 to 249 employees) Large (250+ employees)
Micro (less than 10 employees) Small (11 to 49 employees)
Self-employed/Sole Trader
Accessing Training | Businesses based in Boston Borough, in aggregate feel that accessing training is easier (7.47/10.00 mean) than for organisations based in the other districts.
Please now rate how easy or difficult you find it is for your business to access the training and skills development support you require, again on a scale of 0 to 10, where a rating of '0' equals 'Very Difficult' and a rating of '10' equals 'Very Easy’? | By district based in (Min 10)
None of the above North East Lincolnshire Boston Borough
North Lincolnshire
Conversely, businesses based in South Kesteven collectively feel that accessing training is more difficult (3.83 mean) than do their peers in other districts. NB Rutland was the second lowest, off a very small participant base. What might account for the better ratings in Boston and the poorer ones in South Kesteven?
Accessing training | Employers working in ‘Information and comms’ find accessing training easiest in aggregate (7.30/10.00 mean), followed by Construction (7.00).
Please now rate how easy or difficult you find it is for your business to access the training and skills development support you require, again on a scale of 0 to 10, where a rating of '0' equals 'Very Difficult' and a rating of '10' equals 'Very Easy’? | By industry sector (Min 10 base)
Information and communication
Construction and the built environment
Transport and logistics
Public administration and local government Health and care services
Education or training provider
Engineering and manufacturing Wholesale and retail
Whilst Engineering and manufacturing organisations place the greatest importance on training, they find accessing training more difficult (mean 4.65/10.00) that any other major industry sector.
Base: Hair and beauty (n=NaN), Protective services (n=NaN), Digital (n=3), Arts, entertainment and recreation (n=4), Creative and design (n=4), Engineering and manufacturing (n=23), Wholesale and retail (n=16), Advertising, PR and marketing (n=5), Catering and hospitality (n=7), Education or training provider (n=25), Public administration and local government (n=13), Scientific and technical (n=4), Other (n=29), Accounting, legal and professional (n=5), Health and care services (n=22), Transport and logistics (n=12), Agriculture, animal care, fishing and forestry (n=2), Construction and the built environment (n=10), Environmental and energy (n=3), Business administration and support services (n=7), Financial services and insurance (n=8), Information and communication (n=23), Real estate (n=3), Mining and quarrying (n=1), Sample Size = 229
Has your organisation ever done any of the following...? (Please tick all that apply)
Offered/run apprenticeships for new employees
Offered work or industry placements/internships, etc
Offered/run apprenticeships for existing employees
Applied for funding to upskill your staff
Investigated the Skills Bootcamps available within Greater Lincolnshire &… Engaged with the Careers Hub
Put in place a nominated Industry Engagement Advisor to liaise with… Engaged with a local authority Shared Prosperity Fund sponsored training or…
Offered a T Level placement
Don't know None of the above
Around a quarter of the employers researched have at some point ‘Engaged with a Careers Hub’ (26%) and/or ‘Investigated the Skills Bootcamps available with GL&R’ (24%).
% Valid Cases
Base: Don't know (n=15), None of the above (n=25), Offered a T Level placement (n=31), Put in place a nominated Industry Engagement Advisor to liaise with education and training providers (n=32), Engaged with a local authority Shared Prosperity Fund sponsored training or upskilling scheme (n=37), Investigated the Skills Bootcamps available within Greater Lincolnshire & Rutland (n=54), Engaged with the Careers Hub (n=60), Applied for funding to upskill your staff (n=71), Offered/run apprenticeships for existing employees (n=86), Offered work or industry placements/internships, etc (n=88), Offered/run apprenticeships for new employees (n=101), Sample Size = 227
and initiatives | Half of the Micro Businesses have never taken any of the training & skills-related initiatives researched, with only 15% ever offering/running an apprenticeship.
Has your organisation ever done any of the following...? (Please tick all that apply)
| By size of organisation
Put in place a nominated Industry Engagement Advisor to liaise with…
Investigated the Skills Bootcamps
Engaged with the Careers Hub
Engaged with a local authority Shared Prosperity Fund sponsored training or…
(250+ employees) Medium (50 to 249 employees) Small (11 to 49 employees) Micro (less than 10 employees)
Self-employed/Sole Trader
Base: Applied for funding to upskill your staff (n=71), Don't know (n=15), Engaged with a local authority Shared Prosperity Fund sponsored training or upskilling scheme (n=37), Engaged with the Careers Hub (n=60), Investigated the Skills Bootcamps available within Greater Lincolnshire & Rutland (n=54), None of the above (n=25), Offered a T Level placement (n=31), Offered work or industry placements/internships, etc (n=88), Offered/run apprenticeships for existing employees (n=86), Offered/run apprenticeships for new employees (n=101),
Put in place a nominated Industry Engagement Advisor to liaise with education and training providers (n=32), Sample Size = 227
Applying for funding | At 70%+, the apparent success rate in applying for funding to upskill staff, suggests that a higher number of employers should be following suit.
At the previous question you indicated that you had 'Applied for funding to upskill your staff’. If possible, could you please provide the further details requested
did you apply for funding from?
of awareness of the funding available (18%) and no requirement to upskill yet (16%) are the two most widely mentioned reasons.
Please briefly explain why your organisation has not 'Applied
for funding to upskill
your
staff'.
Unaware
No requirement to upskill
Misc
Assessing need
Internal training
Have budget
Not personally responsible
Don’t know
Sole trader/Small Company
Ineligible
Provided by 3rd party
Too busy
Receive funding already
Difficult to apply
Don't know.
My organization will soon apply for funds to upskill when they are ready
We are actively planning to apply for funds
Only 2 members of staff, training funded through business
I only have a very small business and this has not been necessary
None of the current employees would be interested
Didn't know it existed. Finding stuff out takes time. We are generally busy and lack the skills within the business to know how to up skill the business!
I can't match fund it and don't know where to apply
I did not know this aspect existed. We have a budget for training but I didn't know I could enhance it with your help.
We are unaware what funding there may be
information | 18% of employers select ‘A dedicated ‘Skills for Lincolnshire’ website as what would work best for them when seeking information
When you are seeking information on the training options available locally, which of the potential resources listed below would work best for you?
dedicated 'Skills for Lincolnshire' website
key contact for the level of skills you typically seek
stage (entry/mid/managerial/leadership level)…
key contact for your industry sector
key contact for your district
sector specific downloadable guides
path maps
Opinions on the best resource when seeking information on training options are however pretty divergent, with all seven alternatives presented securing between 11-18% of preferences.
Seeking information | Resource preferences vary by size of organisation with: Micros favouring - a dedicated website (37%), Small Businesses - a key contact by district or industry (22%),
MSEs - Career path maps (24%) and Large enterprises – work stage guides (20%).
When you are seeking information on the training options available locally, which of the potential resources listed below would work best for you? | By size of organisation
Large (250+ employees)
Medium (50 to 249 employees)
Small (11 to 49 employees)
Micro (less than 10 employees)
Self-employed/Sole Trader
Business intent | Organisations have a slightly more negative intent in Autumn 2024 (Phase 2) versus Q1 2023 (Phase 1), with 4% more of them looking to reduce the size of their workforce over the next 12 months.
What does your organisation intend to do over the next 12 months?
Please briefly describe below, why your organisation is intending to reduce the size of the workforce over the next 12 months. [Free Text]
AI capabilities being utilised
always do, but refocusing of resources
As we are consolidating our operations
because it wants to depend on robots more
Because to many people
Because work is slowing down but still at a good pace
Cost Management cutting budget
Depends with the sales
Intending to streamline for a temporary measure.
Less demand for our service.
looking at certain positions and minimizing the teams
Move roles offshore and streamline overall organisation
Not recruit when people retire
Ongoing running costs increasing
Organisational restructure to ensure fit for purpose. Cost base savings as well as efficiency and strategy change
Sales went down a little
Too many staff and not enough work
Too many workers to pay, not needed due to Robotics
Voluntary exit schemes and natural staff turnover
We won’t be taking anymore sponsors from abroad meaning it’ll become smaller
Work slowing down
Reasons why intent is to reduce workforce | A mix of introducing AI or robotics, reduced sales and over capacity.
a response to an increase in demand or expansion of the business, for a minority a future plan to grow or future proof the organisation.
Please briefly describe below, why your organisation is intending to increase the size of the workforce over the next 12 months. [Free Text]
Expanding business
Increase in demand for services
Under staffed
Misc
Wish to grow
Don't know
Service improvement
Increase productivity
Turnover increase
Admin Support
Future proofing
Always recruiting
Due to increase in production and number due to finalising a new deal with the client, need more staff
Need more people due to an increase in company size
Opening newer facilities
Due to significant increase in company demand this past year
Increase in demand from customers
Currently there about 5 vacant position left unfilled needed to be replaced.
Because l wish my organisation will grow higher in the next 12months
Recruitment plans | 9% more employers had some intent to recruit over the next 12 months, compared with Q1/2023, albeit the fieldwork was conducted before the Budget.
Approximately how many new employees do you intend or envisage seeking to recruit, over the next 12 months?
1 Phase 2
Base: None (n=26), 1 (n=12), 2-5 (n=59), 6-10 (n=32), 11-20 (n=22), 21-30 (n=17), 31-40 (n=17), 41-50 (n=12), 51-100 (n=6), More
NB A significant proportion of recruitment will be to replace staff already lost and/or predicted attrition.
Don't know
New employee intention by Industry Sector
Recruitment plans| In Phase 2 relative to Phase 1, intent to recruit more highly qualified Post Graduates or Graduates has risen, with declines for all the other educational attainment levels.
Do you plan to do any of the following within the next 12 months? (Please tick all that apply)
Phase
Phase
Recruitment plans | Overall intent to recruit has become more widespread among Small Businesses (+13%) in Phase 2, whilst falling among Micro Businesses (-10%). Do you plan to do any of the following within the next 12 months?
Phase
Phase
Phase
Phase
Phase
Phase
Phase
Phase
(Please tick all that apply)
Small (11 to 49 employees)
Micro (less than 10 employees)
Small Business more widely intend to recruit: Apprentices (+9%) and College leavers (+5%) in particular, whereas Micro Businesses more widely plan to recruit Post Grads (+13%).
Recruitment plans | Overall recruitment intent appears to have risen in Phase 2 among MSEs by +16% to 79% but fallen among Large enterprises by -12% to 76%.
Phase
Phase
Phase
Phase
Phase
Do you plan to do any of the following within the next 12 months?
(Please tick all that apply)
Large (250+ employees)
Medium (50 to 249 employees)
MSEs more widely plan to recruit Graduates (+7%)n and Post Grads (+11%) in Phase 2, whilst intent to recruit at the other educational attainment levels is either stable or reducing.
Workforce development | Incidence of plans to implement each type of staff development initiative has fallen in Phase 2, whilst the rank comparative order of the different types of intervention has remained the same.
Do you plan to develop some or all of your existing workforce, in any of the following ways over the next three years? (Please select all that apply)
Provide behaviour focused or soft skills-based training (e.g. communication, teamwork, time management, problem solving, etc Provide technical training
Provide vocational training
Provide education in core skills (e.g. Maths, English or Digital)
We don't plan to provide any training
Don't know
Provide management development or leadership skills training % Valid Cases Phase 1 Phase 2
Base: Other (n=1), Don't know (n=13), We don't plan to provide any training (n=14), Provide education in core skills (e.g. Maths, English or Digital) (n=63), Provide vocational training (n=84), Provide behaviour focused or soft skills-based training (e.g. communication, teamwork, time management, problem solving, etc (n=93), Provide technical training (n=99), Provide management development or leadership skills training (n=115), Sample Size = 217
Still more than half (53%) of the employers researched plan to provide management development or leadership skills training.
on sourcing
Phase 1,
source training has risen for: An industry…body (+10%), a local university (+8%) and/or a national ind. training provider (+5%).
Where do you intend to source this training from? (Please select all that apply)
An industry, professional organisation or trade body (e.g.…
In-house trainers or training department
A national independent training provider
A local independent training provider
Internal peer or “on the job” training A local university A local college
A council, Growth Hub or LEP
Don't know
Phase 1 Phase 2
82
% Valid Cases
Base: Other (n=3), Don't know (n=9), A council, Growth Hub or LEP (n=34), Internal peer or “on the job” training (n=44), A local university (n=45), A local college (n=48), A local independent training provider (n=57), A national independent training provider (n=65), In-house trainers or training department (n=67), An industry, professional organisation or trade body (e.g. FSB, Chamber of Commerce, CITB, NFU, etc) (n=73), Sample Size = 190
Intent to source from ‘A local college’ is the most stable between Phase 1 and Phase 2 at 25% (-1% from Phase 1).
Confidence in finding suitable training | Confidence has risen in Phase 2, with now 38% (+22%) of employers either ‘Very’ or ‘Extremely’ confident that they will find suitable training in GL&R to support their future needs.
Please indicate how confident or otherwise you are that your organisation will find suitable training options in Greater Lincolnshire & Rutland to support your future needs.
are much less likely to be confident in finding suitable training options than are MSEs or Large enterprises.
Please indicate how confident or otherwise you are that your organisation will find suitable training options in Greater Lincolnshire & Rutland to support your future needs.
| By size of organisation
Confidence in finding suitable training | Employers in Boston Borough and NE Lincs would appear to be much more confident in finding suitable training than their peers in other districts.
Please indicate how confident or otherwise you are that your organisation will find suitable training options in Greater Lincolnshire & Rutland to support your future needs. | By district based in (Min. Base 10 participants)
Employers in South Kesteven and South Holland are the least likely to be ‘Very’ or ‘Extremely’ confident in finding suitable training.
in
Across the larger sectors, confidence is weakest among employers in Wholesale and retail, strongest in the Information and comms sector.
Please indicate how confident or otherwise you are that your organisation will find suitable training options in Greater Lincolnshire & Rutland to support your future needs.
| By industry sector (Min. Base 10 participants)
No confidence at all Very little confidence Reasonably confident Very confident Extremely confident Don't know
Base: Accounting, legal and professional (n=5), Advertising, PR and marketing (n=5), Agriculture, animal care, fishing and forestry (n=1), Arts, entertainment and recreation (n=3), Business administration and support services (n=3), Catering and hospitality (n=5), Construction and the built environment (n=10), Creative and design (n=3), Digital (n=2), Education or training provider (n=22), Engineering and manufacturing (n=21), Environmental and energy (n=3), Financial services and insurance (n=8), Hair and beauty (n=NaN), Health and care services (n=18), Information and communication (n=20), Mining and quarrying (n=1), Protective services (n=NaN), Public administration and local government (n=10), Real estate (n=2), Scientific and technical (n=2), Transport and logistics (n=12), Wholesale and retail (n=12), Other (n=22), Sample Size = 190
Barriers | Employers most widely regard: Cost (27%), Flexibility (20%) and Course relevance (18%), as the three most significant barriers in sourcing training in GL&R.
The cost of training
The flexibility of training options
The relevance of courses available
Willingness of workers to undertake training
Accessing funding for training
The impact of training time/days on the organisation’s…
The range of courses available
Understanding the level or type of training you need
The standard of courses available
Transport issues
N/A - We have not encountered any significant barriers
The physical accessibility of courses available
The length of courses available
Lack of digital/remote courses available
Having the time to seek training
Knowing where to seek training
The number of places on each course
Confusion over the role of different institutions like…
N/A - We do not formally train our staff
Please select from the list of options below, what you regard as the three most significant barriers faced by your organisation when sourcing workforce training in Greater Lincolnshire & Rutland. (Please select up to three answer options OR one of the N/A options)
Base: Other (n=7), N/A - We do not formally train our staff (n=11), Confusion over the role of different institutions like colleges and universities (n=12), The number of places on each course (n=17), Knowing where to seek training (n=19), Having the time to seek training (n=23), Lack of digital/remote courses available (n=24), The length of courses available (n=23), The physical accessibility of courses available (n=23), N/A - We have not encountered any significant barriers (n=25), Transport issues (n=26), The standard of courses available (n=29), Understanding the level or type of training you need (n=27), The range of courses available (n=31), The impact of training time/days on the organisation’s productivity (n=35), Accessing funding for training (n=37), Willingness of workers to undertake training (n=37), The relevance of courses available (n=38), The flexibility of training options (n=43), The cost of training (n=59), Sample Size = 215
| Whilst selecting Cost as a
is largely unchanged between the Phases, selection of Course relevance is down -19%, Flexibility is cited in +7% more instances but the breadth of impact of most of potential barriers has reduced.
Accessing funding for training
The impact of training time/days on the organisation’s productivity
The range of courses available
Understanding the level or type of training you need
The standard of courses available
Transport issues
Please select from the list of options below, what you regard as the three most significant barriers faced by your organisation when sourcing workforce training in Greater Lincolnshire & Rutland. (Please select up
Base: Other (n=7), N/A - We do not formally train our staff (n=11), Confusion over the role of different institutions like colleges and universities (n=12), The number of places on each course (n=17), Knowing where to seek training (n=19), Having the time to seek training (n=23), Lack of digital/remote courses available (n=24), The length of courses available (n=23), The physical accessibility of courses available (n=23), N/A - We have not encountered any significant barriers (n=25), Transport issues (n=26), The standard of courses available (n=29), Understanding the level or type of training you need (n=27), The range of courses available (n=31), The impact of training time/days on the organisation’s productivity (n=35), Accessing funding for training (n=37), Willingness of workers to undertake training (n=37), The relevance of courses available (n=38), The flexibility of training options (n=43), The cost of training (n=59), Sample Size = 215
Most significant training need | After the industry specific training needs referenced by 23% of Employers, IT (12%) and AI (7%) are next most widely mentioned as the organisation’s single most significant training need.
What is your organisation’s single most significant training need for technical skills over the next 12 months? (Please explain your own words below)
Industry specific
Don’t know Misc
Flight deck ground school training, which is provided by an external partner.
Food-based or specialist technical training (NPD, Technical/Quality, Process/Production Skills, Engineering)
Handling dangerous packages.
Heating Apprentices Onboarding
Manual handling training and refreshers
Someone who knows the trade very well to teach it as best as you can
Advanced IT training
Basic it skills are essential in this and many other work Fields
Computer skills
The reference to ‘technical skills’ in the question, will inevitably direct the focus away from more general skills needs as being the most significant.
Priority development areas | Teamwork (36%), Problem solving (31%) and Leadership (30%) are the three most widely selected skills as priorities for workforce development.
Which of the skills listed below would you regard as priority development areas for your workforce, over the next 12 months? (Please tick all that apply)
Base: Other (n=1), None of the above (n=16), Literacy (n=19), Numeracy (n=19), Interpersonal (n=30), Networking (n=33), Overall work-readiness (n=31), Environment/sustainability/N et Zero awareness (n=35), Basic digital capabilities to use business-standard IT (n=37), Overall professionalism (n=37), Adaptability (n=40), Customer service (n=40), Creativity (n=43), Confidence building (n=47), Workplace resilience (n=46), Advanced IT or data skills (n=50), Communications (n=51), Sector specific skills (n=56), Time management (n=55), Management or Supervisory skills (n=58), Critical thinking (n=61), Leadership (n=64), Problem solving (n=65), Teamwork (n=77), Sample Size = 213
prioritisation of ‘Teamwork’ in the Phase 2 survey is largely similar to Phase 1, the new categories of ‘Sector specific skills’ (26%) and ‘Workplace resilience’ (22%) both resonate quite widely.
Phase 1 Phase 2
Which of the skills listed below would you regard as priority development areas for your workforce, over the next 12 months? (Please tick all that apply)
| Phase 2 - Top 10
Base: Other (n=1), None of the above (n=16), Literacy (n=19), Numeracy (n=19), Interpersonal (n=30), Networking (n=33), Overall work-readiness (n=31), Environment/sustainability/N et Zero awareness (n=35), Basic digital capabilities to use business-standard IT (n=37), Overall professionalism (n=37), Adaptability (n=40), Customer service (n=40), Creativity (n=43), Confidence building (n=47), Workplace resilience (n=46), Advanced IT or data skills (n=50), Communications (n=51), Sector specific skills (n=56), Time management (n=55), Management or Supervisory skills (n=58), Critical thinking (n=61), Leadership (n=64), Problem solving (n=65), Teamwork (n=77), Sample Size = 213
advanced programming skills.
Advanced skills in copywriting and digital marketing strategy
AI adoption, Data analysis and data processing skills.
All aspects of our production line
As an engineering firm, we use very specific hardware and software and very few people without experience in the sector have these skills.
As mentioned prior to this question I fully believe that great confidence building in my environment drives the success that I have created
Behaviour
Clinical Nursing and Mental Health nursing skills
Commercial vehicle repairs, Engineering, Numeracy, Motor vehicle technology, Vehicle electrics, Metalwork.
Computer skills
Customer service skills specific to care industry
Developing skills in property valuation, sales, property management, regulatory compliance, and market analysis to enhance staff expertise.
Early years
Flight deck and cabin crew training.
Food processing in fish and pork - pathways into the entry level routes for the processing roles.
For my employees to be able to view something and know how to act and the proper protocol to follow without them necessarily getting involved
Having people understand how our system works and help with using it
Healthcare, finance, supply chain management, Retail and charity
Hydraulic sales, a willingness to learn to communicate
Information technology and marketing
Jail craft for inexperienced/young officers
Knowledge specific to delivering yield and reliability from equipment that is used in our industry sector - delivery of in-house expertise.
Listening safeguarding Mental Health first aid Suicide prevention DA champion
Local government rules and best practice guidelines to ensure accountability for auditing purposes.
managerial knowledge, customer support, human resources, IT...
Manufacturing / machine operating
Manufacturing skills
Marketing needs.
More in depth training on MCA / DOLS, Mental health ( we have a dedicated 24 hour helpline through Black swan Care Group) , Falls Awareness and Prevention
Public speaking, report writing
RF and Microwave Technical Skills
Supporting and implementing complex software
Teaching
Team work and IT skills, with power communication
Technical knowledge so that workers understand the need for what they are doing, as opposed to doing it just because they have been told to.
Technology software/ hardware
The pharmaceutical industry is highly regulated throughout the manufacturing and distribution environment, and the requirements' of pharma companies to follow the PPRS code of practice for sales and marketing is a necessity.
to be trusted and safe
Understanding of decarbonisation
Understanding of the funding landscape of the charitable sector
We are an IT company, so need to stay relevant and up to date
We need to train people in military skills and ethos
We use flammable materials and have to provide in-house training for this element.
When tender streamline the services and looking to more AI products
At the previous question you indicated that you regarded 'Sector specific skills' as a priority development area for your workforce, over the next 12 months. Please could you briefly describe below what 'Sector specific skills' you would wish to develop or enhance.
half of the Employers surveyed can see a positive impact on retention from permanent funding for ‘Developing Digital Skills’ and 52% feel the same about ‘Sector specific skills’, with fewer than one in seven Employers seeing no positive impacts.
Please now imagine that permanent funding, based on highly localised schemes like LSIP, was specifically targeted at each of the skills areas listed below. Please indicate any instances where you believe this would have a positive impact on your workforce, with regard to recruitment, retention, and/or retraining, alternatively, select the 'No positive impact' option. (Please tick all that apply)
in new provider resources | 38% of Employers would be ‘Very/Extremely Interested’ in the opportunity to view, tour or experience new sector-related resources procured by providers.
Please indicate below your level of interest in the opportunity to view/tour/experience new equipment, technology or resources that local education or training providers procure on an annual basis, that has the potential to be relevant to your business and/or industry sector.
Please indicate below your level of interest in the opportunity to view/tour/experience new equipment, technology or resources that local education or
| By size of organisation
Interest in new provider resources | Widest among Employers in ‘Information and comms’ (Mean 3.52/5.00), Engineering and manufacturing (3.50) and Education and training (3.14)
Please indicate below your level of interest in the opportunity to view/tour/experience new equipment, technology or resources that local education or training providers procure on an annual basis, that has the potential to be relevant to your business and/or industry sector.
| By largest industry sectors (Base Min. 10 participants)
Education or training provider
Base: Hair and beauty (n=NaN), Protective services (n=NaN), Agriculture, animal care, fishing and forestry (n=1), Wholesale and retail (n=16), Catering and hospitality (n=6), Creative and design (n=3), Construction and the built environment (n=9), Other (n=27), Arts, entertainment and recreation (n=4), Public administration and local government (n=12), Transport and logistics (n=12), Health and care services (n=19), Environmental and energy (n=3), Business administration and support services (n=7), Education or training provider (n=22), Advertising, PR and marketing (n=5), Scientific and technical (n=3), Accounting, legal and professional (n=5), Engineering and manufacturing (n=20), Real estate (n=2), Information and communication (n=23), Digital (n=3), Financial services and insurance (n=8), Mining and quarrying (n=1), Sample Size = 211
209 Employers fully completed the study and 236 unique responses were taken into analysis. This size of sample delivers a Confidence Interval of ±6.36 at the 95% Confidence Level, which we regard as acceptable given the degree of difficulty involved in engaging this time poor population.
The sample in Phase 2 has a younger profile than in Phase 1, with 35-49 year-olds now the mode age band and far fewer participants aged 65+. 49 is the average age of business owners based on data submitted on over 5m people to the Companies House, People with Significant Control (PSC) register.
The gender balance has reversed between Phase 1 and Phase 2, with female participants now outnumbering males.
There are a higher proportion of Senior Managers and Heads of Department in the Phase 2 sample and a lower share for Business Owners and Directors.
The Phase 2 sample more closely reflects the distribution of employees rather than business entities, with 42% of the sample drawn from Large employers with 250+ staff. The comparatively very small number of survey completes recruited from the FSB member base will have contributed significantly to the proportional fall in share for Sole Traders, Micro and Small Businesses.
As was the case in Phase 1, the Phase 2 Survey incorporates input from representatives of 21 sectors
15% of the Phase 2 sample work in organisations who are not based in GL&R but have employees in the area. As in Phase 1, City of Lincoln provides the highest share of participants with 22%.
The share of participants from North Lincolnshire at 13% is up +4% from Phase 1, whilst the share for East Lindsey-based businesses has fallen by -8% and West Lindsey by -6%. A much higher proportion of the organisations based in: South Holland (56%), Boston Borough (55%) and City of Lincoln (47%) are large enterprises.
The markedly higher representation from large enterprises means that far fewer of the businesses represented in the Phase 2 sample have 100% of their employees based in GL&R.
As might be expected, nearly two-thirds (65%) of the Micro businesses have all their employees based in GL&R, compared with just 10% of the Large enterprises.
Whilst the sample comprises a higher share of larger enterprises, incidence of recruiting at least one FTE, increased by +22% compared with Phase 1.
Where they exist at all, 2-5 longstanding unfilled vacancies is the mode situation, with 70% of participating business having at least one such position.
In Phase 2 incidence of using: Recruitment agencies (+7%), Job centres (+8%), Events… (+2%) and/or a Talent pool database (+5%) have risen, as use of other methods has reduced.
Whilst 17% of participants believe that recruiting new employees has got easier over the last 12 months, 36% think this has got harder. The Top 5 factors making recruitment easier are: Ability to offer better pay/package (43%), Better quality applications (41%), More applicants with… right experience (41%), right qualifications (30%) and/or right behaviours (27%).
21% of Employers believe that retaining staff has been Easier/Much easier over the last 12 months, but 24% think the opposite that it has got Harder/Much harder.
Organisations who are highly aware and actively engaged with the LSIP, medium size, based in Lincoln or North East Lincs much more widely feel retention has been easier over the last 12 months.
Investing in training & development (47%), Affording better wages/benefits (47%) and Flexible working (41%) are the three most widely selected reasons why staff retention has been easier.
44% of Employers feel that provision has Improved or Improved Significantly over the last 12 months, with just 12% seeing any Deterioration.
Employers that are: well aware of LSIP, engage with the LSIP even to a limited extent, and/or are a Large enterprise, much more widely perceive improvement in provision, over the last 12 months.
More flexible and innovative ways to train or study (43%), Better understanding of needs and reqs (43%) and Courses relevant to needs (39%), are the three most widely selected reasons why provision is felt to have improved in the last 12 months.
A perceived lack of understanding (52%), Less funding (41%), Providers less visible and accessible (38%) and Less relevant courses (38%), are the four most commonly selected reasons for decline.
In Phase 2, 31% more Employers believe that providers of post-16 technical education in GL&R have an ‘Adequate’ or better understanding of the skills needs and challenges faced by their organisation.
The mean rating for the level of understanding providers are felt to have of the Employers skills needs and challenges has improved from 2.35/5.00 to 3.08/5.00.
There is still work to do here, as 42% of the Micro Businesses represented felt that providers had ‘limited’ or ‘minimal’ understanding of their skills needs.
The proportion of Employers with at least one provider relationship, has risen by +16% in Phase 2, to reach 82%. Incidence of relationships with ‘a training provider’ and/or ‘a University’ have both increased in Phase 2.
+6% more of the training providers being engaged with are based in GL&R, but +4% more of the University relationships or now with HEIs outside the area.
In Phase 2, exactly two thirds (Up +11% on Phase 1) of Employers are not looking to make any changes to the provider relationships that they have in place, as ambiguity on this subject has fallen (12%).
Improved communication, proactive contact and engagement from Providers, remains a recurring theme in Phase 2, as it was in Phase 1, within the free text answers provided on changes that Employers would like to see in their relationship(s).
16% of the Employers researched claim ‘High Awareness’ of LSIP, 27% ‘Reasonable Awareness’, 27% ‘Limited Awareness’ and 24% ‘No Awareness’.
Medium Size Enterprises are the most likely to be Highly Aware of LSIP (20%), with awareness levels lower among Micros, but overall more consistent across the different sizes of employer than might have been imagined.
Employers based in North Lincolnshire (20%), Lincoln (20%) and Boston (20%) are the most likely to claim ‘High Awareness’ of the LSIP. Employers in South Kesteven (50%), South Holland (44%) and North Kesteven (30%) are the most likely to have ‘No Awareness’ of the LSIP.
15% of the Employer sample can be considered ‘Actively Engaged’ in the LSIP, 13% have taken a ‘Back
Seat’ as colleagues have led on LSIP, 28% have done no more than ‘Monitored Progress’, with 44% ‘Not Engaged’ in any way.
Employers: based in Lincoln or NE Lincs, working in a Large enterprise, and/or operating in the Information and communication sector are much more likely to be Actively Engaged with the LSIP.
Employers based in South Holland or South Kesteven and/or operating in Health and care services are much more likely to have Not Engaged with the LSIP in any way.
A fifth of employers claim to have modified their approach to training informed by the LSIP and over 1 in 10 indicated that they have changed the way they engage with providers, as a result of the LSIP.
Slightly fewer employers (13% v 16%) claim to be ‘Very Aware’ (9-10 rating) of the LSIF. 62% of Employers have ‘No awareness at all’ or ‘Limited Awareness’ of the LSIF. This is likely to indicate that the same will apply to investments made by Providers using these funds.
37% of the Employers researched indicated that their business attaches ‘Great Importance’ (9-10 rating) to training and skills development. However, 30% of Employers participating gave a rating of 0-6, indicating they considered that their business attaches ‘No importance’ or at best ‘Limited importance’ to training and skills development. Ratings here are likely to draw upon both personal frustrations and comparative perceptions.
The level of importance that employers felt their business attaches to training, increases as the size of organisation increases. Increasing size will often correlate with several other factors that can influence the level of importance attached to training: Greater number of staff to train, Larger budgets to fund that training, Personnel to cover whilst colleagues are being trained, In-house specialist trainers, etc.
Participants working for employers based in South Kesteven (61% 9-10 ratings), Boston (45%) or South Holland (44%) are more likely to attach ‘Great Importance’ to training and skills development.
In aggregate at least, employers based in NE Lincs (29%), North Lincs (30%) or East Lindsey (30%) are less likely to place ‘Great Importance’ on training and skills development – higher incidence of low or limited skill roles?
Across the larger industry sectors, participants working in ‘Engineering and manufacturing’ (mean rating 8.39) and Information and comms (8.22) were the most likely to feel that their business attached a high level of importance to training and skills development.
Where known the mode total training budget across all employers was £20,000-£49,999, with 27% citing a higher amount and 38% a lower amount than this.
55% of Micro businesses indicated that they have a training budget of less than £5,000, or no training budget in place at all.
36% of the employers felt that the training budget in their organisation had increased YOY, at least in line with inflation, 38% felt it had stayed the same and 25% believed that it had reduced.
Only 13% of employers regard accessing training and skills development support as ‘Very Easy’ (9-10 rating), over half (51%) deliver a rating of between 0-6 suggesting that they regard this as at least ‘Quite Difficult’.
Delivering a mean rating of just 4.85/10.00, it would appear that Micro businesses find accessing training comparatively more difficult than other sizes of organisation.
Businesses based in Boston Borough, in aggregate feel that accessing training is easier (7.47/10.00 mean) than for organisations based in the other districts. Conversely, businesses based in South Kesteven collectively feel that accessing training is more difficult (3.83 mean) than do their peers in other districts. NB Rutland was the second lowest, off a very small participant base.
Employers working in ‘Information and comms’ find accessing training easiest in aggregate (7.30/10.00 mean), followed by Construction (7.00). Whilst Engineering and manufacturing organisations place the greatest importance on training, they find accessing training more difficult (mean 4.65/10.00) that any other major industry sector.
At 44%, ‘Offering/run apprenticeships for new employees’ is the most widely implemented training related action or initiative researched.
Around a quarter of the employers researched have at some point ‘Engaged with a Careers Hub’ (26%) and/or ‘Investigated the Skills Bootcamps available with GL&R’ (24%).
At 70%+, the apparent success rate in applying for funding to upskill staff, suggests that a higher number of employers should be following suit.
Lack of awareness of the funding available (18%) and no requirement to upskill yet (16%) are the two most widely mentioned reasons.
18% of employers select ‘A dedicated ‘Skills for Lincolnshire’ website as what would work best for them when seeking information on training options. Opinions on the best resource when seeking information on training options are however pretty divergent, with all seven alternatives presented securing between 11-18% of preferences.
Resource preferences vary by size of organisation with: Micros favouring - a dedicated website (37%),
Small Businesses - a key contact by district or industry (22%), MSEs - Career path maps (24%) and Large enterprises – work stage guides (20%).
Organisations have a slightly more negative intent in Autumn 2024 (Phase 2) versus Q1 2023 (Phase 1), with 4% more of them looking to reduce the size of their workforce over the next 12 months.
Where there is an intent is reduce their workforce this appears to be a mix of introducing AI or robotics, reduced sales and over capacity.
Where there is an intent to enlarge their workforce this is often a response to an increase in demand or expansion of the business, for a minority a future plan to grow or future proof the organisation.
9% more employers had some intent to recruit over the next 12 months, compared with Q1/2023, albeit the fieldwork was conducted before the Budget. Previously high-volume recruiting sectors like Education, Engineering…, Health & care, plan to be again.
In Phase 2 relative to Phase 1, intent to recruit more highly qualified Post Graduates or Graduates has risen, with declines for all the other educational attainment levels.
Overall intent to recruit has become more widespread among Small Businesses (+13%) in Phase 2, whilst falling among Micro Businesses (-10%). Small Business more widely intend to recruit: Apprentices (+9%) and College leavers (+5%) in particular, whereas Micro Businesses more widely plan to recruit Post Grads (+13%).
Overall recruitment intent appears to have risen in Phase 2 among MSEs by +16% to 79% but fallen among Large enterprises by -12% to 76%. Overall recruitment intent appears to have risen in Phase 2 among MSEs by +16% to 79% but fallen among Large enterprises by -12% to 76%.
Incidence of plans to implement each type of staff development initiative researched has fallen in Phase 2, whilst the rank comparative order of the different types of intervention has remained the same. Still more than half (53%) of the employers researched plan to provide management development or leadership skills training.
Confidence has risen in Phase 2, with now 38% (+22%) of employers either ‘Very’ or ‘Extremely’ confident that they will find suitable training in GL&R to support their future needs.
Micro and Small Business are much less likely to be confident in finding suitable training options than are MSEs or Large enterprises.
Employers in Boston Borough and NE Lincs would appear to be much more confident in finding suitable training than their peers in other districts. Employers in South Kesteven and South Holland are the least likely to be ‘Very’ or ‘Extremely’ confident in finding suitable training.
Across the larger sectors, confidence is weakest among employers in Wholesale and retail, strongest in the Information and comms sector.
Employers most widely regard: Cost (27%), (Lack of) Flexibility (20%) and Course relevance (18%), as the three most significant barriers in sourcing training in GL&R.
Whilst selecting Cost as a barrier is largely unchanged between the Phases, selection of Course relevance is down -19%, Flexibility is cited in +7% more instances but the breadth of impact of most of potential barriers has reduced.
After the industry specific training needs referenced by 23% of Employers, IT (12%) and AI (7%) are next most widely mentioned as the organisation’s single most significant training need.
Teamwork (36%), Problem solving (31%) and Leadership (30%) are the three most widely selected skills as priorities for workforce development.
Whilst the prioritisation of Teamwork in the Phase 2 survey is largely similar to Phase 1, the new categories of ‘Sector specific skills’ (26%) and Workplace resilience (22%) both resonate quite widely.
Exactly half of the Employers surveyed can see a positive impact on retention from permanent funding for ‘Developing Digital Skills’ and 52% feel the same about ‘Sector specific skills’, with fewer than one in seven Employers seeing no positive impacts.
38% of Employers would be ‘Very/Extremely Interested’ in the opportunity to view, tour or experience new sector-related resources procured by providers. Strong interest is widest among MSE Employers and weakest among the most time-pressured and resource-lite Micro businesses.
Interest in new provider resources is widest among Employers in ‘Information and comms’ (Mean 3.52/5.00), Engineering and manufacturing (3.50) and Education and training (3.14)