Prepared for: Katrina Pierce, Development Manager Lincolnshire, FSB 29th November 2024 v1.0


Prepared for: Katrina Pierce, Development Manager Lincolnshire, FSB 29th November 2024 v1.0


• The Federation of Small Businesses (FSB ‘The Client’), as the appointed Employer Representative Body (ERB) led the development of the Greater Lincolnshire and Rutland Local Skills Improvement Plan (‘The LSIP’) in 1H 2023.
• The LSIP set out 40 actionable priorities to enhance and change post-16 technical education or training in the area, to more closely align with the skills needs of local employers and the local economy.
• The LSIP has now entered Phase 2, which runs from September 2023 to June 2025 and focuses upon taking forward and implementing the actionable priorities identified. Progressing the actions referenced in the LSIP is supported by a £3.5m allocation from the Local Skills Improvement Fund (LSIF), which is shared between 11 FE Colleges across the area.
• Habit5 - a research agency accredited as a Company Partner by the Market Research Society (MRS) – conducted primary market research to deliver insights that informed the development of the LSIP. The agency is now conducting primary and secondary research, to both inform and evaluate progress on the LSIP throughout Phase 2.

We understand that the research needs to achieve the following outputs:
• Deliver contextual data and evidence on the challenges, barriers and opportunities in play generally in the UK economy and specifically within Greater Lincolnshire & Rutland, that may influence progressing and implementing the actionable priorities identified in the LSIP.
• Across each of the eight major LSIP themes of: Work readiness and essential skills, Digitisation and smarter working, Construction, Engineering, Decarbonisation and Green Skills, Local Socio-Economic Conditions, Leadership & Management, Local Skills System – conduct research with relevant employers to establish their awareness, perceptions, consideration, future intent and impacts, regarding any ideas being developed or initiatives being implemented, that are designed to address one or more of the actionable priorities.

• Evidence and insights from particular demographic cohorts that comprise: Women & Girls, Ex-forces, Former offenders, Career changers and NEETs, that help inform solutions that enable more of them to fill occupational gaps in the key sectors of Construction, Engineering, Decarbonisation and L&D.
All of the above outputs should aid and support the writing and production of the annual report by FSB on: progress, engagement, collaboration and impact of the LSIP, which is due to be published in June 2025.
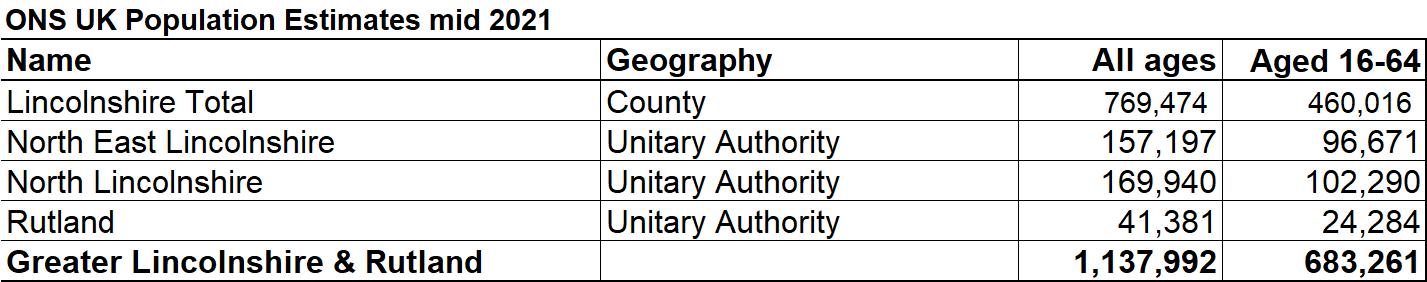
Any resident of Greater Lincolnshire & Rutland of working age (16-64 years) is a potential beneficiary of one or more of the actionable priorities identified in the LSIP, either as an existing employee or a future employee. Also, in theory at least, anyone can be a future Career Changer, eager to acquire new or improved skills. The ONS mid-2021 Population Estimate suggests that there are 683,261 working age adults, resident in Greater Lincolnshire & Rutland, split out by geography, as detailed in the table below.

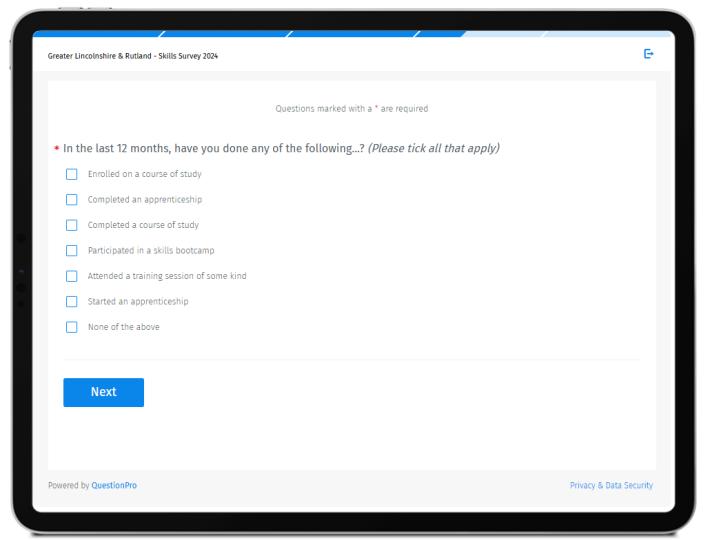


The study was titled ‘Greater Lincolnshire & Rutland – Skills Survey 2024’ and included FSB branding on the introductory and concluding page.
79% of the survey participants generated from the single largest source, completed it using their smartphone.

The bespoke Online Survey with Residents was conducted between 10th – 27th October 2024.
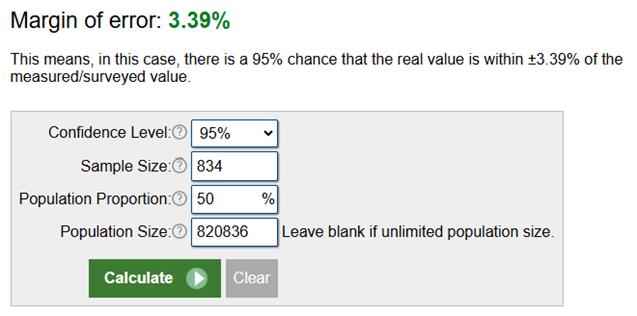
834 fully completed surveys were achieved, with a very satisfactory completion rate from starting the survey of 88.91%. This size of sample delivers a Confidence Interval of ±3.39 at the 95% Confidence Level, which we regard as sufficiently statistically robust for a study of this type. It was agreed that the Residents Survey should extend out to include participants up to 74 years of age, to establish how many in the 60-74 cohort were still working and in part to determine the incidence of any intent to come out of retirement and resume part-time or full-time employment in the future.

NB Individuals who were not currently employed and had no intent to work in the future, were disqualified from fully completing the survey.

Which of the age bands below do you fall within? (Please select one option only)
60-74 year-olds represent a much smaller cohort in the survey sample, as only those currently in paid work or with the future intent to be qualified to fully complete the survey.
The data here suggests that 52% of 60-74s are either working or have a future intent to work.
Gender | The survey sample includes a higher proportion of female residents (57%) than their estimated share of the population (51%) of Greater Lincolnshire & Rutland.
Are you...?
It is often the case that females respond more readily to surveys than do males. Nonetheless, we still have 356 completed surveys from Males –a substantial base of answers to analyse that delivers a Confidence Interval of ±5.19 at the 95% Confidence Interval.
Ethnicity | 17% of the survey sample self-categorises as other than White British, around +3% more than Mid-2023 ONS estimates for this segment.
Disability | 16% of the survey participants indicated that they have some form of disability, with 2% preferring not to say, compared with 18% across the country in the 2021 UK Census.
Do you consider yourself to have a disability under the terms of the Equality Act 2010?
Prefer not to say, 2%
Yes, 16% No, 82%
Base: Prefer not to say (n=17), Yes (n=133), No (n=684), Sample Size = 834
Please indicate the type of impairment which applies to you. If you experience more than one type of impairment, please tick all the types that apply. If your disability does not fit any of these types, please select 'Other' and specify.
Mental health condition, such as depression or…
Long-standing illness or health condition, such as…
Physical/mobility impairment, such as a difficulty…
Learning disability/difficulty, such as Down’s…
Hearing impairment, such as being deaf or having a…
Long Covid or Myalgic Encephalomyelitis (ME), also…
Visual impairment, such as being blind or having a…
Base: Visual impairment, such as being blind or having a serious visual impairment (n=10), Other (n=10), Long Covid or Myalgic Encephalomyelitis (ME), also known as Chronic Fatigue Syndrome (CFS) (n=12), Hearing impairment, such as being deaf or having a serious hearing impairment (n=18), Learning disability/difficulty, such as Down’s syndrome or dyslexia or a cognitive impairment such as autistic spectrum disorder (n=30), Physical/mobility impairment, such as a difficulty using your arms or mobility issues which require you to use a wheelchair or crutches (n=35), Long-standing illness or health condition, such as cancer, HIV, diabetes, chronic heart disease or epilepsy (n=38), Mental health condition, such as depression or schizophrenia (n=58), Sample Size = 133 14
Geography | At 21%, residents of the City Of Lincoln are overrepresented in the sample, with North Lincolnshire and North East Lincolnshire under-represented but still 8%+ in each case.
Please select from the list below the city, local authority or borough, that you are resident in?
Educational attainment | 51% of the survey sample are qualified at Level 4 or above, compared with 48% of the adult population in the UK aged 19-64 years. From the list below, please select the highest educational level you have attained to date.
| With 63% participants self-categorising as falling in the ABC1 socio-economic groups, the sample is more upscale than UK Census data for Lincolnshire, which estimates 51% in this cohort.
Please select the description below which best matches the occupation of the chief income earner in your household, or their occupation prior to retirement:
A - CEO, board director, senior manager, professional, high level civil service or public sector manager
B - Middle manager, owner of a small business, midlevel civil service or public sector manager
C1 - Junior manager, supervisor, clerical worker or self employed
- Skilled manual worker
- Unemployed D - Semi or unskilled manual worker
S - Full time or part time student in higher or further education
% Base: CEO, board director, senior manager, professional, high level civil service or public sector manager (n=107), Middle manager, owner of a small business, mid-level civil service or public sector manager (n=219), Junior manager, supervisor, clerical worker or self employed (n=201), Skilled manual worker (n=150), Semi or unskilled manual worker (n=86), Unemployed (n=54), Full time or part time student in higher or further education (n=17), Sample Size = 834
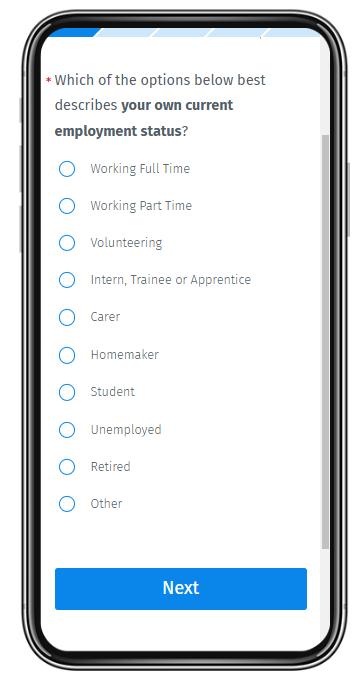
Employment Status | 82% of the survey sample are currently in paid employment, around +7% higher than estimates for the population being researched.
Which of the options below best describes your current employment status?
ONS data to June 2024 suggests that 75% of the population of Lincolnshire aged 16-64 years were economically active. (Source: Nomis Labour Market Profile for Lincolnshire)
2.0 Your Job | In Paid Employment
Sector employed in | Health
Education and training (12%) and Wholesale and retail (10%) are the only industry sectors where one in ten or more work.
Employees working in 22 different industry sectors are represented in the survey sample.
Base: Advertising, PR and marketing (n=3), Mining and quarrying (n=2), Arts, entertainment and recreation (n=9), Creative and design (n=7), Digital (n=9), Environmental and energy (n=10), Hair and beauty (n=6), Protective services (n=6), Real estate (n=8), Scientific and technical (n=7), Agriculture, animal care, fishing and forestry (n=12), Financial services and insurance (n=16), Accounting, legal and professional (n=26), Business administration and support services (n=31), Catering and hospitality (n=26), Engineering and manufacturing (n=28), Construction and the built environment (n=32), Transport and logistics (n=34), Information and communication (n=50), Public administration and local government (n=50), Wholesale and retail (n=70), Other (n=77), Education and training (n=86), Health and care services (n=90), Sample Size = 695
Size of Employer | Compared with UK norms, a higher proportion of the Residents Survey sample (25% v 14%) are employed by Medium Sized Enterprises.
Survey Sample ONS UK Business Share of Employees Mar-2021
Seniority | 57% of the In Paid Employment population categorised their own seniority as Junior Manager or below, indicating that they would not have qualified to complete the Employers Survey. Which of the terms below best describes your seniority within the organisation in which you are
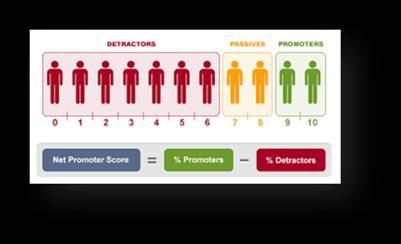
Propensity to recommend | 22% of employees rated their propensity to recommend their employer organisation at the maximum score of ’10’. The mean rating here was 7.47 and the eNPS for the total sample comes in at +11.
On a scale of zero to ten, how likely is it you would recommend the organisation you work for, as an employer? (Where a rating of zero equals 'Very Unlikely’ and a rating of ten equals 'Very Likely')
Base: 0 (n=15), 1 (n=5), 2 (n=10), 3 (n=15), 4 (n=18), 5 (n=50), 6 (n=65), 7 (n=123), 8 (n=146), 9 (n=97), 10 (n=151), Sample Size = 695
| Age matters? 30-39 year-olds deliver the best Employer Net Promoter Score (eNPS) of +24, whereas 50-59 year-olds deliver the lowest at -2. Is this older cohort less positive about work generally and/or less easy to impress?
On a scale of zero to ten, how likely is it you would recommend the organisation you work for, as an employer? (Where a rating of zero equals 'Very Unlikely' and a rating of ten equals 'Very Likely’) | By age band
matters too - individuals employed in Small Businesses deliver the highest eNPS of +27, whereas their peers in Large enterprises (+2) and Micro businesses (+4) are much less likely to be promoters of where they work.
On a scale of zero to ten, how likely is it you would recommend the organisation you work for, as an employer? (Where a
eNPS | As might be expected, eNPS falls as seniority falls, with the exception of Junior Managers whose eNPS of -22, is much lower than that for Team Members (-8) or Team Leaders (+6).
On a scale of zero to ten, how likely is it you would recommend the organisation you work for, as an employer? (Where a rating of zero equals 'Very Unlikely' and a rating of ten equals 'Very Likely’) | By seniority of role
Junior Managers are perhaps most likely to feel pressures from both Team Members and Senior Managers. They may also more widely feel that they deserve a promotion too.
eNPS | Whilst employees working in Rutland are the most likely to be Promoters (50%), their peers in NE Lincs deliver the highest eNPS of +25, closely followed by North Lincs (+23), with workers in East Lindsey the least positive district (+1).
On a scale of zero to ten, how likely is it you would recommend the organisation you work for, as an employer? (Where a rating of zero equals 'Very Unlikely' and a rating of ten equals 'Very Likely’) | By district of
Individuals whose primary work location is outside GL&R deliver the lowest eNPS of -2. Does the time/cost of a long commute play into this?
workers out in the open air, slightly surprisingly, register the highest eNPS of +33, followed by Hybrid workers (+26) with those who work in Shops (-1) or Public buildings (-4) delivering the lowest eNPS, aside from ‘Other’.
On a scale of zero to ten, how likely is it you would recommend the organisation you work for, as an employer? (Where a rating of zero equals 'Very Unlikely' and a rating of ten equals 'Very Likely’) | By type of location or setting
eNPS | Individuals who have been employed in their current role for 20+ years are the most polarised/opinionated about recommending the organisation they work for, as they include the highest share of both Promoters (43%) and Detractors (31%).
On a scale of zero to ten, how likely is it you would recommend the organisation you work for, as an employer? (Where a rating of zero equals 'Very Unlikely' and a rating of ten equals 'Very Likely’) | By length of time employed in current role
Individuals who have been in their current role for 15-19 years deliver the highest eNPS of +24, whereas those in their role for 10-14 years deliver the lowest of +3.
eNPS | Employees exposed to each of the types of training researched are more likely to be Promoters of their employer and less likely to be Detractors. They deliver some of the highest eNPS ratings that the survey has uncovered.
In the last 12 months, have you done any of the following...? (Please tick all that apply)
| By eNPS Groups
an apprenticeship Participated in a bootcamp
None of the above Attended a training session of some kind Enrolled on a course of study Completed a course of study
Incremental positivity peaks where the participant has ‘Started an apprenticeship’ with +26% higher incidence of Promoters and an –18% lower incidence of Detractors versus participants who have not benefitted from any of these training experiences over the last 12 months. 30
| Mean ratings for propensity to recommend their employer peak at 8.80 in the ‘Environmental & energy’ sector.
On a scale of zero to ten, how likely is it you would recommend the organisation you work for, as an employer? | Mean Rating by Industry Sector
Accounting,
Base: Catering and hospitality (n=26), Protective services (n=6), Mining and quarrying (n=2), Business administration and support services (n=31), Creative and design (n=7), Engineering and manufacturing (n=28), Hair and beauty (n=6), Wholesale and retail (n=70), Health and care services (n=90), Education and training (n=86), Transport and logistics (n=34), Financial services and insurance (n=16), Other (n=77), Advertising, PR and marketing (n=3), Digital (n=9), Public administration and local government (n=50), Agriculture, animal care, fishing and forestry (n=12), Real estate (n=8), Scientific and technical (n=7), Accounting, legal and professional (n=26), Construction and the built environment (n=32), Arts, entertainment and recreation (n=9), Information and communication (n=50), Environmental and energy (n=10), Sample Size = 695
The lowest mean rating to recommend of 6.19 is delivered by people working in ‘Catering and hospitality’.
have been in their current role for less than 3 years’ and could quite reasonably still be building up their confidence in the skills required to perform really well in it.
...been employed in your current role? ...worked for your current employer in total? (e.g. previous role/s) ...worked in roles in the industry sector that you currently work within? (e.g. including former employer/s)
Conversely, 24% of workers have been in their current role for 10 years or more and may feel that they know it back to front.
Work location type | At 17%, ‘My home’ is after ‘Office’ at 20%, the second most commonplace work location, with a further 13% splitting their time between the two.
Which of the locations below do you work in most often?
Public building (e.g. school, library, etc) On site at the premises of clients or customers My
Hybrid (e.g. equal split home and office)
Shop, branch or store
Factory or plant
Outdoors (e.g. field, park, construction site) Out on the road (e.g. in car, van, lorry, etc)
Other
Base: Other (n=6), Outdoors (e.g. field, park, construction site) (n=22), Out on the road (e.g. in car, van, lorry, etc) (n=26), Factory or plant (n=49), Shop, branch or store (n=73), Hybrid (e.g. equal split home and office) (n=88), Public building (e.g. school, library, etc) (n=88), On site at the premises of clients or customers (n=88), My home (n=117), Office (n=138), Sample Size = 695
Geography of work location | Over a quarter (26%) of the Residents Survey sample regard the City of Lincoln as their primary work location.
North East Lincolnshire City of Lincoln
None of the above
North Lincolnshire
South Kesteven
East Lindsey
South Holland
North Kesteven
Boston Borough
Rutland West Lindsey
Home and primary work location | 84% of the residents of Lincoln have their primary work location in the city too, whereas only 42% of West Lindsey residents work in the same district.
Please select from the list below the city, local authority or borough, that you are resident in? | By primary work location
Gross Salary | Whilst £20,000-£29,999 is the mode gross annual income among participants, 49% earn in excess of this.
What is your approximate annual gross income from your current employment?
Prefer not to say
£80,000 or more
£60,000 - £79,999
£50,000 - £59,999
£40,000 - £49,999
£30,000 - £39,999
£20,000 - £29,999
£10,000 - £19,999
Less than £10,000
step for 39% of workers is very likely to involve acquiring new skills, either because they want to be promoted, change direction or start their own business.
Which of the statements below most closely reflects how you think about the next step in your career?
I would like to stay in my current role for the foreseeable future.
I would like to achieve a promotion with the organisation I work for now.
I would like to start my own business or switch to be self-employed. I would like to change direction to a different role in a different industry… I would like to retire from work.
I would like to move to a similar role but working for a different organisation…
I would like to do a similar role but in a different industry sector. Don't know
Base: Other (n=10), I would like to do a similar role but in a different industry sector. (n=31), Don't know (n=35), I would like to move to a similar role but working for a different organisation in the same industry sector. (n=52), I would like to start my own business or switch to be self-employed. (n=60), I would like to change direction to a different role in a different industry sector. (n=67), I would like to retire from work. (n=87), I would like to achieve a promotion with the organisation I work for now. (n=140), I would like to stay in my current role for the foreseeable future. (n=213), Sample Size = 695
Next step in career | Female workers over-index on wanting to achieve a promotion, the more highly qualified and fortysomethings are more likely to seek a change of direction.
Age Groups/50-59
Age Groups/40-49
Which of the statements below most closely reflects how you think about the next step in your career? | Profile
I would like to start my own business or switch to be self-employed.
I would like to change direction to a different role in a different industry sector.
I would like to achieve a promotion with the organisation I work for now.
Total
Base: Gender/Female (n=151), Gender/Male (n=114), Educational level/Level 2 (n=27), Educational level/Level 3 (n=54), Educational level/Level 5 (n=24), Educational level/Level 6 (n=74), Educational level/Level 7 (n=49), SEG/Skilled manual worker (n=54), Age Groups/16-29 (n=66), Age Groups/30-39 (n=86), Age Groups/40-49 (n=63), Age Groups/50-59 (n=46), Sample Size = 267
The under 40s and those qualified up to Level 2 over-index in how widespread is their desire to start their own business or switch to being self-employed.
work, a higher proportion (45%) indicated that they were currently unable to work, than are actively looking for work (37%).
Continuing to think about employment, which of the descriptions below best describes your current situation.
I am currently unable to work but would consider doing so in future, if the conditions were right
I am actively looking for full time or part time work
I am thinking of coming out of retirement and working again
I am thinking of returning to full time or part time education
I am starting or intend to start my own business
I am currently re-training
The results data here suggests that 6% of people aged 16-74 ‘…are currently unable to work but would consider doing so in future…’. Strikingly, around half of the under 75 currently Retired segment are ‘…thinking of coming out of retirement and working again’.
Base: I am retired and have no intention of returning to work (n=0), I have no intention of seeking full time or part time employment (n=0), I am currently re-training (n=1), I am starting or intend to start my own business (n=4), I am thinking of returning to full time or part time education (n=4), I am thinking of coming out of retirement and working again (n=11), I am actively looking for full time or part time work (n=43), I am currently unable to work but would consider doing so in future, if the conditions were right (n=52),
Continuing to think about employment, which of the descriptions below best describes your current situation. | Profile
Age Groups/60-74
All others
Age Groups/30-39
Age Groups/16-29
Gender/Male
I am starting or intend to start my own business
I am thinking of returning to full time or part time education
I am thinking of coming out of retirement and working again
I am actively looking for full time or part time work
Gender/Female
‘…start a business…’ have not been employed for 6 years or more.
Continuing to think about employment, which of the descriptions below best describes your current situation. | Time elapsed since last employed
I am currently unable to work but would consider doing so in future, if the conditions were right Less than 3
I have never been employed
I am thinking of coming out of retirement and working again
I am thinking of returning to full time or part time education
I am starting or intend to start my own business
I am actively looking for full time or part time work
Base: I am actively looking for full time or part time work (n=43), I am starting or intend to start my own business (n=4), I am thinking of returning to full time or part time education (n=4), I am thinking of coming out of retirement and working again (n=11), I am currently re-training (n=1), I am currently unable to work but would consider doing so in future, if the conditions were right (n=52), Sample Size = 115
Time elapsed | Just under a third (32%) of those Not in Paid Work, have been out of paid employment for no more than 12 months.
When were you last in full-time or part-time employment?
and care services
and hospitality
and logistics
and retail
Business administration and support services Education and training Engineering and manufacturing
Real estate
Construction and the built environment
Accounting, legal and professional
Public administration and local government
Financial services and insurance
Arts, entertainment and recreation
Scientific and technical
Information and communication
Advertising, PR and marketing Digital
Protective services
Mining and quarrying
Hair and beauty
Environmental and energy
Creative and design
Agriculture, animal care, fishing and forestry
Which
industry sector did you work in most recently?
Sector last worked in | Over a fifth (22%) of those Not in Paid Work, were most recently employed in Health and care services.
Base: Agriculture, animal care, fishing and forestry (n=0), Creative and design (n=0), Environmental and energy (n=0), Hair and beauty (n=0), Mining and quarrying (n=0), Protective services (n=0), Advertising, PR and marketing (n=1), Digital (n=1), Information and communication (n=1), Scientific and technical (n=1), Arts, entertainment and recreation (n=2), Financial services and insurance (n=2), Public administration and local government (n=2), Accounting, legal and professional (n=3), Construction and the built environment (n=3), Real estate (n=3), Business administration and support services (n=4), Education and training (n=5), Engineering and manufacturing (n=4), Wholesale and retail (n=8), Transport and logistics (n=9), Catering and hospitality (n=10), Health and care services (n=25), Other (n=28), Sample Size = 112
Size of employer | Those currently Not in Paid Work were much more likely (31% v 13%) to have most recently worked for a Small Business, than are their employed peers. What size of organisation did you work for most recently?
Those Not in Paid Work are much more likely (60% v 37%) to have been most recently employed at Team Member level, when compared with the In Paid Employment cohort.
Which of the terms below best describes your seniority within the organisation you worked for most recently?
Individuals Not in Paid Work now, were much less likely to have been most recently employed in each of the managerial positions, when compared with their employed peers.
of employment | Nearly twice the proportion (29% v 15%) of those Not in Paid Work, were in their last role for less than 12 months, when compared with those employed currently. They have usually worked in the same industry for a shorter time too.
...in total did you work in roles in the same industry sector that you were employed in last?
…did you work for you last employer in total? …were you employed in your last role?
now are much more likely to have worked on a client’s or customer premises (Care?) and much less likely to have chiefly worked at home or following a hybrid approach than are their employed peers.
Which of the locations below did you work in most often, when you were employed in your most recent role?
building (e.g. school, library, etc)
(e.g. field, park, construction site)
(e.g. equal split home and office) Out on the road (e.g. in car, van, lorry, etc)
Work Base: Hybrid (e.g. equal split home and office) (n=1), Out on the road (e.g. in car, van, lorry, etc) (n=3), Outdoors (e.g. field, park, construction site) (n=4), Other (n=7), My home (n=11), Factory or plant (n=12), Public building (e.g. school, library, etc) (n=12), Office (n=19), Shop, branch or store (n=19), On site at the premises of clients or customers (n=24), Sample Size = 112
Geography of work location | Double the proportion (20% v 10%) of those Not in Paid Work were last employed outside of the GL&R area, compared with the geography of those in Paid Employment now.
Whereabouts was your most recent primary work location situated?
Did the Not in Paid Work segment struggle with long travel times to work and/or move into the area from outside and then struggle to find employment here?
Next step | More of the people Not in Paid Work are looking for a complete change and want to ‘..do a different role in a different industry sector’ (28%), with that is likely to come a requirement for training and building up new skills.
Which of the statements below most closely reflects how you think about working in the future, relative to the last job you were employed in?
I would like to return to a very similar role in the same industry sector Don't know I would like to do a different role in a different industry sector
I would like to do a different role in the same industry sector I would like to do a similar role in a different industry sector I would like to create or define my own role
Next step | The vast majority (89%) of those Not in Paid Work who want to do more of what they have already done when last employed are female. Retired potential returners are much more inclined to do something very different.
Which of the statements below most closely reflects how you think about working in the future, relative to the last job you were employed in? | Profile
Age Groups/60-74
Age Groups/40-49
Age Groups/30-39
Age Groups/16-29
I currently do not possess this skill at all
I have some basic or limited skills in this
I have exactly the skills that are likely to be required of me
I have considerable expertise in this
Not applicable
For
each of the skills or capabilities listed below, please select the option that best reflects your own situation.
Teamworking
Problem solving
Verbal communications
Customer service or interpersonal skills
Written communications
Technical skills for my current role
Technical skills for the industry I work in
Information gathering Critical thinking
Numeracy or data skills
Leadership
Creativity
Management or supervisory skills
Essential computing or IT skills (e.g. Word, Excel,…
Presenting
Technical skills for my most recent job role
Technical skills for the industry I worked in most…
Sales and marketing
Advanced IT skills (e.g. programming)
Base: Verbal communications (n=834), Written communications (n=834), Presenting (n=834), Numeracy or data skills (n=834), Information gathering (n=834), Essential computing or IT skills (e.g. Word, Excel, Powerpoint, etc) (n=834), Advanced IT skills (e.g. programming) (n=834), Sales and marketing (n=834), Teamworking (n=834), Problem solving (n=834), Leadership (n=834), Customer service or interpersonal skills (n=834), Creativity (n=834), Critical thinking (n=834), Management or supervisory skills (n=834), Technical skills for the industry I work in (n=699), Technical skills for the industry I worked in most recently (n=111), Technical skills for my current role (n=699), Technical skills for my most recent job role (n=111), Sample Size = Variable
of skills | People are most widely prepared to admit their limitations relating to: Advanced
marketing, Presenting and Management.
For each of the skills or capabilities listed below, please select the option that best reflects your own situation. | Mean Ratings
or
Technical skills for the industry I worked in most… Technical skills for my most recent job role
Base: Advanced IT skills (e.g. programming) (n=760), Sales and marketing (n=730), Technical skills for the industry I worked in most recently (n=106), Technical skills for my most recent job role (n=105), Presenting (n=769), Management or supervisory skills (n=779), Leadership (n=781), Essential computing or IT skills (e.g. Word, Excel, Powerpoint, etc) (n=799), Creativity (n=795), Numeracy or data skills (n=804), Information gathering (n=806), Critical thinking (n=802), Technical skills for the industry I work in (n=660), Technical skills for my current role (n=661), Customer service or interpersonal skills (n=811), Written communications (n=808), Problem solving (n=816), Verbal communications (n=818), Teamworking (n=809), Sample Size = Variable
Self-perception of skills | Whilst the mean rankings for perceived skills are similar, whether employed or not, the mean ratings are markedly lower among those Not in Paid Work.
Teamworking
Written communications
Verbal communications
Problem solving
Technical skills for my current role
Critical thinking
Customer service or interpersonal skills
Technical skills for the industry I work in
Creativity
Numeracy or data skills
Technical skills for my most recent job role
Information gathering
Technical skills for the industry I worked in…
Essential computing or IT skills (e.g. Word,…
Leadership
Management or supervisory skills
Sales and marketing Presenting
Advanced IT skills (e.g. programming)
For each of the skills or capabilities listed below, please select the option that best reflects your own situation. | Means by employment status
Individuals Not in Paid Work rate their Technical skills relating to their most recent job quite low too – time out of it and/or the reason they are no longer employed in that role? Could more have been done to equip them with these skills?
For each of the skills or capabilities listed below, please indicate any instances where you would like to develop your skills (Please tick all that apply)
Management or supervisory
Technical skills for the industry I worked in most recently
Technical skills for my most recent job role
Written communications
Problem solving
Customer service or interpersonal skills
Verbal communications Teamworking
Technical skills for the industry I work in
Technical skills for my current role
56
Appetite amongst the employed to develop their technical skills is comparatively low at around a third –
Transferability concerns?
Base: Technical skills for my most recent job role develop (n=44), Technical skills for the industry I worked in most recently develop (n=45), Technical skills for my current role develop (n=224), Technical skills for the industry I work in develop (n=228), Verbal communications develop (n=238), Teamworking develop (n=234), Customer service or interpersonal skills develop (n=236), Problem solving develop (n=243), Written communications develop (n=247), Creativity develop (n=272), Critical thinking develop (n=274), Numeracy or data skills develop (n=291), Presenting develop (n=300), Leadership develop (n=298), Sales and marketing develop (n=328), Management or supervisory skills develop (n=327), Essential computing or IT skills develop (n=324), Advanced IT skills develop (n=361), Sample Size = 691
For each of the skills or capabilities listed below, please indicate any instances where you would like to develop your skills (Please tick all that apply)
Technical skills for my current role
Technical skills for the industry I work in
Management or supervisory skills
Advanced IT skills
Presenting Sales and marketing
Essential computing or IT skills
Creativity Leadership
Numeracy or data skills
Problem solving Critical thinking
Customer service or interpersonal skills
Verbal communications Teamworking
Technical skills for the industry I worked in…
Technical skills for my most recent job role
Written communications
Those Not in Paid Work most widely (62%) want to develop their ‘Management or supervisory skills’. Perhaps in order to secure a more senior role than they previously held.
Already developing skills | Problem solving (54%), Customer service… (51%), Teamworking (51%) and Verbal comms (51%) are the skills that are most widely being actively developed. In the vast majority of cases, in an informal way?
For each of the skills or capabilities listed below, please indicate any instances where you are already actively developing your skills. (Please tick all that apply)
Base: Technical skills for the industry I worked in most recently current (n=23), Technical skills for my most recent job role current (n=23), Advanced IT skills current (n=208), Sales and marketing current (n=216), Technical skills for the industry I work in current (n=242), Technical skills for my current role current (n=244), Management or supervisory skills current (n=246), Presenting current (n=256), Numeracy or data skills current (n=253), Essential computing or IT skills current (n=264), Leadership current (n=269), Creativity current (n=270), Information gathering current (n=288), Critical thinking current (n=286), Verbal communications current (n=304), Teamworking current (n=302), Customer service or interpersonal skills current (n=302), Problem solving current (n=318), Sample Size = 594
the Residents have benefitted from ‘Work experience’ at some point in the career, perhaps more surprisingly, over a third claim to have benefitted from ‘Mentoring or coaching’ (34%).
At any point in your career to date, have you benefitted from any of the following...?
(Please tick all that apply)
incidence of ever receiving ‘Mentoring or coaching’ support is more than double among those In Paid Employment compared with Not in Paid Work (17%).
At any point in your career to date, have you benefitted from any of the following...? (Please tick all that apply) | By Employment Status Groups
Exposure to training | 63% of all participants have had some exposure to at least one form of training over the last 12 months, with ‘Attending a training session..’ the most common experience, at 42%. Bootcamps have been participated in by 9%.
In the last 12 months, have you done any of the following...? (Please tick all that apply)
Attended a training session of some kind
Exposure to training | Individuals who have participated in a bootcamp (38%) or completed an apprenticeship (33%) are much more likely to be very aware (9-10 rating) of the LSIP.
In the last 12 months, have you done any of the following...? (Please tick all that apply)
Participated in a bootcamp
Completed an apprenticeship
Started an apprenticeship
Completed a course of study
Enrolled on a course of study
Attended a training session of some kind
None of the above
Base: Attended a training session of some kind (n=349), Completed a course of study (n=204), Completed an apprenticeship (n=43), Enrolled on a course of study (n=188), None of the above (n=306), Participated in a bootcamp (n=74), Started an apprenticeship (n=36), Sample Size = 834
Individuals who have not benefitted from any of the training and skills experiences researched, are much more likely (69%) to have little or no awareness of the LSIP.
who are Not in Paid Work have benefitted from the types of training researched, within the last 12 months, compared with two-thirds for those In Paid Employment. In the last 12 months, have you done any of the following...? (Please tick all that apply)
| By Employment Status Groups
Attended a training session of some kind
None of the above
Completed a course of study
Enrolled on a course of study
Not in Paid Work In Paid Employment Base: Started an apprenticeship (n=30), Completed an apprenticeship (n=41), Participated in a bootcamp (n=71), Enrolled on a
Participated in a bootcamp
Completed an apprenticeship
Started an apprenticeship
In the last 12 months, have you done any of the following...?
(Please tick all that apply)
Any training/bootcamp engagement
Any apprenticeship engagement
Any Course engagement
Total
None of the above
Residents of NE Lincolnshire and North Lincolnshire are more likely to have engaged in an apprenticeship in some way.
Not White British and/or under 30 over index for their participation levels in all forms of
Residents of South Holland and East Lindsey are less likely to have engaged with each type of training researched.
Accreditation level | 52% of the participants ‘Starting an apprenticeship’ regard this as being at Level 4 or above, whereas 67% of training sessions are felt to be below Level 3.
From the options shown, please select the level of any accreditation related to each activity that you have engaged with over the last 12 months.
Please indicate which type of training or education provider, has delivered or will deliver, each of the activities you have engaged with over the last 12 months.
An industry body or professional association
A national independent training provider My employers In-house trainers or training department A council, Growth Hub or LEP
A local university A local college
Base: Attended a training session of some kind (n=349), Participated in a bootcamp (n=74), Enrolled on a course of study (n=188), Completed a course of study (n=204), Started an apprenticeship (n=36), Completed an apprenticeship (n=43), Sample Size = Variable
Source of funding for training | ‘Enrolment on a course of study’ and ‘Participation in a bootcamp’ would appear to be fully funded by the individual in just under a third of instances.
What is/was the source of funding for each of the activities that you have engaged with over the last 12 months?
Fully funded by my employer
Fully funded by the UK Government N/A - Totally free of charge
Participated in a bootcamp Enrolled on a course of study
Attended a training session of some kind Started an apprenticeship Completed a course of study Completed an apprenticeship
Individuals who have ‘Completed an apprenticeship’ are the most likely, at 44%, to be ‘Very Satisfied’ with the experience (Sense of fulfilment?), with those who have ‘Started an apprenticeship’ the least likely at 22%.
Please indicate your overall level of satisfaction with each of the activities that you have engaged in over the last 12 months.
Attended a training session of some kind Participated in a bootcamp Enrolled on a course of study Completed a course of study Started an apprenticeship Completed an apprenticeship
Base: Attended a training session of some kind (n=349), Participated in a bootcamp (n=74), Enrolled on a course of study (n=188), Completed a course of study (n=204), Started an apprenticeship (n=36), Completed an apprenticeship (n=43), Sample Size = Variable
are calculated, the highest aggregate satisfaction is with ‘Completed a course of study’ at 4.07/5.00, followed surprisingly closely by ‘Enrolled on a course of study’ (4.03).
Please indicate your overall level of satisfaction with each of the activities that you have engaged in over the last 12 months.
Completed a course of study
Enrolled on a course of study
Attended a training session of some kind
Completed an apprenticeship
Participated in a bootcamp
With a mean satisfaction rating of 3.47 ‘Started an apprenticeship’ significantly lags the other training-related activities.
Whilst finding your feet or feeling a little daunted may come into this, 22% being dissatisfied, is likely to lead to dropout later.
Satisfaction with provision | Of potential concern, is the finding that mean satisfaction ratings are higher where training is delivered by a Non-local Provider for every type of provision, except ‘Attended a training session of some kind’ where there is no significant difference.
Please indicate your overall level of satisfaction with each of the activities that you have engaged in over the last 12 months.
| Perhaps predictably, Cost (31%), Time (23%) and Access to funding (15%) are the three most widely selected significant barriers to individuals accessing skills-related support in the future.
The cost of training
Having the time to devote to training or…
Accessing funding for the training
The relevance of courses available
The timing of when the course or training runs
The flexibility of training options
The range of courses available
Being sufficiently motivated to complete the…
N/A - I have not encountered any significant…
Getting approval from my employer
The standard of courses available
The length of courses available
Knowing which education or training provider to…
Understanding the jargon surrounding courses… Understanding the level or type of training I need
The physical accessibility of courses available
Knowing where to find information about the…
N/A - I do not want to engage with any training…
The number of places on each course Transport issues
Lack of digital/remote courses available
Other
Please select from the list of options below, what you regard as the three most significant barriers you may encounter in accessing the training or skills-related support you are likely to need in the future. (Please select up to three answer options OR one of the N/A options)
Base: Other (n=5), Lack of digital/remote courses available (n=37), The number of places on each course (n=31), Transport issues (n=42), N/A - I do not want to engage with any training in the future (n=52), Knowing where to find information about the local training options available (n=68), The physical accessibility of courses available (n=66), Understanding the jargon surrounding courses (e.g. levels, types of funding, etc) (n=63), Understanding the level or type of training I need (n=69), Knowing which education or training provider to use (n=79), The length of courses available (n=76), The standard of courses available (n=77), Getting approval from my employer (n=94), N/A - I have not encountered any significant barriers (n=94), Being sufficiently motivated to complete the course or training (n=99), The range of courses available (n=97), The flexibility of training options (n=111), The timing of when the course or training runs (n=107), The relevance of courses available (n=115), Accessing funding for the training (n=124), Having the time to devote to training or completing a course of study (n=191), The cost of training (n=258), Sample Size = 834
The cost of training
Having the time to devote to training or…
Accessing funding for the training
The timing of when the course or training…
The relevance of courses available
The flexibility of training options
Getting approval from my employer
N/A - I have not encountered any significant…
Being sufficiently motivated to complete the…
The range of courses available
The length of courses available
Knowing which education or training…
The standard of courses available
Understanding the level or type of training I…
The physical accessibility of courses available
Knowing where to find information about…
Understanding the jargon surrounding…
N/A - I do not want to engage with any…
The number of places on each course
Lack of digital/remote courses available
Transport issues
Other
Not in Paid Work
In Paid Employment
Please select from the list of options below, what you regard as the three most significant barriers you may encounter in accessing the training or skills-related support you are likely to need in the future. (Please select up to three answer options OR one of the N/A options)
|By Employment Status Groups
Focus of investigation | Web searches for local provider (14%) or nearest FE provider (13%), only fall behind an intent to speak to their boss… (18%) when investigating provision.
Please now imagine that you are interested in investigating the course or training options on offer to you. What would your investigation be likely to primarily focus on?
Speaking to your boss or line manager
A web search for local education or training providers who specialise in your sector or work area
A web search of the courses or training offered by your nearest further education provider (e.g. a college)
A web search by the likely title of the course or training
A web search for national or international providers who specialise in your sector or work area
A web search of education or training providers anywhere in the UK
Seeking recommendations from friends, family or colleagues
A web search of the courses or training offered by your nearest higher education provider (e.g. a university) Registering to attend an open day/evening
Base: Other (n=20), A web search of the courses or training offered by your nearest higher education provider (e.g. a university) (n=58), Registering to attend an open day/evening (n=59), Seeking recommendations from friends, family or colleagues (n=55), A web search of education or training providers anywhere in the UK (n=75), A web search for national or international providers who specialise in your sector or work area (n=91), A web search by the likely title of the course or training (n=105), A web search of the courses or training offered by your nearest further education provider (e.g. a college) (n=111), A web search for local education or training providers who specialise in your sector or work area (n=113), Speaking to your boss or line manager (n=147), Sample Size = 834
Please now imagine that you are interested in investigating the course or training options on offer to you. What would your investigation be likely to primarily focus on? | By Employment Status Groups
A web search for local education or training providers who specialise in your sector or work area
A web search for national or international providers who specialise in your sector or work area
A web search by the likely title of the course or training
web search of education or training providers anywhere in the UK A web search of the courses or training offered by your nearest further education provider (e.g. a college)
A web search of the courses or training offered by your nearest higher education provider (e.g. a university) Registering to attend an open day/evening Seeking recommendations from friends, family or colleagues
Base: Other (n=18), A web search of the courses or training offered by your nearest higher education provider (e.g. a university) (n=52), Registering to attend an open day/evening (n=53), Seeking recommendations from friends, family or colleagues (n=51), A web search of education or training providers anywhere in the UK (n=74), A web search of the courses or training offered by your nearest further education provider (e.g. a college) (n=106), A web search by the likely title of the course or training (n=102), A web search for national or international providers who specialise in your sector or work area (n=85), A web search for local education or training providers who specialise in your sector or work area (n=111), Speaking to your boss or line manager (n=145), Sample Size = 797
Awareness of LSIP | 58% of Residents deliver a rating of under 5/10 for their level of awareness of the GL&R LSIP, with 12% claiming to be ‘Very Aware’ by rating at 9-10.
Please rate your level of awareness of the 'Greater Lincolnshire & Rutland - Local Skills Improvement Plan (LSIP)' , on a scale of 0 to 10, where a rating of '0' equals 'No awareness at all' and a rating of '10' equals 'Very Aware'?
Females more widely have little or no awareness of the GL&R LSIP (62% 0-5 ratings).
Quite understandably, individuals Not in Paid Work are very likely to be unaware (71% 0-4 ratings).
Whilst still in a minority, having a high level of awareness appears to peak among 30-39 year olds (19% 9-10 ratings) and as would be expected the very senior A socio-economic group (31% 9-10 ratings).
Base: 0 (n=307), 1 (n=42), 2 (n=45), 3 (n=46), 4 (n=41), 5 (n=76), 6 (n=62), 7 (n=53), 8 (n=64), 9 (n=41), 10 (n=57), Sample Size = 834
834 fully completed surveys were achieved. This size of sample delivers a Confidence Interval of ±3.39 at the 95% Confidence Level
A fifth or more of the survey sample was drawn from each of the age cohorts between 16 and 59 years.
The survey data suggests that 52% of 60-74s are either working or have a future intent to work.
The survey sample includes a higher proportion of female residents (57%) than their estimated share of the population (51%) of Greater Lincolnshire & Rutland.
17% of the survey sample self-categorises as other than White British, around +3% more than Mid2023 ONS estimates for this segment.
16% of the survey participants indicated that they have some form of disability, with 2% preferring not to say, compared with 18% across the country in the 2021 UK Census.
44% of the participants with a disability, equating to 7% of the total sample, indicated that they have a mental health condition of some kind.
At 21%, residents of the City Of Lincoln are over-represented in the sample, with North Lincolnshire and North East Lincolnshire under-represented but still 8%+ in each case.
51% of the survey sample are qualified at Level 4 or above, compared with 48% of the adult population in the UK aged 19-64 years.
With 63% participants self-categorising as falling in the ABC1 socio-economic groups, the sample is more upscale than UK Census data for Lincolnshire, which estimates 51% in this cohort.
82% of the survey sample are currently in paid employment, around +7% higher than estimates for the population being researched. ONS data to June 2024 suggests that 75% of the population of Lincolnshire aged 16-64 years were economically active. (Source: Nomis Labour Market Profile for Lincolnshire)
Health and care services (13%), Education and training (12%) and Wholesale and retail (10%) are the only industry sectors where one in ten or more of the survey sample work. Employees working in 22 different industry sectors are represented in the survey sample.
Compared with UK norms, a higher proportion of the Residents Survey sample (25% v 14%) are employed by Medium Sized Enterprises.
57% of the In Paid Employment population categorised their own seniority as Junior Manager or below, indicating that they would not have qualified to complete the Employers Survey.
22% of employees rated their propensity to recommend their employer organisation at the maximum score of ’10’. The mean rating here was 7.47 and the eNPS for the total sample comes in at +11.
Age matters? 30-39 year-olds deliver the best Employer Net Promoter Score (eNPS) of +24, whereas 50-59 year-olds deliver the lowest at -2. Is this older cohort less positive about work generally and/or less easy to impress?
Size matters too - individuals employed in Small Businesses deliver the highest eNPS of +27, whereas their peers in Large enterprises (+2) and Micro businesses (+4) are much less likely to be promoters of where they work. At 21%, Detractors are least likely to be found in MSEs.
As might be expected, eNPS falls as seniority falls, with the exception of Junior Managers whose eNPS of -22, is much lower than that for Team Members (-8) or Team Leaders (+6).
Whilst employees working in Rutland are the most likely to be Promoters (50%), their peers in NE Lincs deliver the highest eNPS of +25, closely followed by North Lincs (+23), with workers in East Lindsey the least positive district (+1). Individuals whose primary work location is outside GL&R deliver the lowest eNPS of -2. Does the time/cost of a long commute play into this?
Great Outdoors – workers out in the open air, slightly surprisingly, register the highest eNPS of +33, followed by Hybrid workers (+26) with those who work in Shops (-1) or Public buildings (-4) delivering the lowest eNPS, aside from ‘Other’.
Individuals who have been employed in their current role for 20+ years are the most polarised/opinionated about recommending the organisation they work for, as they include the highest share of both Promoters (43%) and Detractors (31%). Individuals who have been in their current role for 15-19 years deliver the highest eNPS of +24, whereas those in their role for 10-14 years deliver the lowest of +3.
Employees exposed to each of the types of training researched are more likely to be Promoters of their employer and less likely to be Detractors. They deliver some of the highest eNPS ratings that the survey has uncovered. Incremental positivity peaks where the participant has ‘Started an apprenticeship’ with +26% higher incidence of Promoters and an –18% lower incidence of Detractors versus participants who have not benefitted from any of these training experiences over the last 12 months.
Mean ratings for propensity to recommend their employer peak at 8.80/10.00 in the ‘Environmental & energy’ sector. The lowest mean rating to recommend of 6.19 is delivered by people working in ‘Catering and hospitality’.
37% of people In Paid Employment have been in their current role for less than 3 years’ and could quite reasonably still be building up their confidence in the skills required to perform really well in it. Conversely, 24% of workers have been in their current role for 10 years or more and may feel that they know it back to front.
At 17%, ‘My home’ is after ‘Office’ at 20%, the second most commonplace work location, with a further 13% splitting their time between the two.
Over a quarter (26%) of the Residents Survey sample regard the City of Lincoln as their primary work location.
84% of the residents of Lincoln have their primary work location in the city too, whereas only 42% of West Lindsey residents work in the same district.
Whilst £20,000-£29,999 is the mode gross annual income among participants, 49% earn in excess of this.
The desired career next step for 39% of workers is very likely to involve acquiring new skills, either because they want to be promoted, change direction or start their own business.
Female workers over-index on wanting to achieve a promotion, the more highly qualified and fortysomethings are more likely to seek a change of direction. The under 40s and those qualified up to Level 2 over-index in how widespread is their desire to start their own business or switch to being selfemployed.
Amongst those Not in Paid work, a higher proportion (45%) indicated that they were currently unable to work, than are actively looking for work (37%). The results data here suggests that 6% of people aged 16-74 ‘…are currently unable to work but would consider doing so in future…’. Strikingly, around half of the under 75 currently Retired segment are ‘…thinking of coming out of retirement and working again’.
All of those in the Not in Paid Work segment who are focused on starting a business were female, whereas males strongly over-index among the Retired potential returners (Index 206). Around half of those ‘…currently unable to work…’ or wanting to ‘…start a business…’ have not been employed for 6 years or more.
Just under a third (32%) of those Not in Paid Work, have been out of paid employment for no more than 12 months.
Over a fifth (22%) of those Not in Paid Work, were most recently employed in Health and care services.
Those currently Not in Paid Work were much more likely (31% v 13%) to have most recently worked for a Small Business, than are their employed peers.
Those Not in Paid Work are much more likely (60% v 37%) to have been most recently employed at Team Member level, when compared with the In Paid Employment cohort. Individuals Not in Paid Work now, were much less likely to have been most recently employed in each of the managerial positions, when compared with their employed peers.
Nearly twice the proportion (29% v 15%) of those Not in Paid Work, were in their last role for less than 12 months, when compared with those employed currently. They have usually worked in the same industry for a shorter time too.
Those Not in Paid Work now are much more likely to have worked on a client’s or customer premises (Care?) and much less likely to have chiefly worked at home or following a hybrid approach than are their employed peers.
Double the proportion (20% v 10%) of those Not in Paid Work were last employed outside of the GL&R area, compared with the geography of those in Paid Employment now. Did the Not in Paid Work segment struggle with long travel times to work and/or move into the area from outside and then struggle to find employment here?
More of the people Not in Paid Work are looking for a complete change and want to ‘..do a different role in a different industry sector’ (28%), with that is likely to come a requirement for training and building up new skills.
The vast majority (89%) of those Not in Paid Work who want to do more of what they have already done when last employed are female. Retired potential returners are much more inclined to do something very different.
Teamworking, Problem solving and Verbal comms are widely regarded as strengths, with the Top 3 highest percentage of participants ratings themselves as having ‘…considerable expertise’ in these areas.
People are most widely prepared to admit their limitations relating to: Advanced IT skills, Sales and marketing, Presenting and Management.
Whilst the mean rankings for perceived skills are similar, whether employed or not, the mean ratings are markedly lower among those Not in Paid Work. Individuals Not in Paid Work rate their Technical skills relating to their most recent job quite low too – time out of it and/or the reason they are no longer employed in that role? Could more have been done to equip them with these skills?
The widest desire to develop skills relates to: Advanced IT skills (52%), Essential computing… (47%), Management… (47%) and Sales & Marketing 47%. Appetite amongst the employed to develop their technical skills is comparatively low at around a third – Transferability concerns?
A higher proportion of those Not in Paid Work are, perhaps understandably, keen to develop their skills of every type, relative to those In Paid Employment. Those Not in Paid Work most widely (62%) want to develop their ‘Management or supervisory skills’. Perhaps in order to secure a more senior role than they previously held.
Problem solving (54%), Customer service… (51%), Teamworking (51%) and Verbal comms (51%) are the skills that are most widely being actively developed. In the vast majority of cases, in an informal way?
Whilst 43% of the Residents have benefitted from ‘Work experience’ at some point in the career, perhaps more surprisingly, over a third claim to have benefitted from ‘Mentoring or coaching’ (34%).
At 38%, incidence of ever receiving ‘Mentoring or coaching’ support is more than double among those In Paid Employment compared with Not in Paid Work (17%).
63% of all participants have had some exposure to at least one form of training over the last 12 months, with ‘Attending a training session..’ the most common experience, at 42%. Bootcamps have been participated in by 9%.
Individuals who have participated in a bootcamp (38%) or completed an apprenticeship (33%) are much more likely to be very aware (9-10 rating) of the LSIP. Individuals who have not benefitted from any of the training and skills experiences researched, are much more likely (69%) to have little or no awareness of the LSIP.
Only a third of individuals who are Not in Paid Work have benefitted from the types of training researched, within the last 12 months, compared with two-thirds for those In Paid Employment.
Individuals who are: Not White British and/or under 30 over index for their participation levels in all forms of training. Residents of NE Lincolnshire and North Lincolnshire are more likely to have engaged in an apprenticeship in some way. Residents of South Holland and East Lindsey are less likely to have engaged with each type of training researched.
52% of the participants ‘Starting an apprenticeship’ regard this as being at Level 4 or above, whereas 67% of training sessions are felt to be below Level 3.
Completed Apprenticeships are the most likely intervention to be delivered by a local provider (53%), although this is less widespread for Started Apprenticeship (41%).
‘Enrolment on a course of study’ and ‘Participation in a bootcamp’ would appear to be fully funded by the individual in just under a third of instances.
Individuals who have ‘Completed an apprenticeship’ are the most likely, at 44%, to be ‘Very Satisfied’ with the experience (Sense of fulfilment?), with those who have ‘Started an apprenticeship’ the least likely at 22%. When mean satisfaction ratings are calculated, the highest aggregate satisfaction is with ‘Completed a course of study’ at 4.07/5.00, followed surprisingly closely by ‘Enrolled on a course of study’ (4.03). With a mean satisfaction rating of 3.47 ‘Started an apprenticeship’ significantly lags the other training-related activities. Whilst finding your feet or feeling a little daunted may come into this, 22% being dissatisfied, is likely to lead to dropout later.
Of potential concern, is the finding that mean satisfaction ratings are higher where training is delivered by a Non-local Provider for every type of provision, except ‘Attended a training session of some kind’ where there is no significant difference.
Perhaps predictably, Cost (31%), Time (23%) and Access to funding (15%) are the three most widely selected significant barriers to individuals accessing skills-related support in the future. | Cost of training (36% +6%) is more widely a barrier for those Not in Paid Work, Time (25% +10) for the employed.
Web searches for local provider (14%) or nearest FE provider (13%), only fall behind an intent to speak to their boss… (18%) when investigating provision. Not having a boss or line manager, prompts much wider intent to conduct web searches for courses offered by the nearest FE provider (26% +15%).
58% of Residents deliver a rating of under 5/10 for their level of awareness of the GL&R LSIP, with 12% claiming to be ‘Very Aware’ by rating at 9-10. Females more widely have little or no awareness of the GL&R LSIP (62% 0-5 ratings). Quite understandably, individuals Not in Paid Work are very likely to be unaware (71% 0-4 ratings). Having a high level of awareness appears to peak among 30-39 yearolds (19% 9-10 ratings) and among the very senior A socio-economic group (31% 9-10 ratings).