Taking Action Toward a Brighter Future


2022 ENVIRONMENTAL SOCIAL AND GOVERNANCE REPORT
TABLE OF CONTENTS Contents 2
3 2022 ENVIRONMENTAL, SOCIAL, AND GOVERNANCE REPORT 01 02 03 04 05 06 07 08 Introduction TCFD Advance Decarbonization Strengthen Resilience Connect Communities Empower Teams Govern Responsibly Appendix
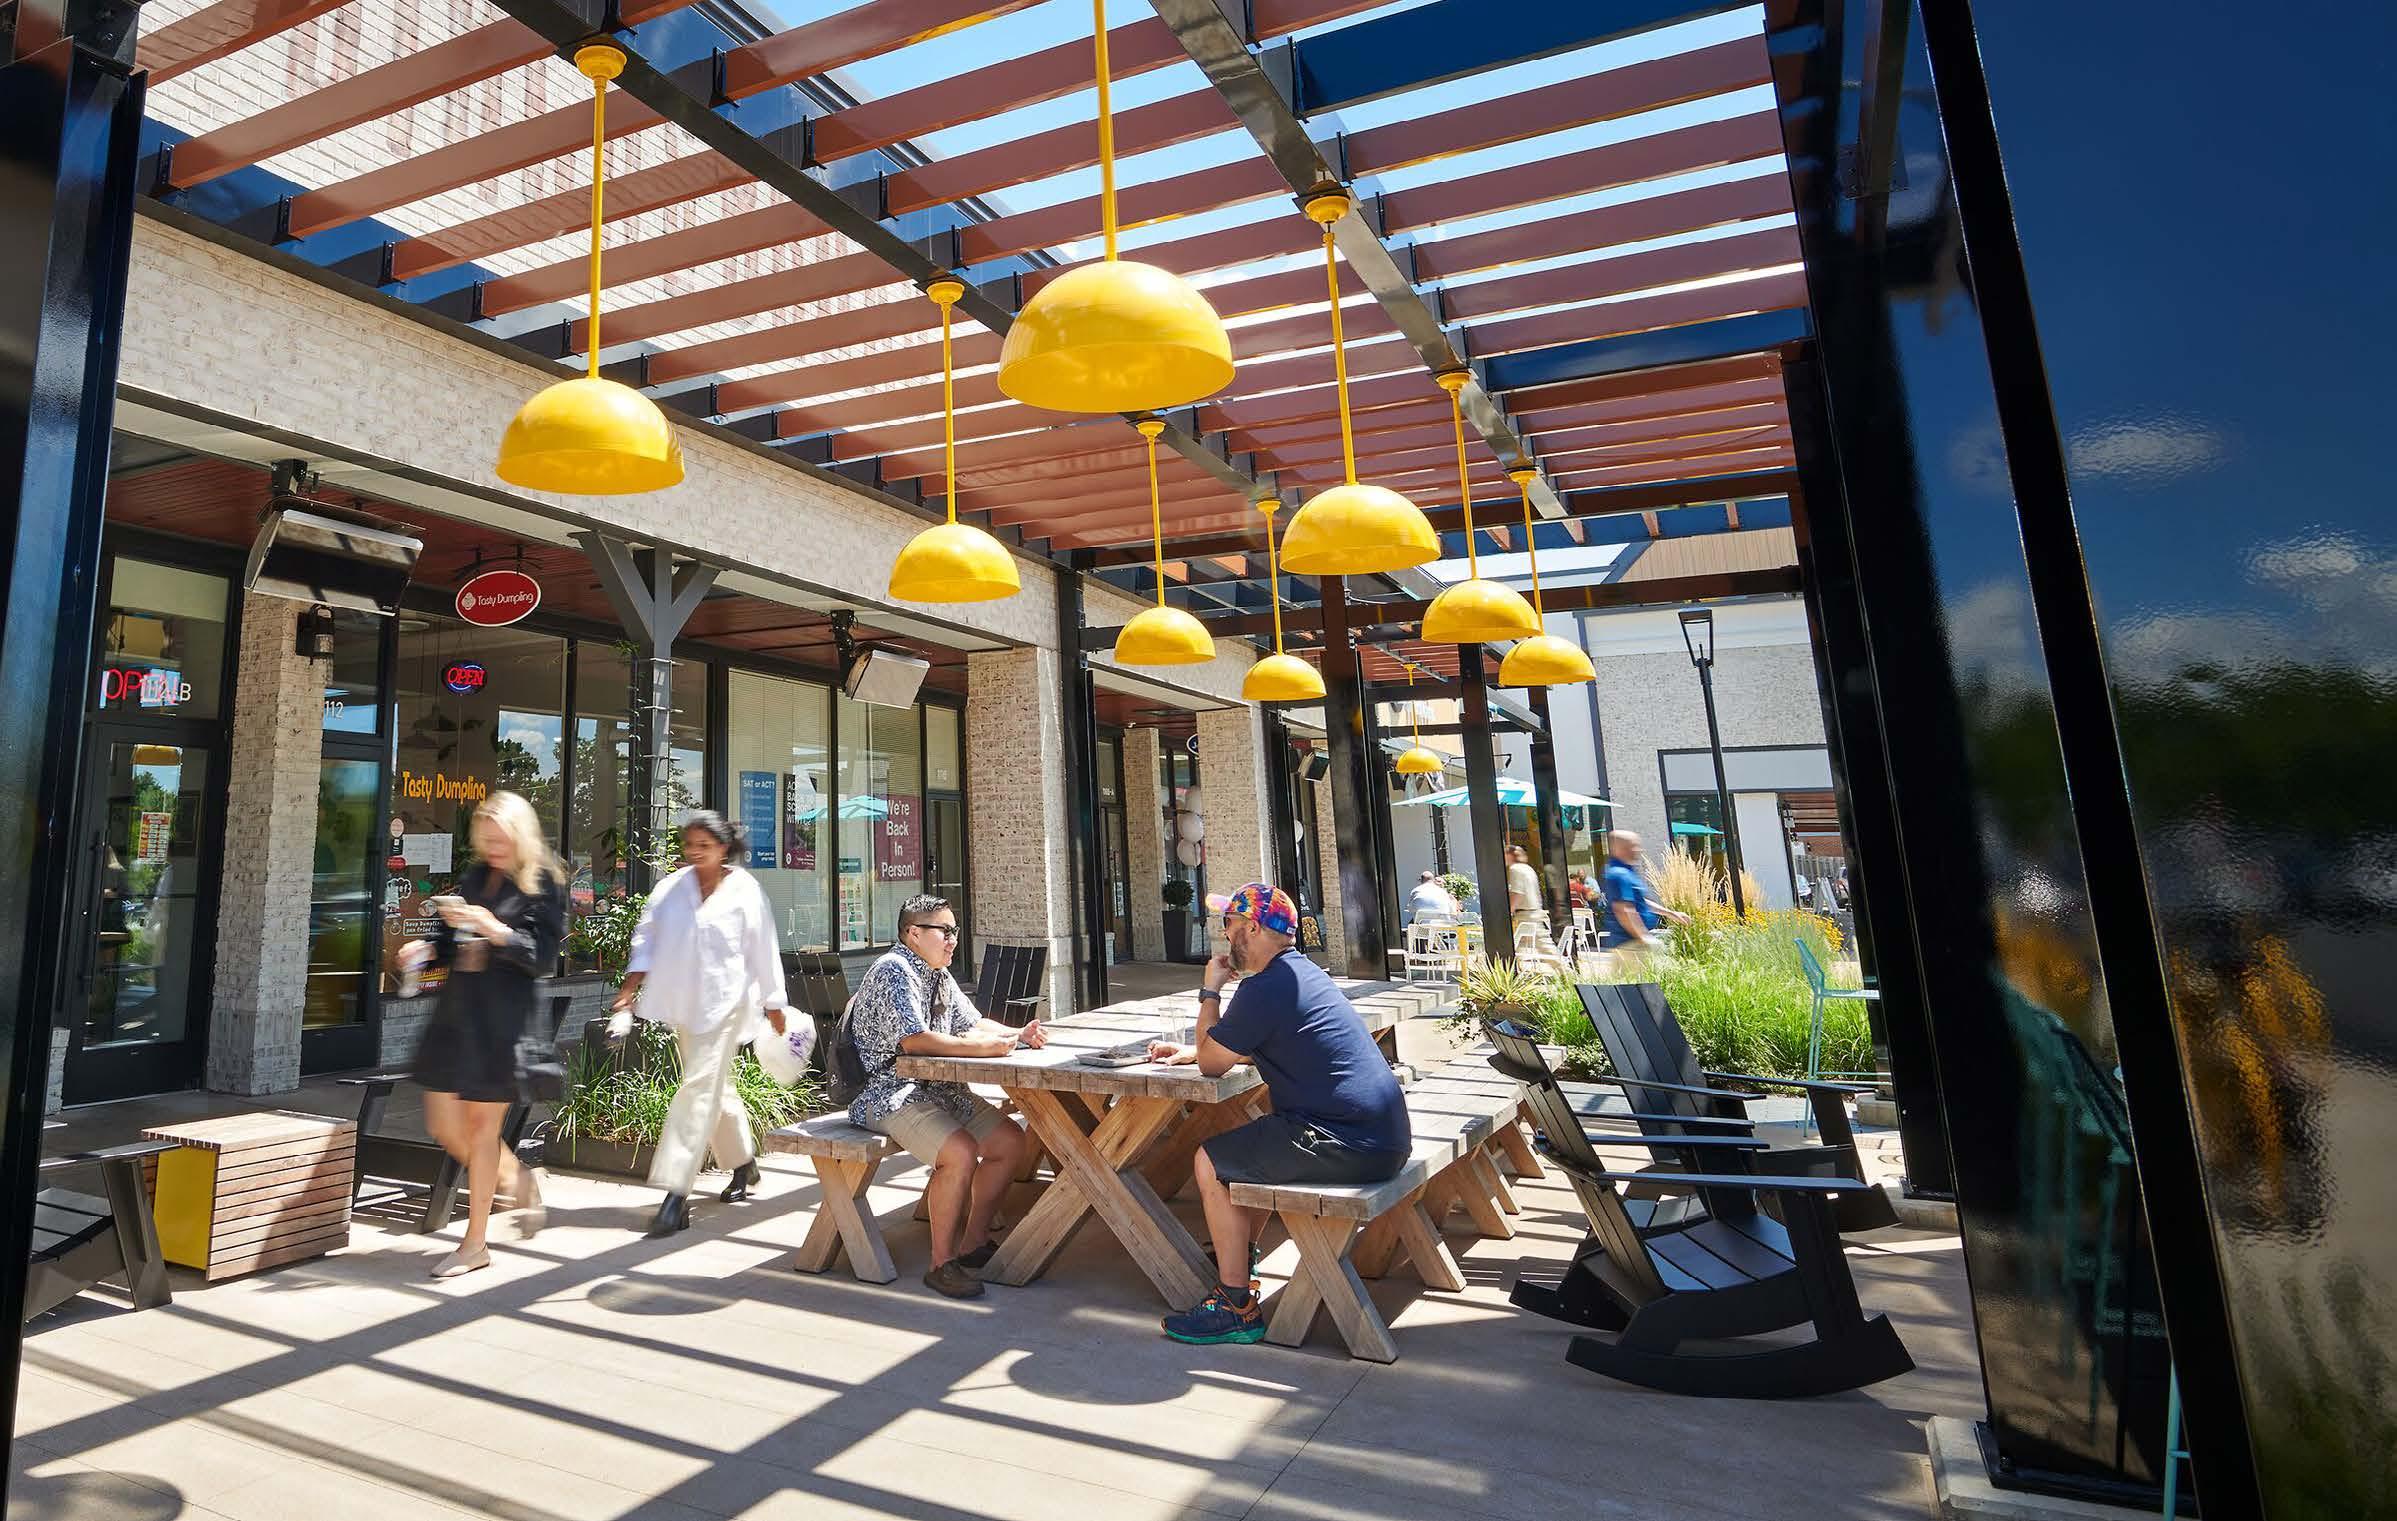
Federal Facts
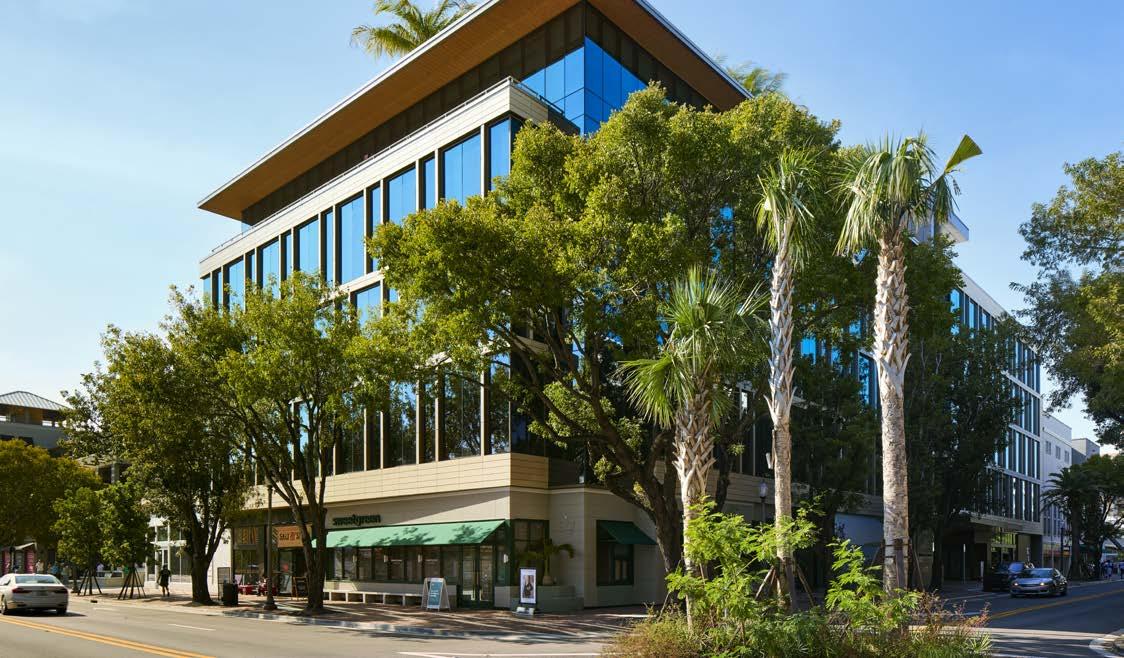
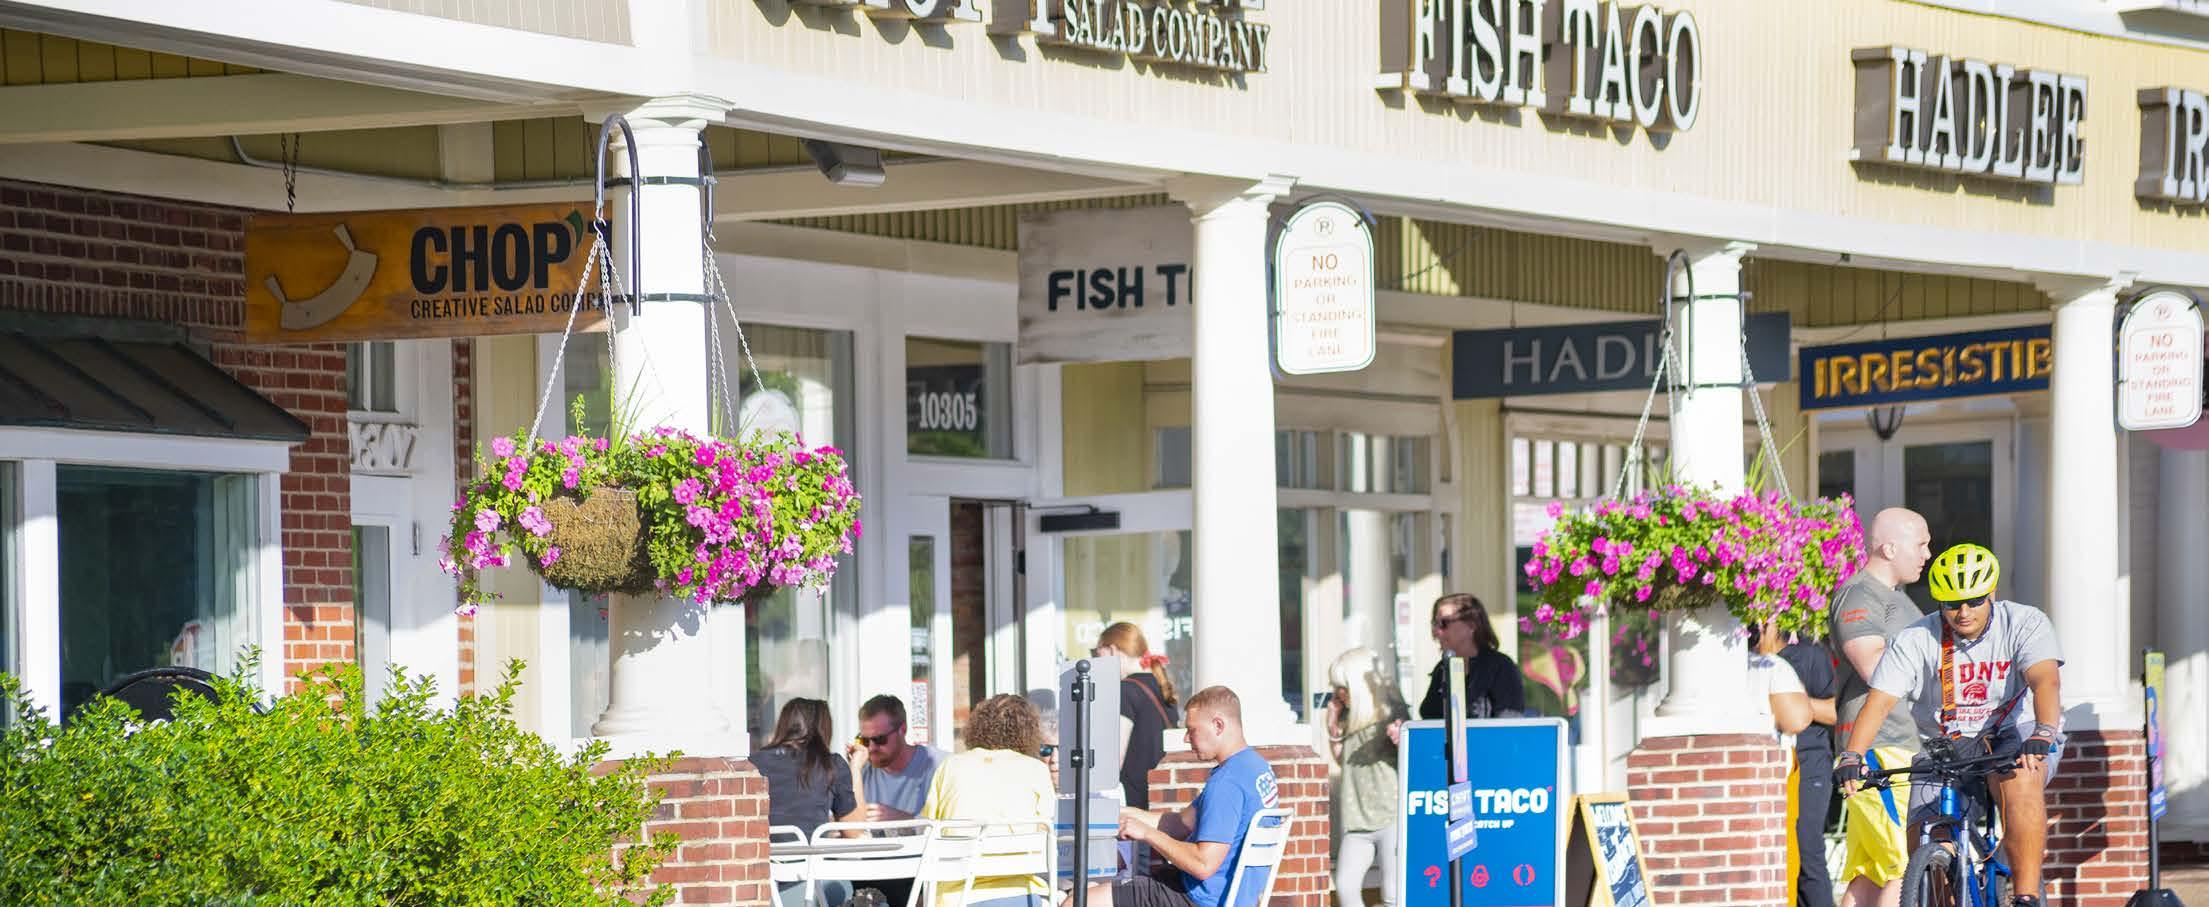
Federal is a recognized leader in the ownership, operation, and redevelopment of high-quality retail-based properties located primarily in major coastal markets from Washington, D.C. to Boston, as well as Silicon Valley and Los Angeles.
Founded in 1962, our mission is to deliver longterm, sustainable growth through investing in communities where retail demand exceeds supply. Our expertise ranges from small neighborhood shopping centers to urban, mixed-use neighborhoods and everything in between.

Our mission is supported by the environmental, social and governance (ESG) principles that we use to manage all aspects of our investments from concept to execution. We believe that ESG not only helps us be a better business but it is our business.
employees (53% women / 47% men)
8.4
319 years average tenure of employees
Information as of December 31, 2022
Santana Row | San Jose, CA
2022 properties 103 residential units 3,039 square feet of commercial space 25.9M years of average property ownership 22 5 01 / Introduction 02 / TCFD 06 / Teams 07 / Governance08 / Appendix 04 / Resilience 03 / Decarbonization 05 / Communities
Introduction

Assembly Row | Somerville, MA
United Nations Sustainable Development Goals
Federal’s ESG efforts are guided by the United Nations Sustainable Development Goals (UNSDGs). We have focused our efforts on the specific UNSDGs where our business can have the most impact, and our employees advance these goals through the valuable work we do every day.
About This Report
This report is the primary way in which we convey to our stakeholders our commitment and approach to ESG matters; it also supplements information included in our Annual Report/Form 10-K and our Proxy Statement, both of which are available on our website.
We have aligned this report with the Global Reporting Initiative (GRI) and are providing additional disclosures in alignment with the Sustainability Accounting Standards Board (SASB) and the Taskforce on Climate-Related Financial Disclosures (TCFD).
7 01 / Introduction 02 / TCFD 06 / Teams 07 / Governance08 / Appendix 04 / Resilience 03 / Decarbonization 05 / Communities
Awards and Recognition
Received MSCI ESG rating of AAA, upgraded from prior rating of BBB
Approved science-based Scopes 1 and 2 consistent temperature increase
Awarded highest rating of Gender Balanced board from 50/50 Women on Boards for 2nd consecutive year

Named Green Lease by the Institute for Market and U.S. Department
Recognized as Top Workplace by Washington Post for Corporate Headquarters and Northern Virginia regional office

science-based target for consistent with managing increase to 1.5°C
1st in peer group for operating assets Sector Leader in Development for 2nd year
Lease Leader Gold Market Transformation of Energy 2018-2024
Named Best ESG Real Estate Investment Strategy for 2nd consecutive year
Recognized for Gold Level achievement in health and wellness programs for employees
sector l eader 2022
ESTATE
REAL
9 01 / Introduction 02 / TCFD 06 / Teams 07 / Governance08 / Appendix 04 / Resilience 03 / Decarbonization 05 / Communities
A Message from our CEO

consecutive years of increased dividends. 55 CAGR7% 1967 2022 $4.32* $0.12*
Over the last several years, I have taken the opportunity in this letter to describe how ESG is embedded into everything we do, and how it has been that way for decades. We did not always call our actions ESG, but at the heart, our business practices have always accounted for environmental considerations and resiliency, centered on supporting our teams and communities and rested on strong values and governance principles.
At Federal, we operate with absolute purpose in support of our mission — to create and manage a sustainable business that generates increasing streams of cash flow and creates long-term value using well-located retailbased real estate. As we overlay an ESG lens on this mission, we have identified five key objectives that, when executed well, have the power to drive tremendous positive impact for our business and our many stakeholders.
Throughout this report, you will find detail on each of these objectives, specifically laying out why each is critical to our business goals as well as the actions we have taken and continue to take, and how each manifests in our real estate. This includes updates on our greenhouse gas emissions reduction initiatives, benefits to our community and local economies, and continued enrichment of our corporate culture.
My intent is that within the pages of this report, you better understand the deep integration of ESG within Federal, and the significant role it plays in our continued success. ESG is not a stand-alone endeavor that we do to check boxes — it is a purposeful framework that helps us to identify opportunities, manage risks and deliver superior business results.
Our 5 Key Objectives
A testament of these results is our 55-year history of annual dividend increases paid to our common shareholders, the single longest annual dividend increase record among all REITs.
The progress presented throughout this report would not have been possible without the dedication and hard work of the entire Federal family to deliver on our mission. To each of you, a heartfelt thanks for your countless contributions. And to all of our stakeholders, I thank you for your ongoing support, and look forward to keeping you apprised of our progress as we continue to partner to create sustainable growth for many more years to come.
–DON WOOD Chief Executive Officer
Empower Teams 01 / Introduction 02 / TCFD 06 / Teams 07 / Governance08 / Appendix
04 / Resilience
03 / Decarbonization 05 / Communities
Govern Responsibly Advance Decarbonization Strengthen Resilience Connect Communities 11

12
Assembly Row | Somerville, MA
Identifying and Managing Climate Risks
We use the framework established by the Task Force on Climate-Related Financial Disclosures to assist in the identification and management of our climate-related risks and opportunities, and to evaluate potential business impacts. Our governance around that evaluation starts with our Board of Trustees and flows through to every level of our organization.
Board of Trustees
Our Board of Trustees has overall responsibility for managing company risks and strategy, including risks relating to climate.
Executive Management
The company’s Executive Vice PresidentGeneral Counsel leads all ESG efforts for the company and reports on all climaterelated and other ESG activities, including progress on goals, to the Nominating and Corporate Governance Committee and the full Board of Trustees every quarter.
Vice President –Sustainability
The company’s Vice President of Sustainability is a professional subject matter expert dedicated to advancing our sustainability efforts. She develops and drives the implementation of initiatives to improve sustainability within the company and develops and measures progress on the company’s sustainability goals.
Nominating and Corporate Governance Committee
Our Board has delegated specific responsibility for climate risks and opportunities to its Nominating and Corporate Governance Committee. These responsibilities are specifically set forth in the committee’s charter and include responsibility for monitoring performance against climate-related goals.
Sustainability Council
The company’s Sustainability Council is a cross-functional team of senior leaders representing all operational and corporate functions within the organization. This group assists with setting ESG strategies and implementing ESG initiatives throughout the company.
13 01 / Introduction 02 / TCFD 06 / Teams 07 / Governance 08 / Appendix 04 / Resilience 03 / Decarbonization 05 / Communities
Climate Risks
Our business involves the ownership and operation of real estate assets, and as a result, our primary climate-related risks and opportunities are driven by the geographic locations of those assets.
Physical Risks
We assess current physical risk to our assets based on historical information from our ownership of these assets, supplemented by information provided in the FEMA National Risk Index and WRI Aqueduct tool.
Our exposure to any one type of physical risk is mitigated by our fundamental business strategy of maintaining a portfolio with significant geographic diversity. That geographic diversity ensures that there will be no significant impact to our income stream from any one climate-related event.
To assess future physical risk, we run scenario analyses using both RCP 8.5 and RCP 4.5 to determine the short-term and long-term potential impacts of physical risk. This assessment is updated at least annually for our entire portfolio, when needed to facilitate capital investment decisions and as part of due diligence for new property acquisitions.
In addition to the strategies outlined in the table to the right, potential impact of current and future physical risks is mitigated by:
• Continual reinvestment in our properties to maintain their good physical condition
• Active emergency response plans that are implemented when climate-related events occur
• Asset level operating plans that address physical risks unique to each asset
• Mitigation strategies incorporated into design and construction as we build and renovate our properties
More information on how we manage physical risks associated with our portfolio can be found in the Strengthen Resilience section of this report (pages 38-51).
14
• Higher water costs
• Limits on water usage
Drought
• Higher water costs
• Monitor/reduce water consumption under tenant and landlord control Water
• Limits on water usage
• Population dislocation
• Increased energy costs
• Increased capital for HVAC units
• Increased likelihood of power outage
• Business interruption
• Loss of property/ property damage
• Implement energy saving technologies
• Monitor/reduce water consumption under tenant and landlord control Heat
• Utilize HVAC systems with greater cooling capacity at exposed assets
• Increase use of solar energy
• Use higher fire-resistant materials
Sea Level Rise Low Low
• Business interruption
• Increased insurance cost
• Higher water costs
• Limits on water usage
• Population dislocation
• Loss of property/ property damage
• Business interruption
• Increased insurance cost
• Reduced property activity and access
• Loss of property/ property damage
• Business interruption
Windstorm Low Low
• Increased insurance cost
• Reduced property activity and access
• Smart location of critical equipment
• Flood insurance, as necessary
• Use air-purifying technologies Flooding
• Smart location of critical equipment
• Flood insurance, as necessary
• Smart location of critical equipment
• Flood insurance as necessary
• Backup power sources for at-risk assets
* Measured as percentage of budgeted 2023 property operating income (“POI”) using RCP 8.5. Low means at least 70% of POI is from properties in areas identified as low risk. Medium means that 30%-70% of POI is from properties in areas identified as medium risk. High means that 70% or more of POI is from properties in areas identified as high risk. Water stress risk for longer-term is as of 2040.
Physical Climate Risk Risk Level 2030* Risk Level 2050* Potential Business Impact
Risk Management Strategies
Low Low
Low Medium
Stress
Stress Low Medium
Low Low
Wildfire
Low Low
15 01 / Introduction 02 / TCFD 06 / Teams 07 / Governance 08 / Appendix 04 / Resilience 03 / Decarbonization 05 / Communities
Transition Risks
The assessment of risk related to the transition to a low carbon economy is highly dependent on the jurisdictions where we do business. We continually monitor regulatory actions at the federal, state and local levels in each jurisdiction where we own properties. Our assessment has led us to conclude that there is no one single transition risk that would materially impact our business.
More information on how we manage transition risks associated with our portfolio as well as our metrics and targets, can be found in the Advance Decarbonization section of this report (pages 20 – 37) and the GRI Index (pages 106-114).
New/Enhanced Reporting Requirements
Building Performance Standards
Carbon Neutrality Regulatory Mandates
1-10 years
• Increased costs of additional staff, potential fines, etc.
1-10 years
• Increased capital costs to comply
• Potential fines for failure to comply
10+ years
• Increased capital costs to comply
• Physical obsolescence
Reputation
1-10 years
• Less availability/higher cost of capital if not meeting investor "green" expectations
• Loss of tenants/revenue if not meeting "green" expectations
Strategies
• Advance preparation and strong reporting infrastructure
• Ongoing investment in energy efficiency upgrades
• Continual reinvestment in assets
• Ongoing efforts to reduce GHG emissions
• Newer buildings designed/ built more efficiently
• Commitment to achieve net zero emissions for Scope 1 & 2 by 2050
• Ongoing discussions with investors/lenders
• Active management of all aspects of ESG
RiskTime FramePotential
Transition
Business Impact Risk Management
16
Fresh Meadows Place | Fresh Meadows, NY 17 01 / Introduction 02 / TCFD 06 / Teams 07 / Governance 08 / Appendix 04 / Resilience 03 / Decarbonization 05 / Communities
Climate Opportunities
Market Based
Competitive advantage of properties located in markets where public and private sectors are collectively investing in infrastructure to improve resilience and manage GHG emissions
• Improved infrastructure enhances resiliency of our individual assets
• Financial incentives available to invest capital needed to make resilience and decarbonization investments
Reputation
Improved access to capital and employee satisfaction from being a leader in addressing climate change
• Potential new sources of capital from ESG-focused funds and other equity investors with ESG criteria
• Improved ability to recruit and retain talent as a result of commitment to ESG initiatives
Improved Property Values
Increased demand for our properties based on “green” characteristics
• Property of choice for tenants working to meet their own decarbonization and other ESG goals
• Ability to charge higher rents for “green” assets
• Less downtime from climate-related weather events because of resilience improvements
• Greater demand for assets with green certifications
Lower Costs
Decrease in costs for operating our assets and our company as a result of investment in resiliency and decarbonization
• Cost savings from lower energy and water usage
• Lower costs of insurance for properties with mitigated climate risk and lower history of loss frequency and severity
• Lower cost of capital as a result of being able to participate in green financing structures
18

"Pike & Rose was an ideal choice for our new U.S. headquarters. The combination of LEED Gold Certifications for the neighborhood and the building, an amenity rich, walkable neighborhood to support our employees, and an ability to build out our space to maximize efficiencies and limit waste are all in line with Sodexo's sustainability ambitions.”
” Pike & Rose | North Bethesda, MD 19 01 / Introduction 02 / TCFD 06 / Teams 07 / Governance 08 / Appendix 04 / Resilience 03 / Decarbonization 05 / Communities
Tina Burke, VP HR, Sodexo North America, Future Office Tenant at Pike & Rose
Why


carbon footprint of
company and our assets
Advance Decarbonization Objective Minimize the
our
GRI 3-1, 3-2, 3-3, 302-1, 302-2, 302-3, 302-4, 305-1, 305-2, 305-3, 305-4, 305-5 CocoWalk | Coconut Grove, FL
We cannot achieve our mission to deliver long-term sustainable growth unless we smartly manage the potential financial impacts of transitioning to a low carbon economy
5.1M
Net Zero
reduction of
1 & 2 GHG
electric
Scope
emissions since 2019 32%
consumption from zero carbon sources in 2022 55% solar generating capacity at 25 properties 14MW square feet of LEED certified buildings completed and in process
goal
21 01 / Introduction 02 / TCFD 06 / Teams 07 / Governance 08 / Appendix 04 / Resilience 03 / Decarbonization 05 / Communities
for Scope 1 & 2 emissions by 2050

Pike & Rose | North Bethesda, MD
We believe that effective management and minimization of our carbon footprint supports the transition to a low carbon economy and furthers our ability to deliver long-term sustainable growth.
2022 Emissions Footprint
Includes energy and emissions data for all assets owned and operated during 2022, but excludes assets sold in 2022. In alignment with the GHG protocol, we have included 12 months of data for the assets acquired during the reporting period. Scope 1 & 2 total emissions data has been assured by LRQA. Please see pages 104-105 for full assurance statement, and GRI Index indicators 305-3 on page 112 for specifics on what is included in Scope 3 and how it was calculated.
Our comprehensive approach to managing our greenhouse gas (GHG) emissions requires that we assess our footprint taking into account whether each asset is fully operational, newly developed, or newly acquired. This allows us to target our actions to address emissions at each stage of ownership and to react meaningfully to year-over-year changes without outlier impact.
We also focus on location and market based emissions. Focusing on location based emissions allows us to measure the results of specific actions we are taking to improve energy efficiency and lower emissions from our assets in support of our long-term net zero goal, while evaluation of market based emissions provides insight into the effectiveness of our energy procurement strategy.
Scope 1 & 2 (MTCO2e) Scope 3 (MTCO2e) New Developments 943 943 2,684 2,684 Operating Assets 24,321 12,952 193,676 190,827 Aquisitions 13,722 13,722 1,843 1,843 TOTAL 210,082 207,233 27,108 15,738 Location Based Market Based Location Based Market Based
23 01 / Introduction 02 / TCFD 06 / Teams 07 / Governance 08 / Appendix 04 / Resilience 03 / Decarbonization 05 / Communities
Scope 1 & 2
GHG Emissions

Our Goals
Reduce Scope 1 & 2
market-based GHG emissions by 46% by 2030 compared to 2019 baseline
Approved by Science Based Target initiative
emissions for Scopes 1 & 2 by 2050
Achieve Net Zero Assembly Row | Somerville, MA
Our target for reducing Scope 1 and 2 GHG emissions aligns with climate science for avoiding a global temperature increase of 1.5 degrees Celsius. Through 2022, we made significant progress toward achieving our interim 2030 science-based target as we work towards our long-term objective of net zero Scope 1 and 2 by 2050.
GHG Emission Reduction Targets (MTCO2e)
2050 NET ZERO LONG-TERM TARGET 2019 5K 10K 15K 20K 25K 2022 2030 46% REDUCTION INTERIM TARGET 32% REDUCTION ACHIEVED
25 01 / Introduction 02 / TCFD 06 / Teams 07 / Governance 08 / Appendix 04 / Resilience 03 / Decarbonization 05 / Communities
Reduction Strategies
We have used a number of strategies to achieve our Scope 1 and 2 GHG emissions reductions through 2022, and we expect to continue executing these strategies to achieve our near-term 2030 reduction target and longterm net zero goal.
Energy Efficiency Improvements
Our single greatest lever to reduce both location based and market based Scope 1 and 2 GHG emissions is improving energy efficiency at our properties. We established a target to reduce landlord controlled electric consumption by 15%, compared to a 2019 baseline, in our like-for-like portfolio of operating assets by 2025. Through 2022, we have achieved an 8% reduction. Our like-for-like portfolio includes approximately 78% of our total square footage in 2022.
The primary driver of energy efficiency in our operating portfolio is upgrading all landlord controlled lighting to LED. This concerted effort to complete LED upgrades across all of our assets is funded by a dedicated budget established by our CEO. To date, over 90% of our properties are fully upgraded to LED, or are in process of being fully upgraded.
We also identify opportunities for lighting upgrades and other energy efficiency improvements during the due diligence process when we acquire new operating assets. A budget for necessary upgrades is then incorporated into the underwriting and capital planning for that asset once it is acquired.
For our development and redevelopment projects, we incorporate LED lighting and other energy efficiency measures directly into the design and construction of the project.
 Andorra Shopping Center | Philadelphia, PA
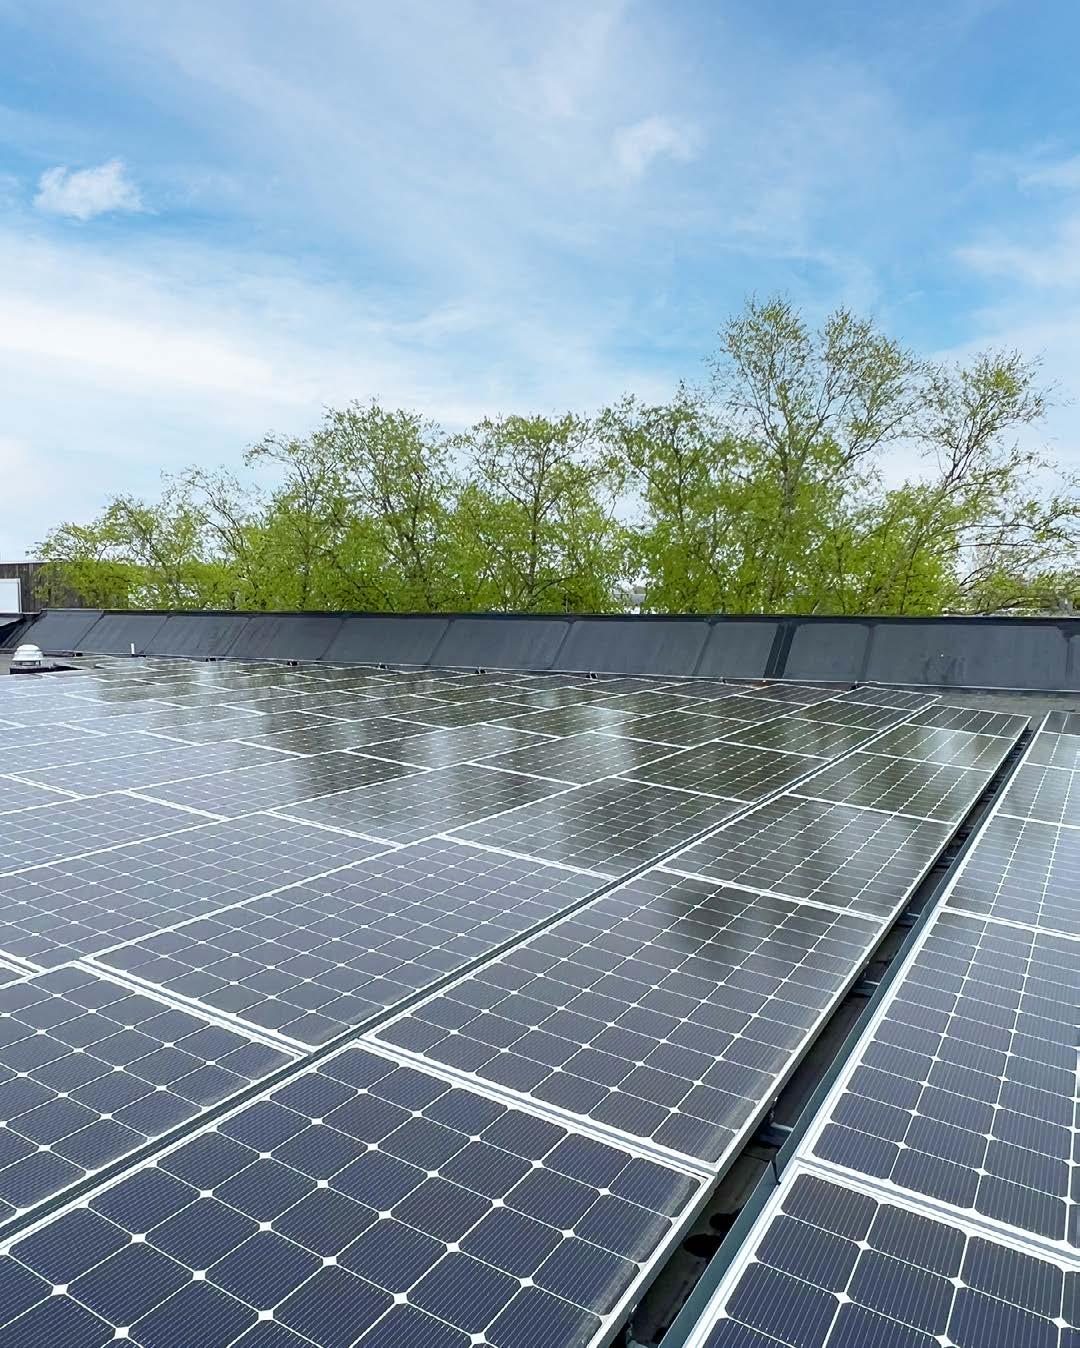
Deploy Rooftop Solar
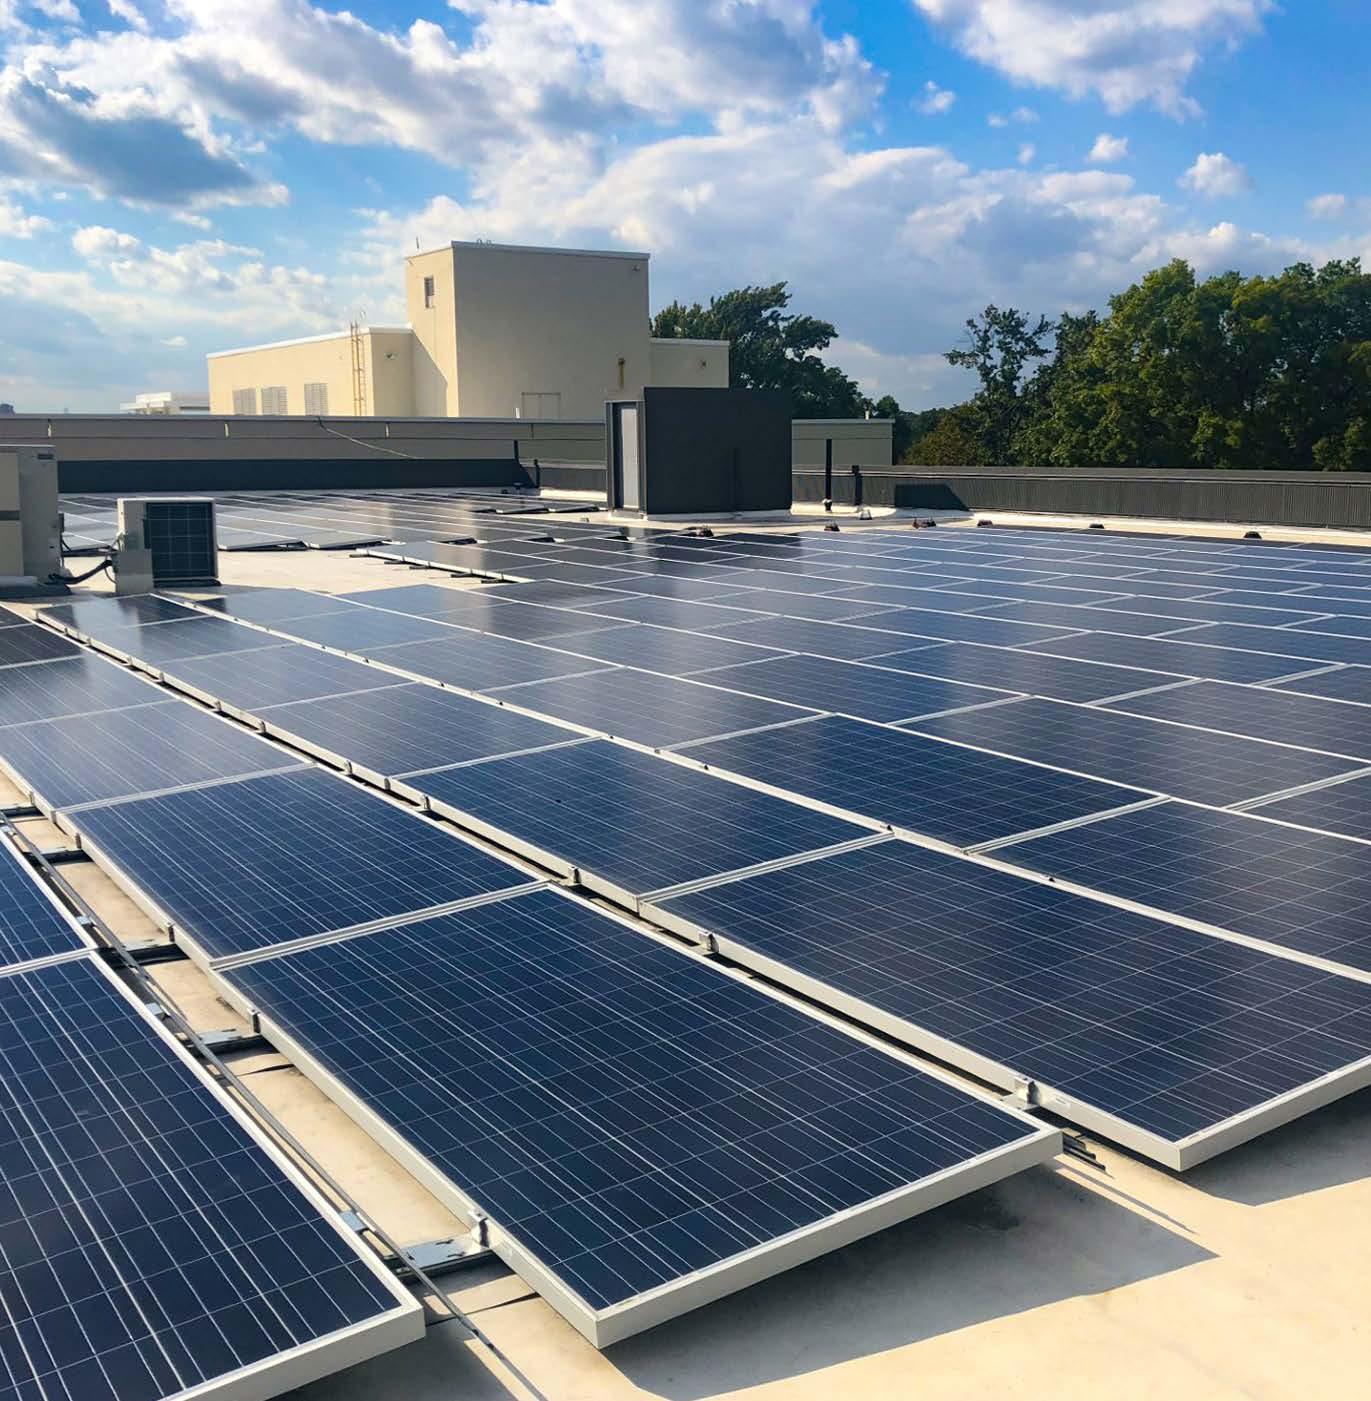
We currently own and operate solar arrays at 25 properties in seven states. All but a small portion of the solar power generated on our properties is used at the property by either us or our tenants, directly contributing to both location based and market based emissions reductions within our own portfolio.
Use of On-Site Solar Power Tenant Spaces

We have grown our solar portfolio considerably since our first installation in 2012 and now have over 14 MW of generating capacity, the largest generating capacity of any publicly traded shopping center REIT.* Identifying additional locations to expand our solar energy production capabilities is a routine part of managing our operating portfolio and of evaluating new assets for acquisition and development. We are about to begin construction on new solar installations that will add an additional 1 MW of generating capacity with an additional 4 MW of potential generating capacity under evaluation.
*Based on the Black Bear Energy Solar Leaderboard report published in May 2023.
Sent To Grid Common Area
Pike & Rose | North Bethesda, MD 27 01 / Introduction 02 / TCFD 06 / Teams 07 / Governance 08 / Appendix 04 / Resilience 03 / Decarbonization 05 / Communities
Reduction Strategies
Energy Grid Improvements
The vast majority of our assets are located in jurisdictions where utility companies have made or are expected to make significant investments in the ‘greening of the grid', and we are a direct beneficiary of those investments.
As utility grids continue to transition to renewable energy sources, we expect our location and market based emissions associated with electricity use from those grids to decrease and support our progress toward both our interim 2030 emissions reduction target and our 2050 net zero goal.
Already, a 3% reduction in Scope 2 GHG emissions occurred from 2019 to 2022 with our Maryland and New Jersey properties, representing about onethird of our total portfolio, solely as a result of the shift to a ‘greener’ grid.
 Plaza del Mercado | Silver Spring, MD
To further reduce our market based emissions, we leverage our strategic locations in deregulated energy markets to procure electricity, at little to no incremental cost, from third-party suppliers that generate energy from renewable or zero carbon sources. This green-focused procurement strategy has been part of our energy procurement practices for more than 11 years. New development projects and new acquisitions are incorporated into green supply agreements as soon as we are able to fully maximize the benefits of participation.
Energy Procurement 04 / Resilience
03 / Decarbonization 05 / Communities
% 01 / Introduction 02 / TCFD 06 / Teams 07 / Governance 08 / Appendix

of electricity used by Federal in 2022 was from zero carbon sources
55 Barracks Road | Charlottesville, VA 29
Scope 3 Emissions
Scope 3 indirect emissions represent the most significant portion of our company’s total carbon footprint. We are focused on measuring and reducing emissions generated by our tenants, emissions from waste at our properties, and emissions generated by employee business travel and commuting.
2022 Scope 3 GHG Emissions
Tenant Electric 75%
203,787 MTCO2e Tenant Natural Gas 13%
Tenant and waste generated emissions represent emissions during time of property ownership.
at Properties 11%
Employee Travel and Commuting 0.4%
Waste
Tenant Emissions
Our tenants comprise the largest share of our Scope 3 emissions, and as such, we actively work with our tenants to help them reduce emissions from their businesses.
Approximately 58% of 2022 Scope 3 tenant emissions is based on actual data from the local utility, from the tenant directly, or from utility accounts where we bill back tenants for their usage. The remainder of usage is estimated using data from the Commercial Building Energy Consumption Survey (CBECS) and is applied to the specific tenant’s use of the space and property location.
31 01 / Introduction 02 / TCFD 06 / Teams 07 / Governance 08 / Appendix 04 / Resilience 03 / Decarbonization 05 / Communities
Mercer Mall | Lawrenceville, NJ
Tenant Emissions
We employ a number of strategies that are intended to help our tenants reduce emissions from their operations at our properties.
Building Out Tenant Spaces
When designing and constructing the space for our tenants, whether retail, office or residential, we rely on our Green Box™ standards that were first developed in 2008. These standards set out criteria for ways in which the space can be designed and constructed to maximize energy efficiency and otherwise reduce emissions and impact on the environment.
Green Lease Language
Key criteria in our commercial Green Box™ guidelines that apply to retail and office spaces include LED lighting, high efficiency HVAC units and low-organic volatile paints. These criteria are supplemented by our Green Box™ standards for residential units to include energy efficient appliances and water efficient bathroom and kitchen fixtures. Our design and construction standards and tenant handbook provide additional recommendations for tenants to operate their spaces more efficiently.
Numerous provisions in our leases are designed to ensure alignment between Federal and our tenants on sustainability objectives and investments, including data collection, submetering and costsharing. We have updated our lease language to ensure that both our company and our tenants are prepared for potential impacts of local building energy performance standards that are being adopted by a number of jurisdictions.
2018 - 2024
Tower Shops | Davie, FL
Solar Power Purchase Agreements
Where possible, we provide tenants with the opportunity to purchase solar power directly from the rooftop at the property where they lease space. This option helps support the financial investment to install the solar array, provides tenants a means to achieve their own emissions goals and reduces overall emissions of the property. We currently have 21 of these agreements in place, covering approximately 40% of the solar power we generate.
Green Power Procurement
We pass on to our tenants wherever possible the benefits of our purchasing zero carbon power. In 2022, 31% of the electricity we supplied to our tenants was from onsite solar arrays and other zero carbon power sources.

 Brick Plaza | Brick, NJ
33 01 / Introduction 02 / TCFD 06 / Teams 07 / Governance 08 / Appendix 04 / Resilience 03 / Decarbonization 05 / Communities
Congressional Plaza | Rockville, MD
Design and Construction Activities
Scope 3 emissions from our construction-related activities include construction of new buildings as well as renovations of existing assets. We have an intense focus on designing buildings to maximize efficiency and minimize emissions from operational activities over the long life of the asset. We also design our buildings so they will be resilient to both climate and market changes over time.
In recent years, we have focused more intently on emissions generated from the construction process itself and specifically on the embodied carbon from those projects.
On the only two major construction projects started since 2018, we have measured the embodied carbon using a life cycle assessment to help us better understand the impact of design and material choices. Based on those assessments, we have estimated that the choices we made reduced the embodied carbon for those buildings by approximately 19%.
We are not yet reporting emissions from our construction activities in our aggregate Scope 3 emissions data, and do not anticipate reporting that data until we able to more accurately collect, estimate and report on these emissions, particularly for our many smaller construction projects.
LEED Certifications
Of the approximately 4.6 million square feet of significant new buildings that we have constructed and delivered over the past 10 years, approximately 80% of that square footage earned a LEED certification, demonstrating our commitment to higher levels of energy efficiency and other sustainability measures.
total SF* 5.1M
invested* $2.4B
*buildings that have achieved or are expected to achieve LEED certification
Spotlight
CocoWalk | Coconut Grove, FL
Design and Development Principles
No greenfield development; prioritize urban revitalization
Prioritize energy and water efficiency as part of an integrative design process
Use Green Box™ standards for tenant space design and buildout
Target LEED Gold certification for all new office developments
Targeted Strategies
Energy + Water
Project-wide LED lighting
White or green roofs
On-site renewable energy
EV charging stations
Stormwater management
High-efficiency flush and flow fixtures
Materials
Reuse materials already on site
Measure and reduce embodied carbon in materials
Divert at least 75% of waste from landfill
Target LEED or other certification on all new residential projects
Social Impact
Walkability of property to and within site
Community gathering places
Health and wellness features
Biophilic design
35 01 / Introduction 02 / TCFD 06 / Teams 07 / Governance 08 / Appendix 04 / Resilience 03 / Decarbonization 05 / Communities
Business Travel and Employee Commuting

A small portion of our scope 3 emissions profile comes from employee business travel and commuting. Efforts to minimize our footprint in this category include utilizing teleconferencing capabilities in lieu of in person meetings to reduce travel, positioning our largest offices within blocks of major public transit stops and providing team members the ability to work from home – all of which benefit our emission footprint while supporting employee retention.
Waste
Waste generated from our assets is a significant contributor to our Scope 3 emissions with 21,575 MTCO2e generated in 2022. Although most of the waste at our assets is generated by the activities of our tenants, we are responsible for removal of the waste, and as a result, include the full impact of waste generation and removal in our reporting. See a more detailed discussion of our waste management activities on pages 46-47.
Westpost | Arlington, VA
Electric Vehicle Charging Stations
Throughout our portfolio, we are supporting the transition to a low carbon economy by installing electric vehicle charging stations. We have installed nearly 425 EV charging stations with more in progress at our properties across the country.
750
estimated metric tons avoided emissions in 2022
85K
estimated gallons of gasoline saved in 2022
03 / Decarbonization 05 / Communities
1.2M 01 / Introduction 02 / TCFD 06 / Teams 07 / Governance 08 / Appendix
04 / Resilience
Spotlight
square feet of IREM certified sustainable property Birch & Broad | Falls Church, VA 37
Strengthen Resilience
Objective
Protect our assets from increasing frequency and severity of weather-related events and other hazards of climate change
Why
Delivering long-term sustainable growth in cash flow and asset value requires that our assets be able to minimize cost, damage and down-time from weather and climate-related events
GRI 2-9, 2-12, 2-13, 2-14, 2-16, 2-17, 3-1, 3-2, 3-3, 201-2, 201-3, 303-5, 304-1, 304-2, 306-3, 306-4, 306-5
Willow Lawn | Richmond, VA
< $200K
total damage incurred in last 3 years from climate and weather events
92%
waste diversion rate recent LEED buildings
100%
of acquisitions since 2020 included a climate risk analysis during due diligence
45%
properties with real time water usage monitoring
No greenfield development helping protect biodiversity
39 01 / Introduction 02 / TCFD 06 / Teams 07 / Governance 08 / Appendix 04 / Resilience 03 / Decarbonization 05 / Communities
The expected increase in frequency and severity of weather-related events and the potential impact to resource availability due to climate change make it more important than ever that our assets be well-positioned to withstand events and minimize related financial impacts.*

Resilience:
* See our TCFD disclosure on pages 12-19 in this report for more detailed information on our management of climate-related risks.
“The capacity of a community, business, or natural environment to prevent, withstand, respond to, and recover from disruption.”
– U.S. Climate Resilience Toolkit
Gaithersburg Square | Gaithersburg, MD
Investment in Our Assets
As a long-term owner of real estate, we have always had an intense focus on protecting and enhancing the value of our assets. For us, that means aggressive management and continual reinvestment in those assets to ensure that they remain in good physical condition.
It also includes maintaining property-specific plans for preparation in advance of a weather or other climaterelated event, management through that event and recovery after that event. The ability to have our properties fully open and operating as quickly as possible after an event is critical to minimizing losses for our business, our tenants and local communities.
Supported by the Community
Minimizing loss from a climate event requires that the local community also be resilient and able to recover quickly with restoration of utility service, availability of transit and other critical services and infrastructure. Our properties are largely located in areas that are positioned to recover quickly which will help to minimize the negative financial impacts from such events.
$22M ongoing maintenance
Minimizes damage from storms and other events
$342M new construction and renovation
33%
assets in locations with high
community resilience
Percentage of 2023 budgeted POI using FEMA National Risk Index Community Resilience scores
03 / Decarbonization 05 / Communities
Average Annual Property Investment 2018-2022 01 / Introduction 02 / TCFD 06 / Teams 07 / Governance 08 / Appendix
04 / Resilience
Complies with current building codes and current best practice in design and construction 41
Incorporating Resilience into Design and Construction
Improving the resilience of our assets over the long term is a key consideration as we reinvest in our assets.
Key Design and Construction Considerations
No Greenfield Development
Prioritize urban revitalization on contaminated sites or land already developed in order to preserve and improve natural habitats
Prioritize Water Efficiency
Use high efficiency flush and flow water fixtures for tenant spaces and common areas
Manage Waste
Drive aggressive recycling with objective to divert at least 75% of construction waste from landfill
Building Certifications
Target LEED Gold certification for all new office and LEED or other certification for all new residential projects
Prioritize Energy Efficiency
Prioritize energy efficient lighting and HVAC, white or green roofs and onsite renewable or other clean energy sources
Reuse of Materials
Reuse existing building structures and other on-site materials
Stormwater Management
Incorporate stormwater management techniques that help to preserve fresh water supplies and protect integrity of local watersheds
Assess Climate Risk
Incorporate impact of potential future physical climate risk into design and construction
Focus on Stormwater Management
Darien Commons | Darien, CT
Darien Commons is located at the low point of a 125acre watershed and less than two miles upstream from the Long Island Sound. As the redevelopment of this property was designed and constructed, the team took into account our climate risk assessment that identified the property as being a high risk for flooding in both the short- and long-term.
As a result, we incorporated in the redevelopment the installation of a large stormwater management vault that is expected to significantly mitigate current and future flooding risk for both our property and the surrounding community. In addition, this stormwater vault was designed to treat the stormwater runoff flowing into the Long Island Sound, which is projected to reduce pollutants at a rate four-fold higher than the existing condition.
Not only did this investment make financial sense for us as part of our overall redevelopment of the property and improvement of its long-term resilience, but it has activated redevelopment opportunities for other property owners in the immediate area—a result which in our experience shows will also help increase the value of our property over time.

Spotlight
43 01 / Introduction 02 / TCFD 06 / Teams 07 / Governance 08 / Appendix 04 / Resilience 03 / Decarbonization 05 / Communities
Darien Commons | Darien, CT
Preservation and Protection of Natural Resources
Water
Reducing our water consumption supports the long-term resilience of our properties and the local communities. Today, 27% of our total square footage and 22% of property operating income (POI) is in areas with high risk of water stress, making our efforts around water efficiency critical.
One of our most effective tools for managing water consumption is real-time data monitoring through use of automatic meter readers. These meters allow us to monitor water consumption every 15 minutes and immediately provide alerts when usage is above normal so that leaks and other issues can be addressed quickly. We have installed automatic meter readers at about 45% of our properties with the intention of increasing that percentage over time.
Other water consumption management techniques we use throughout our portfolio include installation of water-efficient fixtures and smart irrigation controls where possible, planting of drought tolerant and native landscaping, use of proactive maintenance on all water-related systems, and use of grey water for property cleaning.
8%
reduction
in like for like landlord controlled water usage between 2021 and 2022
Managing Water Usage
Chelsea Commons | Chelsea, MA
Our automatic meter reader identified abnormally high water consumption in a tenant space. The immediate alert from the meter allowed us to work with the tenant to identify and repair a leak. We estimate that the tenant’s water usage would have been approximately 6,700 gallons higher for each and every day that the leak had gone undetected.
Spotlight
Saving Water Through Simple Solutions
Santana Row | San Jose, CA
The closed loop chiller system at Santana Row supplies heating and cooling for virtually all of the 1.2 million square feet of commercial space, the 213 room hotel and the 834 residential units at the property, making it the single largest user of water in our portfolio. Through aggressive management and adjustments to the chiller system, the team has reduced the total water consumption of the system by an estimated 20% annually.
Spotlight
Chlesea Commons | Chelsea, MA
45 01 / Introduction 02 / TCFD 06 / Teams 07 / Governance 08 / Appendix 04 / Resilience 03 / Decarbonization 05 / Communities
Santana Row | San Jose, CA
Preservation and Protection of Natural Resources
Waste
Waste management, whether at our operating properties or as part of our design and construction activities, is essential to our resilience as it works to preserve natural resources and minimize the negative effects of pollution and emissions.

Operating Assets
At our operating properties, we actively manage our waste streams through methods that include using appropriately-sized equipment, coordinating waste management efforts with our tenants, collaborating with local restaurants to reduce food waste and hosting book and clothing bins for donations of used items to promote recycling and reuse. We estimate that we diverted about 30% of the waste generated on our properties from the landfill in 2022.
In 2022, we initiated a pilot waste management program at our assets in California with an objective to improve accuracy of data, increase diversion rates, reduce cost, and prepare for expected reporting and other regulatory requirements. After 12 months, we are seeing results with better quality data and cost savings estimated to be in the range of $400,000 annually at just our California assets. While we are too early in the project to fully evaluate the impact on our diversion rates, we are confident that we will be better positioned to improve our overall waste management and diversion rates over the long-term.
We have also had in place for more than a decade an active program to collect and recycle fryer oil, waste cooking oil and grease trap materials from restaurant and other tenants. Those waste products are then turned into raw materials that can be used to manufacture new products such as animal feed and biodiesel fuel. This program was active in 2022 at 18 of our Maryland and Virginia properties resulting in nearly 200,000 net pounds of cooking-related waste being reused instead of being sent to a landfill.
The Avenue at White Marsh | Baltimore, MD
Design and Construction
Waste management is also an important part of our design and construction process, both in tenant spaces and newly constructed buildings. No matter the scale of the construction project, we place a high priority on smart use of building materials and diversion of construction waste and debris from landfills.
Our tenant construction team is aggressively managing the reuse of materials as we turn over spaces to new tenants. Numerous examples abound where materials left in a tenant space –from hardwood flooring to furniture and equipment – are donated to local causes, sold or reused in the space. Even landscaping that is displaced by a tenant during buildout is replanted in other locations at the property.
The results of our efforts to divert construction waste and debris can be seen at our four most recently completed LEED Gold certified buildings comprising over 1.6 million square feet.
19K+
tons waste avoided landfill
92%
waste diversion rate
47 01 / Introduction 02 / TCFD 06 / Teams 07 / Governance 08 / Appendix 04 / Resilience 03 / Decarbonization 05 / Communities
Biodiversity
We believe that real estate investment, development and operations should maintain a deep appreciation for the natural environment and protect local ecosystems. Our commitment to biodiversity can be found throughout our portfolio with much of it learned from our experiences at Pike & Rose where biodiversity features contributed to the property receiving a LEED for Neighborhood Gold certification and being named as the 2019 Best Sustainable Project by NAIOP’s DC/MD chapter.

No Greenfield Development
Best Practice
We develop exclusively on contaminated sites or on land that has already been developed to avoid disturbing natural habitats and to improve them.
How it’s applied at Pike & Rose
Before its transformation, Pike & Rose was a traditional strip shopping center on 23 acres of asphalt.
Stormwater Management & Water Conservation

Best Practice
Efforts at our properties around water conservation help to ensure sufficient fresh water and proper stormwater management preserves the integrity of local watersheds.
Bee Colonies
Best Practice
Bee colonies help repopulate local bee populations and provide fresh honey to people at the property, while also contributing to research for the long-term health of bees given their key role as pollinators.

How it’s applied at Pike & Rose
A combination of more than 21,000 cubic feet of green roof space and underground silva cells that house more than 43,000 cubic feet of soil were incorporated into the stormwater management system. The silva cells treat nearly all of the stormwater on site to reduce pollutants flowing to the Chesapeake Bay with the soil absorbing the water, which then provides water directly to the trees onsite. It is estimated that the stormwater management system at Pike & Rose prevents over 75% of stormwater from running off into local watersheds.
How it’s applied at Pike & Rose
Pike & Rose houses bee colonies to help pollinate the crops on the rooftop farm at the property, and provide research data about local bee populations.
49 01 / Introduction 02 / TCFD 06 / Teams 07 / Governance 08 / Appendix 04 / Resilience 03 / Decarbonization 05 / Communities
Biodiversity
Native Landscaping
Best Practice
Use of native and pollinator friendly landscaping at our properties helps local species thrive, and reduces the need for more water intensive irrigation.
How it’s applied at Pike & Rose
The combination of green roofs, native plantings and other sustainable irrigation on site is estimated to reduce potable water consumption at Pike & Rose by 96% versus typical commercial landscaping and irrigation, and help local species flourish.

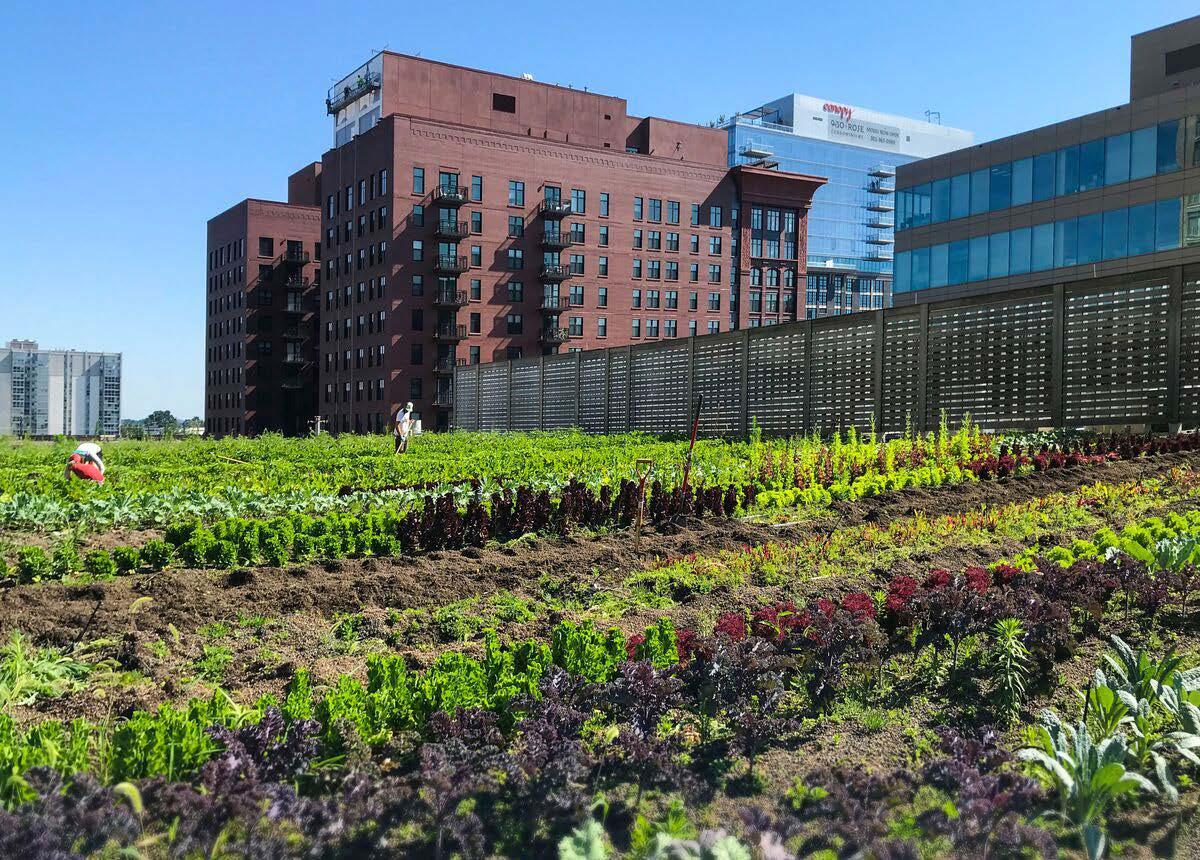
Local Farming
Best Practice
We support local efforts to protect biodiversity through the roof-top farms at some of our properties.
How it’s applied at Pike & Rose
The 17,000 square foot farm at Pike & Rose is the largest roof-top farm in the Mid-Atlantic and generates over 10,000 pounds of produce annually that is donated to local food charities.
51 01 / Introduction 02 / TCFD 06 / Teams 07 / Governance 08 / Appendix 04 / Resilience 03 / Decarbonization 05 / Communities
Connect Communities
Objective
Use our real estate to contribute to social and economic prosperity of the community and advance social equity
Why Properties that serve the local community improve the economic wellbeing of the community which in turn, improves the cash flow and value of our properties over the long-term

GRI 3-1, 3-2, 3-3, 201-1, 413-1 Assembly Row | Somerville, MA
Catalyzing economic impact by investing in our properties programs and community events hosted at our properties in 2022 300+ of employees work at offices located at Federal Realty properties 91% affordable housing units provided at our properties ~325 invested with Primestor in historically underrepresented communities since 2017 $450M 53 01 / Introduction 02 / TCFD 06 / Teams 07 / Governance 08 / Appendix 04 / Resilience 03 / Decarbonization 05 / Communities
Sustainable Economic Impact
When real estate truly meets the needs of the community, the local economy is more prosperous and the real estate is more valuable. This perpetual cycle allows the property and the community to continually lift each other and create sustainable, positive impact over time.
Investment
Invest and reinvest in the real estate
Value
Increase in property value supporting additional investment
Community Connection
Integration
Integrate with community through art, tenants, philanthropy and experiences
Growth
Acceleration of growth in the surounding area through new investments
Prosperity
Increase in economic activity and opportunities in the community

Pike & Rose | North Bethesda, MD 55 01 / Introduction 02 / TCFD 06 / Teams 07 / Governance 08 / Appendix 04 / Resilience 03 / Decarbonization 05 / Communities
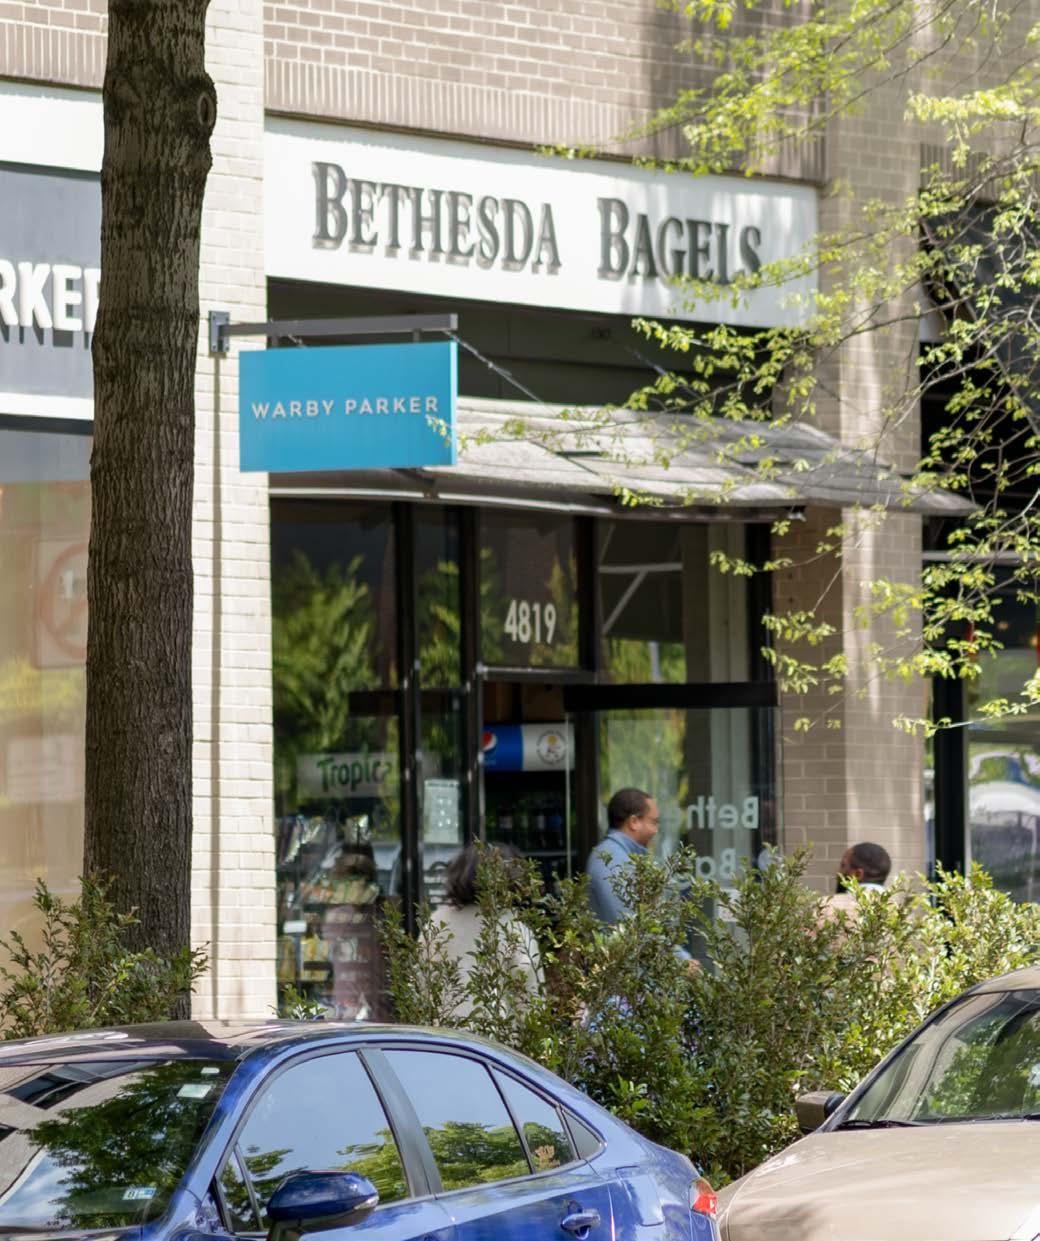
Bethesda Row –A Quarter Century of Prosperity
The view outside of Federal’s corporate headquarters in 1993 included underused shops, low-rise office buildings and surface parking. Inspired by the possibility of converting this neglected area of downtown into a vibrant shopping and entertainment district, we began acquiring and redeveloping the 17 acres now known as Bethesda Row.
With input from local residents and a public-private partnership sharing a vision for the future, Bethesda Row has become one of the most significant economic contributors to the county, continuing to increase in value and to spur tremendous economic growth for the surrounding area since first redeveloped in 1997.
Economic Impact Since Redevelopment
 Shows absolute percentage change between 2000 and 2022 based on ESRI demographic information for a 5-mile radius around Bethesda Row and sales information from Urban Land Institute and Federal for 2000 and 2022, respectively.
Case Study
median household income +103% median home value +188% retailer sales +270%
“I grew up in this area and am amazed by the transformation of this district that started with Bethesda Row. The combined vision of Federal Realty and the community has created what I believe is one of the finest, most vibrant, walkable neighborhoods. Bethesda Row defines this community and led a broader revitalization of the area, allowing us to achieve our county-wide priorities.”
Andrew Friedson Council Vice President, Montgomery County MD Council
Growth Since Redevelopment*
Actual new commercial square footage
Future
+930K
new residential units +1,000
+375K
approved new commercial square footage
approved new residential units +1,300
*As of December 31, 2022. Covers approximately 16 blocks that are adjacent to and part of the Bethesda Row District
”
57 01 / Introduction 02 / TCFD 06 / Teams 07 / Governance 08 / Appendix 04 / Resilience 03 / Decarbonization 05 / Communities
Bethesda Row Case Study
Social
For 25 years, the Bethesda Row Arts Festival has turned the district into a premier outdoor art gallery, featuring juried fine arts and crafts. This two-day event now attracts more than 25,000 patrons and is recognized as one of the top 30 fine arts shows in the United States.

Source: Fair Sourcebook
Transit
With a walk score of 98, Bethesda Row has been recognized by the EPA as a case study for creating a walkable neighborhood. The property is served by both subway and light rail transit within 2 blocks and has an 11 mile hiking/biking trail through it for recreational and commuting use by local residents.

Environmental
Bethesda Row was a suburban retrofit of existing buildings that has earned designation as an IREM Certified Sustainable Property. It includes a 6,400 square foot rooftop farm located atop a 48,000 square foot LEED certified building that supplies herbs to the restaurants at the property.
Local Tenant Bethesda Bagels
“We opened our first location in 1982 before the redevelopment, and we’re happy to say that we are still here – the longest, original tenant of Bethesda Row. Our family and business has grown alongside this community, and we are still as in love with the area now as we were the first time that we visited.”
Federal’s redevelopment of Bethesda Row epitomizes the creation of a sustainable community that began nearly three decades ago, long before concepts of ‘sustainability’ were fully mainstream. It established the foundation for growing a strong and prosperous surrounding economy and that strong economy has enhanced the value of the real estate. Today, this socially, culturally and environmentally minded redevelopment continues to propel the community.
Bethesda Downtown Plan
Adopted May 2017
 The Fleishmans, Owners of Bethesda Bagels Bethesda Bagels website
“This district serves as the heart of Downtown Bethesda and is a regional destination and model for placemaking with thriving retail, human-scaled design and an active streetscape environment. Bethesda…is the economic heart of Montgomery County”
” ” 59 01 / Introduction 02 / TCFD 06 / Teams 07 / Governance 08 / Appendix 04 / Resilience 03 / Decarbonization 05 / Communities
Primestor Partnership –Advancing Social Equity
Primestor shares our belief that real estate that is tailored to serve the needs and desires of the local community will provide lasting benefits and opportunities for that community. As the fortunes of the community improve, so too does the value of the real estate.
In partnership with Primestor Development, a certified Minority Business Enterprise, Federal has invested nearly $450 million in nine properties located in communities that have historically been underserved and marginalized with additional investment in process. On average, more than 88% of the population within a 3-mile radius of these properties identify as members of a racial or ethnic minority.
Freedom Plaza
Los Angeles, CA

This shopping center was developed on land owned by the Los Angeles County housing authority using a combination of public and private funds to invest in an area that lagged behind neighbors for investment in economic development and where residents often had difficulty accessing fresh food and wellness services necessary to contribute to quality of life.
More than half of the square footage at Freedom Plaza is devoted to tenants who provide products and services to improve health and wellness of the community. With property sponsored scholarships for local residents to attend art school and college, cultural events and programs and a property based workforce comprised of 65% area residents as of 2021, Freedom Plaza provides a foundation for further economic improvement in the surrounding community.
Spotlight Case Study Freedom Plaza | Los Angeles, CA
Spotlight
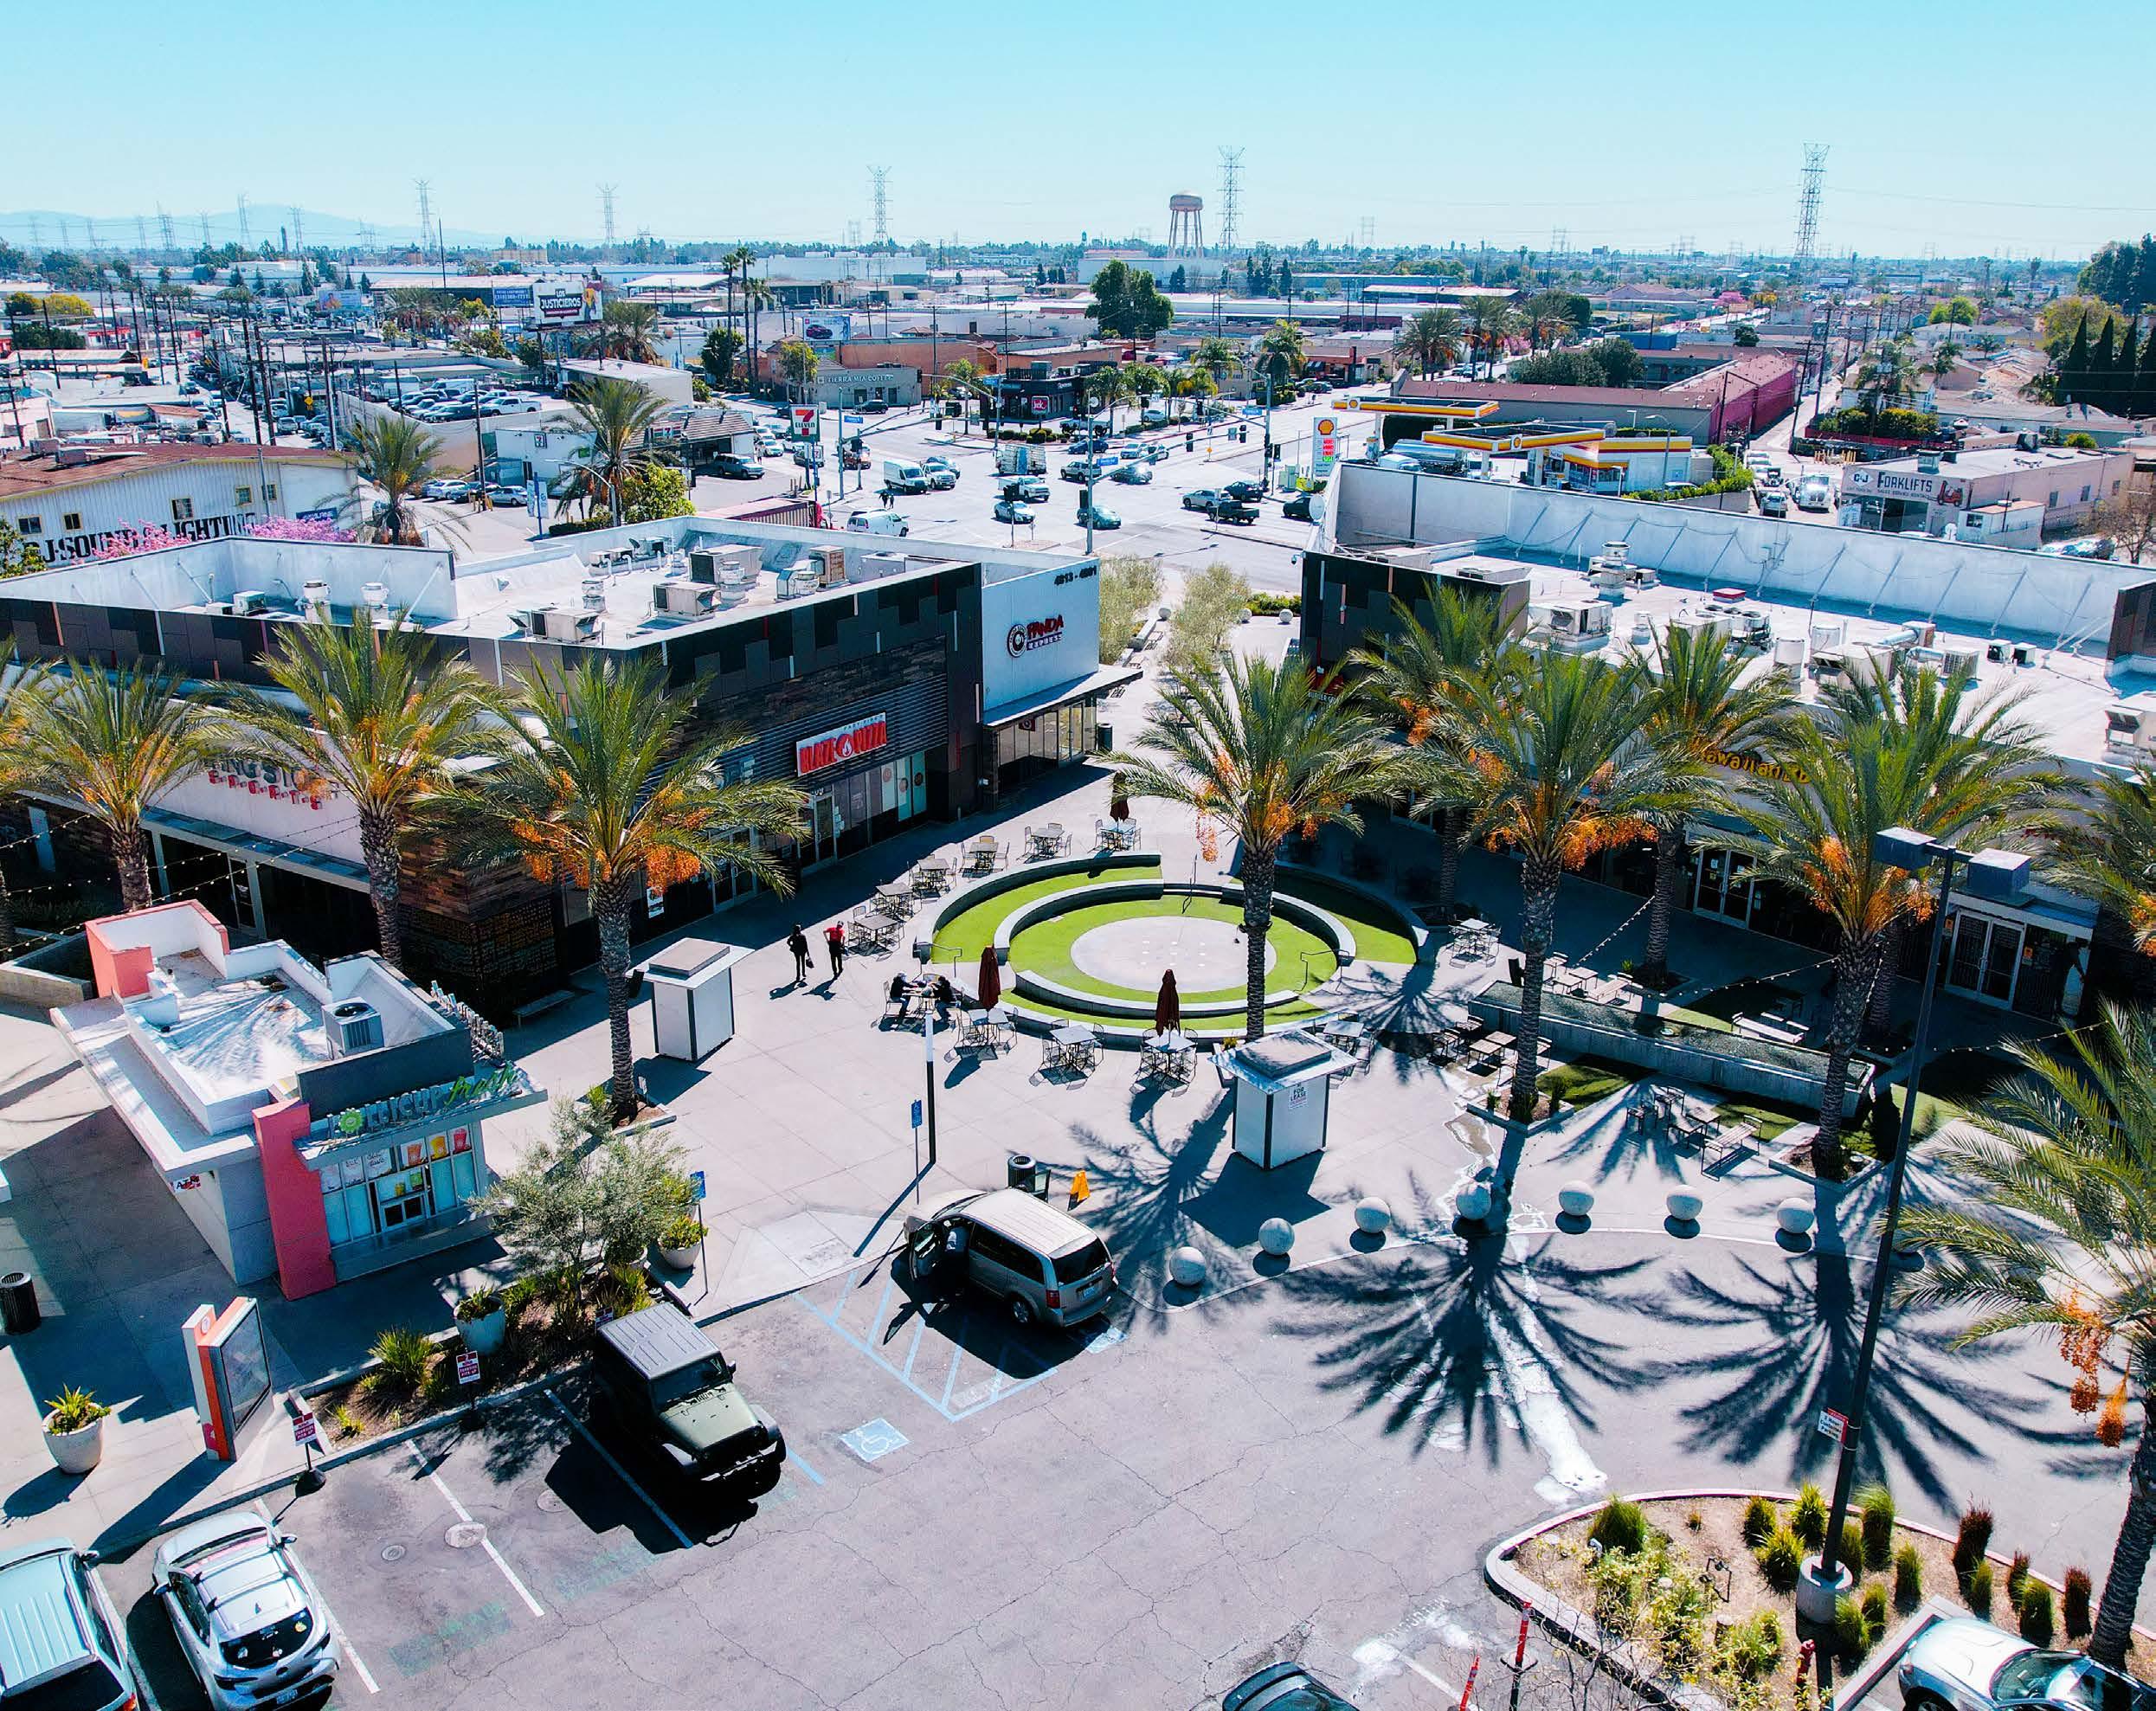
Azalea
South Gate, CA
This public-private partnership resulted in the redevelopment of a formerly blighted industrial site into a shopping center that houses retailers that the community identified and offers a central gathering place and local jobs. The success of the project resulted in an economic success payment to the city that was used by the city to develop a resource center
that provides residents with training and workforce development, and to fund a loan program to spur future economic growth in the area. The project was recognized by the Los Angeles Business Journal with a Commercial Real Estate Award (Silver) for the most impactful project completed in 2014.
61 01 / Introduction 02 / TCFD 06 / Teams 07 / Governance 08 / Appendix 04 / Resilience 03 / Decarbonization 05 / Communities
Azalea | South Gate, CA
Reinvestment With Purpose
Our commitment to social responsibility is reflected in how, where and why we invest in our real estate. We continually reinvest in our assets to ensure that they evolve along with the expectations and needs of the communities that rely on them. That reinvestment enhances the value of our assets as well as the investment in the communities through job creation and sales and real estate taxes.
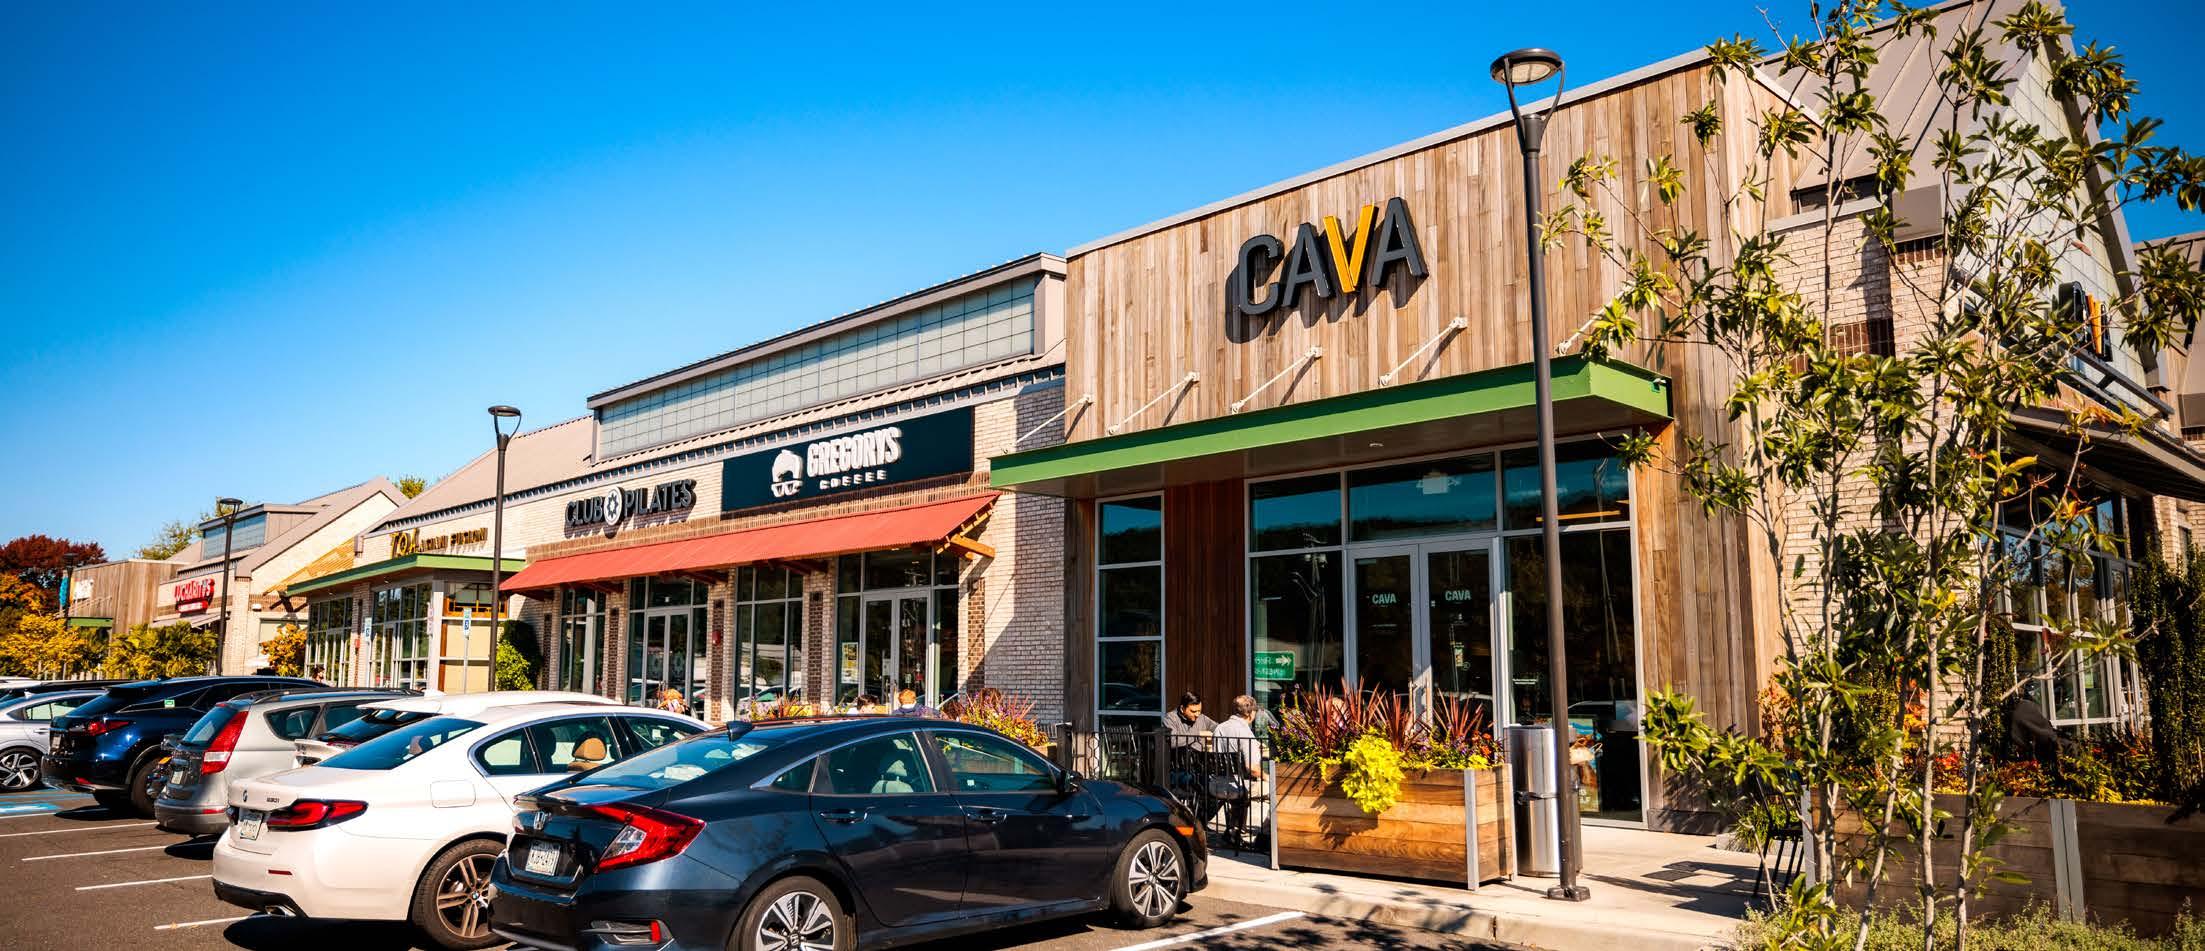
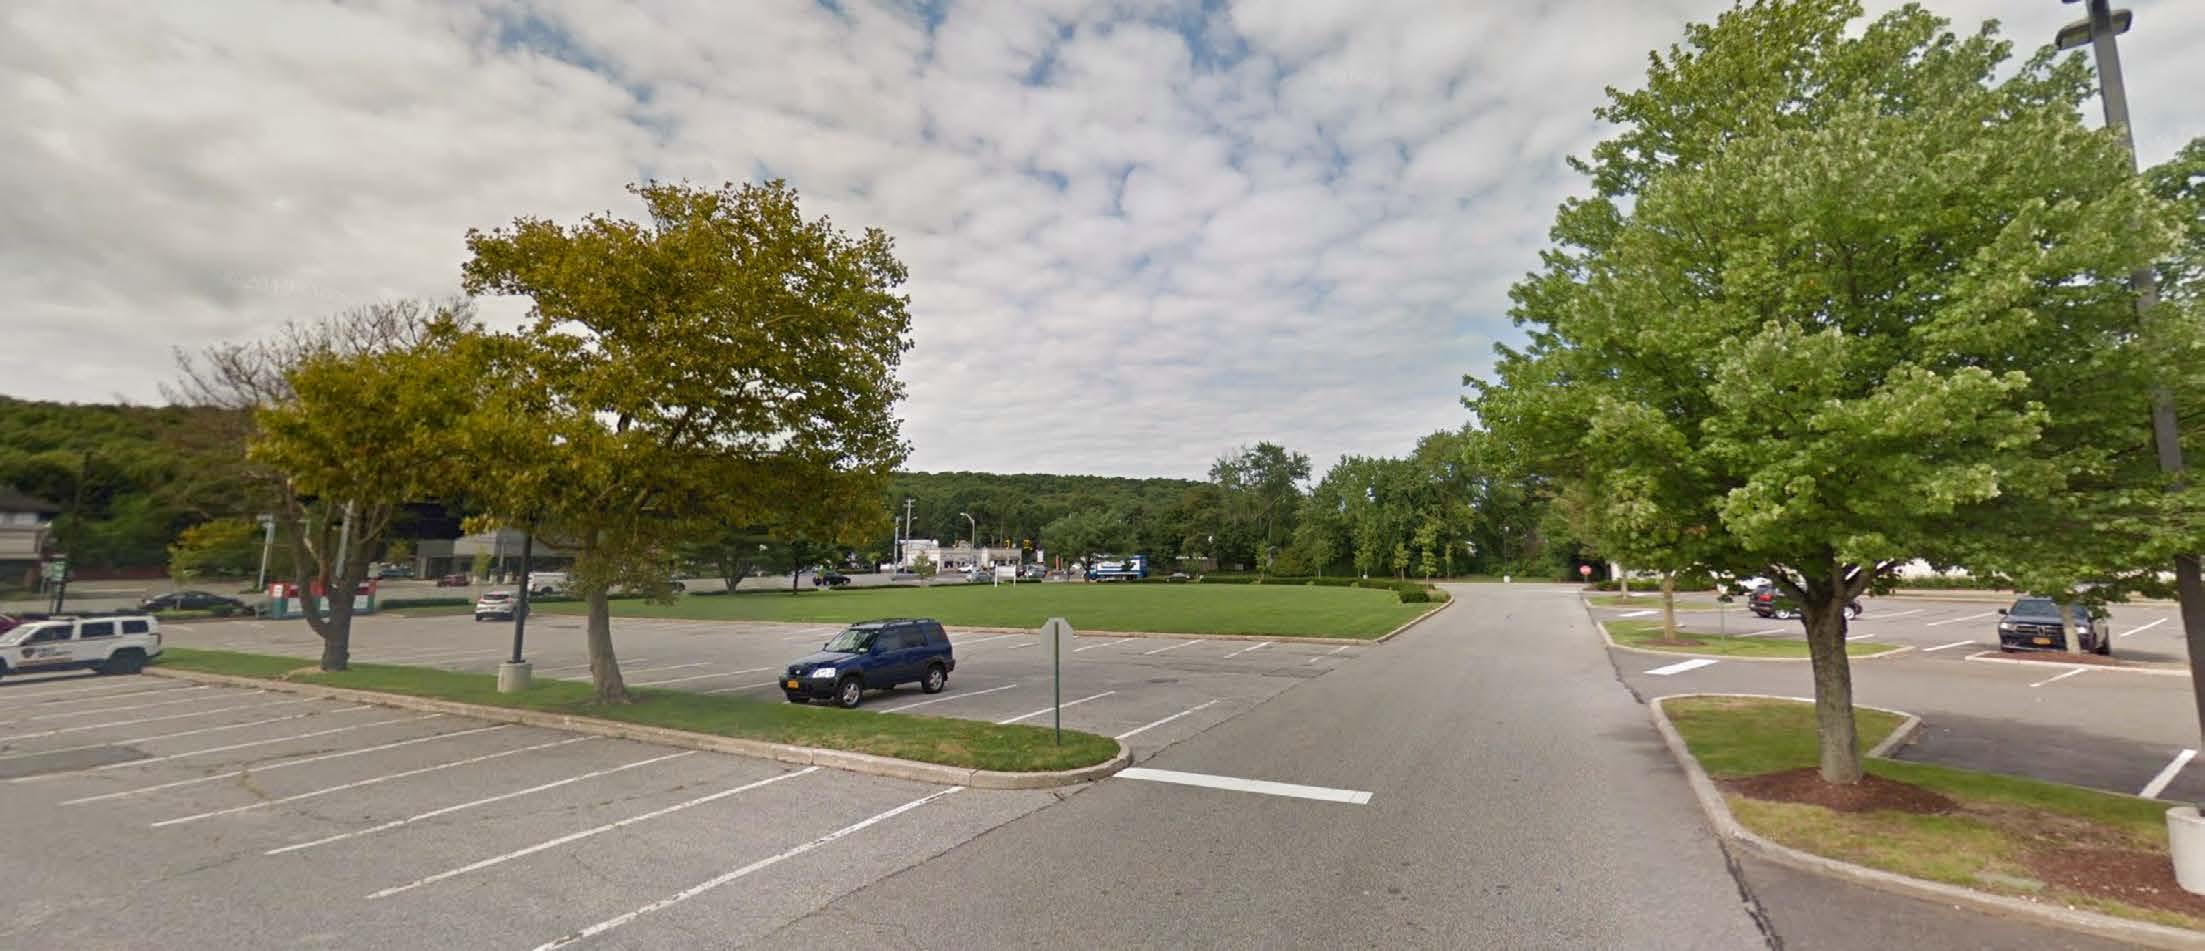
After Before Recent Developments | Melville Mall | Melville, NY
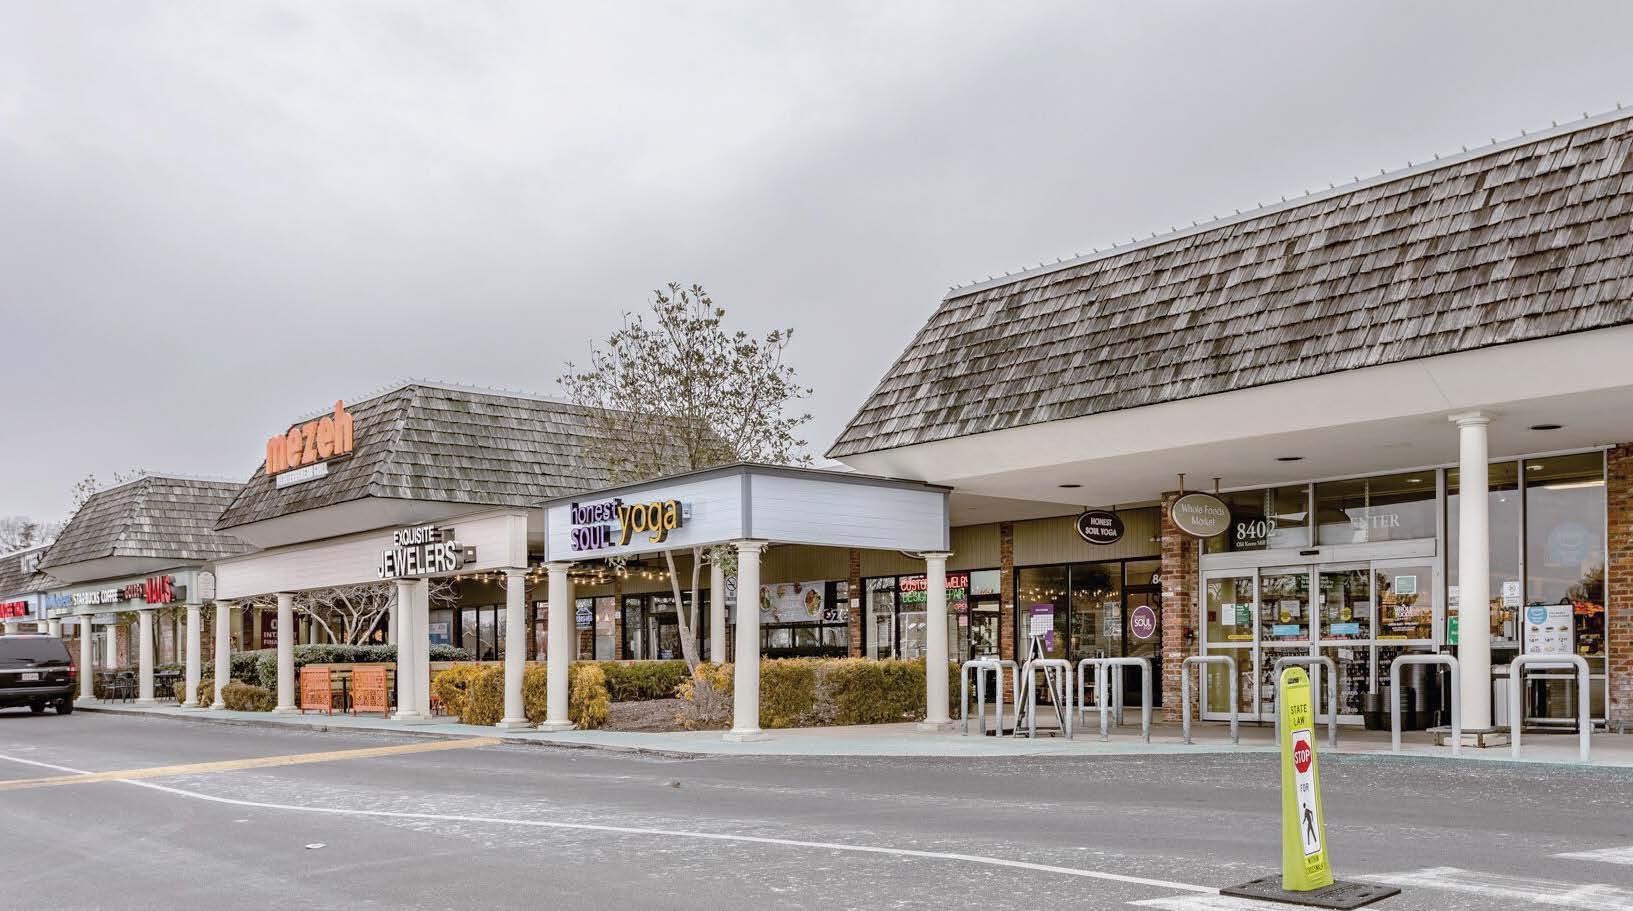
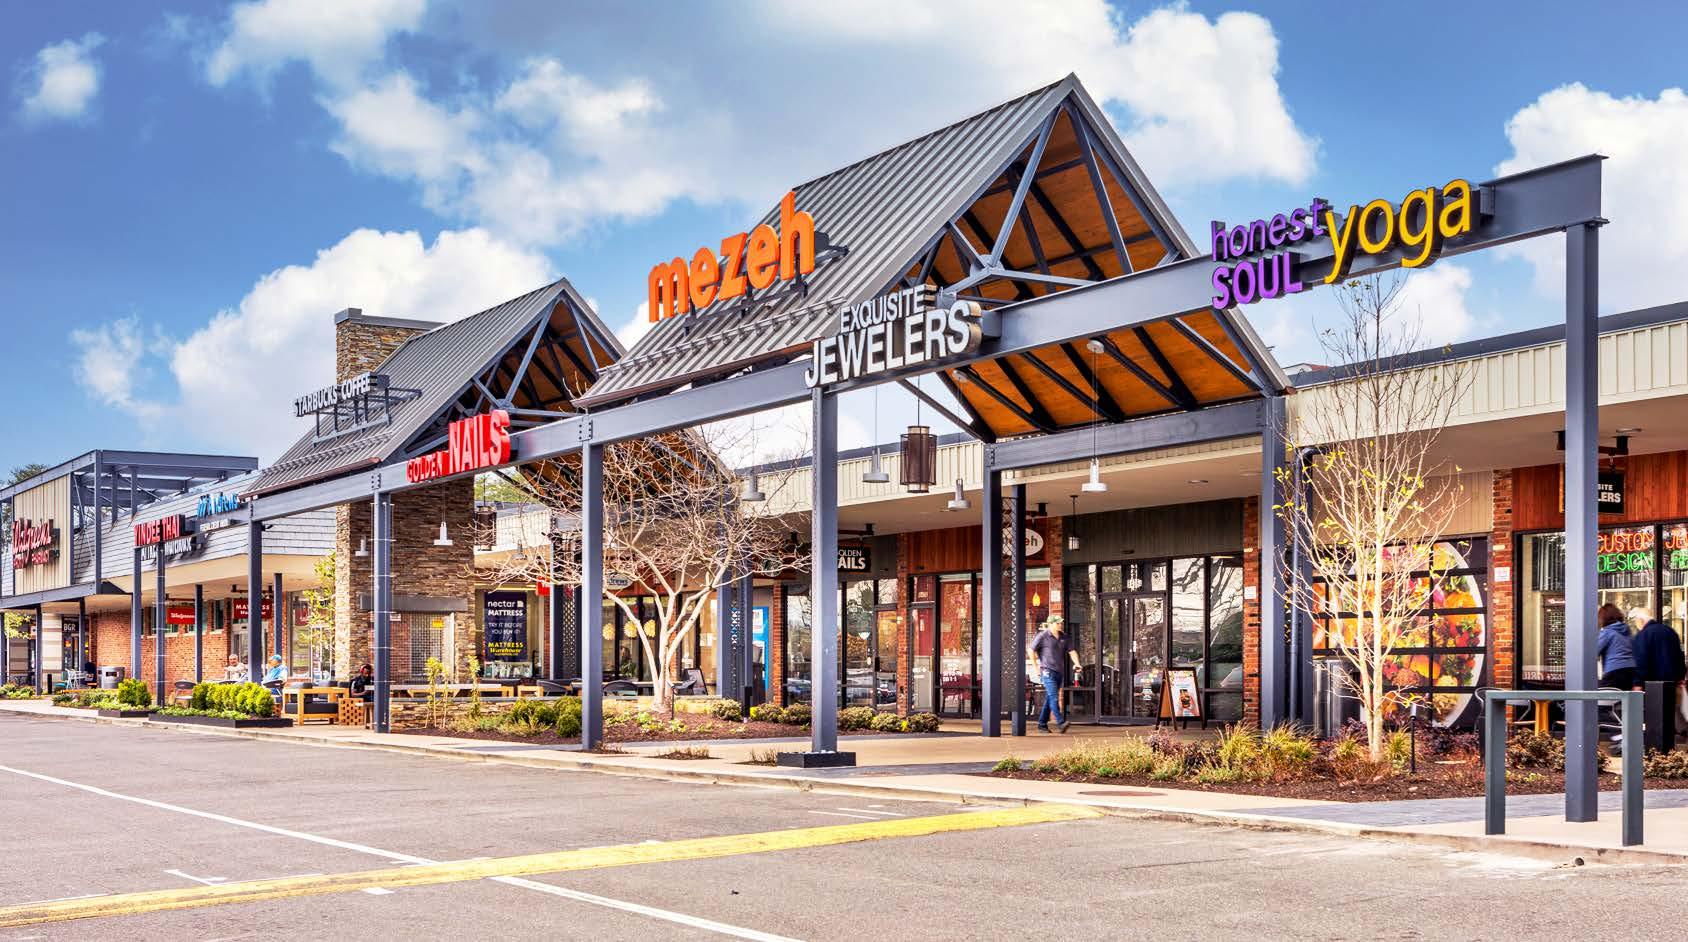
After Before Recent Developments | Old Keene Mill | Springfield, VA 63 01 / Introduction 02 / TCFD 06 / Teams 07 / Governance 08 / Appendix 04 / Resilience 03 / Decarbonization 05 / Communities
Connecting the Community Through...
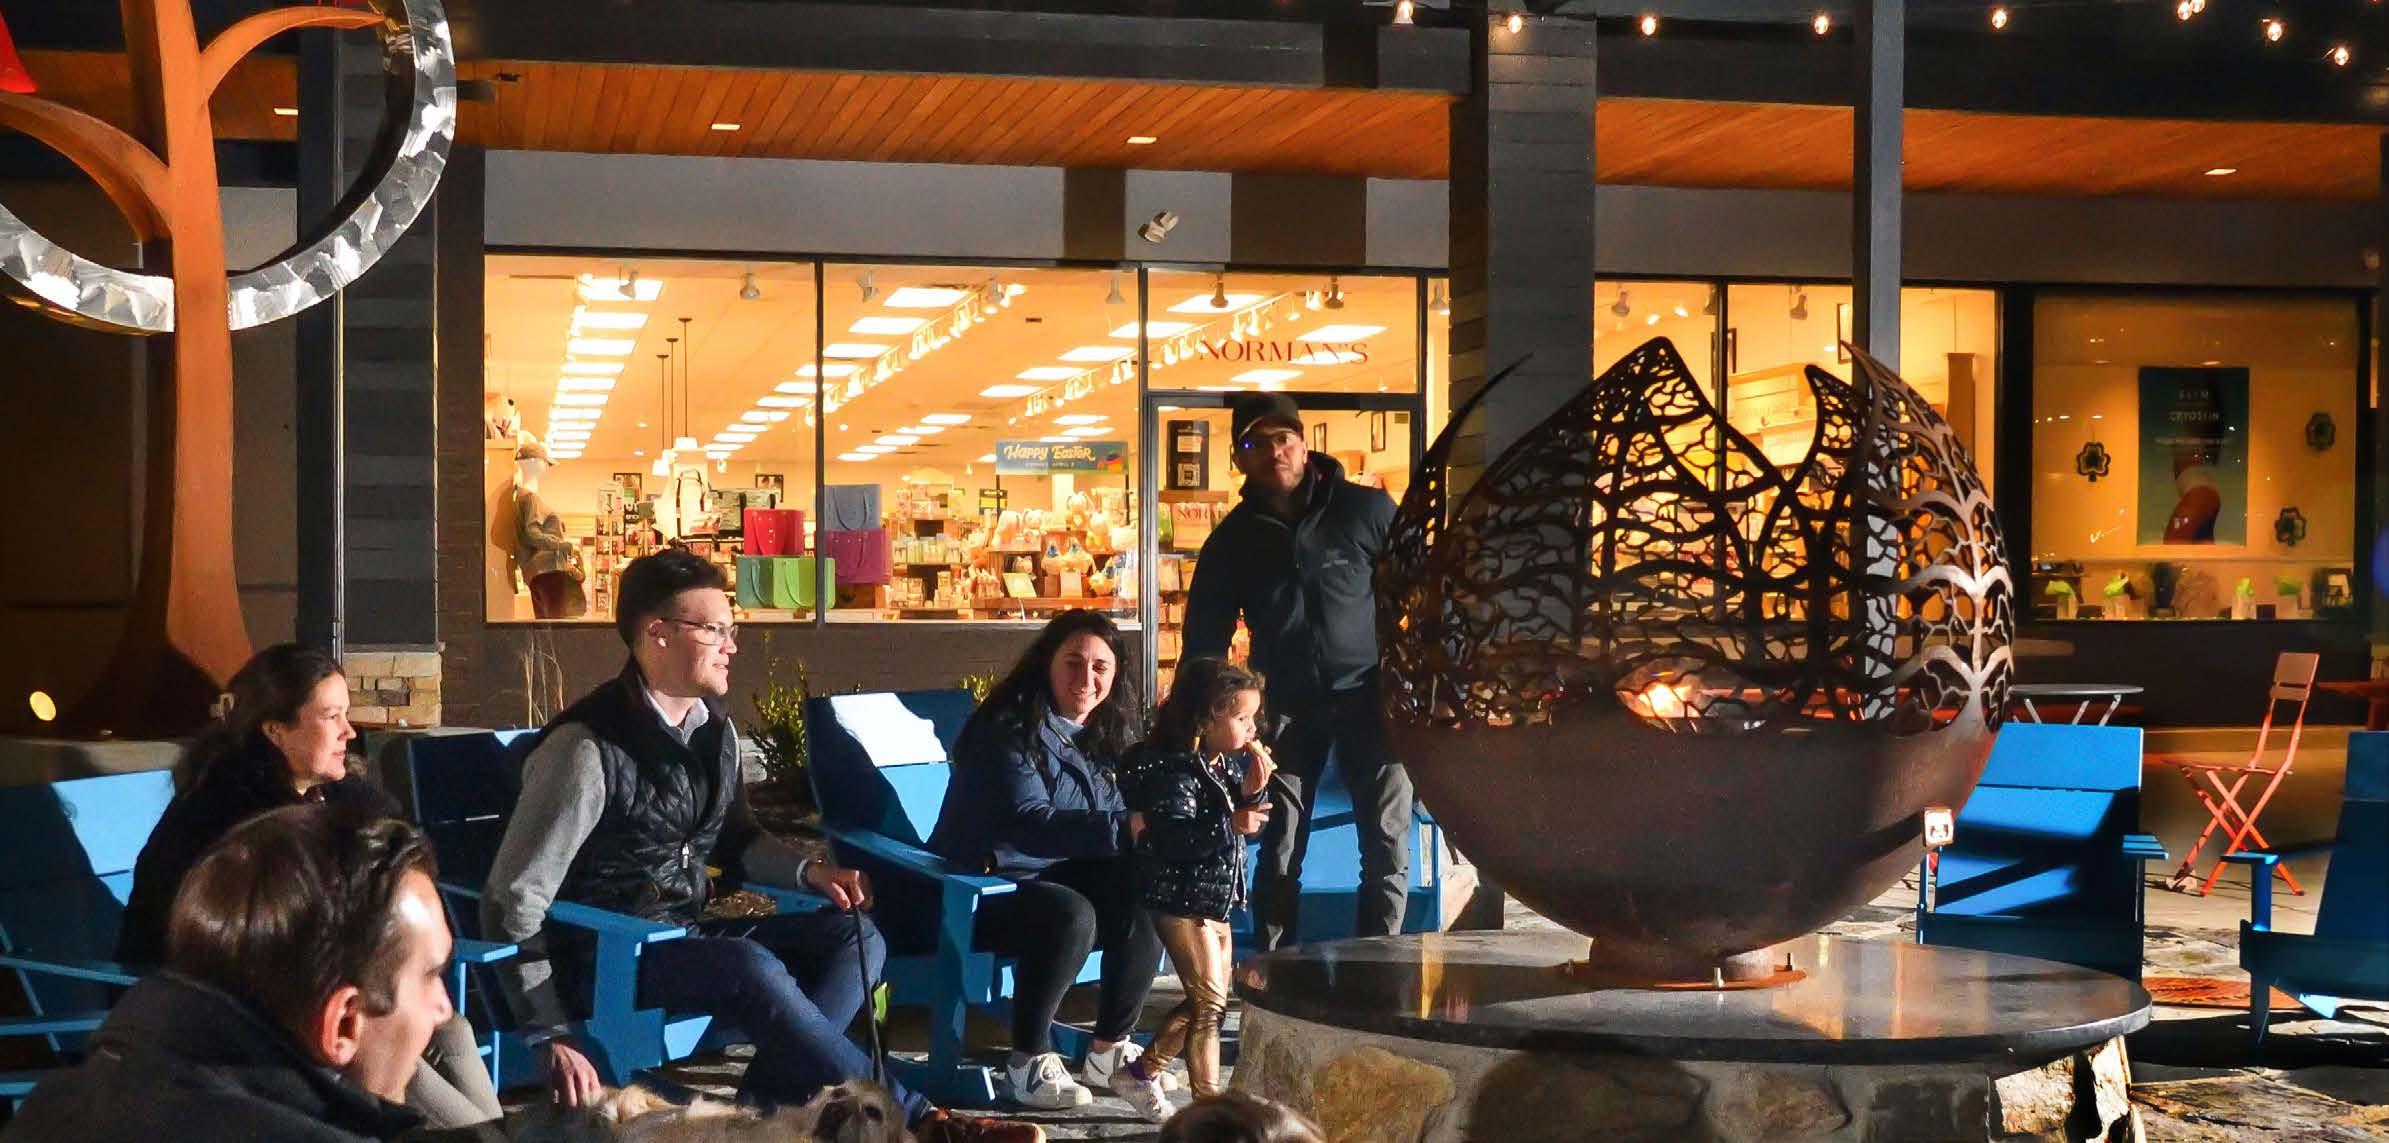
Experiences
Each year, we offer more than 300 events, activations and popups at our properties that are designed to surprise and delight community members of all ages.
 Santana Row | San Jose, CA | 20th Anniversary Celebration


Bethesda Row | Bethesda, MD | Summer Solstice Village at Shirlington | Arlington, VA | Spring Fling 65 01 / Introduction 02 / TCFD 06 / Teams 07 / Governance 08 / Appendix 04 / Resilience 03 / Decarbonization 05 / Communities
Connecting the Community Through...
Art
By incorporating local art, including sculptures, murals, architectural and other features, we seek to speak to the history and culture of each community.
 Perring Plaza | Baltimore, MD
 Lawrence Park | Broomall, PA
67 01 / Introduction 02 / TCFD 06 / Teams 07 / Governance 08 / Appendix 04 / Resilience 03 / Decarbonization 05 / Communities
Assembly Row | Somerville, MA
Connecting the Community Through...
Philanthropy as a Company
Sleep in Heavenly Peace
Sleep in Heavenly Peace received a $46,000 donation as the recipient of our 2022 annual giving campaign. This worthy cause provides beds, bedding and pillows to children in the county who do not have their own bed to sleep on and was nominated and selected by a vote of our employees.
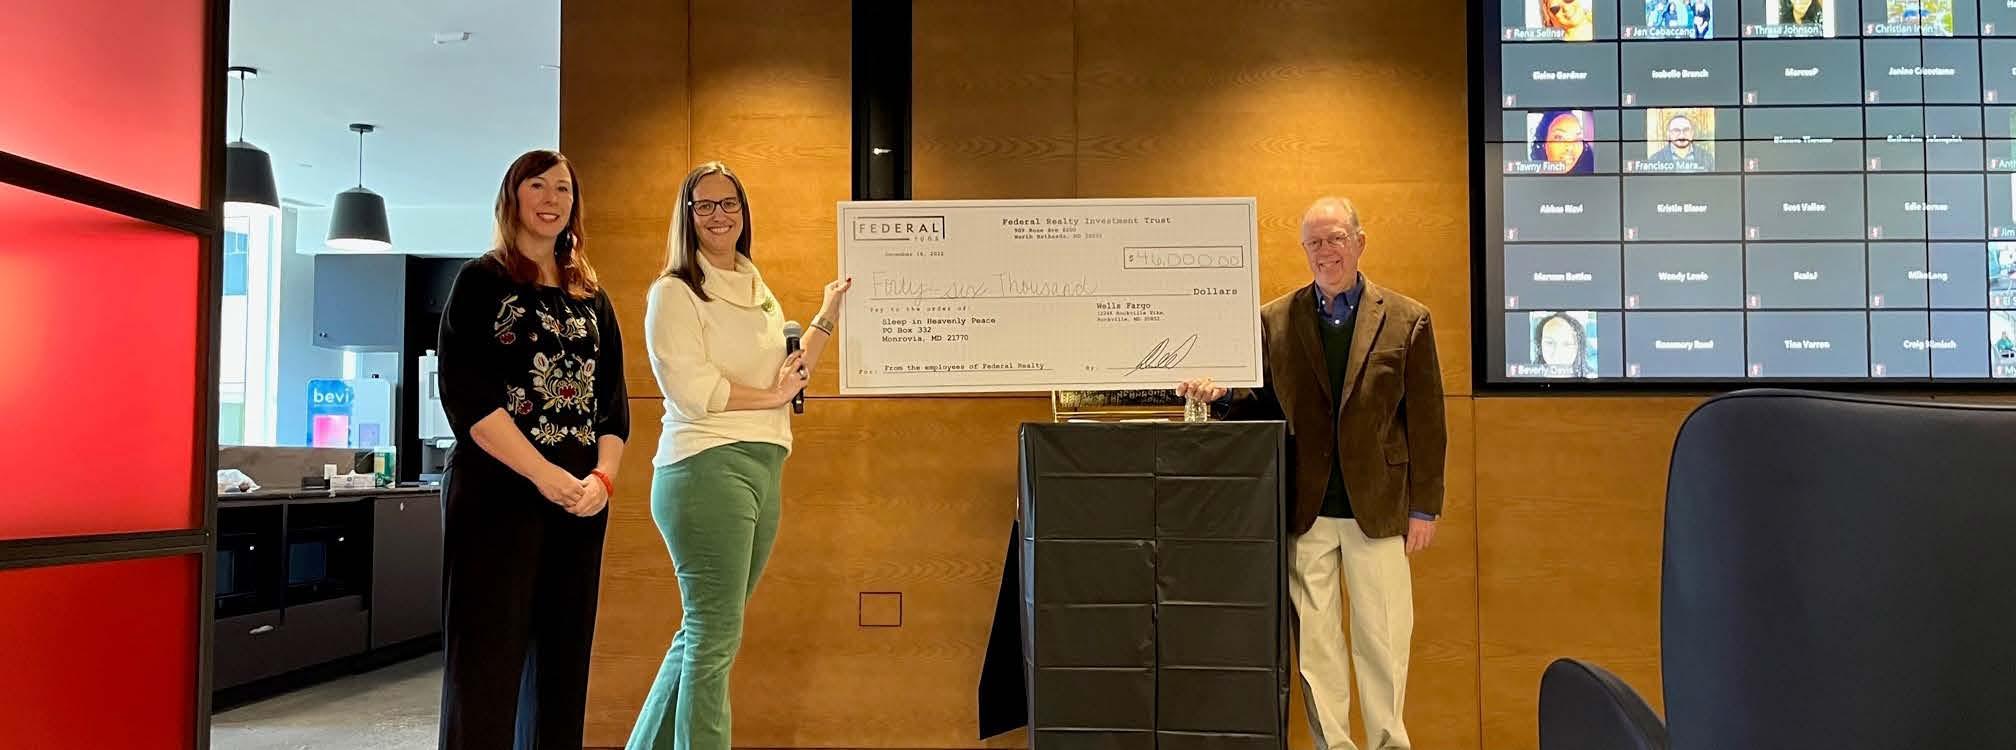
“I am a frequent volunteer with Sleep in Heavenly Peace and see first-hand the positive impact a bed can have on a child’s happiness and health. This donation from the company and my co-workers will have a profoundly positive impact on the lives of so many needy children in the county.”
”
Jenny Higgins Lease Administrator, Corporate Headquarters
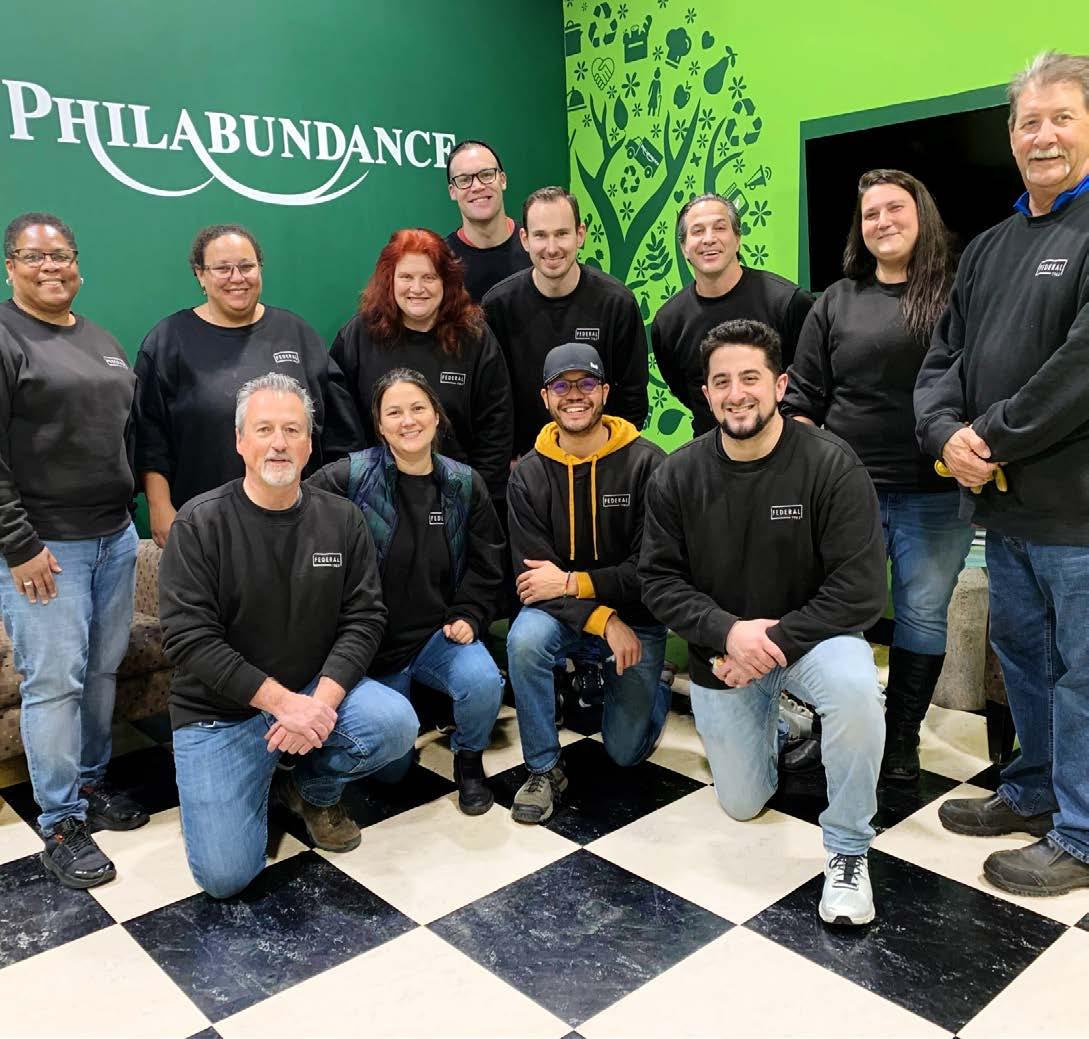
Philanthropy with Our Time
Wynnewood Office
Wynnewood, PA
Philadelphia area employees volunteering at Philabundance, a local nonprofit aimed at eliminating hunger in the community.
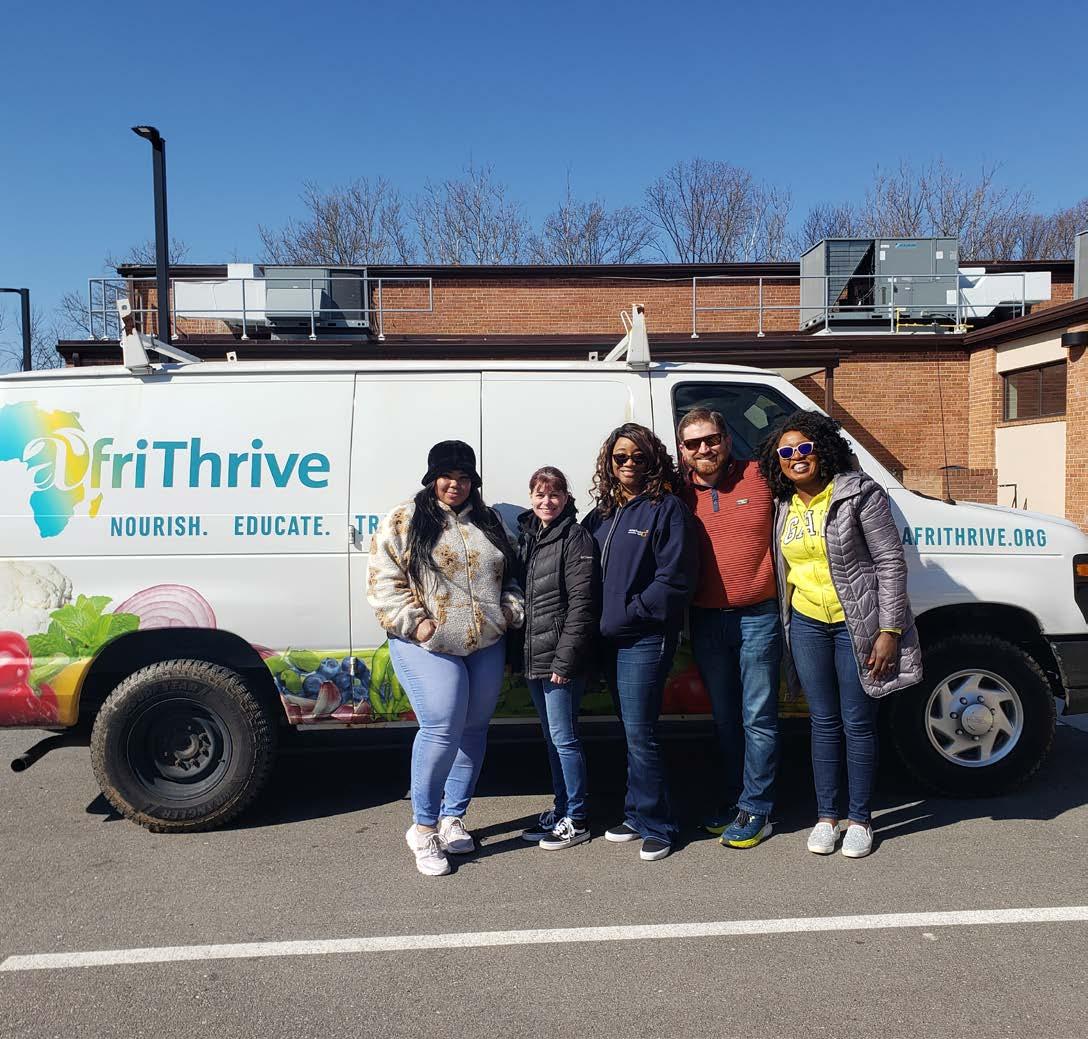
Corporate Headquarters
North Bethesda, MD
North Bethesda, MD employees at AfriThrive, a group dedicated to providing African immigrant and minority families with access to food, youth skills and economic opportunity.
69 01 / Introduction 02 / TCFD 06 / Teams 07 / Governance 08 / Appendix 04 / Resilience 03 / Decarbonization 05 / Communities
Connecting the Community Through...
Philanthropy at Our Properties
Second Harvest Food Bank
Santana Row | San Jose, CA
One of the many events celebrating the 20th Anniversary of Santana Row, San Jose, CA raised over $12,000 for the Second Harvest Food Bank

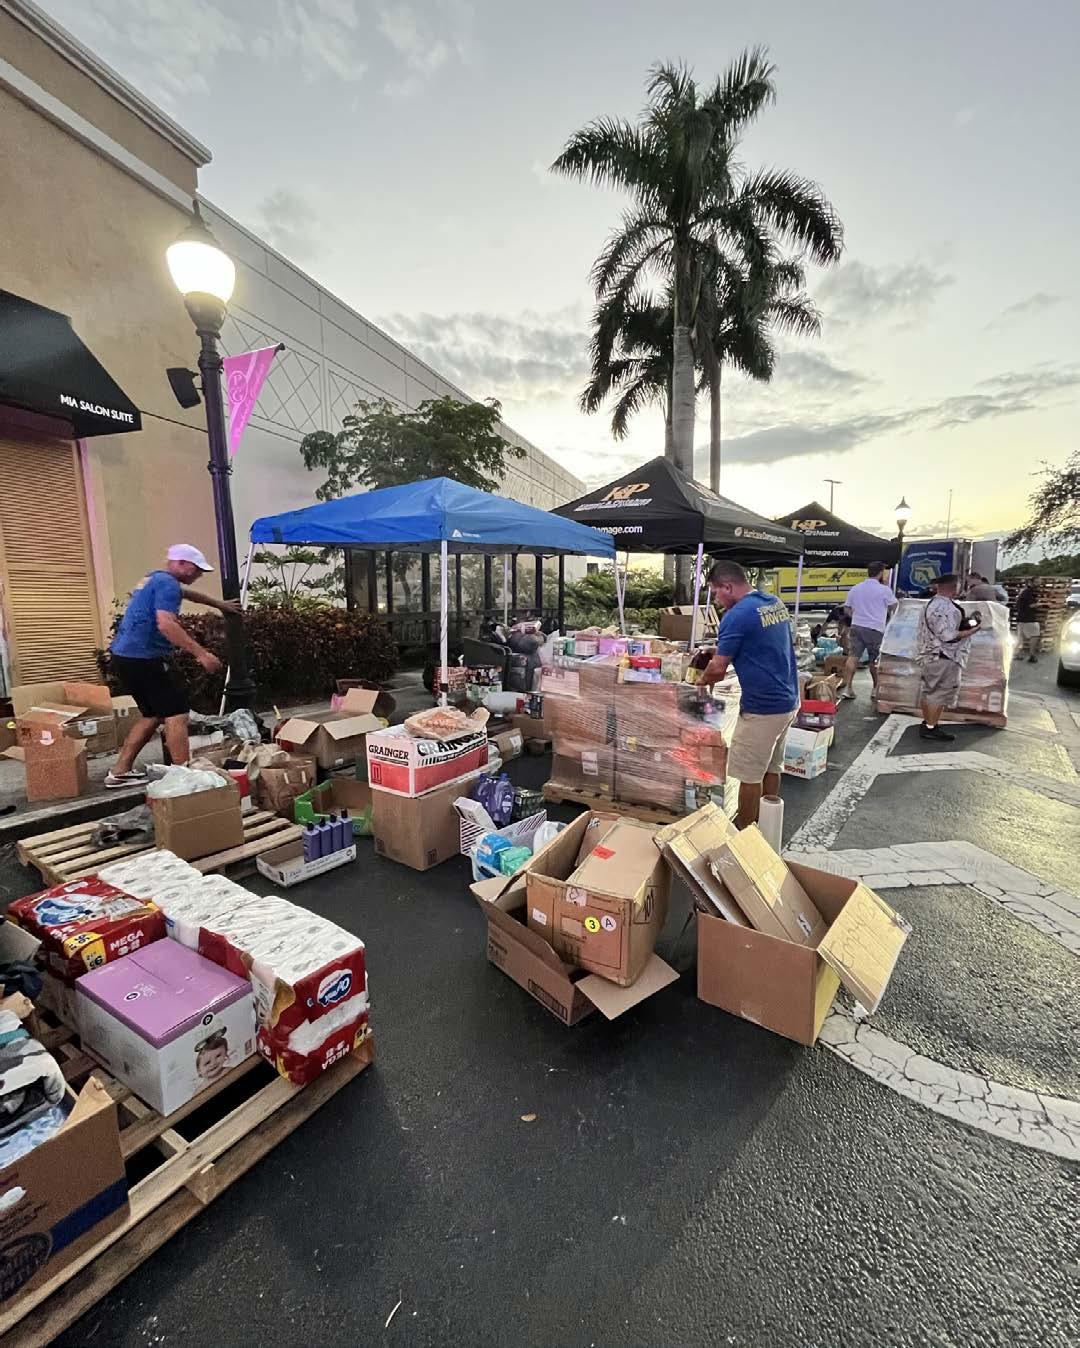
Hurricane Ian Relief
The Shops at Pembroke Gardens | Pembroke Pines, FL
Having not suffered damage from Hurricane Ian, The Shops at Pembroke Gardens served as a host location in partnership with local, state and federal law enforcement to collect and deliver supplies to the surrounding community after that hurricane.
Resident-Driven Philanthropy

Assembly Row | Somerville, MA
Our two apartment buildings at Assembly Row lead a resident-driven philanthropic effort to help local organizations, non-profits, and charities throughout Somerville and the metro Boston area with much needed donations.
71 01 / Introduction 02 / TCFD 06 / Teams 07 / Governance 08 / Appendix 04 / Resilience 03 / Decarbonization 05 / Communities
Connecting the Community Through...
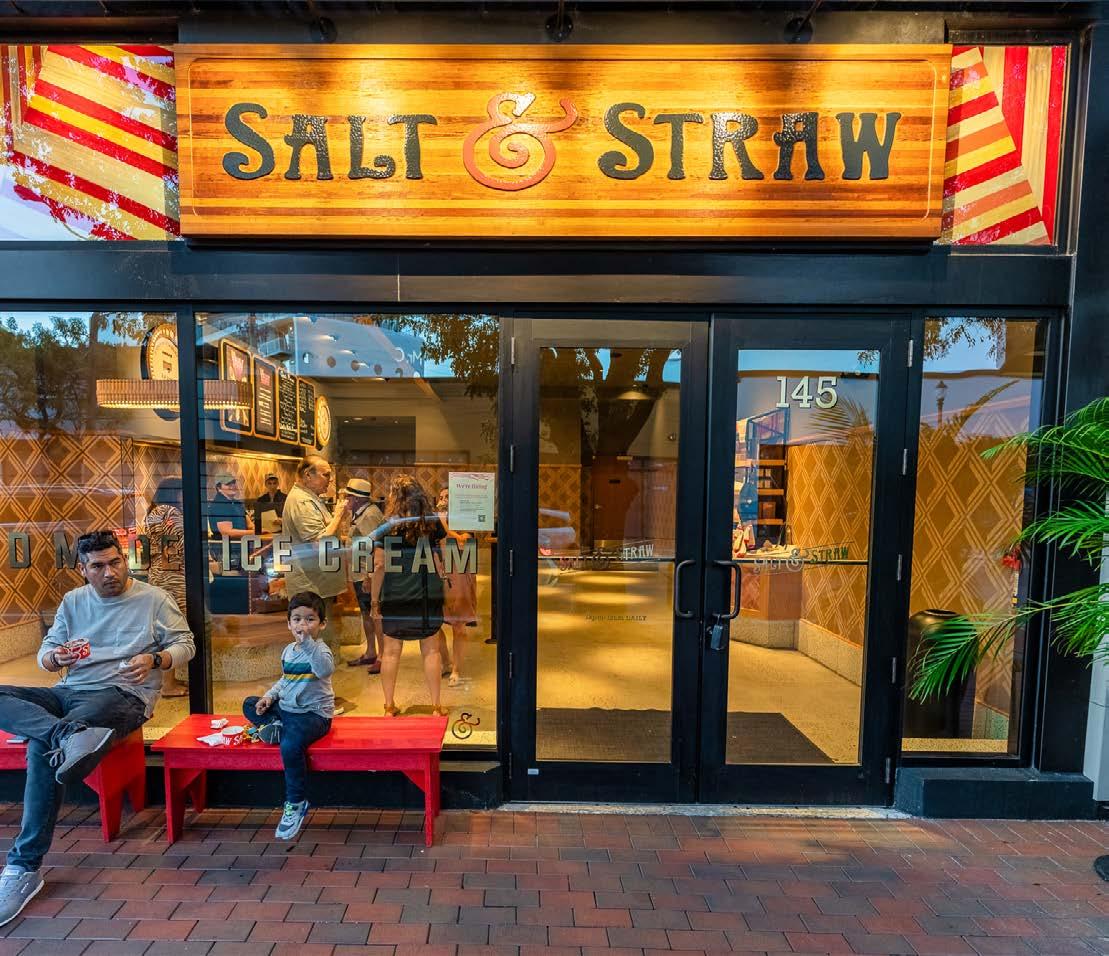
Our Tenants
We create growth in our properties and their communities by placing the right tenants in the right properties and partnering with them for success.
 Pike & Rose | North Bethesda, MD
CocoWalk | Coconut Grove, FL
Wildwood Shopping Center | Bethesda, MD
Pike & Rose | North Bethesda, MD
CocoWalk | Coconut Grove, FL
Wildwood Shopping Center | Bethesda, MD
Tia Chucha’s Centro Cultural & Bookstore

Sylmar Towne Center | Sylmar, CA
Tia Chucha’s mission is to transform the local community through arts, literacy, creative engagement and ancestral knowledge. This tenant is a pillar of the local community that provides year-round arts and literacy bilingual intergenerational programming. This includes mural painting, dance, writing and visual arts with workshops and activities in Mexican dance, and indigenous cosmology/philosophy. Tia Chucha also hosts open mic nights in Spanish and English as well as author readings, film screenings and art exhibits.
Spotlight ”
“Once I understood the importance of Tia Chucha’s to the local community, I knew they’d be perfect for our property. Not only can we support this tenant in its mission but it will bring more and more community members to our property which will further drive the success of the asset and make it the property of choice for the community."
73 01 / Introduction 02 / TCFD 06 / Teams 07 / Governance 08 / Appendix 04 / Resilience 03 / Decarbonization 05 / Communities
Jeff Kreshek, Senior Vice President-Western Region President Federal Realty
Empower Teams
a work environment that is diverse, engaging and helps employees grow personally and professionally
Objective Create
developing and retaining the best talent with diverse perspectives leads to better results for the company which is critical to growing the cash flow and asset value of the company over time GRI 2-7, 3-1, 3-2, 3-3, 401-1, 401-2, 401-3, 403-2, 404-1, 404-2, 404-3, 405-1, 406-1
Why Attracting,
Corporate Headquarters | North Bethesda, MD
4,500+
training hours completed by employees in 2022
Awarded Top Workplace
by Washington Post in 2022
71%
of promotions and advancements in 2022 were women
47%
of new hires in 2022 were ethnic or racial minorities
No pay anomalies based on race or gender
75 01 / Introduction 02 / TCFD 06 / Teams 07 / Governance 08 / Appendix 04 / Resilience 03 / Decarbonization 05 / Communities
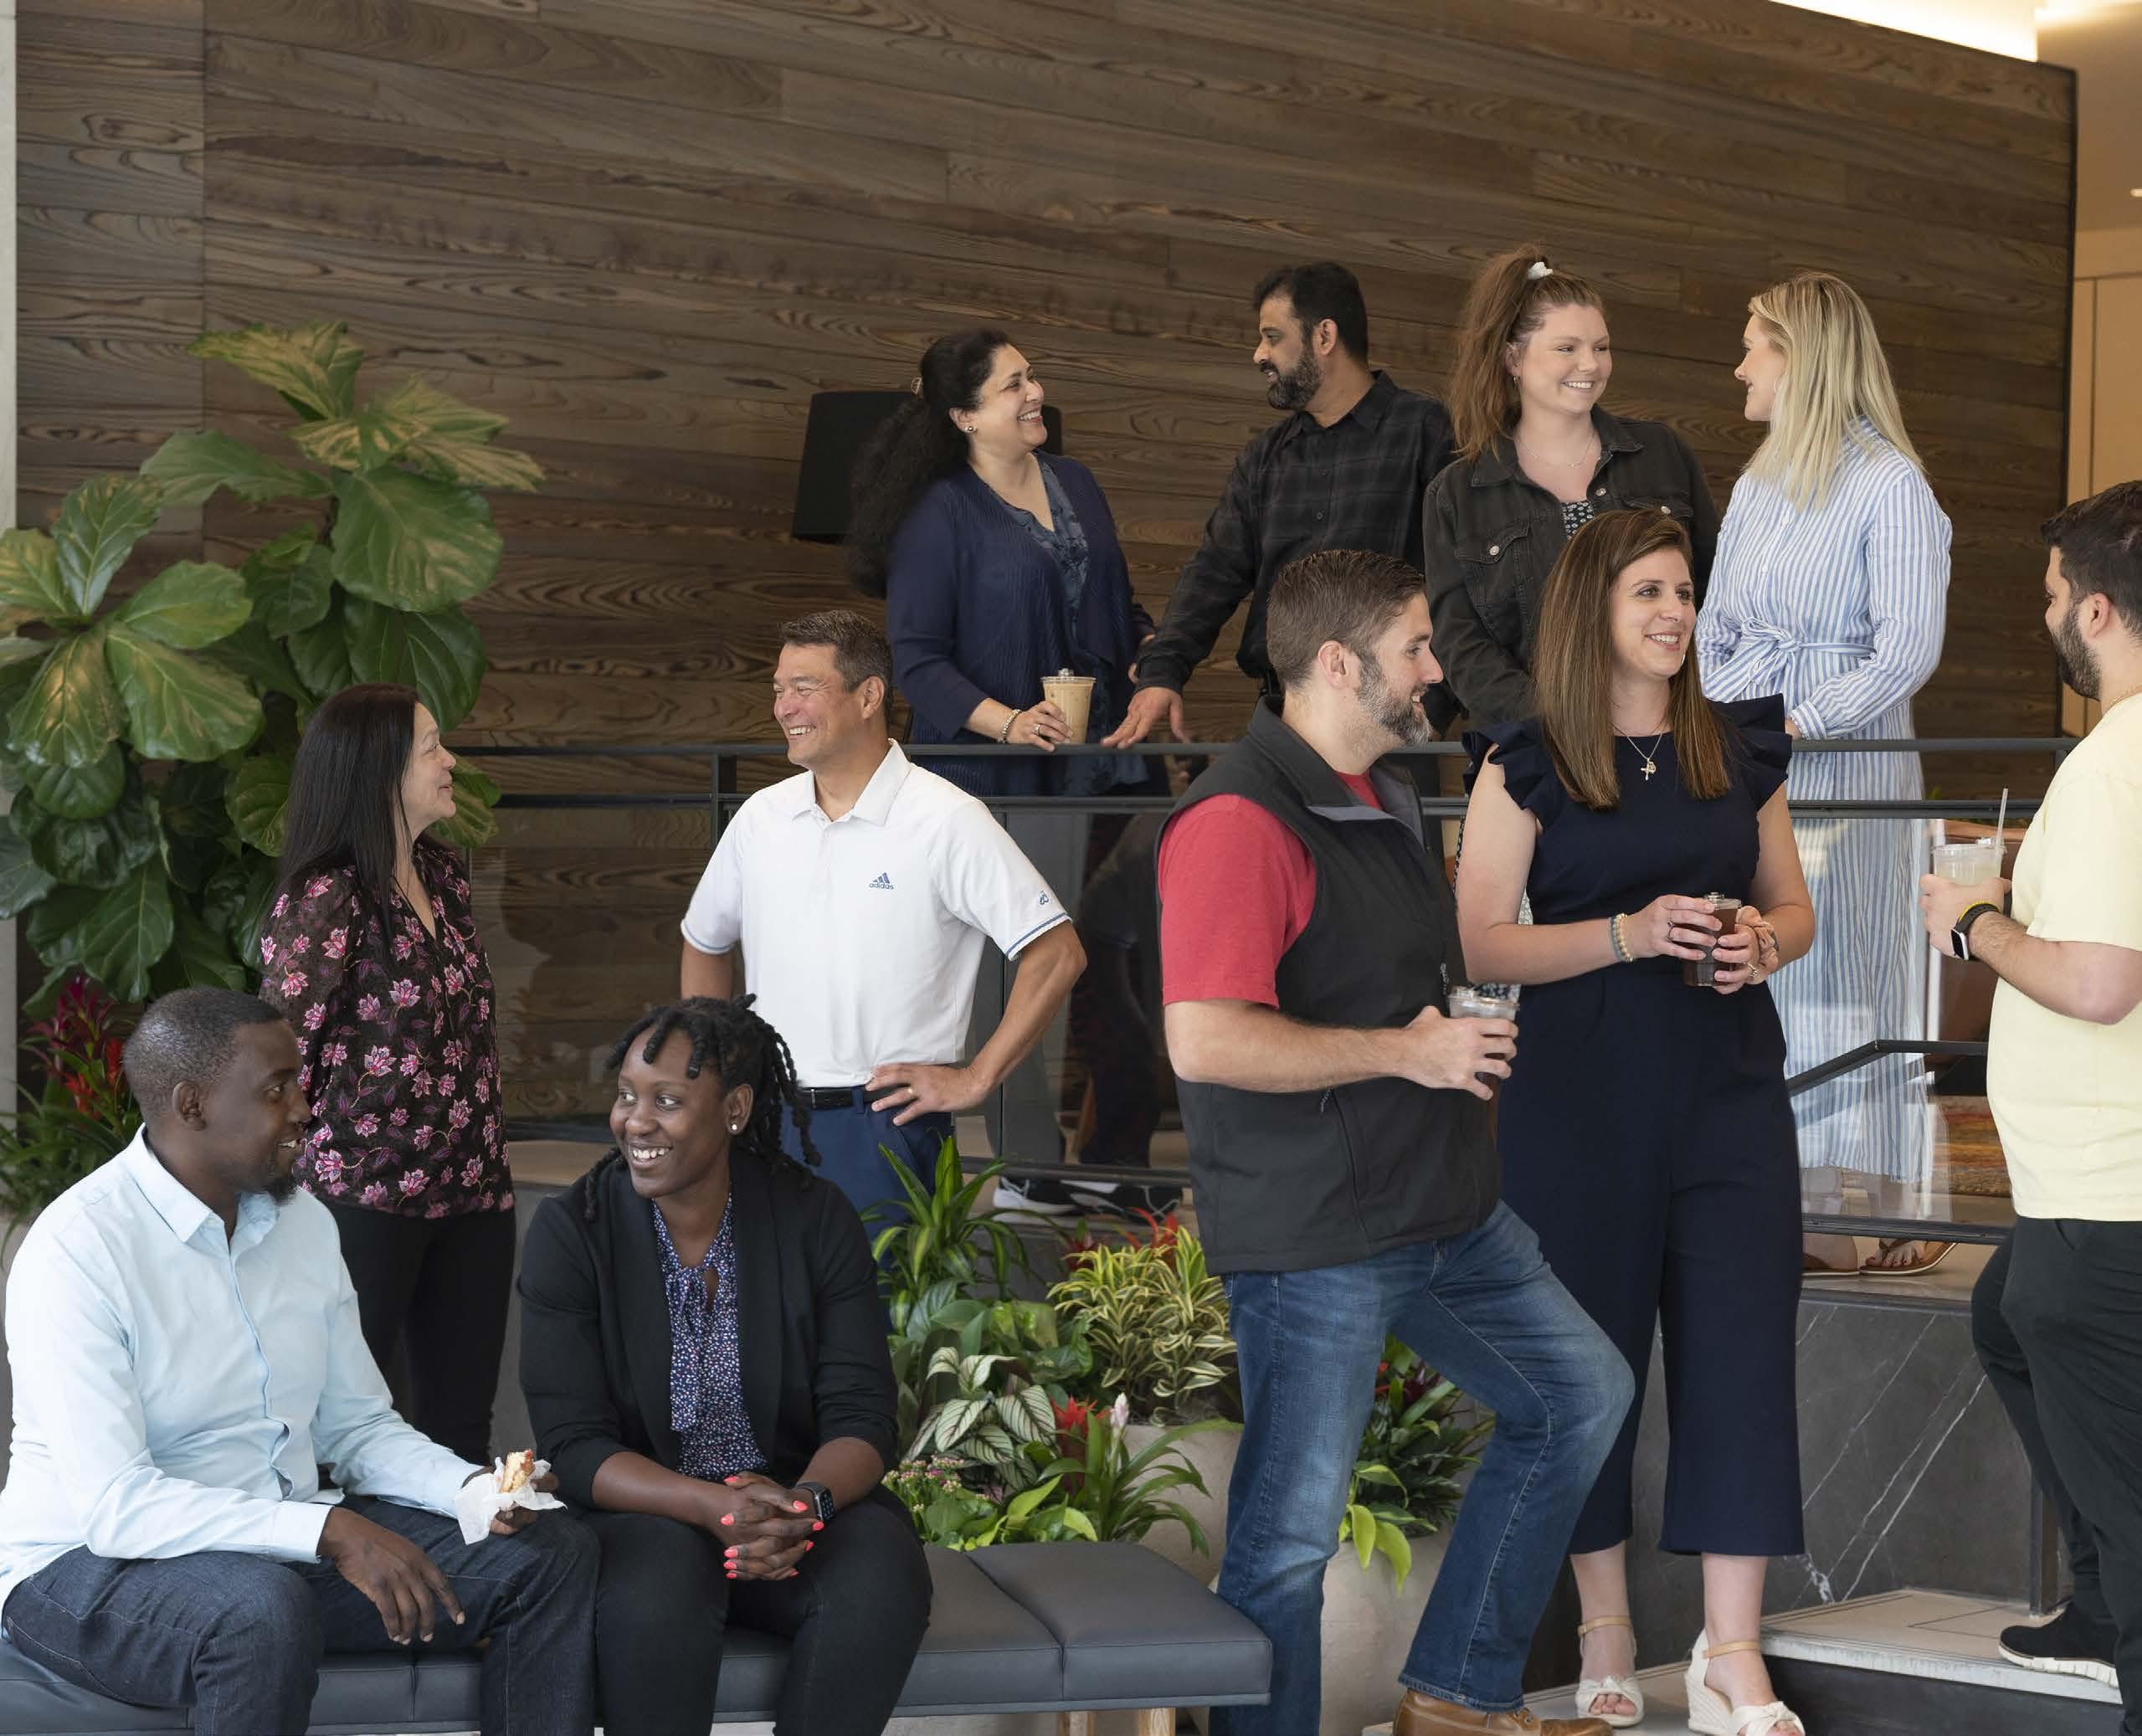
Our People
Our success is driven by our team of more than 300 professionals who bring passion, dedication and know-how to their jobs each and every day. Through competitive compensation and benefits, development opportunities, inclusivity, and personal recognition, we continue to create an environment where our team members thrive.
The Federal Principles
Excellence Be Outstanding Accountability Own It Integrity Make Us Proud Innovation Be Progressive

Corporate Headquarters | North Bethesda, MD 77 01 / Introduction 02 / TCFD 06 / Teams 07 / Governance 08 / Appendix 04 / Resilience 03 / Decarbonization 05 / Communities
Team Composition
Wynnewood Office | Wynnewood, PA
Information on the Board and Leadership is as of March 31, 2023. Information on the company is as of December 31, 2022. Leadership includes all positions of Vice President and above.
Race / Ethnicity Board Leadership Company Tenure < 10 yrs 10-20 20-30 30+ < 30 30s 40s 50s 60+ Age Gender Male Female Board Leadership Company
Overall Company White Minority

Promotions New Hires Race / Ethnicity White Minority Male Female Promotions New Hires New Hires & Promotions in 2022 Gender Promotions New Hires <30 30s 40s 50s 60+ Age Corporate Headquarters | North Bethesda, MD 79 01 / Introduction 02 / TCFD 06 / Teams 07 / Governance 08 / Appendix 04 / Resilience 03 / Decarbonization 05 / Communities
Team Member Engagement
The results of this company are driven by our talented team members which makes employee engagement critical to our success. Engaged employees are invested in the company, care about company success, and approach their work with enthusiasm. This leads to higher productivity, lower turnover, and better, more consistent results.

An employee engagement survey is conducted each year to provide insight into the overall satisfaction level of our employees.
2023 Engagement Survey Results:
95%
85%
survey participation rate
6%
improvement versus 2022 in number of actively engaged employees
“I feel proud to work for this organization”
Corporate Headquarters | North Bethesda, MD
” What do people like most about the company? ” teamwork co-workers family culture environment autonomy challenging respectful trust pride –2023 engagement survey 81 01 / Introduction 02 / TCFD 06 / Teams 07 / Governance 08 / Appendix 04 / Resilience 03 / Decarbonization 05 / Communities
Diversity Equity & Inclusion
Diversity of thoughts, perspectives, and life experiences have long been embedded within the Federal culture and are an important part of employee engagement. Empowering our team members to share differing points of view and perspectives challenges our thinking and drives better results for the company, while also giving our employees the satisfaction of knowing they make a difference.

A Legacy of Diverse Leadership
1988
One or more female senior executives
1995
One or more female trustees
2003
At least 1/3 female non-management trustees
2007
At least one minority trustee
Corporate Headquarters | North Bethesda, MD
Spotlight
Women Building the Future

Even today, the construction industry lacks gender diversity. Not at Federal. Within our tenant construction department, 67% of the director level positions are held by women. These talented women are responsible for building out tenant spaces and ensuring that lease requirements that trigger the tenant’s obligation to start paying rent are met. Nearly 80% of our commercial square footage is under the direct supervision of these extremely talented, barrier-breaking women.
”“I’ve been leasing retail space for more than 35 years and my construction partners for most of those 35 years have been men. I love the fact that I have the opportunity today to partner with these talented women who lead a team that is second to none in the business.”
Wendy Seher, Executive Vice President, Eastern Region President, Federal Realty


 Amy Whitacre Corporate Headquarters North Bethesda, MD
Shiella Kitagawa West Coast Headquarters San Jose, CA
Laura Polin Boston Office Somerville, MA
Amy Whitacre Corporate Headquarters North Bethesda, MD
Shiella Kitagawa West Coast Headquarters San Jose, CA
Laura Polin Boston Office Somerville, MA
83 01 / Introduction 02 / TCFD 06 / Teams 07 / Governance 08 / Appendix 04 / Resilience 03 / Decarbonization 05 / Communities
Annette Badger El Segundo Office El Segundo, CA
Diversity Equity & Inclusion
Pay Equality
Equal pay for equal work is a fundamental tenet of our core integrity value. Findings from our thirdparty study once again found no disparities among team members performing the same or similar jobs. This means all employees are paid fairly regardless of gender, race, sexual orientation, or other demographic characteristics.
We also compare absolute pay differentials between males and females, and white and minority team members irrespective of role using average base pay plus annual bonus, and made significant progress on narrowing that absolute pay differential across both groups in 2022.
Absolute Gender Pay Gap*
Our success in narrowing the absolute pay gap is a direct result of our focus on hiring, developing, and promoting women and minorities into higher-level positions as we work to foster the next generation of talent.
New Hires in Senior Positions in 2021 and 2022*
women
decrease from 2021
Absolute Racial/Ethnic Minority Pay Gap*
10%
8% decrease from 2021
*Calculation excludes CEO
37%
42% racial/ethnic minority
*Senior positions include Executive/Senior Level Officials, First/Mid-Level Officials and Professionals categories used for EEO-1 reporting.
Spotlight
Dawn Jasper Property Manager, Wynnewood Office | Wynnewood, PA
95
% Employees are treated fairly regardless of their race, gender, age, sexual orientation, etc.
 positive response overall
94%
positive response from women
91%
positive response ethnic/racial minorities
90%+
positive response for every age demographic Employee
“I’m a boomerang employee at Federal – starting my fourth year back after a nine-year absence from the company. I always loved the company and its culture, and now truly appreciate how Federal took what was really good before and made it even better today. As an LGBTQIA+ woman of color, I feel empowered to be myself at Federal and fully accepted and supported by the company and my co-workers with what’s important to me.”
” ” 85 01 / Introduction 02 / TCFD 06 / Teams 07 / Governance 08 / Appendix 04 / Resilience 03 / Decarbonization 05 / Communities
2023 Engagement Survey
Learning & Development
We provide opportunities for our team members to learn and advance both personally and professionally; this was identified by 90% of our employees as an important part of their overall job satisfaction. Providing these opportunities motivates our team, drives engagement, and arms them with skills and knowledge that help deliver superior results.
Hands-on Experience
Frequent exposure to senior leadership and participation in key decisions provides employees with practical experience throughout their careers that is critical to professional development.
Learn at Federal Platform
Over 21,000 training materials offer employees the opportunity to learn everything from how to improve skills required in their current role to acquiring knowledge and skills necessary to earn a professional certification, to information about the company and the industry.
Industry Learning
Our team members are encouraged to be panelists and to attend conferences and webinars to further their learning around topics of interest to them and important to their jobs.
Tuition Reimbursement
We provide our employees with up to $5,250 per year to reimburse them for costs of continuing education of any type whether or not it directly relates to their job responsibilities.

West Coast Headquarters | San Jose, CA 87 01 / Introduction 02 / TCFD 06 / Teams 07 / Governance 08 / Appendix 04 / Resilience 03 / Decarbonization 05 / Communities
Benefits
Our commitment to our employees is underpinned by industry-leading compensation and benefits reflecting the importance of our employees to the overall success of the company.
Medical Plans
Industry-leading affordable medical plans with no cost increase to employees for the last 3 years
Dental & Vision Plans
Excellent plans at low employee cost
401(k)
Tax-deferred and Roth 401(k) plan options with company match
Employee Assistance Program
Confidential support for work, personal or family issues at no cost
Life Insurance Company paid life insurance for employees and family
Flexible Spending Account
Flexible spending accounts for medical, dependent care, and commuter expenses.
Health Spending Account
Health savings account for medical expenses with employer contribution
Disability
Short- and long-term disability insurance at no cost to employees
Paid Time Off
Generous and flexible paid time off including ability to carry over up to 8 weeks of both sick time and vacation
Employee Stock Purchase Plan
Opportunity for employees to purchase company stock without commissions
Family Leave
Up to 4 weeks of paid family and medical leave to eligible employees that qualify for FMLA
Employee Discount Program
Access to discounts on wide variety of items and services, including rent at Company properties
Tuition Reimbursement
Financial support for pursuing continuing education
Financial Planning
Meetings with financial planners at no cost to employees
Training & Development
Programs to enhance professional and personal development
Fitness Reimbursements
Monthly reimbursement of employee expense incurred for fitness activity or membership
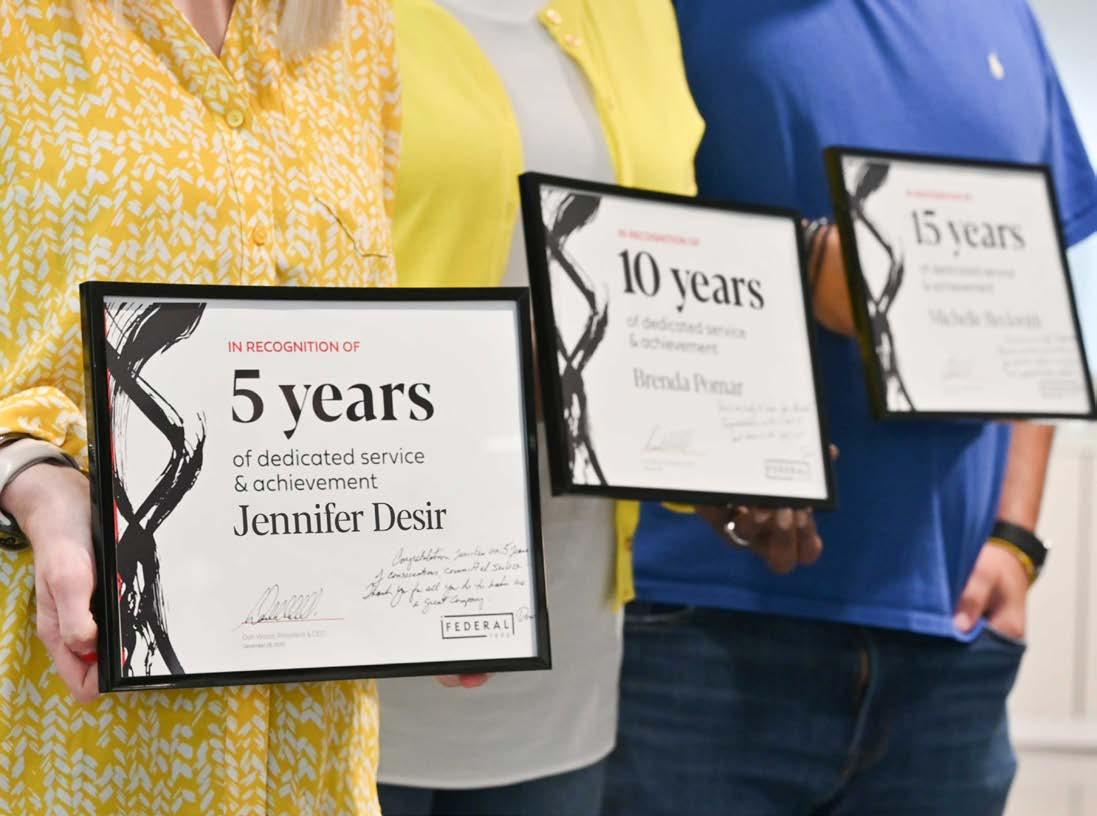
Recognition

Our longstanding award programs celebrate our team members’ accomplishments and contributions and ensure that they feel seen, heard, and valued. From spot awards in the form of gift cards acknowledging a job well done to our years of service awards recognizing milestone anniversaries to our “Find A Better Way” award encouraging innovation, our team members are respected for the time and talents they bring to the company.

89 01 / Introduction 02 / TCFD 06 / Teams 07 / Governance 08 / Appendix 04 / Resilience 03 / Decarbonization 05 / Communities
Health & Wellness
The health, safety and well-being of our team members is essential to building an effective and engaged workforce. We prioritize their physical, mental, and financial health, at home and in the workplace. Under our Be Well at Federal brand, we provide award-winning, comprehensive health and wellness programs that supply year-long information campaigns as well as signature team events.
Wellness Week
One week each year is set aside for a comprehensive program dedicated to employee health and wellness with a series of in-person activities, webinars and materials posted on our intranet. About one third of our employees participated in our 2022 Wellness Week which was capped off with a raffle to win a Peloton with a full year prepaid membership.
Wellness Week Events
Beginner Strength Training
Better Webinar
a Walk at Lunch Self-Defense
Mental Health Flu Shot / COVID Booster How to Plan a Successful Retirement Virtual Reiki 1 on 1 Financial Planning Understanding Foods
Sleep
Take
Protecting
Step Up With Federal
Our Step Up with Federal challenge combines health, comradery, and philanthropy as team members literally take steps to raise money for causes selected by our employees. Teams are assembled with representatives from various departments and offices to promote connection, collaboration, and spirited competition. The winning team members are awarded a prize and the internal bragging rights that are highly valued by our inherently competitive employees who always push one another to improve and succeed.
Mental Health Awareness Month
Each week has a specific focus on some aspect of mental health including reducing the stigma of mental health, setting boundaries at work and home, where to start with self-care, and prioritizing when you are overwhelmed. Federal created a dedicated employee support page to share useful resources with employees including our employee assistance program and behavioral health services offered 24/7 through Teladoc.
Healthy & Safe Working Environment
Providing a healthy working environment for our employees is important to the overall health and wellbeing of our team. Nearly 90% of our office-based employees work at one of our mixed-use, walkable properties with nearly 80% of those employees being officed in LEED Gold-certified buildings with all the related health and wellness benefits. In addition, 82% of our office-based employees are equipped with adjustable height desks to promote healthier, more productive workspaces.

Each of our offices has emergency preparedness plans that include employee volunteers with regular CPR certification that are part of our office Emergency Action Committees.
For our property-based employees, we adhere to all Occupational Health and Safety Act guidelines, supplemented by site-specific safety and maintenance policies. As a result, we maintain a strong safety record for our property-based employees. Only two workers compensation claims have been filed in the past two years, neither resulting in any lost time.
Corporate Headquarters | North Bethesda, MD 91 01 / Introduction 02 / TCFD 06 / Teams 07 / Governance 08 / Appendix 04 / Resilience 03 / Decarbonization 05 / Communities
Govern Responsibly
Objective
Establish foundation to run the company ethically with appropriate fiscal and decision-making controls to manage risk

Why
No company can have sustained longterm success without appropriate oversight and smart, balanced controls that allow the company to thrive without undue exposure to risk

GRI 2-9, 2-10, 2-11, 2-12, 2-13, 2-14, 2-15, 2-16, 2-17, 2-23, 2-24, 2-25, 2-26, 2-27, 3-1, 3-2, 3-3, 205-2, 415-1
Independent Chairman Of the Board since 2003 of Board committees chaired by women 2/3 non-management trustees first elected since 2020 50% of management's Investment Committee are women or racial/ethnic minority 50% board diversity by gender or race/ethnicity 57% 93 01 / Introduction 02 / TCFD 06 / Teams 07 / Governance 08 / Appendix 04 / Resilience 03 / Decarbonization 05 / Communities
Board of Trustees
Our corporate governance framework is built on the principles of integrity, transparency and accountability, and designed to ensure that our company’s processes and policies align with our values and support our business.


At Federal, corporate governance starts with our Board of Trustees, which has primary responsibility for overseeing the business of our company on behalf of our shareholders and other stakeholders. Under the direction of the Board, our Executive Leadership Team is responsible for developing and executing our strategy and managing the day-to-day operations of our business.


More information about our Board, our Trustees and our Executive Leadership Team is available on our website, as are our key governance policies and documents.
 Tom McEachin Trustee
Gail P. Steinel Audit Committee Chair
David W. Faeder Non-Executive Chairman of the
Elizabeth I. Holland Compensation Management Committee
Nicole Y. Lamb-Hale Trustee
Tom McEachin Trustee
Gail P. Steinel Audit Committee Chair
David W. Faeder Non-Executive Chairman of the
Elizabeth I. Holland Compensation Management Committee
Nicole Y. Lamb-Hale Trustee
8
years average tenure of non-management trustees
Key Governance Facts
Annual election of all Trustees
Independent Audit, Compensation, and Nominating Committees
Independent non-executive chairman of the Board since 2003


Direct Board oversight of all environmental, social and governance matters
Direct Board oversight of cyber security and data protection matters
Direct Board oversight of human resources policies and strategies

Annual Board and individual Trustee evaluations
Shareholder approval required to classify the Board
Majority voting in uncontested elections
Proxy access for shareholders
Pay-for-performance compensation philosophy
Prohibition on hedging and pledging our stock
Robust stock ownership requirements for Trustees and senior management

No poison pill
Clawback policy in place
Faeder the Board
Nominating and Corporate Governance Committee Chair
Lamb-Hale
Holland and Human Capital Committee Chair
95 01 / Introduction 02 / TCFD 06 / Teams 07 / Governance 08 / Appendix 04 / Resilience 03 / Decarbonization 05 / Communities
Executive Leadership
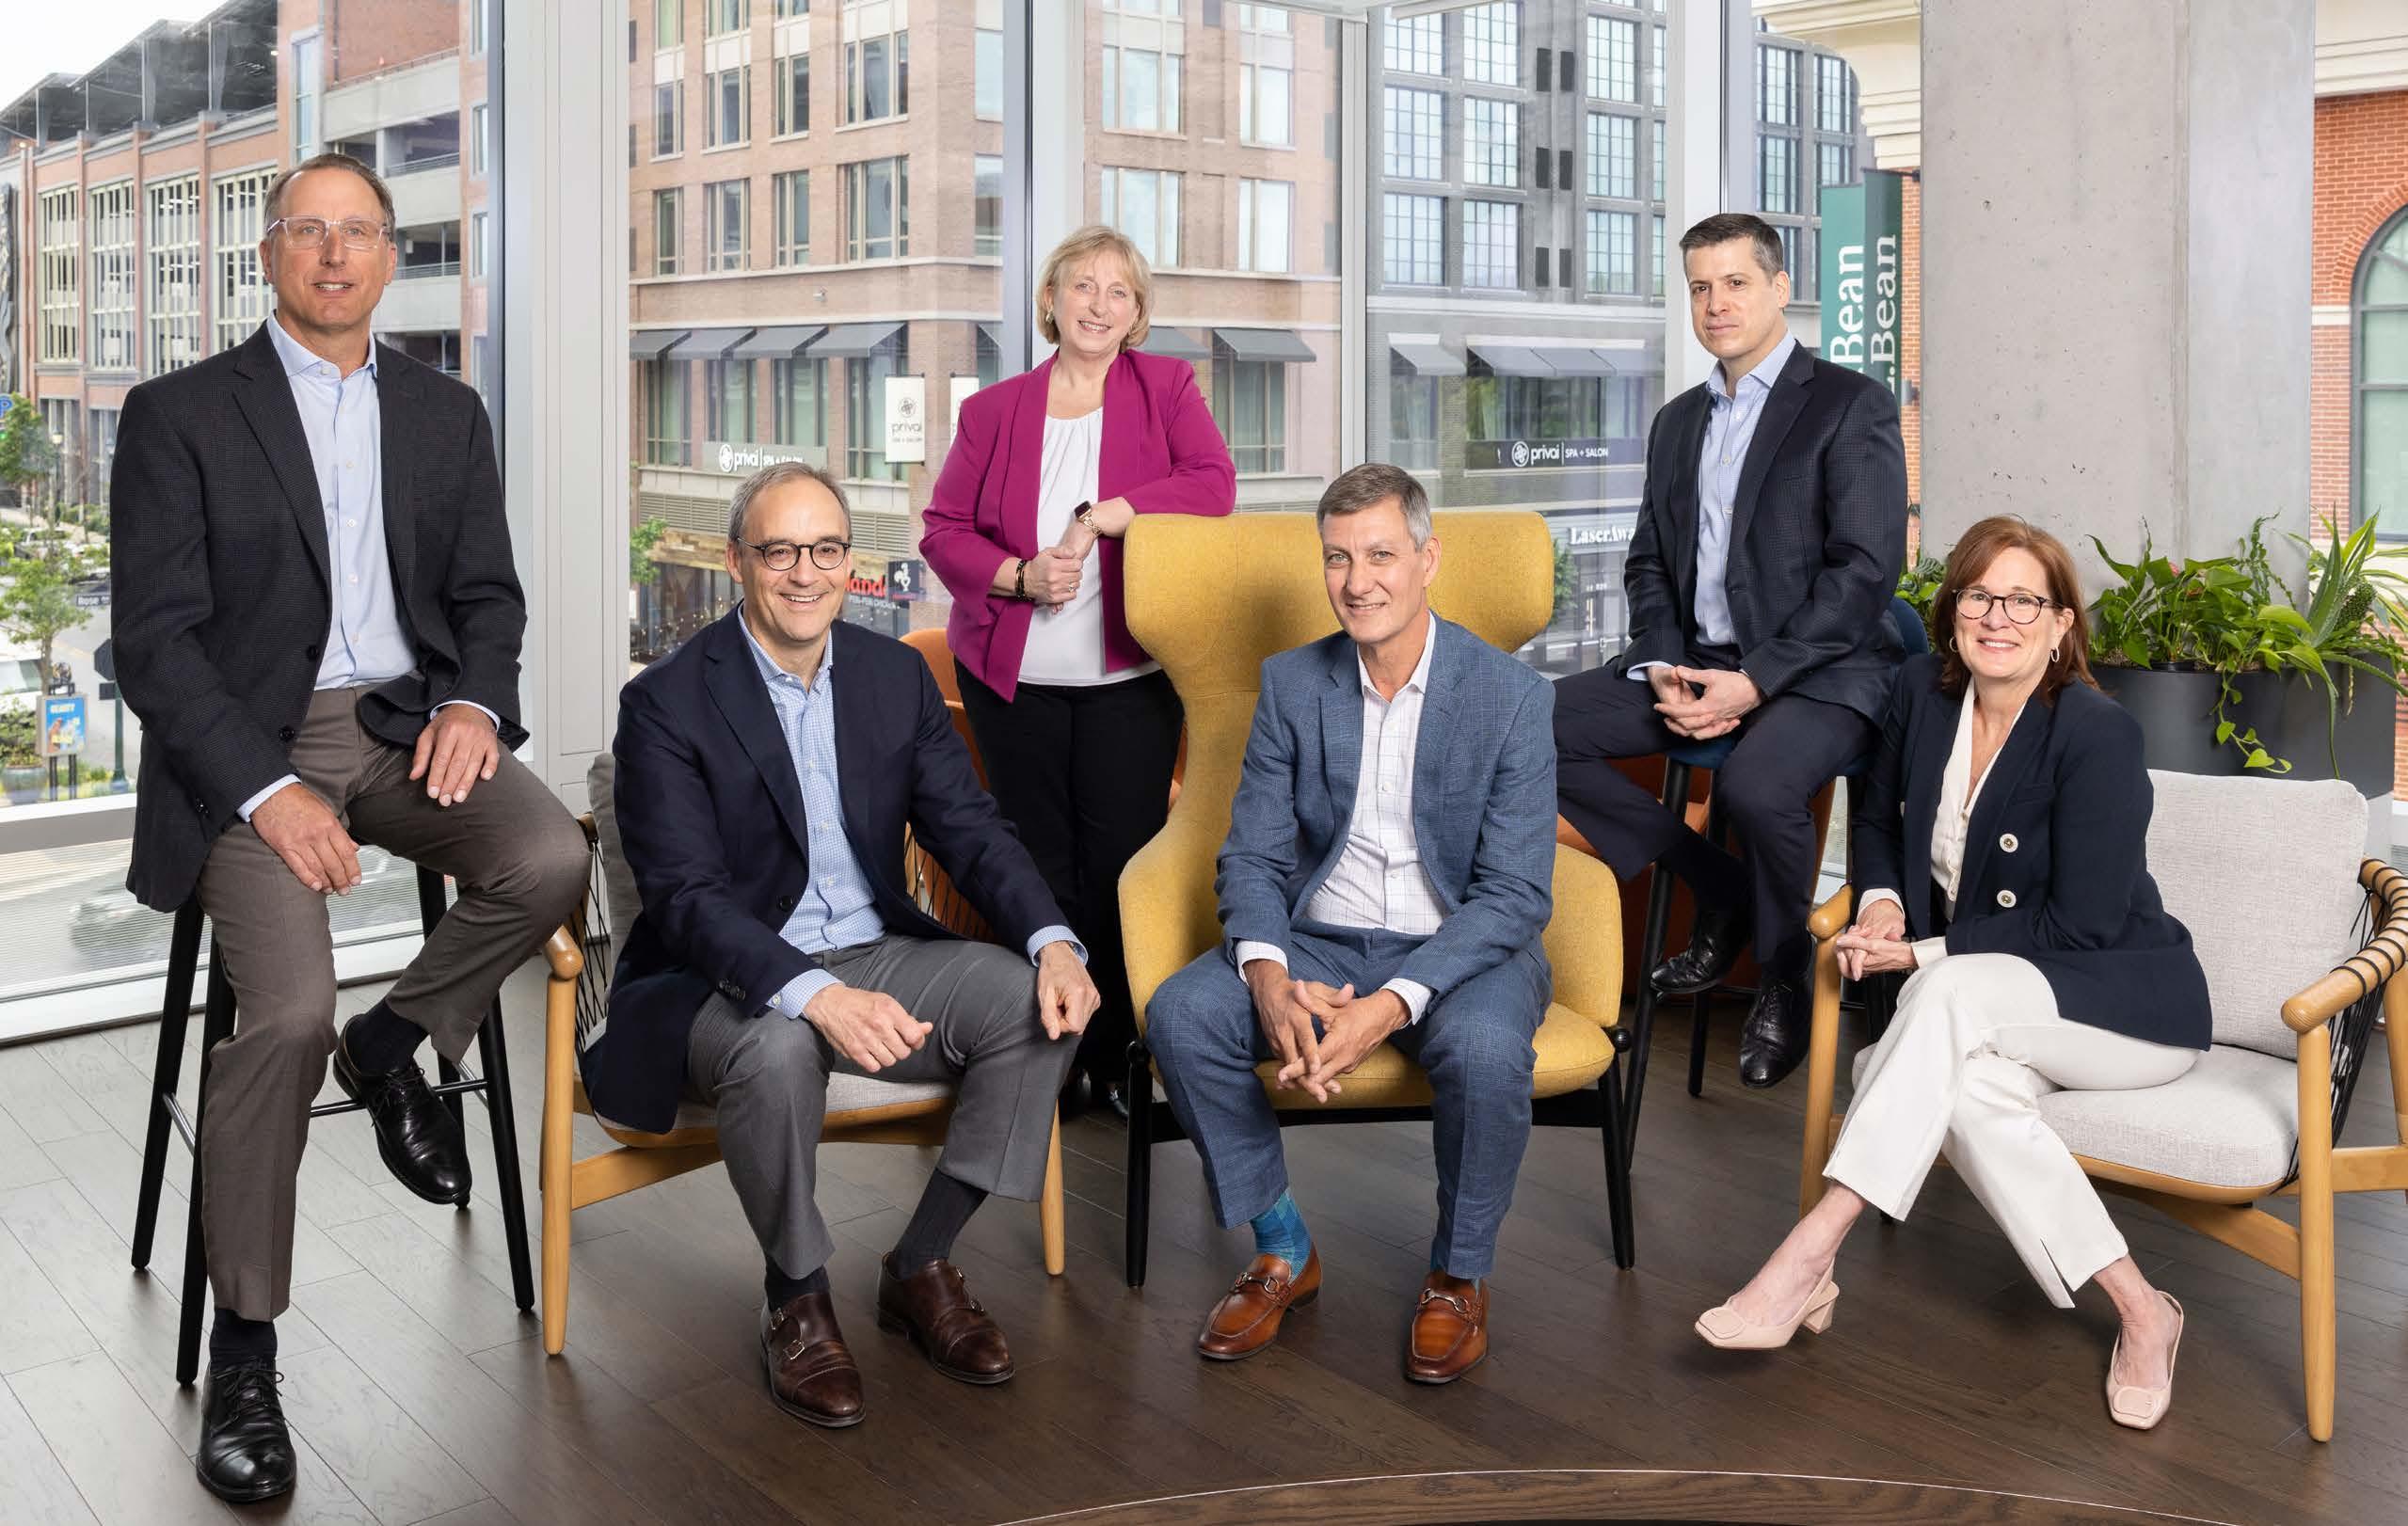 Don Wood Chief Executive Officer
Dan Guglielmone
Executive Vice President, Chief Financial Officer and Treasurer
Dawn Becker Executive Vice President, General Counsel and Secretary
Wendy Seher Executive Vice President, Eastern Region President
Jeff Berkes
President and Chief Operating Officer
Jan Sweetnam
Executive Vice President, Chief Investment Officer
Don Wood Chief Executive Officer
Dan Guglielmone
Executive Vice President, Chief Financial Officer and Treasurer
Dawn Becker Executive Vice President, General Counsel and Secretary
Wendy Seher Executive Vice President, Eastern Region President
Jeff Berkes
President and Chief Operating Officer
Jan Sweetnam
Executive Vice President, Chief Investment Officer
21
Years Average Tenure of Executive Leadership
Investing Responsibly
We are deeply committed to ensuring that our investments are made in the best interests of the business, our shareholders and other stakeholders.
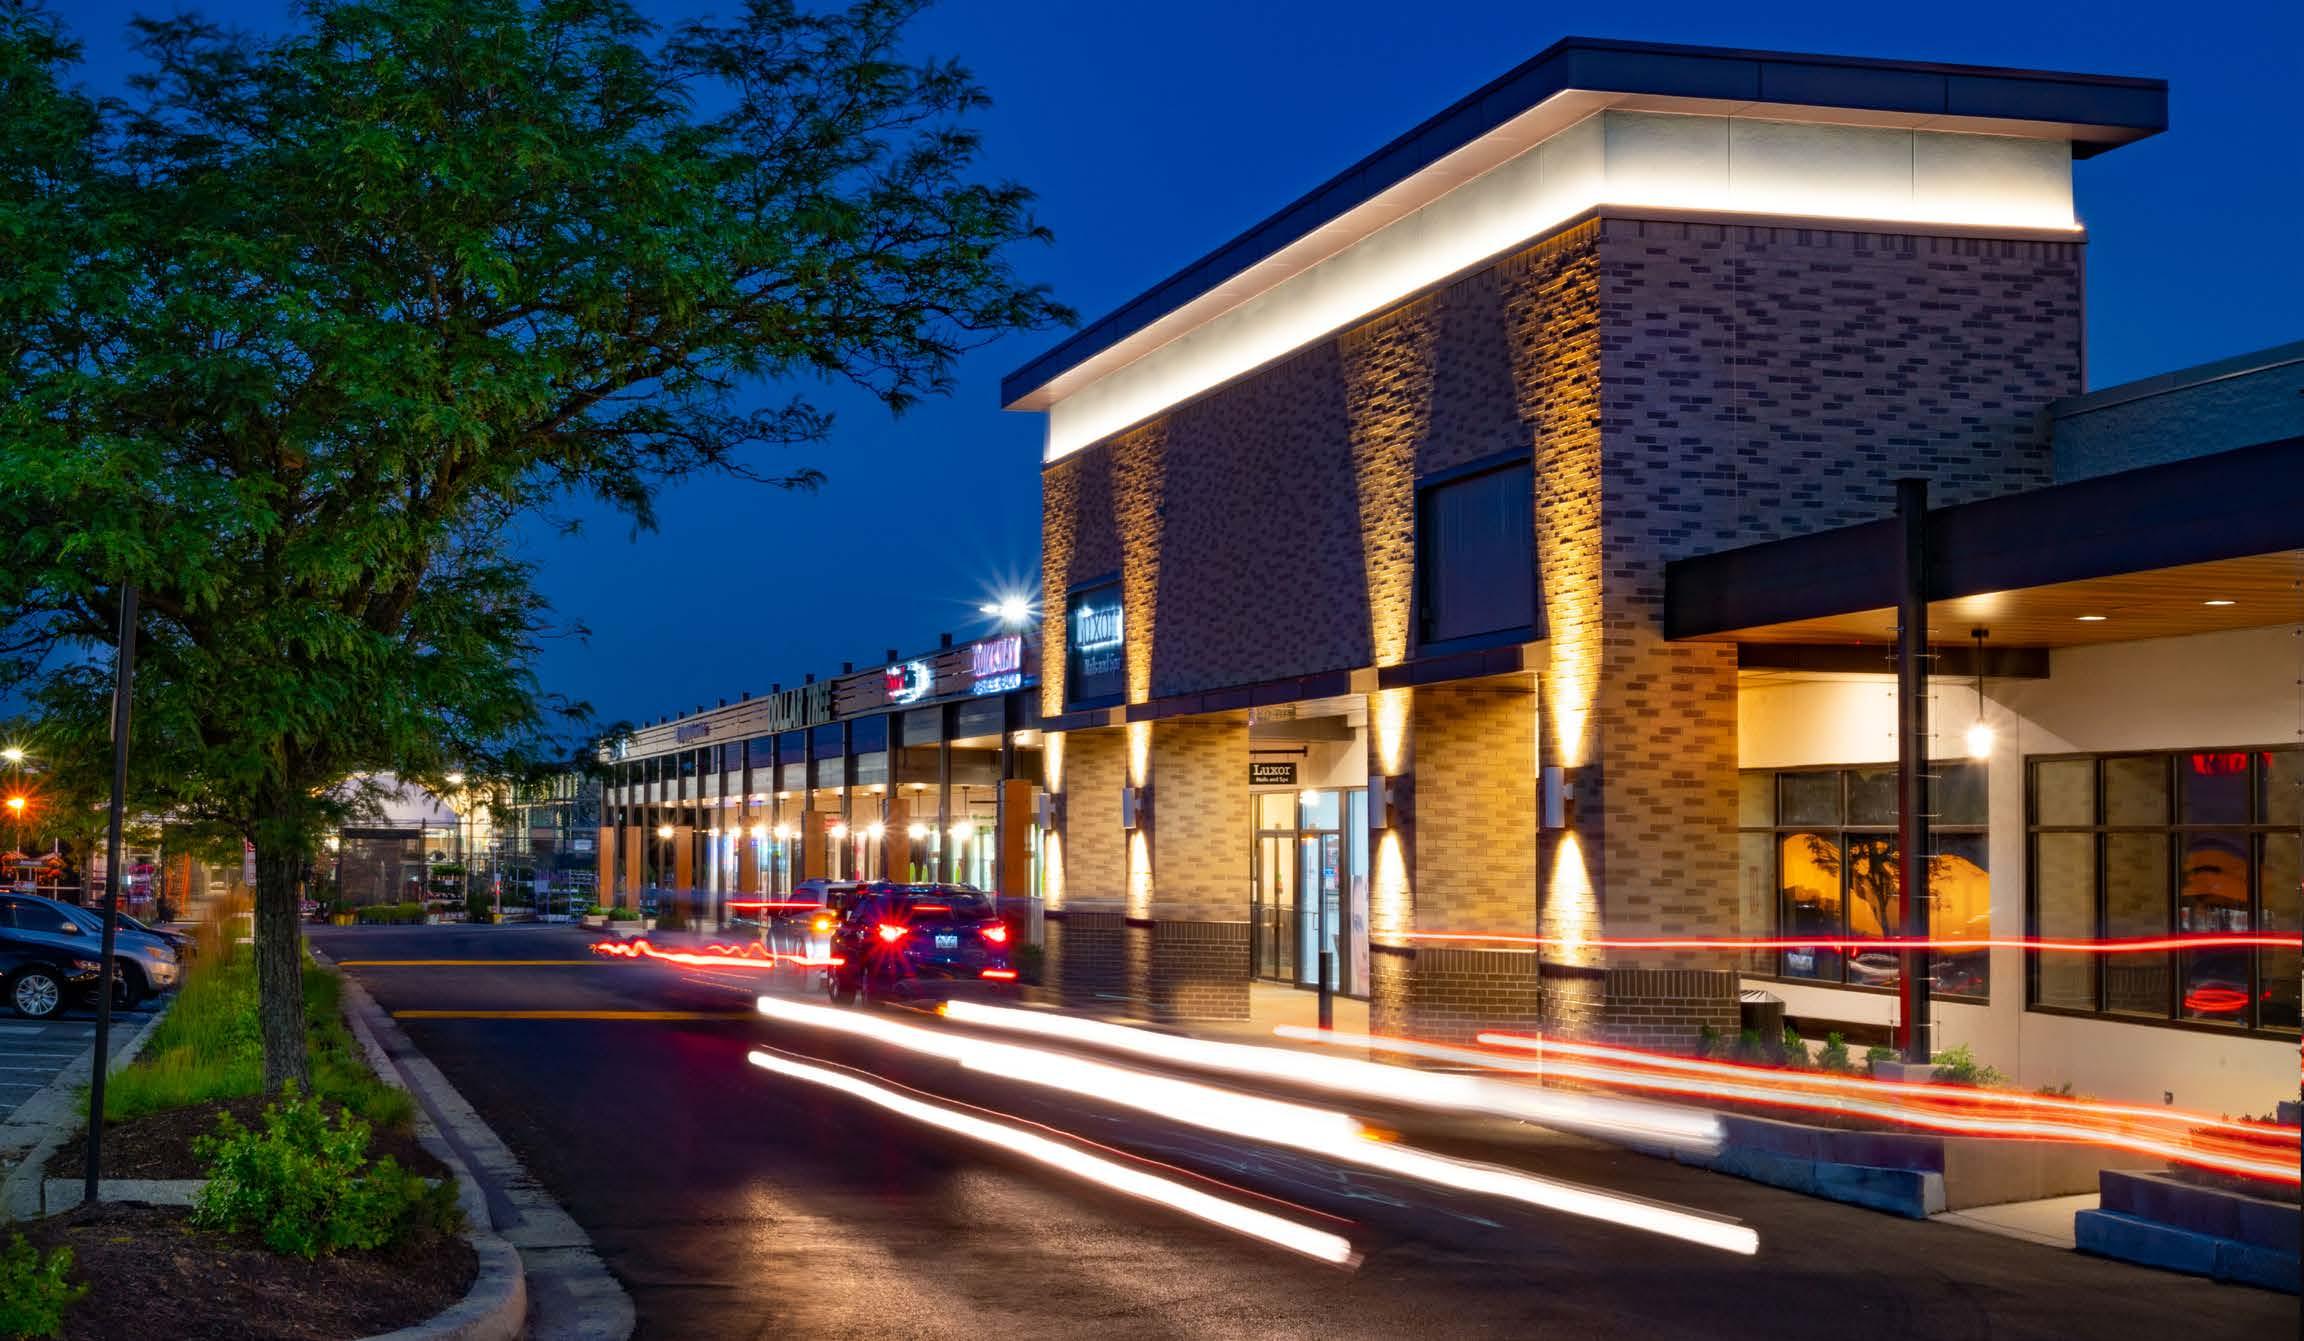
All proposed capital investments in excess of $1 million, as well as all dispositions, are presented to management's Investment Committee for review and approval.
Our eight-person Investment Committee is comprised of our CEO, President and COO, CFO, General Counsel, Chief Investment Officer, Eastern Region President, SVP of Acquisitions, and Arturo Sneider, president of Primestor, with each person having one equal vote.
The diversity of our Investment Committee members and their respective experiences and disciplines provides a full range of relevant considerations for each investment decision. Investments approved by the Investment Committee that exceed certain size thresholds must be submitted to the full Board for approval. The supporting package that is prepared for review and consideration by the Investment Committee and/or the Board includes a description of the request, detailed financial analysis, the ESG considerations related to the request, and an evaluation of major risks and potential opportunities.
Perring Plaza | Baltimore, MD 97 01 / Introduction 02 / TCFD 06 / Teams 07 / Governance 08 / Appendix 04 / Resilience 03 / Decarbonization 05 / Communities
Holding Ourselves to the Highest Standards
Integrity is one of Federal’s four core values, reflecting an expectation of the highest ethical behavior from our company, including our trustees, employees and other representatives in all aspects of our business.
Our Board has adopted a Code of Conduct that applies to every trustee and employee and addresses topics such as conflicts of interest, prohibition on bribery, fair dealing with third parties, and protection of Federal’s assets. All of our employees have confirmed their commitment to the principles of the Code of Conduct.
An additional Code of Ethics governs our most senior officers in relation to professional integrity and appropriate controls with respect to all of our financial reporting. Each year, our senior officers acknowledge their agreement to be bound by that Code of Ethics.
Employees and other parties with whom we do business can use our whistleblower hotline to anonymously report any violations of the Code of Conduct, Code of Ethics or any other behavior that may not be appropriate. Our General Counsel has direct oversight responsibility for ensuring compliance with the Code of Conduct and Code of Ethics and reports directly to the chair of the Board’s Audit Committee on any violations.
Zero Violations in 2022 Code of Conduct Violations
0 Code of Ethics Violations
0 calls to Whistleblower Hotline
0
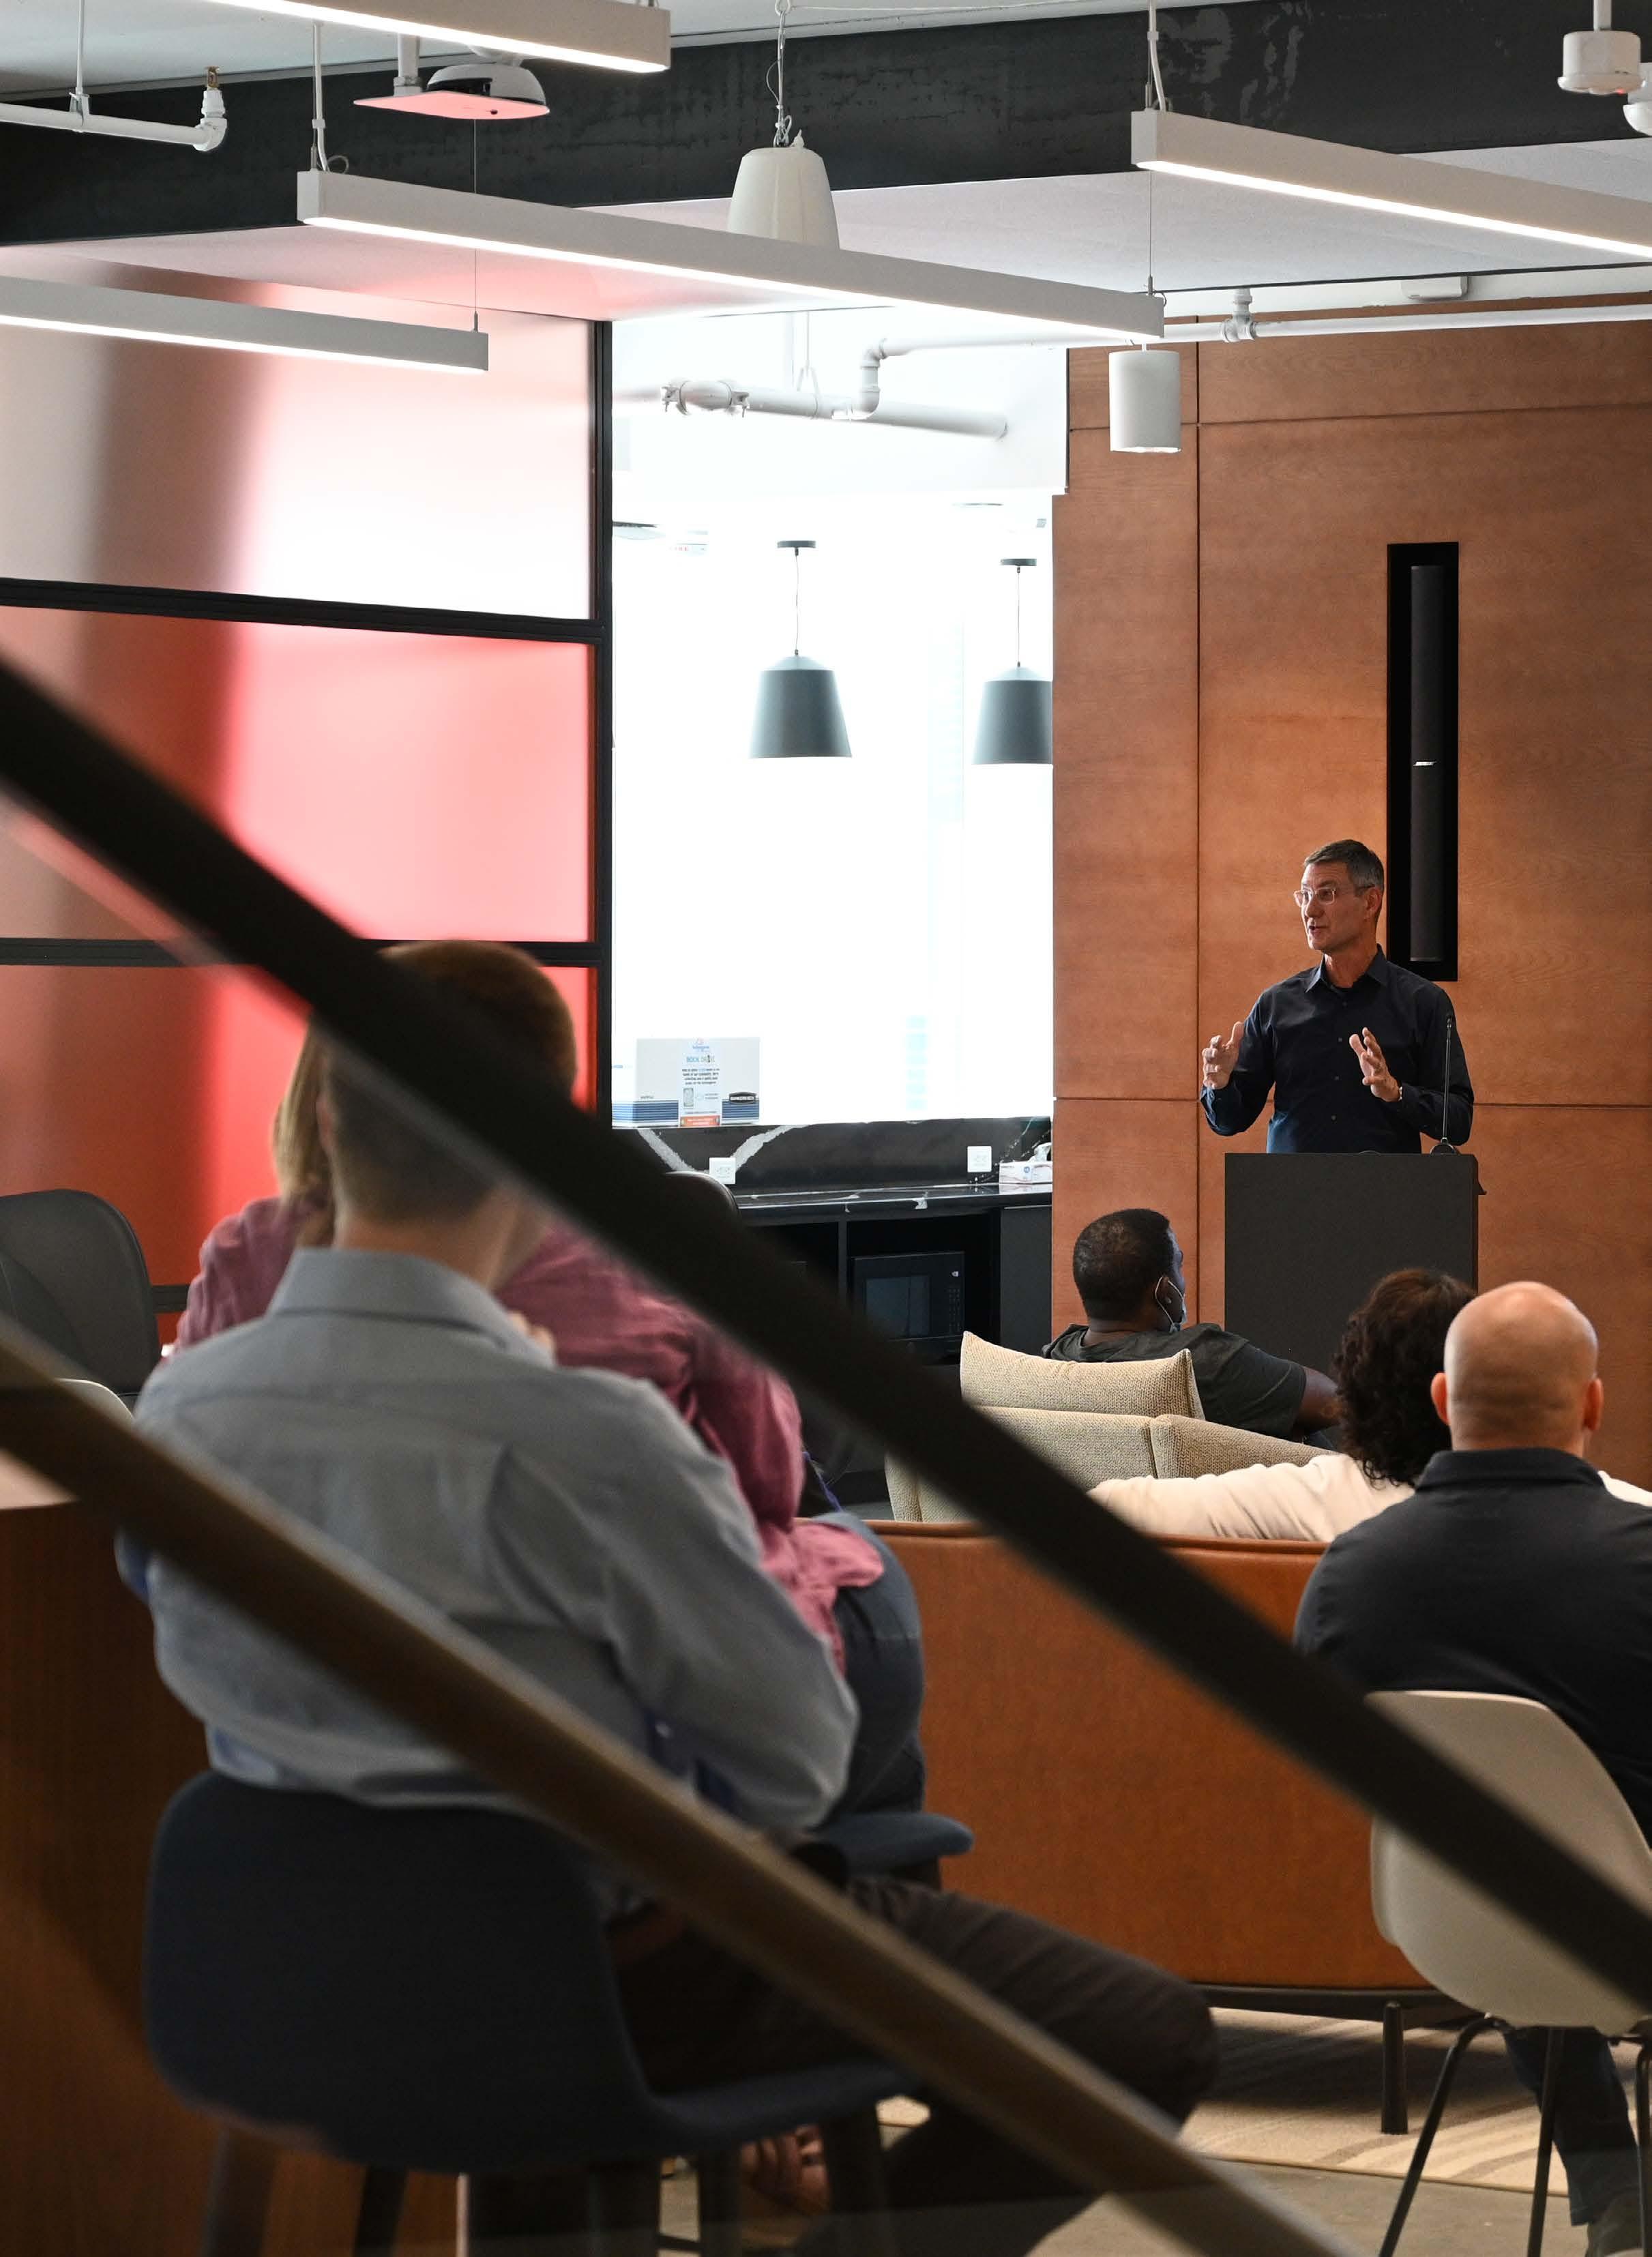
Corporate Headquarters | North Bethesda, MD 99 01 / Introduction 02 / TCFD 06 / Teams 07 / Governance 08 / Appendix 04 / Resilience 03 / Decarbonization 05 / Communities
Information Security
We have implemented strong information and cyber security measures to protect our systems and data.
The Audit Committee of our Board oversees the risk management process relating to cyber security with management responsibility falling under our Executive Vice President-General Counsel and our Chief Information Officer. We supplement our internal oversight with a third party consulting firm that serves as our chief information security officer. Management discusses with the Audit Committee each quarter all aspects of our overall cyber strategy including an identification of the company’s cyber risks, actions being taken to mitigate those risks, whether we experienced any breaches or other intrusions into our systems in the last quarter and trends we are seeing develop around cyber security matters.
Our information systems are designed to support our overall business strategy and to allow our employees to work seamlessly and securely whether within our offices or elsewhere. We focus on maintaining the security and integrity of these systems in order to mitigate the risk of them being breached or compromised in any way.

We continually evaluate risks to our systems and ways to mitigate those risks through things such as ongoing employee training, intrusion detection and prevention, response protocols for identified intrusions and business continuity and recovery plans in the event of a breach. We maintain cyber security insurance to provide further protection for our company and our assets.
System breaches are immediately reported to our senior management and the chair of the Board’s Audit Committee if it is material. Actions are immediately taken to stop the breach, evaluate the source of the breach and remediate identified vulnerabilities. Public disclosure of any breach and its impact would be made if required.
0
Information Security Breaches in 2022
Ethics in Our Value Chain
We expect our vendors, suppliers, contractors, and consultants to act with the highest degree of integrity in their own businesses as they work to support the growth of ours.
We have implemented a separate code of conduct for these groups that specifically lays out our expectations for their general business practices, their policies towards working conditions, human rights and environmental impact. The policies provide information for how to report violations, including the ability to report anonymously using our whistleblower hotline.
Political Contributions and Activities
We do not make contributions of any kind to any federal candidates or campaigns. We do authorize contributions to state and local candidates and to promote ballot initiatives when it is needed to support our business objectives in a particular locality, subject to obtaining necessary internal approvals.
In addition, Federal belongs to various trade associations that may engage in federal and local lobbying activities. We do not control those activities in any way; they are generally undertaken for the benefit of the industry and all members as a whole. We may, from time to time, lease space in our properties to candidates or campaigns solely
for office use with an express prohibition against holding any political activities at the property.
Our employees are encouraged to engage in the political and governmental process; however, with the exception of paid time off to vote, those activities are considered personal, must be undertaken on the employee’s own time, may not involve the use of company resources, and may not interfere with or disrupt our business. More detail on this topic can be found in our Policy on Political Activities and Contributions available on our website.
101 01 / Introduction 02 / TCFD 06 / Teams 07 / Governance 08 / Appendix 04 / Resilience 03 / Decarbonization 05 / Communities
Appendix

102
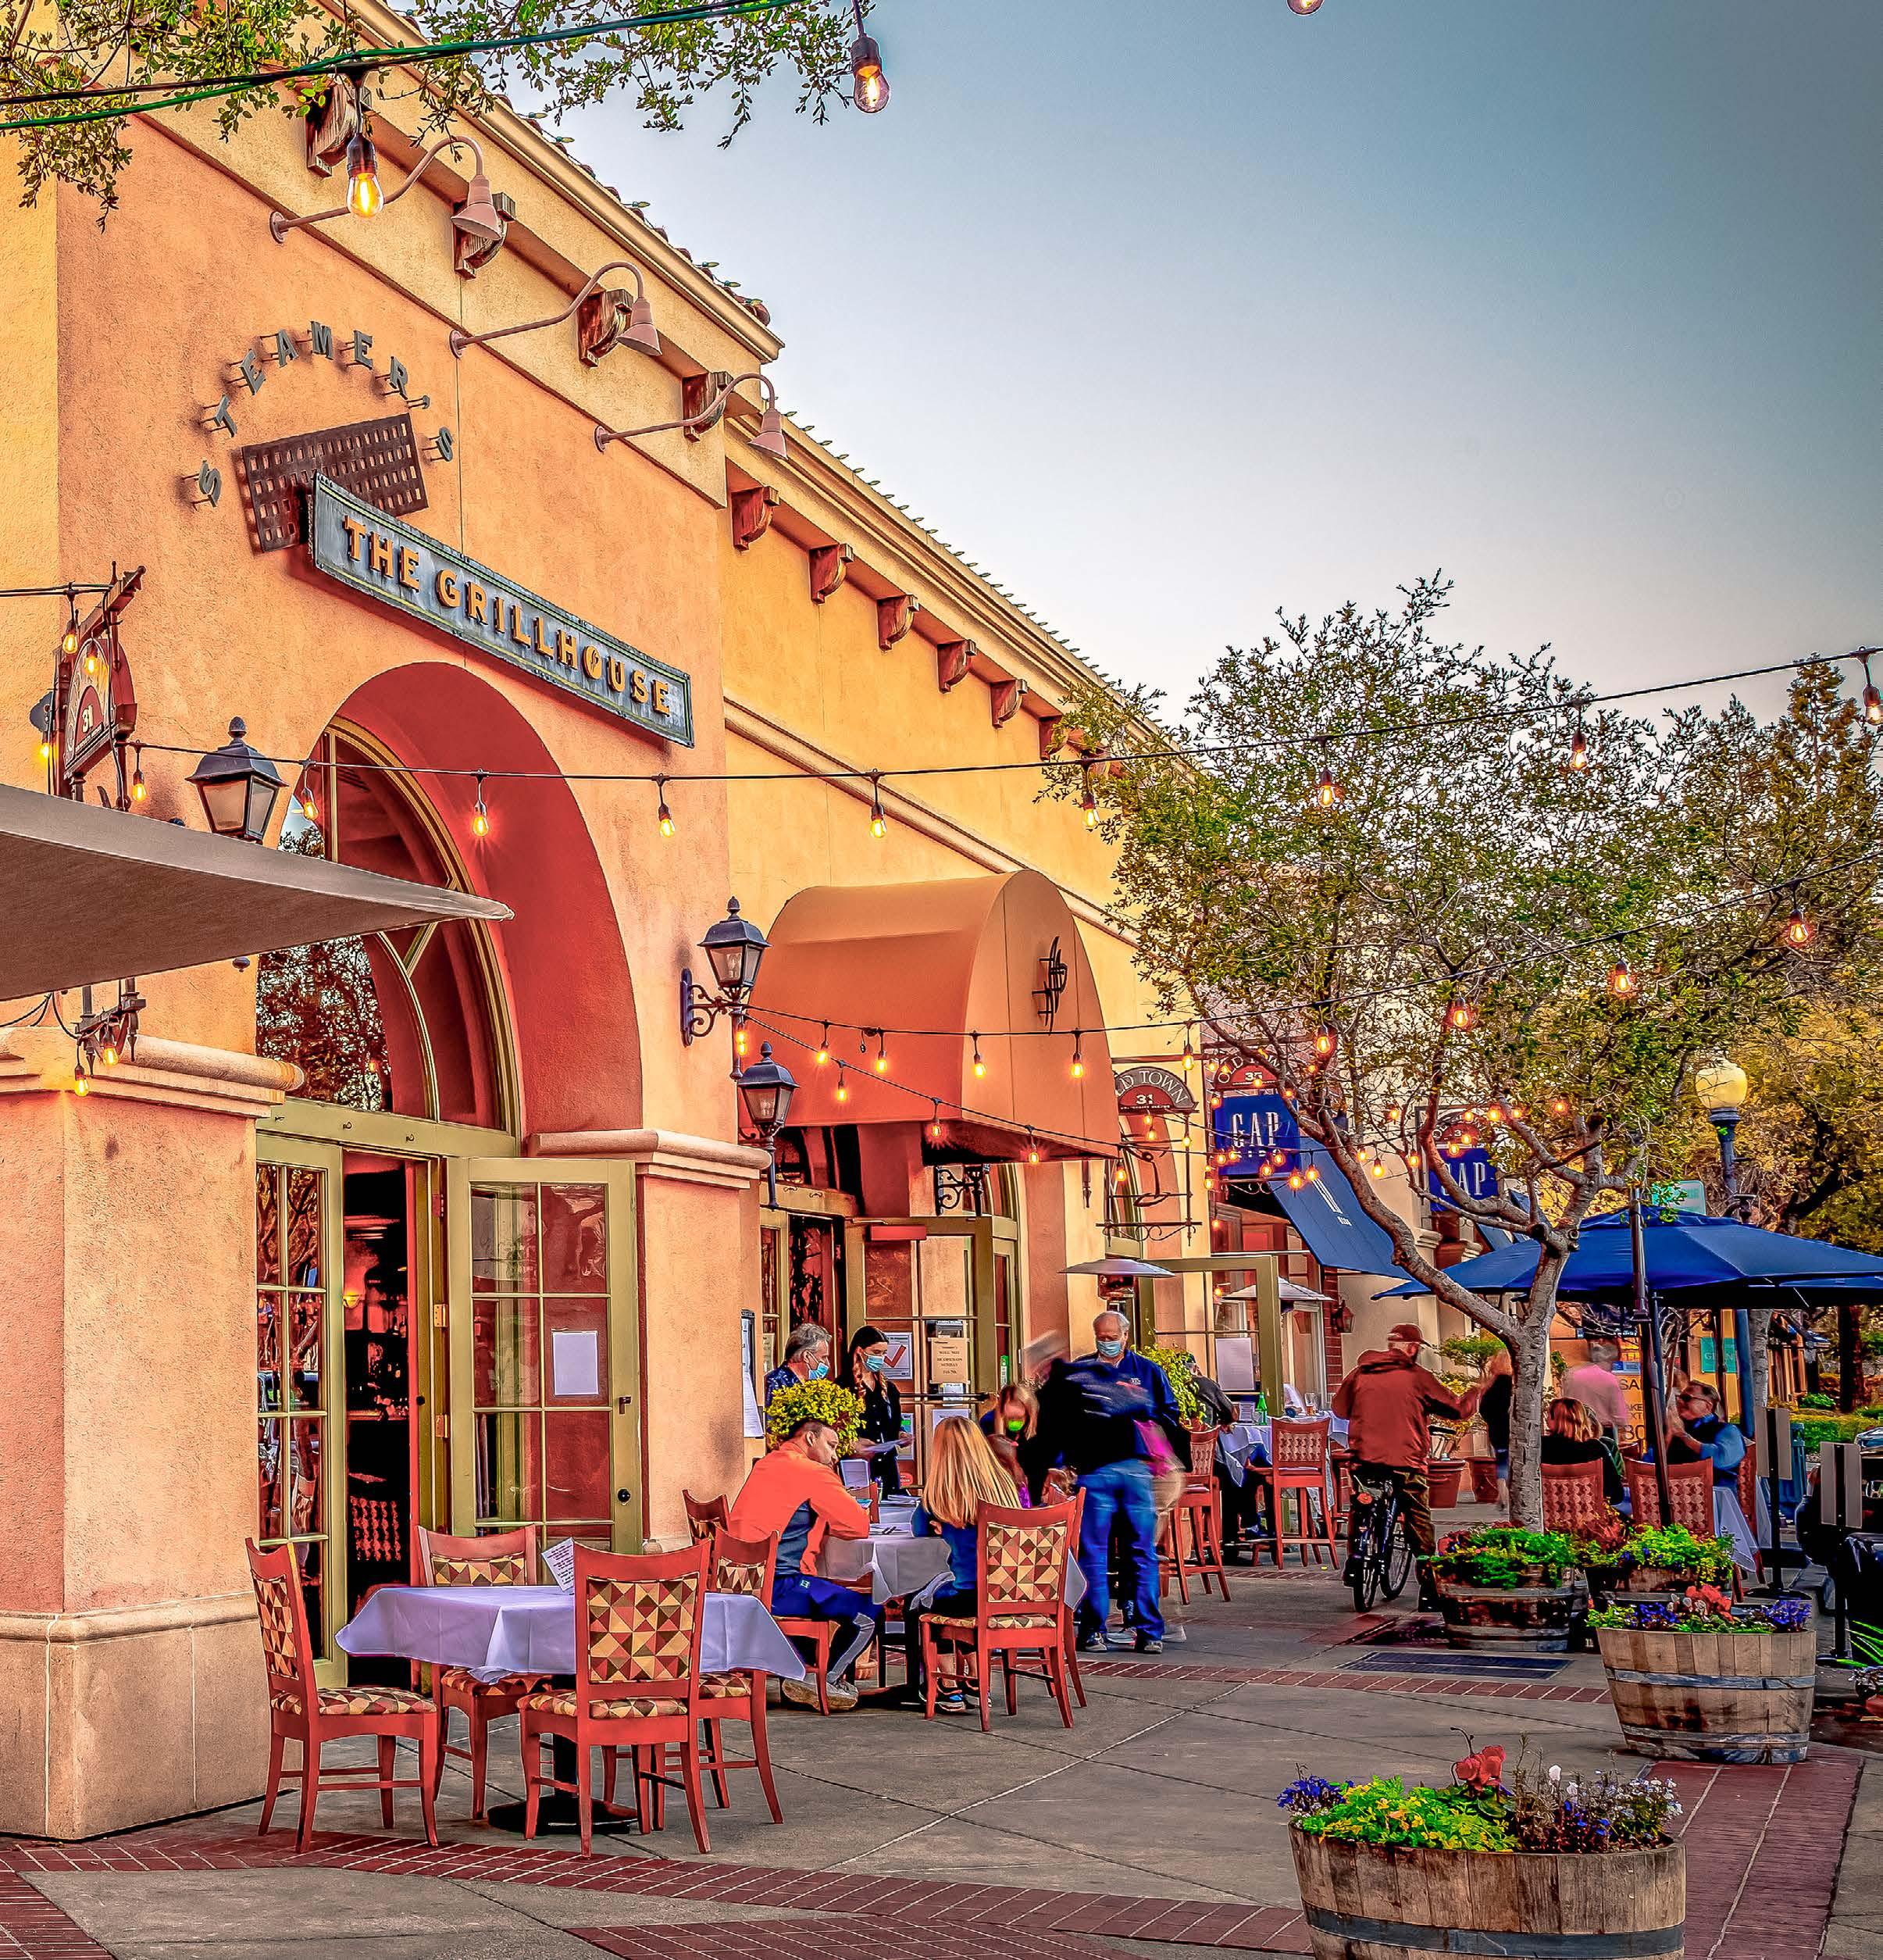
Old Town Los Gatos | Los Gatos, CA 103 01 / Introduction 02 / TCFD 06 / Teams 07 / Governance 08 / Appendix 04 / Resilience 03 / Decarbonization 05 / Communities
LRQA Independent Assurance Statement
Relating to Federal Realty Investment Trust’s Greenhouse Gas Inventory for the calendar year 2022
This Assurance Statement has been prepared for Federal Realty Investment Trust in accordance with our contract.
Terms of Engagement
LRQA was commissioned by Federal Realty Investment Trust (FRIT) to provide independent assurance of its greenhouse gas (GHG) emissions inventory (“the Inventory”) for the calendar year 2022 against the assurance criteria below to a limited level of assurance and materiality of the professional judgement of the verifier. The assurance was performed using LRQA’s verification procedure based on ISO 14064 - Part 3 for greenhouse gas emissions and in accordance with ISAE 3000.
Our assurance engagement covered FRIT’s owned, occupied and operated properties in the United States and specifically the following requirements:
• Verifying conformance with:
• FRIT’s Inventory management procedures and reporting methodologies for the selected datasets; and
• World Resources Institute / World Business Council for Sustainable Development Greenhouse Gas Protocol: A corporate accounting and Inventorying standard, revised edition (otherwise referred to as the WRI/WBCSD GHG Protocol) for the GHG data1 .
• Evaluating the accuracy and reliability of data and information for only the selected indicators listed below:
• Direct (Scope 1) and Energy Indirect (Scope 2) GHG emissions.
▪ The inventory only includes carbon dio xide (CO2), methane (CH4) and nitrous oxide (N2O)
• Energy-use data
The Inventory was reported using the Operational Control consolidation approach and covered a complete twelve months of data from properties purchased during, or owned throughout, the CY2022 reporting year. Data from properties sold during 2022 were excluded. Data related to refrigerants were excluded on the basis of their being de minimis.
LRQA’s responsibility is only to FRIT. LRQA disclaims any liability or responsibility to others as explained in the end footnote. FRIT’s responsibility is for collecting, aggregating, analysing and presenting all the data and information within the Inventory and for maintaining effective internal controls over the systems from which the Inventory is derived. Ultimately, the Inventory has been approved by, and remains the responsibility of FRIT
LRQA’s Opinion
Based on LRQA’s approach, nothing has come to our attention that would cause us to believe that FRIT has not, in all material respects:
• Met the requirements of the criteria listed above; and
• Disclosed accurate and reliable performance data and information as summarized in Table 1 below.
The opinion expressed is formed on the basis of a limited level of assurance2 and at the materiality of the professional judgement of the verifier.
1 http://www.ghgprotocol.org/
2 The extent of evidence-gathering for a limited assurance engagement is less than for a reasonable assurance engagement. Limited assurance engagements focus on aggregated data rather than physically checking source data at sites. Consequently, the level of assurance obtained in a limited assurance engagement is lower than the assurance that would have been obtained had a reasonable assurance engagement been performed.
104
Note 1: Scope 2, Location-based and Scope 2, Market-based are defined in the WRI/WBCSD GHG
Protocol Scope 2 Guidance, 2015
LRQA’s Approach

LRQA’s assurance engagements are carried out in accordance with our verification procedure. Th e following tasks were undertaken as part of the evidence gathering process for this assurance engagement:
• interviewing relevant personnel responsible for managing GHG emissions and energy-use data and records;
• assessing FRIT’s data management systems to confirm they are designed to prevent significant errors, omissions or mis-statements in the Inventory. We did this by reviewing the effectiveness of data handling procedures, instructions and systems, including those for internal quality control; and
• verifying historical GHG emissions and energy-use data and records at an aggregated level for calendar year 2022
LRQA’s Standards, Competence and Independence
LRQA implements and maintains a comprehensive management system that meets accreditation requirements for ISO 14065 Greenhouse gases – Requirements for greenhouse gas validation and verification bodies for use in accreditation or other forms of recognition and ISO/IEC 17021 Conformity assessment – Requirements for bodies providing audit and certification of management systems that are at least as demanding as the requirements of the International Standard on Quality Control 1 and comply with the Code of Ethics for Professional Accountants issued by the International Ethics Standards Board for Accountants.
LRQA ensures the selection of appropriately qualified individuals based on their qualifications, training and experience. The outcome of all verification and certification assessments is then internally reviewed by senior management to ensure that the approach applied is rigorous and transparent.
Signed
David
LRQA
On behalf of LRQA, Inc.
2101 CityWest Blvd, Houston, TX 77042
LRQA reference: UQA00002230/5664804
LRQA
The
Copyright
Dated: 26 May, 2023
Scope and Category Quantity Unit Scope 1 GHG emissions 2,630 Tonnes CO2e Scope 2 GHG emissions (Location-based) 24,478 Tonnes CO2e Scope 2 GHG emissions (Market-based) 13,108 Tonnes CO2e Landlord-controlled electricity consumption 83,230 MWh Landlord-controlled natural gas consumption 488,069 Therms
Table 1. Summary of FRIT’s GHG Emissions and Energy-use data for CY2022:
Hadlet
Lead Verifier
Group Limited, its affiliates and subsidiaries, and their respective officers, employees or agents are, individually and collectively, ref erred to in this clause as 'LRQA'. LRQA assumes no responsibility and shall not be liable to any person for any loss, damage or expense caused by reliance on the information or advice in this document or howsoever provided, unless that person has signed a contract with the relevant LRQA entity for the provision of this information or advice and in that case any responsibility or liability is exclusively on the terms and conditions set out in that contract.
English version of this Assurance Statement is the only valid version. LRQA assumes no responsibility for versions translated into other languages.
This Assurance Statement is only valid when published with the Inventory to which it refers. It may only be reproduced in its entirety.
105 01 / Introduction 02 / TCFD 06 / Teams 07 / Governance 08 / Appendix 04 / Resilience 03 / Decarbonization 05 / Communities
© LRQA, 2023
THE ORGANIZATION AND ITS REPORTING PRACTICES
Legal name
Nature of ownership and legal form
Headquarters location
Countries of operation
Entities included in sustainability reporting
Differences between entities in financial reporting and sustainability reporting
Approach used to consolidate information
Federal Realty Investment Trust
Publicly traded real estate investment trust (NYSE:FRT); 2022 Form 10-K pages 3-4 and 29
909 Rose Avenue, Suite 200, North Bethesda, MD
Report page 4; 2022 Form 10-K pages 3-4, 19 and 22-27
2022 Form 10-K page 1
None
Our properties and subsidiaries are operated as one consolidated business segment with consolidation for financial reporting being determined in accordance with Generally Accepted Accounting Principles (GAAP)

Reporting period and frequency of sustainability reporting
Reporting period for financial reporting
Publication date of report
Contact person for questions
Restatements from previous periods
Process for external assurance
ACTIVITIES AND WORKERS
Report sectors in which we are active
Value chain including products, markets, supply chain and downstream entities
January 1, 2022 through December 31, 2022; annually
January 1, 2022 through December 31, 2022; annually
June 1, 2023
Emily McLachlan, Vice President-Sustainability; 301-998-8100
None
See page 104 for assurance statement
GICS 60 Real Estate
We own 103 properties located primarily in major coastal markets of the United States. Spaces in those properties are provided for long- and short-term contracts for rent by tenants who use space for retail, office or residential purposes. Primary vendors/suppliers include utility providers, insurance companies, firms that provide day-to-day property management/maintenance support; firms that provide professional services such as legal and accounting and firms that provide construction or other services related to property development and redevelopment.
Other relevant business relationships
Significant changes from prior periods
Total number employees
Full-time employees
Part-time employees
Methodologies and assumptions
Contextual information
Significant fluctuations during/between reporting periods
Workers who are not employees whose work is controlled by the organization
Secured and unsecured lenders and various joint venture partners who own noncontrolling interests in certain of our properties.
None
319 total employees: 170 female (53%); 149 male (47%); regional differences are not material to our operations
311 full-time employees: 165 female (53%); 146 male (47%)
8 part-time employees: 5 Female (63%); 3 male (37%)
Actual headcount as of December 31, 2022; average from January 1, 2022 through December 31, 2022: 314.5
Part-time employees have reduced hours at their election and 67% of those part-time employees are eligible for benefits
None
None
DISCLOSURE RESPONSE 2-1 2-3 2-4 2-5 2-7 2-8 2-6
2-2
January 1, 2022 through December 31, 2022 GRI 1 Used GRI 1: Foundation 2021 106
GRI Index Statement of Use: Federal Realty Investment Trust has reported following the GRI Index for the period
Governance structure including committees
Committees with responsibility for overseeing impact on economy, environment and people
Describe composition of highest governing body and its committees
Nomination and selection of the highest governance body and committees
Criteria used for nominating and selecting the highest governance body members
Chair of the highest governance body
Role of the highest governance body/senior executives in developing policies and goals related to sustainable development
Describe the role of the highest governance body in overseeing processes to identify and manage impacts on the economy, environment and people
Describe the role of the highest governance body in reviewing the effectiveness of processes and report frequency of this review
Delegation of responsibility for managing impacts on economy, environment and people
Frequency for senior executives to report to highest governing body on impacts to economy, environment and people
Report whether highest governance body is responsible for reviewing and approving the reported information; describe process for review and approval
Describe process for highest governing body to prevent/mitigate conflicts of interest
Conflicts disclosed to stakeholders
Whether critical concerns are communicated to highest governing body
Number and nature of critical concerns communicated during reporting period
Measures to advance knowledge of highest governance body on sustainable development
2023 Proxy Statement pages 4-10
2023 Proxy Statement pages 6-7
2023 Proxy Statement pages 5-8, 11-13
2023 Proxy Statement pages 10-17
2023 Proxy Statement pages 10-17
2023 Proxy Statement page 5
2023 Proxy Statement pages 3-4 and 7-8
Report pages 13, 94, 95; 2023 Proxy Statement pages 3-4 and 7-8
2023 Proxy Statement pages 7-8; periodic review as needed
2023 Proxy Statement pages 3-4, 7-8; ESG Policy pages 4-5
Report page 13; 2023 Proxy Statement page 8; ESG Policy pages 4-5;
Our Board of Trustees reviews and approve our corporate responsibility report and quarterly SEC reports prior to release/filing.
Report pages 94-101; Corporate Governance Guidelines
2023 Proxy Statement pages 10, 44-45
2023 Proxy Statement page 8
None
Quarterly reports to the Board of Trustees include discussions of emerging sustainability issues and climate related risk exposure, items of concern identified by stakeholders relating to sustainability, evolving sustainability related legislation and regulation, evolving sustainability trends, progress on sustainability goals, sustainability communications and activities of other companies and the organization's activities with respect to these areas; Report Pages 13-16, 97; ESG Policy Page 5
Process for evaluating performance of the highest governance body in overseeing management of impacts on the economy, environment and people
Whether evaluations are independent and frequency
Actions taken in response to evaluations
2023 Proxy Statement page 8-9
2023 Proxy Statement pages 8-9
2023 Proxy Statement pages 8-9
2-9
2-12 2-13 2-14 2-15 2-16 2-17 2-18
2-10 2-11 01 / Introduction 02 / Decarbonization 05 / Our People 06 / Governance 07 / Appendix 03 / Community Connection 04 / Resilience GOVERNANCE DISCLOSURE RESPONSE 107 01 / Introduction 02 / TCFD 06 / Teams 07 / Governance 08 / Appendix 04 / Resilience 03 / Decarbonization 05 / Communities
Describe the remuneration policies for members of the highest governance body and senior executives
2023 Proxy Statement pages 17-39
2023 Proxy Statement pages 17-39 2-20
Describe how remuneration policies relate to objectives and performance in relation to managing impacts on economy, environment and people
Describe process to design remuneration policies and determine remuneration
Report results of votes of shareholders on remuneration policies and proposals
Ratio of total annual compensation of highestpaid individual to median annual compensation for all employees
STRATEGIES, POLICIES, AND PRACTICES
2-22
Statement about relevance of sustainable development
Policy commitments for responsible business conduct
Commitments with respect to Human Rights
Provide links to policy commitments
Highest level of approval within the organization
Extent to which policy commitments apply to activities and business relationships
Describe how policy comments are communicated to workers and other parties
Describe how policy commitments are embedded for responsible business conduct through activities and business relationships
2023 Proxy Statement pages 20-30
Form 8-K filed May 5, 2023
2023 Proxy Statement page 36
Entire Report; more specifically, pages 11, 34-35, 42-43
Code of Business Conduct, Human Rights Policy, Vendor Code of Conduct
Human Rights Policy, Vendor Code of Conduct
Code of Business Conduct, Human Rights Policy, Vendor Code of Conduct
Policies were reviewed and approved by our Board of Trustees and a senior executive within the organization
Code of Business Conduct, Human Rights Policy, Vendor Code of Conduct
Via external website, contracts, internal website and internal discussions and education
All employees are required to comply with our policies and procedures, and responsibility for enforcing compliance lies at all levels of the organization with specific responsibility depending on the particular group and reporting structure for that group. Employees initiating business relationships are responsible for confirming that the other party operates its business in a reputable manner that is consistent with the quality and reputation of our organization. Internal controls requiring more senior level approvals before entering into contracts that establish our business relationships provide ongoing conversation, education and training on our various commitments.
Describe commitments to cooperate in remediation of negative impacts
Our primary exposure for negative impacts is environmental contamination at one of our properties arising prior to or during our ownership generally from the operations of one or more tenants who have operated at the property. We provide in all leases various provisions requiring tenants to refrain from activities that could cause environmental contamination and to clean up any contamination they cause. We undertake to remediate any environmental contamination of which we are aware as required under various federal, state and local laws, rules and regulations.
Describe approach to identifying and addressing grievances
We generally become aware of issues through notification from a governmental authority or from our own investigation and testing prior to acquisition of properties and as part of our ongoing operation of our properties. Although matters could proceed through litigation and government enforcement, we typically work with government agencies to resolve issues prior to legal enforcement actions being taken or fines being assessed.
Describe process for remediation of negative impacts
Describe how organization tracks effectiveness of grievance process and remediation mechanisms
We evaluate properties prior to acquiring them and continually monitor assets we own to identify any potential environmental issues. Remediation of issues identified are included as part of the operating plans for that asset over time.
Effectiveness of the grievance mechanisms is demonstrated by receiving a final notice from the applicable governmental authority indicating that remediation has been completed to their satisfaction and the property now meets applicable standards.
2-23 2-24
2-25
2-21 2-19 DISCLOSURE RESPONSE 108
Describe mechanisms for individuals to seek advice on business conduct and raise concerns
For any employee or other person or entity with close contacts in the organization, advice can be sought from and concerns can be raised with either the office of the General Counsel or the Human Resources Department, the primary groups responsible for monitoring compliance with our policies and procedures. Employees as well as outside parties can also call, on an anonymous basis, into our whistleblower hot line with the number for that hot line available in a number of locations internally as well as on our public website. Lastly, issues can also be raised directly with our Board of Trustees using the communication methodology posted on our website and in our public documents.
Report total number of significant instances of non-compliance with laws, etc.
Report monetary value of fines for non-compliance
Describe how determine significant instances of non-compliance
Report industry associations, etc. in which it participates in a significant role
National Association of Real Estate Investment Trusts (including CEO Council for Diversity); ICSC; Urban Land Institute; Montgomery County Chamber of Commerce
MATERIALITY
Material Topics and Management of Material Topics ECONOMIC PERFORMANCE
Direct economic value generated and distributed on an accrual basis Risks and opportunities posed by climate change that can generate substantive changes in operations, revenue or expenditure
The interaction with stakeholders varies depending on the stakeholder group and ranges from frequent interpersonal interaction to communication through electronic platforms.
Federal Realty frequently communicates and engages with its stakeholders including investors, employees, tenants, shopping center customers, and more to assess material topics. These topics are assessed and reviewed on an ongoing basis. The topics listed below have been identified to be the most material to our business, through the lens of ESG.
Advance Decarbonization (Report Pages 20-37)
• Reducing energy consumption and emissions throughout our portfolio in developments and operating assets
• Supporting the transition to a low carbon economy through investment in onsite renewables and EV charging infrastructure
Strengthen Resilience (Report Pages 38-51)
• Evaluate transition and physical risk for entire portfolio, and new acquisitions
• Develop and execute on plans to mitigate identified risks
• Protect natural resources by reducing water consumption, improving waste diversion rates, and protecting biodiversity
Connect Communities (Report Pages 52-73)
• Ensure properties are integral part of their communities
• Own and operate assets in ways that advance social equity
Empower Teams (Report Pages 74-91)
• Create a workplace where employees feel challenged, heard, safe, and engaged with opportunities to grow
• Prioritize health and wellness for all employees
• Provide competitive benefits to employees
Govern Responsibly (Report Pages 92-101)
• Establish a sound foundation for how to run the company with standards for operating ethically and respectfully
• Maintain appropriate fiscal and decision making controls to manage risk
2022 Form 10-K pages 31-49
Report pages 12-19; 2022 Form 10-K pages 4, 12, 14-15 and 32
STAKEHOLDER ENGAGEMENT 2-29 2-30 Approach to engaging with stakeholders Report percentage of total employees covered by collective bargaining agreements
0%
201-1 201-2 201-3
Defined benefit plan obligations and other retirement plans
2022 Form 10-K page F-37 3-1, 3-2;
3-3
None None Assessment based on severity and financial magnitude of any non-compliance 2-27 2-28
2-26 DISCLOSURE RESPONSE 109 01 / Introduction 02 / TCFD 06 / Teams 07 / Governance 08 / Appendix 04 / Resilience 03 / Decarbonization 05 / Communities
205-2
Number and percentage of governance body that anti-corruption policies have been communicated to
Number and percentage of employees that anti-corruption policies have been communicated to
Percentage of governance body members received training on anti-corruption
Percentage of employees body members received training on anti-corruption
100% of Board of Trustees receive information on Code of Business Conduct
100% of employees receive training on our Code of Business Conduct
205-3
Total number of confirmed incidents of corruption
BEHAVIOR
There were no confirmed incidents of corruption of any type in 2022.
206-1
Legal actions pending or completed regarding anti-competitive behavior, antitrust and monopoly practices
There were no pending or completed legal actions in 2022 relating to any type of anticompetitive behavior or violations of anti-trust or monopoly legislation
302-1
For various reasons, Federal Realty tracks year over year energy consumption with two primary methods as shown and described below.
Includes 100% data coverage for landlord controlled energy consumption for all assets owned and operated during 2022, but excludes energy data from assets sold in 2022. In alignment with the GHG protocol, we have included 12 months of data for the assets acquired in 2022 in the reporting period, as well as all years included above prior to ownership. For months where we do not have actual energy consumption data, we apply estimates in accordance with the GHG protocol. This method is how we track our performance against our Science Based Targets for emissions reductions; since energy usage is directly aligned with emissions, we are tracking our energy usage in the same fashion.
*Includes onsite solar generation where SRECs are retained, as well as RECs and EFECs (generated from hydro power and nuclear) purchased via electric supply agreements
**Metric has been assured by LRQA; please see full assurance statement here
***Metric has been assured by LRQA; please see full assurance statement on report page 104 and 105.
Includes 100% data coverage for landlord controlled energy consumption for all assets owned and operated during year listed for only the period of time under ownership.
*Includes onsite solar generation where SRECs are retained, as well as RECs and EFECs (generated from hydro power and nuclear) purchased via electric supply agreements
**Metric has been assured by LRQA; please see full assurance statement here
Total electricity sold: 44,239,931 kWh. Includes solar production and grid-purchased electricity that was billed back to tenants in 2022
Statement prepared in consultation with RE Tech Advisors. Conversion factors from EPA eGRID and US Climate Registry
2019 2020 2021 2022 2019 2020 2021 2022 22,062 17,964 34,245 40,265 23,166 17,964 35,219 40,888 58,090 56,052 44,050 42,965 51,805 50,791 38,679 40,660 80,152** 74,017 75,295 83,230*** 74,971 68,756 73,898 81,548** 14,808 11,474 14,873 14,300*** 12,710 10,531 16,328 15,615** 94,959 85,491 93,168 97,531 87,680 79,287 86,205 97,162 Energy Usage Per Inventory Management Plan Energy
Total Renewable Electric Consumption (MWh)* Total Renewable Electric Consumption (MWh)* Total Nonrenewable Electric Consumption (MWh) Total Nonrenewable Electric Consumption (MWh) Total Electric Consumption (MWh) Total Electric Consumption (MWh) Total Nonrenewable Fuel Consumption (MWh) Total Nonrenewable Fuel Consumption (MWh) Total Energy Consumption (MWh) Total Energy Consumption (MWh) ENERGY
Usage During Time Under Ownership
Energy consumption within the organization ANTI-CORRUPTION ANTI-COMPETITIVE
100% 100%
DISCLOSURE RESPONSE
110
302-2
302-3
302-4
Measured energy consumption outside of the organization: 257,395,436 kWh
Measured + Estimated energy consumption outside of the organization: 714,698,090 kWh
Calculated in consultation with RE Tech Advisors in accordance with the GHG Protocol. Measured energy consumption includes energy purchased by Federal and allocated to tenants as well as aggregate usage data provided by utilities. This represents 58% of total Gross SF.
Estimated energy consumption is for those spaces where we do not have actual data.
Estimates were calculated using the nationally recognized CBECs dataset and is applied to the specific tenant’s use of the space and property location. Data was estimated for 42% of Gross SF.
Conversion factors from EPA eGRID and US Climate Registry
2022 FRIT Attributable Electricity intensity: 2.27 kWh/sq ft; 2022 FRIT Attributable Energy Use Intensity: 2.71 kWh/sq ft
Intensity metrics calculated using FRIT attributable electric and energy consumption respectively, divided by total gross floor area of Federal's portfolio
Site EUI includes 100% of Scopes 1 and 2 fuel consumption and electricity
Intensity metrics include energy consumption within the organization
Report pages 25-26;
304-1
304-2
EMISSIONS
Water consumption
2022 municipally supplied landlord controlled water (including common area and vacant space): 243,172 CCF
Operational sites owned, leased, managed in, or adjacent to, protected areas and areas of high biodiversity value outside protected areas
Significant impacts of activities, products, and services on biodiversity
305-1; 305-2 Direct (Scope 1) GHG emissions and Energy indirect (Scope 2) GHG emissions
WATER DISCLOSURE RESPONSE Scope 1 Scope 2 Scope 1 Scope 2 Scope 1 Scope 2 Scope 1 Scope 2
AND 2,493** 24,540** 6,034 22,693 2,741 23,174 2,630*** 24,478***
ESG Policy page 14; Report pages 48-51
Emissions Per Inventory Management Plan (MTCO2e) Emissions During Time Under Ownership (MTCO2e) Location Based Market Based Location Based Market Based
2019 2020 2021 2022
2,493** 20,705** 6,034 17,529 2,741 13,676 2,630*** 13,108***
Includes 100% data coverage for GHG emissions for all assets owned and operated during 2022, but excludes assets sold in 2022. In alignment with the GHG protocol, we have included 12 months of data for the assets acquired during the reporting period, as well as all years included above prior to ownership. This method is how we track our performance against our Science Based Targets for emissions reductions.
Calculated in consultation with RE Tech Advisors in accordance with the GHG Protocal Corporate Standard, organizational control method. Emissions factors from EPA eGRID and US Climate Registry.
***Metric has been assured by LRQA; please see full assurance statement on page 104 and 105.
2,354 22,327 3,593 20,289 3,209 21,225 2,868*** 23,812***
2,354 21,978 3,593 14,995 3,209 11,428 2,868*** 12,252***
Includes 100% data coverage for GHG emissions for assets only during period of ownership.
Calculated in consultation with RE Tech Advisors in accordance with the GHG Protocal Corporate Standard, organizational control method. Emissions factors from EPA eGRID and US Climate Registry.
***Metric has been assured by LRQA; please see full assurance statement here.
111 01 / Introduction 02 / TCFD 06 / Teams 07 / Governance 08 / Appendix 04 / Resilience 03 / Decarbonization 05 / Communities
consumption outside of the organization
intensity
of energy consumption
Energy
Energy
Reduction
303-5
ESG Policy page 14; Report pages 48-51; 39% of properties, by asset value, have a LEED or IREM certification obtained by Federal Realty lessening the impact of activities, products, and services on biodiversity EFFLUENTS BIODIVERSITY
** Metric has been assured by LRQA; please see full assurance statement here.
306-3, 306-4,
Other indirect (Scope 3) GHG emissions
Scope 3 market based emissions: 203,787 MTCO2e
Reported Scope 3 includes both measured and estimated tenant emissions, measured Federal Realty Business Travel, estimed Federal Realty Employee Commuting, and Emissions associated with waste generated on our properties. Property related metrics reflect emissions during time under ownership. Calculated in consultation with RE Tech Advisors in accordance with GHG Protocal Corporate Standard, organizational control method. Emissions factors from EPA eGRID and US Climate Registry. Estimates calculated using CBECs data. The emissions in approximately 58% of Federal Realty's gross square footage is actual and measured. We have a goal to increase our data coverage of actual measured usage to 75% of our gross square footage by 2030.
Waste generated, diverted from disposal, directed to disposal
Additionally, we measured the estimated embodied carbon emissions for 2 recent development projects to be 32,686 MTCO2e using the OneClick LCA tool. It is not included in our Scope 3 total because we do not have this measurement for our other development projects that occurred in 2022 and are not confident in alternative estimation methods.
2022 greenhouse gas emissions intensity: 0.00042 MTCO2e/sq ft using total portfolio gross floor area. Includes scopes 1 and 2 market based emissions.
Report page 25, 26-37
Report pages 36, 46-47
Total weight of waste generated: 54,466 metric tons
Total weight diverted from landfill: 16,572 metric tons
Total weight directed to landfill: 37,894 metric tons
Diversion rate: 30%
ENVIRONMENTAL COMPLIANCE
Non-compliance with environmental laws and regulations
Federal is in the process of working with governmental agencies on remediating environmental conditions at our properties that are required to be remediated at this time. We have not identified any non-compliance with environmental laws and/or regulations that must be remediated at this time other than matters which are currently being addressed. We did not incur any fines or non-monetary sanctions for noncompliance with environmental laws or regulations.
EMPLOYMENT
401-1 401-2
Number and rate of new employees
Number and rate of turnover
Benefits that are standard for full time employees that are not provided to temporary or part-time employees
New Hires: 64; 24 women (38%) and 40 men (62%); 8 under 30 (13%), 35 between 30-50 (55%) and 21 over 50 (33%)
Terminations: 55 (41 voluntary and 14 involuntary); 25 women (45%) and 30 men (55%); 9 under 30 (16%), 27 between 30-50 (49%) and 19 over 50 (35%)
Report pages 86-91; In addition to providing market-competitive compensation through a base salary and annual bonus, we also provide all of our year-round full- and part-time employees with a wide range of other benefits.
Medical, dental, and vision insurance to support the health and wellbeing of our employees and their families, with different options depending on personal and family needs
Basic life insurance, accidental death and dismemberment, and short- and long-term disability insurance
Offer four weeks of paid family and medical leave in a 12-month period to eligible employees.
Employees are allowed paid time off up to 10 work days for bereavement leave to assist in attending to obligations and commitments for close relatives.
Provide education financial assistance to employees up to $5,250 annually for tuition, textbooks, and required course fees.
GHG emissions intensity
305-4 305-3
Business Travel Employee Commuting Waste Generation Tenant Operations Scope 3 Location Based Emissions 157 157 732 732 21,575 21,575 184,171 181,323 Scope 3 Market Based Emissions 305-5 Reduction of GHG emissions
WASTE
306-5 307-1
DISCLOSURE RESPONSE 112
SAFETY
403-2 Description of process to identify work-related hazards
Process for workers to report work-related hazards
Description of process to investigate and identify work related hazards
Paid vacation, personal days, sick time, and company holidays to encourage time away from work. Generous leave and accrual policy allows employees to accrue and carry over 320 sick hours and 320 vacation hours each year.
Company-matching contributions to a 401K retirement savings plan for all full- and parttime employees. All employees are automatically enrolled when they join the company.
Paid day off to volunteer at election polls in presidential elections.
$16 per hour minimum wage for all year-round full- and part-time employees.
Employee assistance programs to provide help on topics including emotional health, counseling and well-being, work-life balance as well as financial and legal advice.
Flexible spending and health savings accounts to allow employees to pay for certain medical expenses with pre-tax dollars.
An employee stock purchase plan to allow employees a simple way to acquire company stock without commissions.
Discounts on rent at company-owned apartment complexes.
Added benefits like flexible work arrangements, bagel Wednesday, frequent retaileroffered discounts, fitness center reimbursements, casual office dress every day, free parking at our offices, and commuter benefits.
Federal offers four (4) weeks of paid family and medical leave benefits in a 12-month period to eligible employees. In addition, to paid medical leave, birth mothers receive short-term disability and have the option to use accrued paid time off. Non-birth parents have the right to take paid family leave and have the option to use accrued paid time off. Generous leave and accrual policy allows employees to accrue and carry over 320 sick hours and 320 vacation hours each year.
Total number of employees entitled to parental leave by gender: 3 men; 7 women
Total number of employees that took parental leave by gender: 3 men; 7 women
Total number of employees that returned to work after parental leave ended by gender: 3 men; 7 women
Total number of employees that returned to work after parental leave ended that were still employed 12 months after their return to work by gender: 2 men; 5 women
Return to work and retention rates of employees that took parental leave by gender: 67% men; 71% women
Federal complies with all applicable laws regarding workplace safety. Please also see linked OHS Policy that is displayed in all of Federal's corporate offices, is sent directly to fully remote employees, and is available on our intranet.
Employees are encouraged to identify and advise the appropriate person in the office of any potential hazard.
If an issue is identified, Federal works to promptly correct the issue and to cause the problem to be made safe pending a correction. Any injuries are reported to our Human Resources team and to our worker's compensation insurer.
401-3
leave OCCUPATIONAL HEALTH &
Parental
403-9 403-10 Number and rate of fatalities Number and rate of high consequence injuries Number and rate of recordable work related injuries Number of fatalities from work-related ill-health Number of cases of recordable work-related ill health None None 2
employee. None None DISCLOSURE RESPONSE
incidents with a total of 0 hours of lost work. 1 incident had a total of 80 days of restriction for the
113 01 / Introduction 02 / TCFD 06 / Teams 07 / Governance 08 / Appendix 04 / Resilience 03 / Decarbonization 05 / Communities
Type and scope of programs implemented and assistance provided to upgrade employee skills.
Percentage and total employees who receive regular performance and career development review
Percentage of individuals in governance bodies in each diversity category
All employees are encouraged to participate in both internal and external training opportunities and we make money available on an annual basis to support external training opportunities. Based on information available to us, we estimate that our employees have spent more than 4,500 hours in 2022 on training activities which equates to approximately 15 hours per employee, on average.
Report page 86
All employees are eligible to receive formal written or oral annual performance reviews.
Percentage of employees in each diversity category
NON-DISCRIMINATION
Total number of incidents of discrimination
Operations with local community engagement, impact assessments and development programs
Political contributions
Assessment of the health and safety impacts of products and service categories
Board of Trustees: 43% women and 57% men; 100% over 50; 27% diverse
Executive Team: 33% women and 67% men; 100% over 50; 0% diverse
Investment Committee: 25% women and 75% men; 100% over 50; 25% diverse
Gender: 53% women and 47% men
Age: Under 30 - 6%; 30-50 - 56%; over 50 - 39%
Diversity: Diverse - 36%; non-diverse - 64%
There were no reported incidents of discrimination in 2022.
Report pages 52-73 and ESG Policy page 20
Report page 101 and Political Contributions Policy
All of our properties are inspected on a regular basis for potential health and safety violations by both our internal team as well as third parties. Inspections cover all aspects of the properties relating to health and safety including spaces controlled by tenants. We also regularly monitor the environmental condition of our properties for any potentially dangerous conditions and engage in remediation activities as needed. In any new acquisitions, we also perform detailed inspections of the environmental and physical condition of the asset and incorporate a capital investment plan as part of our acquisition decision to correct any issues that do not meet our standards.
TRAINING AND EDUCATION
LOCAL COMMUNITIES POLITICAL CONTRIBUTIONS CUSTOMER HEALTH & SAFETY
AND EQUAL OPPORTUNITY 404-1 406-1 413-1 415-1 416-1 405-1 404-2 404-3
DIVERSITY
Average hours of training
114
SASB DISCLOSURE CODE AND TOPIC METRIC
ENERGY MANAGEMENT
IF-RE-130a.1
LL Controlled Energy: 100% data coverage
Tenant Controlled: 58% (42% estimated for purposes of calculating Scope 3 emissions) data coverage
IF-RE-130a.3
IF-RE-130a.5
WATER MANAGEMENT
IF-RE-140a.1
IF-RE-140a.2
IF-RE-140a.3
IF-RE-140a.4
MANAGEMENT OF TENANT SUSTAINABILITY IMPACTS
IF-RE-410a.1
IF-RE-410a.3
CLIMATE CHANGE ADAPTATION
IF-RE-450a.1
IF-RE-450a.2
ACTIVITY METRICS
IF-RE-000.A; IF-RE-000.B; IF-RE-000.C; IF-RE-000.D
8% in like for like electric consumption; See report page 36, GRI Indicator 302-1
See report pages 14-16, 26-35
LL water withdrawal data coverage: 100%
27% of our total square footage is in areas with high risk of water stress
See report pages 14-15 and 23 for more information on risk exposure to water stress.
Landlord controlled water consumption in 2022: 243,172 CCF
8% change in like for like landlord controlled water consumption between 2021 and 2022
See report pages 14-15, 44-45
All of Federal Realty's leases allow us to pass through capital expenses for use on energy efficiency projects to our tenants. We have additional language that specifically has a cost recovery clause for resource efficiency-related capital improvements in 25% of the new leases signed in 2022.
See report pages 30-33
See report pages 14-15
See report pages 13-16
See 2022 Form 10-K pages 22-27
IF-RE-130a.2 Landlord Controlled Tenant Controlled 40,888 110,503 15,615 151,619 40,660 395,418 97,162 657,540 Absolute Energy Consumption Within Organization Total Renewable Electric Consumption (MWh) Total Nonrenewable Electric Consumption (MWh) Total Nonrenewable Fuel Consumption (MWh) Total Energy Consumption (MWh) SASB Index SASB Real Estate Standards Version 2018-10 115 01 / Introduction 02 / TCFD 06 / Teams 07 / Governance 08 / Appendix 04 / Resilience 03 / Decarbonization 05 / Communities
federalrealty.com 116
