Oil
2.8 OIL BALANCE M3 billion
2015
2016
Production
141.4 19.0 42.8 117.7
146.1 10.4 46.3 110.1
Imports Exports Apparent consumption Source: ANP
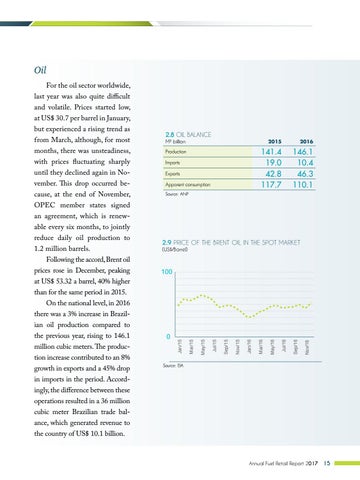
2.9 PRICE OF THE BRENT OIL IN THE SPOT MARKET (US$/Barrel)
Nov/16
Sep/16
Jul/16
May/16
Mar/16
Jan/16
Nov/15
Sep/15
Jul/15
May/15
0
Mar/15
100
Jan/15
For the oil sector worldwide, last year was also quite difficult and volatile. Prices started low, at US$ 30.7 per barrel in January, but experienced a rising trend as from March, although, for most months, there was unsteadiness, with prices fluctuating sharply until they declined again in November. This drop occurred because, at the end of November, OPEC member states signed an agreement, which is renewable every six months, to jointly reduce daily oil production to 1.2 million barrels. Following the accord, Brent oil prices rose in December, peaking at US$ 53.32 a barrel, 40% higher than for the same period in 2015. On the national level, in 2016 there was a 3% increase in Brazilian oil production compared to the previous year, rising to 146.1 million cubic meters. The production increase contributed to an 8% growth in exports and a 45% drop in imports in the period. Accordingly, the difference between these operations resulted in a 36 million cubic meter Brazilian trade balance, which generated revenue to the country of US$ 10.1 billion.
Source: EIA
Annual Fuel Retail Report 2017
15