Stamford Coastal Resilience Plan Community Meeting and Public Workshop
Stamford Coastal Resilience Plan Community Meeting + Public
Workshop
February 18th, 2025
Two Projects: One Process
About the Stamford Coastal Resilience Plan +
Cummings Pond Flood and Ecological Resilience Plan
Understanding Flood Hazards
Current and Future Flood Risks in Stamford
What We Want to Learn from You
Two Projects, One Process
Stamford Coastal Resilience Plan + Cummings Pond Flood and Ecological Resilience Plan
What is a Coastal Resilience Plan?
The Coastal Resilience Plan (CRP) is being developed as a roadmap to resilience that will identify and propose actionable strategies to address coastal flood risks in Stamford
What will the plan do?
Establish an updated understanding of current and future coastal flood risk
Prioritize naturebased & hybrid solutions to reduce coastal flood risk and support local ecology and quality of life
Develop an actionable roadmap to resilience that includes sitespecific strategies
CRP Project Area
The project area for the Coastal Resilience Plan includes:
● Neighborhoods mostly south of I-95, including
○ Cove, East Side, Shippan, South End, Waterside, and portions of Downtown and West Side
● Areas of Stamford within Coastal Area Management (CAM) zone
CRP Project Area
Subarea Plan #1: Cummings Pond Flood + Ecological Resilience Plan
Separately funded project to allow for a more detailed understanding of the layered flood risks in the Cummings Pond drainage area – as the first of several potential subarea studies that will nest within the CRP
Cummings Pond Flood + Ecological Resilience Plan
Will evaluate stormwater and drainage-related flood risks and the ecological function of Cummings Pond
2019 Cummings Pond Restoration
Master Plan highlights the need to restore the ecological health of the park system and tidal stream + contributing drainage areas north of the park
Two Projects, One Process
UNDERSTANDING EXISTING FLOODING
MODELING EXISTING + FUTURE FLOODING
DEVELOPING SOLUTIONS
ENGAGING WITH STAKEHOLDERS
PREPARING THE PLAN
GET TO PLAN IMPLEMENTATION
Two Projects: One Process
Understanding Flood Hazards
Coastal Flooding
As part of the Coastal Resilience Plan, coastal flood modeling by the Connecticut Institute for Resilience & Climate Adaptation (CIRCA) has been used to map exposure and evaluate flood risks.
HIGH TIDE FLOODING
occurs in low-lying coastal areas. This type of flooding occurs during normal high tides or extreme high tide events (e.g., king tides or spring high tides).
COASTAL STORM
FLOODING occurs during coastal storms like hurricanes and Nor’easters. It includes the effects of storm surge and waves.
Stormwater Flooding
In addition to modeling coastal flood risks, the Cummings Pond Subarea study will develop an additional model to study and evaluate stormwater flooding.
STORMWATER FLOODING
results from rainwater piling up in areas with poor drainage. This often happens during heavy rainfall events, when drainage systems become overwhelmed and/or the rainwater cannot infiltrate quickly enough.
Example of How Climate Change is Likely
to Affect Flooding
Sea level rise will increase the height of tides, leading to more tidal flooding and increasing water levels during a coastal storm.
In recent decades ocean warming and ice sheet loss due to global warming have contributed to global sea level rise. Along the East Coast, including Connecticut, sea level rise rates are more rapid because of subsidence or sinking of the coastline.
Example of How Climate Change is Likely
to Affect Flooding
Stamford is expected to experience more inland flooding due to increasingly intense rainfall events (precipitation) and the associated stormwater runoff.
As temperatures rise, the warmer air can hold more moisture, leading to the potential for more extreme precipitation, exacerbating the risk of flash floods and riverine flooding.
In low-lying coastal areas, like the area around Cummings Pond, coastal flooding and stormwater flooding can create combined – or compounding –flooding impacts.
A SHORELINE SHAPED
BY ICE, WIND AND WATER
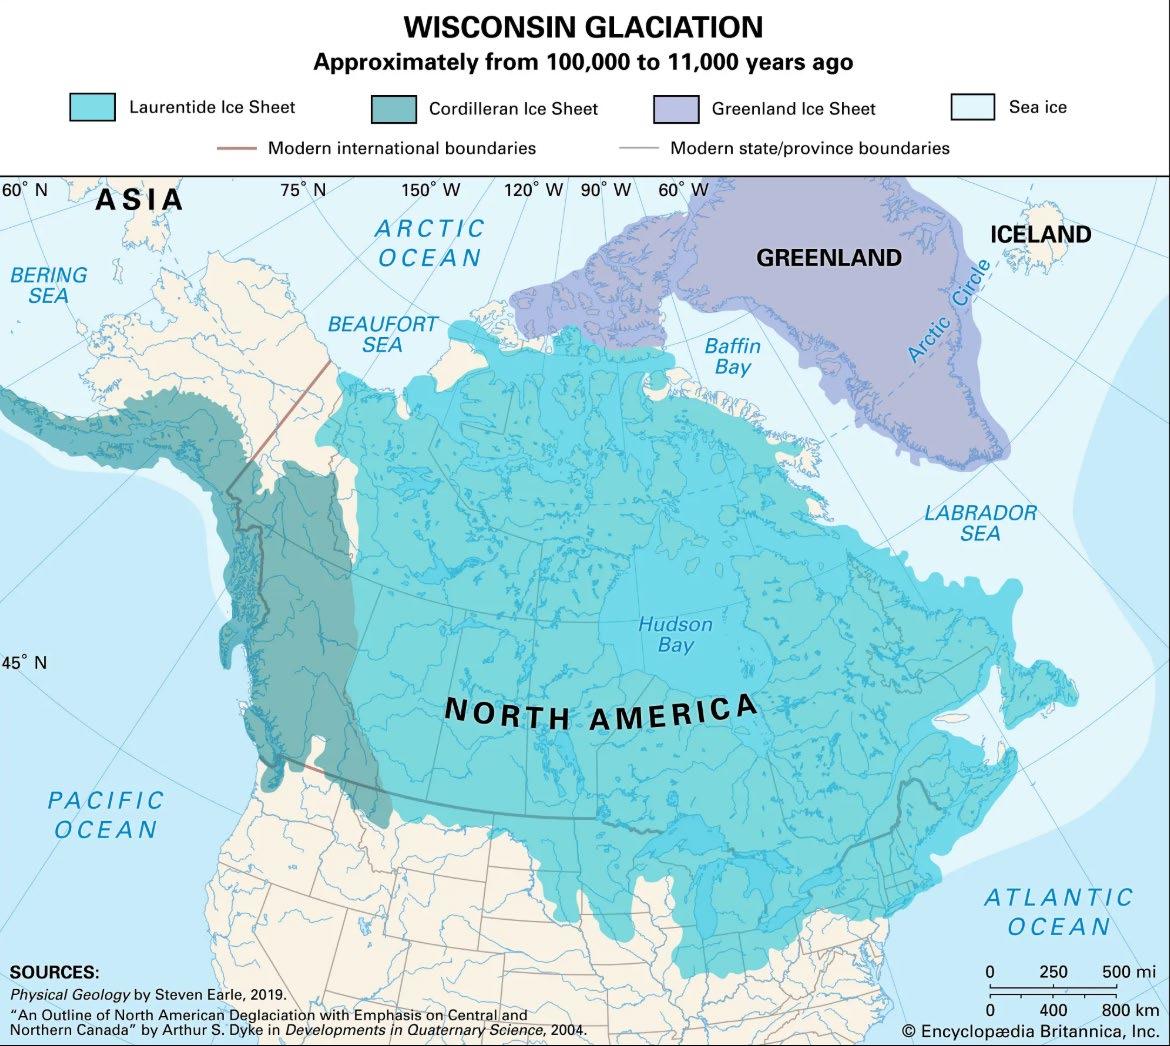
A shoreline shaped by ice, wind and water
Wisconsin Ice Sheet, played a significant role in shaping the coastline of Connecticut
As the Ice Sheet retreated, it left behind till, which created inlets along the Connecticut coast - resulting in the distinctive “flooded coastline”
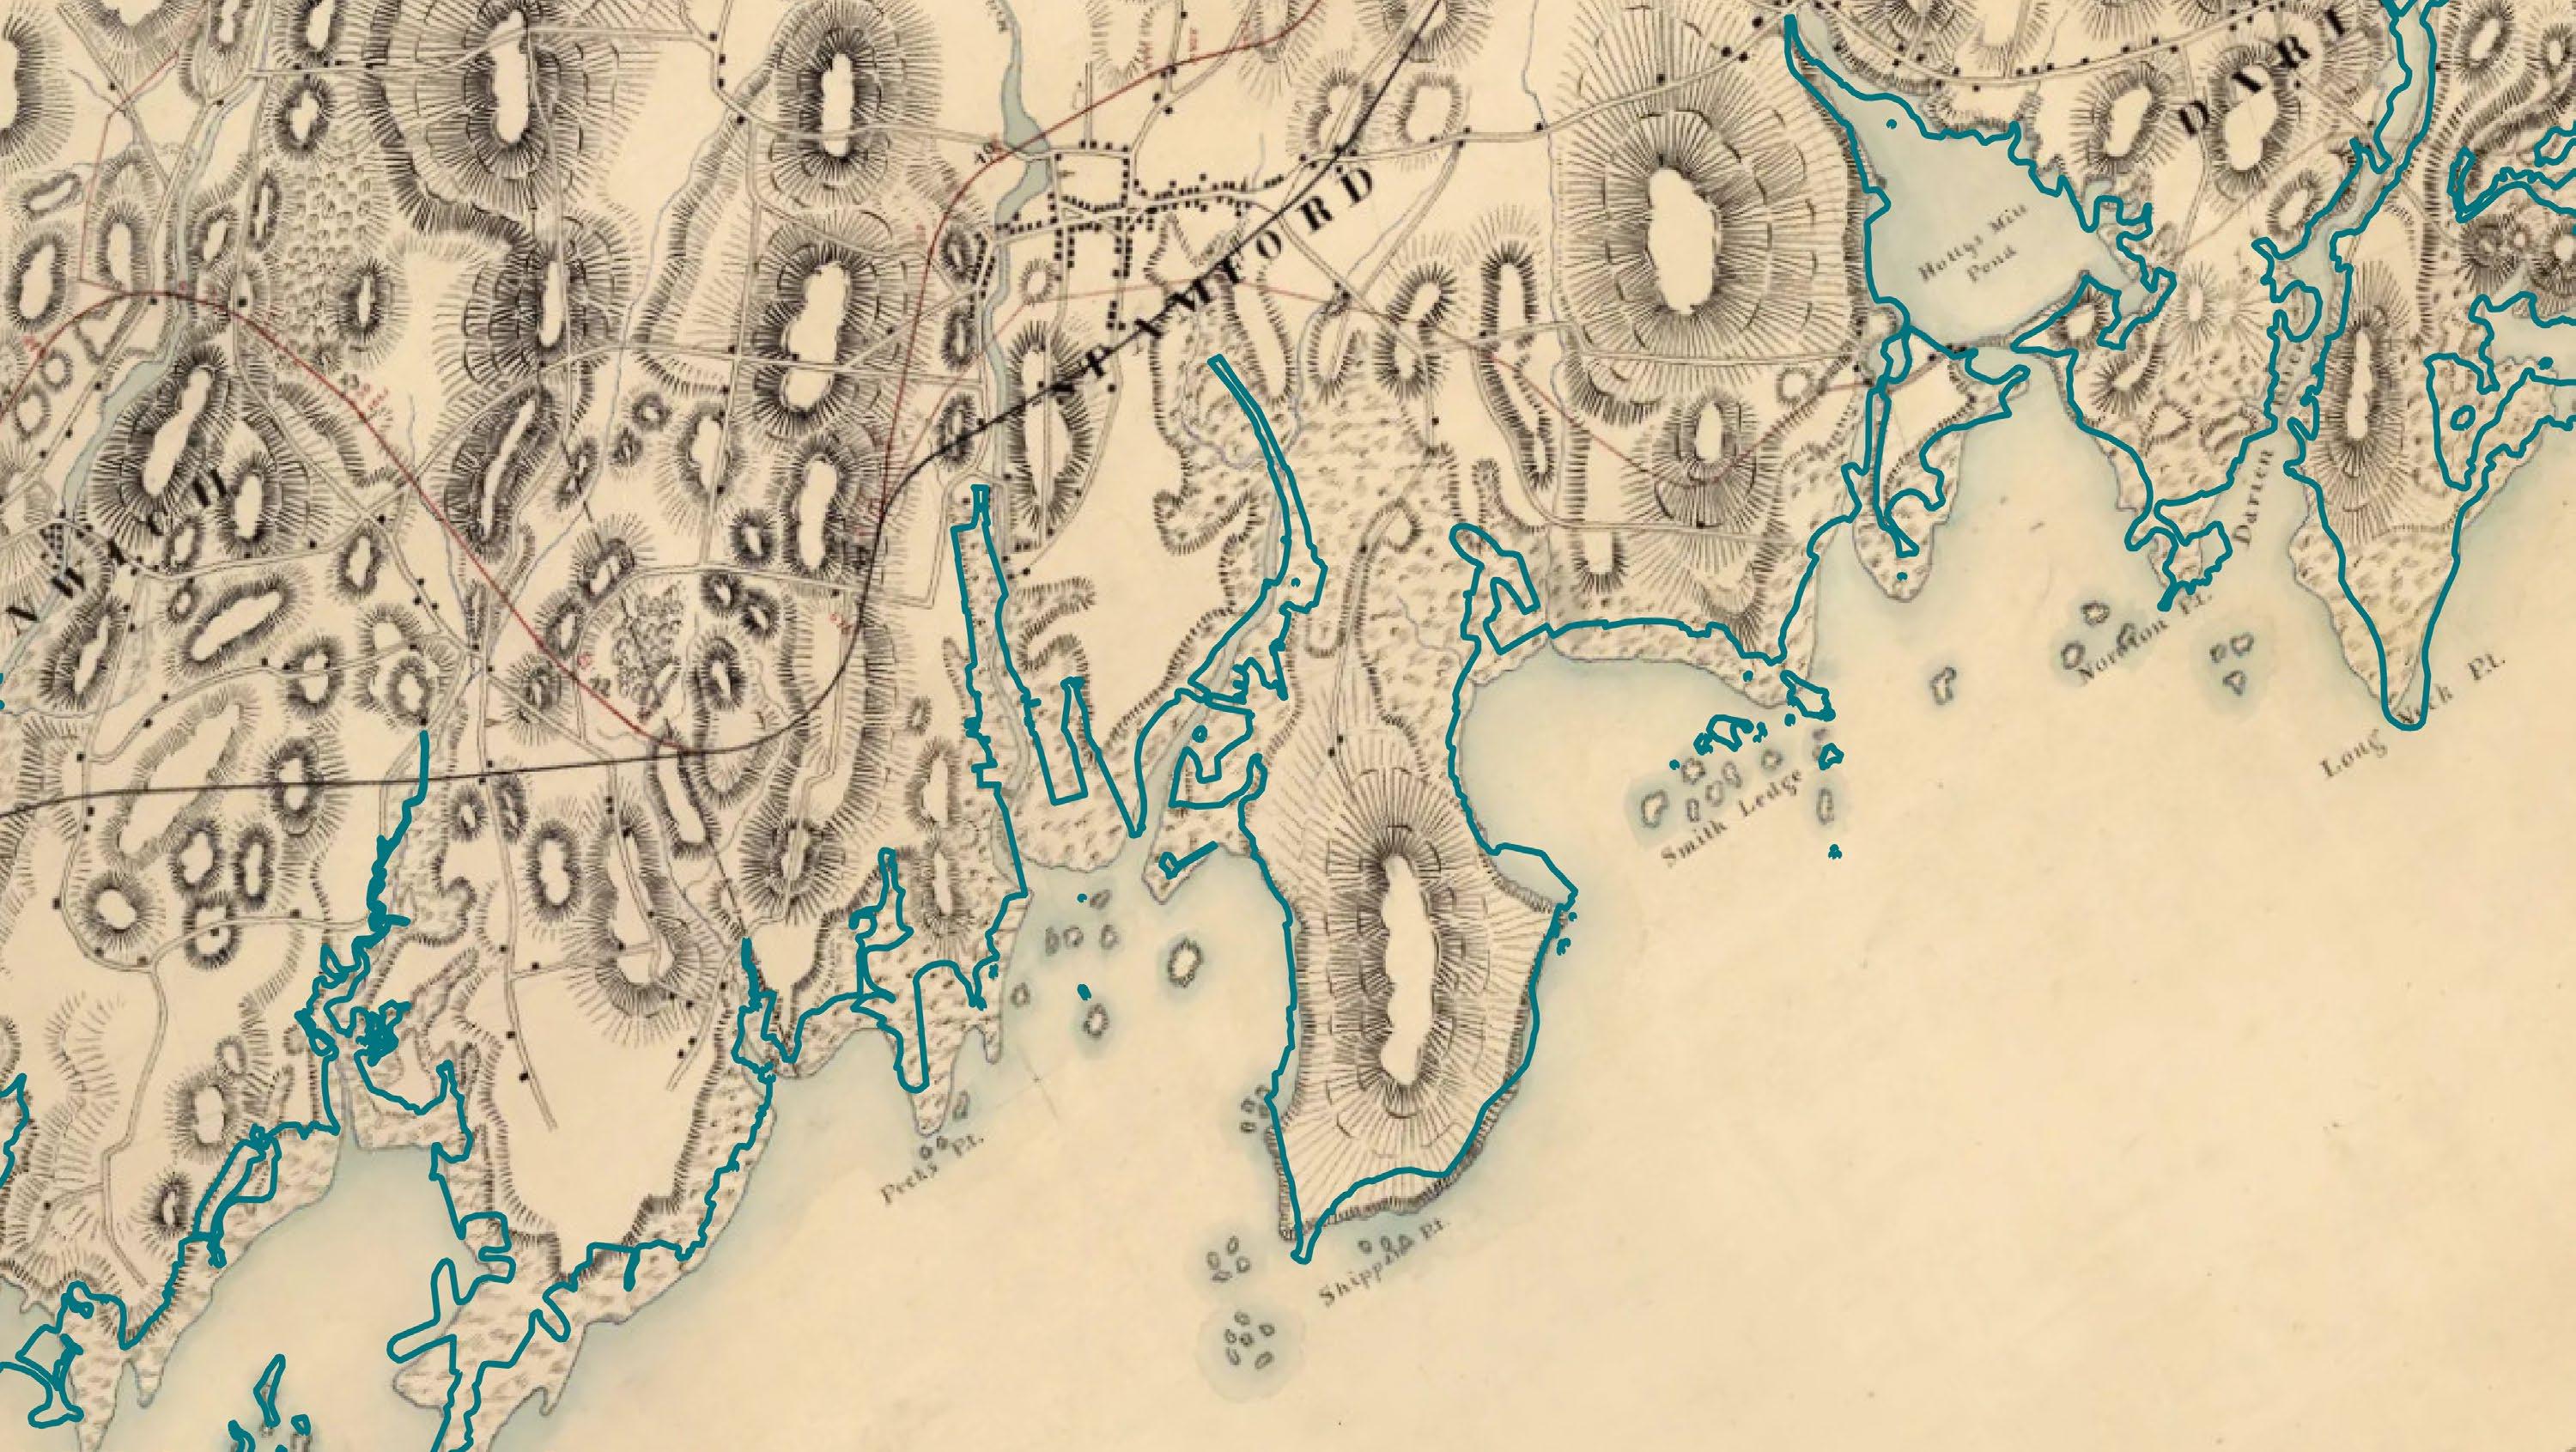
STAMFORD, CT
The Flooded Coastline
As the dense ice that forms glaciers retreat, it leaves behind glacial sediments that create a complex shoreline.
Along the Connecticut coast, wave action forms sandy beaches and marsh deposits can be found around creeks and inlets
DOWNTOWN
A strategically located trading post
METRO NORTH RAILROAD
Source: Historic Map Works
With the opening of the railroad in 1848, Stamford became accessible to more people. By 1850 the population had grown to 5,000 people and nearly doubled in size by 1880, with coastal areas largely unsettled.
SHIPPAN POINT
CUMMINGS PARK
A city developed on higher land
As Stamford grew through waterbased merchandising and industry, developed areas were located closer to waterways in South End but also concentrated around high points such as Shippan
Source: USGS (1892)
SHIPPAN POINT
CZECIK MARINA PARK
KOSCIUSZKO PARK
A shoreline shaped by ice, wind, and water
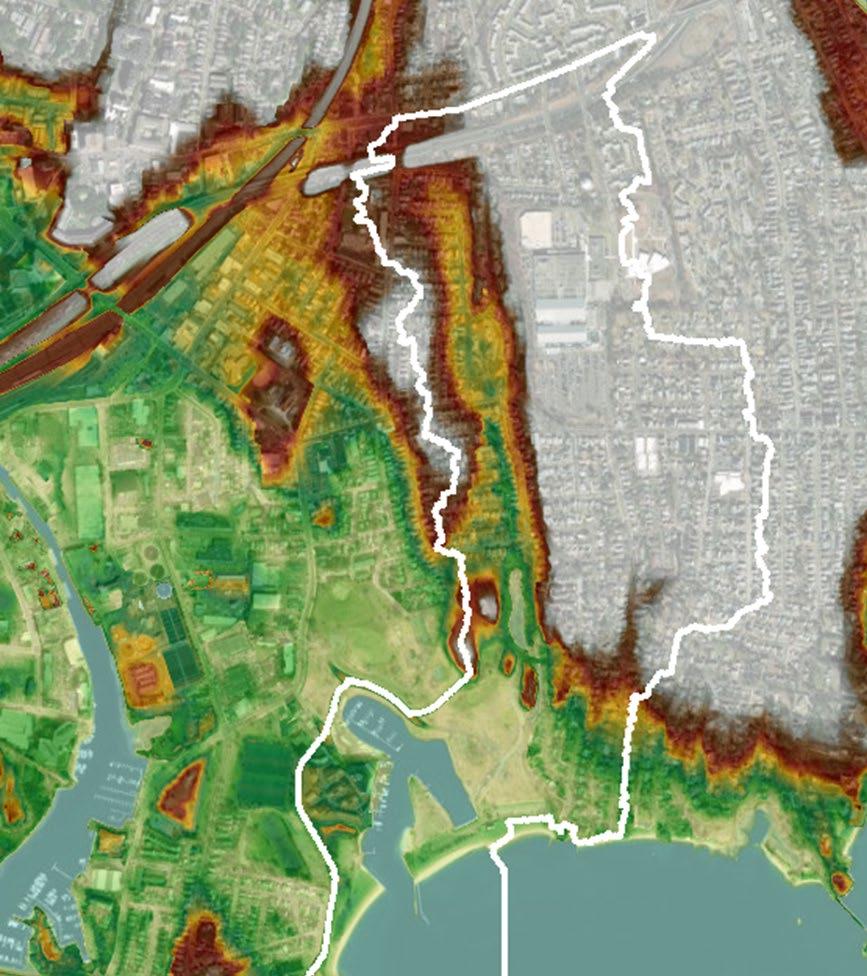
Topography of the Stamford Coastline
Stamford has low-lying terrain, ranging from sea level to above 75 feet in areas like Shippan Stamford’s South End and Cummings Park ranges in elevation from 1-9 feet, many areas susceptible to flooding
Topography of the Stamford Coastline
These low-lying areas are at risk of flooding today, even without the additional influence of sea level rise.
A VIBRANT COASTAL CITY
Home to Fortune 500 Companies
An Economic Hub & Access to Regional Transportation
Stamford serves as a major corridor through CT with Route 1, the Merritt Parkway, I-95, Amtrak, and the Metro-
North Railroad
Major roadways and rail within the Coastal Zone
Boundary and would be impacted by flood waters
Community Assets & Historic Districts
Stamford offers a wide range of job opportunities across various sectors, including finance, healthcare, technology, and retail. Downtown Stamford is home to many community assets including schools and hospitals.
The South End Historic District
(a national register district) is located within the project area and there are multiple National Register of Historic Places located within the project area.
Source:
Google
Source: Downtown Stamford
Source: Google
Source: Discover Stamford
Arts & Crafts on Bedford
View from Harbor Point Marina
Mill River Park Stamford Museum & Nature Center
Network of Coastal Parks
Coastal Park in Project Area:
● Boccuzzi Park
● Carwin park
● Cedar Street Playground
● Cove Island Park
● Cummings Park
● Czescik Park
● Edson Park
● Gerli Park
● Hatch Field Park
● Kosciusko Park
● Mill River Park
● Rosa Hartman Park
● Waterside Park
● West Beach
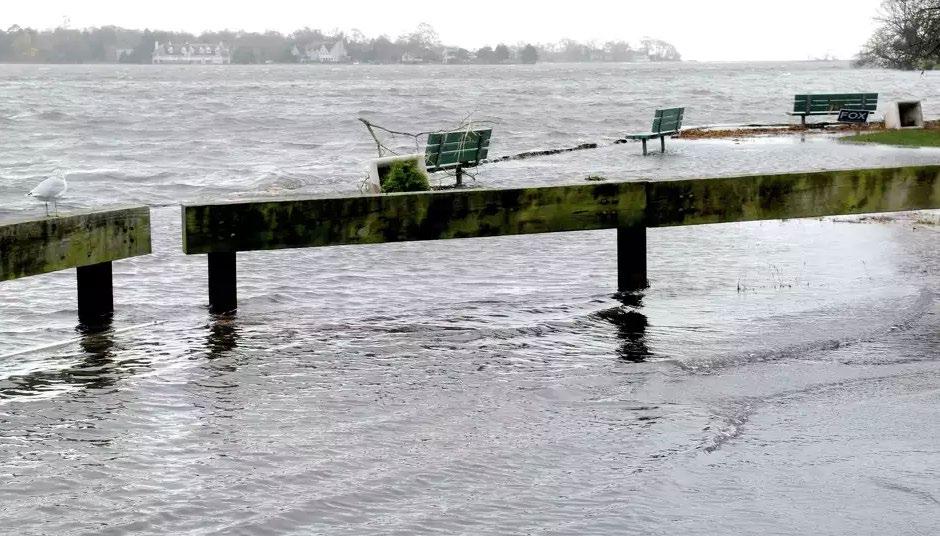
Many of the parks are already flood-prone.
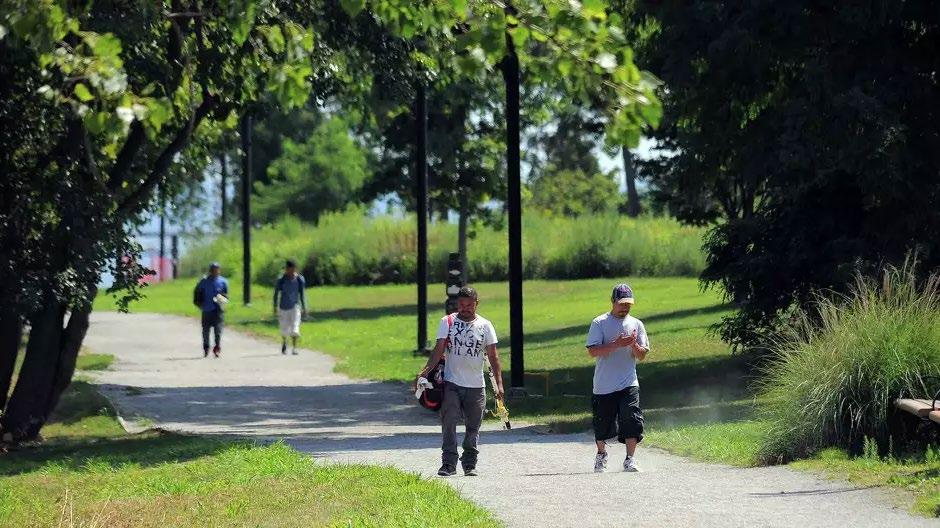
A Recreational Destination
Source: City of Stamford
Source: Discover Stamford
Source: Stamford Advocate
Source: Tyler Sizemore
West Beach Cove Island Park Cummings Park Kosciuszko Park
Shoreline Ecology & Habitat
Stamford is home to a variety of common migrating waterfowl (e.g., Blackduck, Bufflehead, Mallard, Hooded Merganser, and Canada Goose) – in addition to several aquatic species (e.g., Bluefish, Blackfish, Striped Bass, oysters, and northern quahog)
Many State and Federal Listed Species are off the coast of Stamford
A CITY AT RISK OF COASTAL FLOODING
What happened during Hurricane Sandy?
630,000 residents in Stamford (2/3rds of the city) lost power and roughly 36 roads were blocked with trees and debris (Stamford Advocate, 2012)
1,093 buildings impacted in Stamford (First Street)
Costs to the city were estimated at $7 million (Solutions Forum, 2016), with $4 million being structural and the rest personal (Stamford grants officer Karen Cammarota)
Source: Stamford Advocate
Source: Stamford Advocate
Source: Stamford Advocate
Source: Stamford Advocate
Hobson Street Weed Avenue
Weed Avenue
Shippan
Did you know there is a Hurricane Barrier here?
SCHOONER COVE
HURRICANE BARRIER
KOSCIUSZKO PARK
HARBOR DRIVE
How the Hurricane Barrier Operates
Present Day (Closed Condition)
How Does Coastal Flooding Happen?
Present Day (Closed Condition)
CURRENT FLOOD RISKS
Assets at Risk (Present)
Open Hurricane Barrier
Without additional sea level rise, there are still risks with a higher intensity, lower probability coastal storm events
Assets at Risk (Present)
Closed Hurricane Barrier
However, when the Hurricane Barrier is closed it helps reduce the risks from these higher intensity coastal storm events – especially in the South End
FUTURE (MODELED) FLOOD RISK PROJECTIONS
CIRCA COASTAL FLOOD MODELING
NEAR-TERM (2050s)
Assets at Risk (Future)
With 20” SLR + Closed Hurricane Barrier
More key infrastructure and community assets are projected to be impacted by coastal flooding –including critical municipal infrastructure (e.g., areas near Stamford Water Pollution Control Facility and Transfer Station). The Hurricane Barrier would help to reduce risk in the South End and Downtown areas
LONG-TERM (2100s)
Future Coastal Flood Risk
(40” of sea level rise)
With the addition of 40” of sea level rise out to the 2100s, the area of impact resulting from future coastal storm events spreads into more of the Coastal Area Management zone
Assets at Risk (Future)
With 40” SLR + Closed Hurricane Barrier
With higher intensity storms and 40” of sea level rise, flooding is expected to be extensive and impact bus routes, stormwater infrastructure networks, community assets and buildings across the City
CIRCA reported that models indicate that the Hurricane Barrier would no longer significantly reduce flood risks from large storms
Cummings Pond Subarea
Approximate Drainage
Watershed
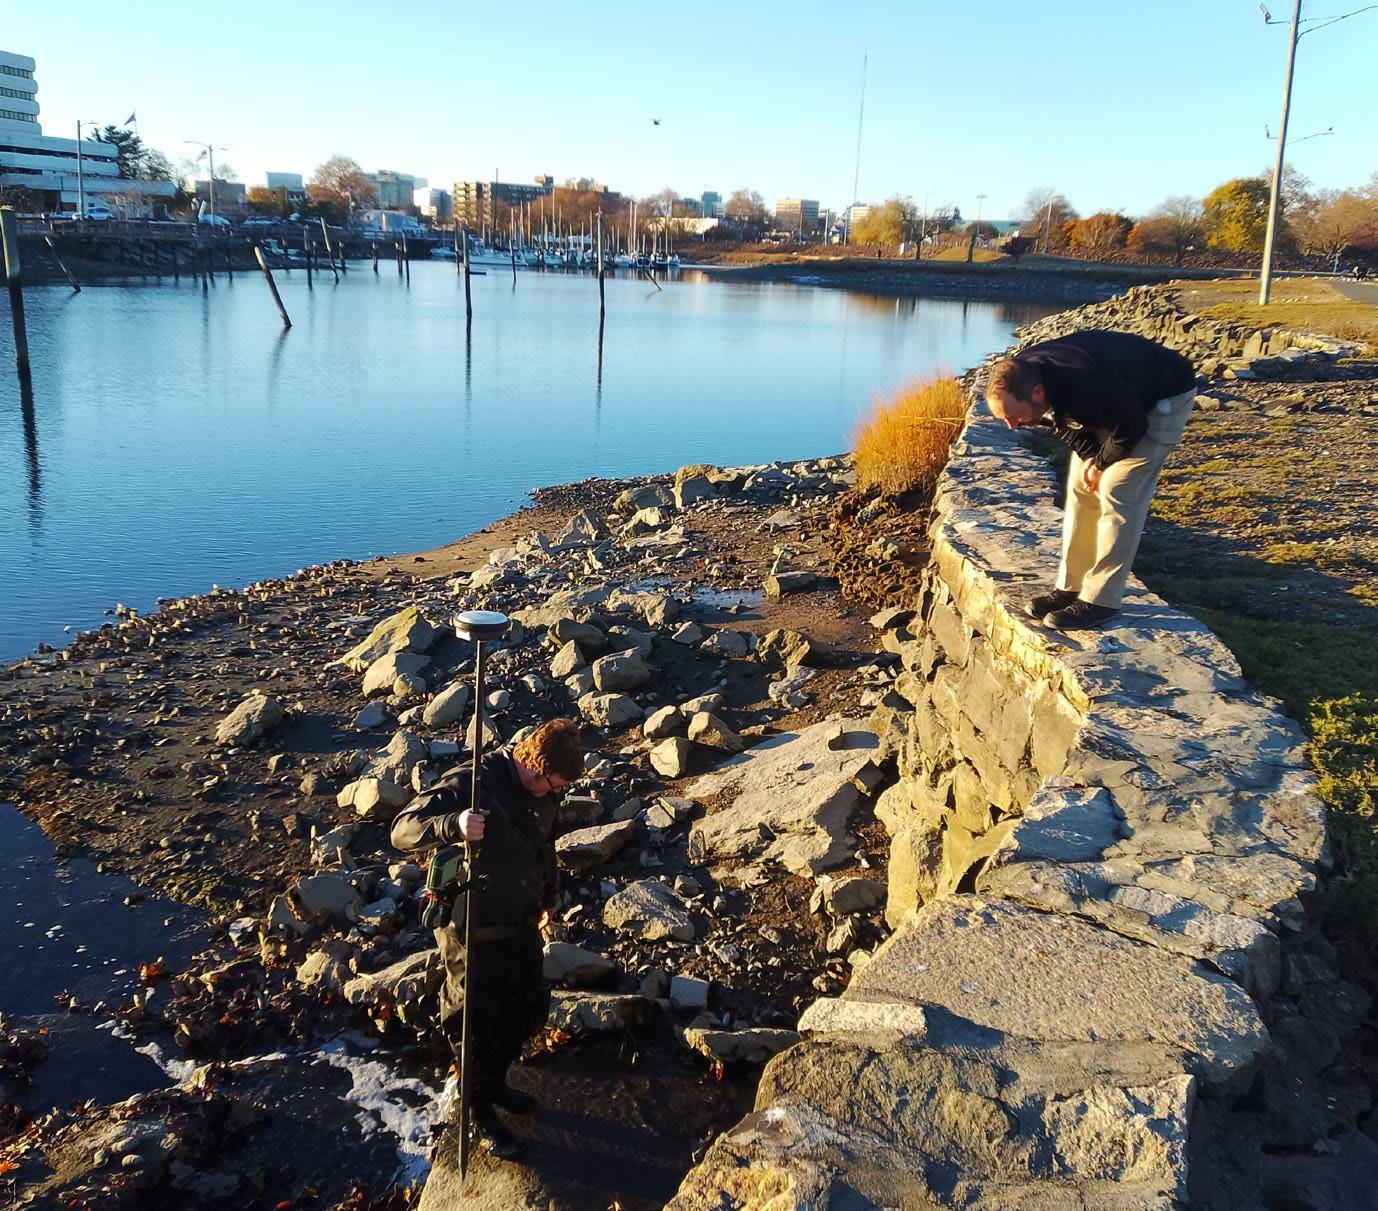
Tide Gage Deployment
Three tide sensors were deployed to measure the water level, temperature, and salinity