AssessingtheVulnerabilityofaFreshWater ReservoirinNewport,RItotheEffectsof StormSurgeand SeaLevelRise OCE496/CVE498:SeniorDesignProject2020-2021
May7,2021
CraigBarry
JordanBeason
ShawnChambers
CaitlinDaly
Agnella Dougal
AlbertGesualdi
MontanaLigman
IsaacParraMartinez
RebeccaMeyers
AnthonySaucier
DrewSierra
RoseShayer
DeclanTierney
JamesTraglia
Acknowledgments Dr.ChristopherBaxter,OceanEngineering,URI
Dr.JosephGoodwill,CivilEngineering,URI
Dr.RezaHashemi,OceanEngineering,URI
Dr.StephenLicht,OceanEngineering,URI
Dr.MalcolmSpaulding,OceanEngineering,URI
Dr.MingxiZhou,OceanEngineering/GSO,URI
Dr.CraigSwanson,SwansonEnvironmental,LLC
RobinFreeland,OceanEngineering,URI
TeresaCrean,CoastalResourceCenter,URI
JanelleSkaden,M.S.Student,OceanEngineering,URI
ArtGold,Professor,NaturalResourceSciences,URI
JuliaForgue,PE,DirectorofUtilities,CityofNewport
DavidReis,SupervisingEnvironmentalScientist,RICoastal ResourcesManagementCouncil
RichardLucia,SupervisingCivilEngineer,RICoastalResources ManagementCouncil
JosephDwyer,RiskandHazardsPlanner,RIEmergency ManagementAgency
GraceClancy,AdministrativeOfficer,RIDepartmentof Health
KellyAddyLowder,ResearchAssociate,NaturalResource Sciences,URI
ProblemStatement
Background
StudyObjectives
AdvancedTopobathymetryMapping
CoastalModelingforStormSurge,Waves,andErosion
EvaluationofEmbankmentStabilityandOvertopping
AnalysisofDrinkingWaterQualityandDisinfectionByproducts
SummaryandConclusions
Google Maps, 2020
ProblemStatement ● The City of Newport’s Water Division relies on nine surface water reservoirs
Treatmentfacility
● Proximity of freshwater reservoirs to the Atlantic Ocean lie within FEMA designated Coastal High Hazard Areas
https://trailsandwalksri.wordpress.com/2017/04/12/easton-pond-newport/
Walking path follows most of the western edge and part of the northern edge of Easton pond
StudyArea InthepastEastonpondhasbeen subjecttomanyhighwaterlevel stormsi.e.(Hurricaneof1938, Bob,Carol,Sandy).
● Giventheriskofsea levelrise,thepondmay becomemoresusceptible toovertoppingandsea spray.
Damage from Hurricane of 1938: (Rhode Island Collection, Providence Public Library)
Google Maps, 2020
GoogleMaps,2021
StudyArea North Easton Pond
South Easton Pond
South Easton Pond
Easton Beach
Easton Beach
South Easton Pond
Easton Beach
Spillway
Images sourced from Google Earth
FEMAFloodZoneIndex NOAA Sea Level Rise Predictions HistoricalStorms ● NewEnglandHurricaneof1938→windgustsreacheda category5,thestormkilledover600peopleandwastheworst stormwithinmoderntimes.
● HurricaneCarolof1954causedextremedamageinSouthernRI andatleast68peopledied.
● HurricaneBobin1991,andHurricaneSandyin2012,whose surgesandfloodingaffectedmany.
←Wreckage nearEaston’s beachafter Hurricaneof 1938 (Newport HistoricalSociety)
←EastonBeach, Newport,RIafter theGreatHurricane of1938 (ProvidencePublic Library)
11 Hurricane Sandy,2012 (NOAA,2013)
EastonPond SeaSpray/Overtoppingfromocean =PossibleHealthRisk
“BuildingaResilientNewport.” Rhode Island Sea Grant,16July2020,seagrant.gso.uri.edu/building-resilient-newport/.
OrganicCarbon+Chlorine+Bromide(ocean) ChlorinatedandBrominatedDBP’sindrinkingwater
OrganicCarbon+Chlorine ChlorinatedDBP’sindrinkingwater
DisinfectionByproducts(DBP’s) Evan C. Ged, Treavor H. Boyer, Effects of Seawater intrusion on formation of bromine-containing trihalomethane and haloacetic acids during chlorination.
THMs-Trihalomethanes(typeofDBP)
● Chlorinated
○ Chloroform(CF)-CHCl3
● Brominated(moretoxic)
○ Bromodichloromethane(BDCM)-CHCl2Br
○ Dibromochloromethane(DBCM)-CHClBr2
○ Bromoform(BF)-CHBr3
Hua, Guanghui, and DavidA. Reckhow. “Evaluation of Bromine Substitution Factors of DBPs during Chlorination and Chloramination.” Water Research, vol. 46, no. 13, 2012, pp. 4208–16. Crossref, doi:10.1016/j.watres.2012.05.031.
https://web.uri.edu/lar/files/Building-a-Resilient-Newport.pdf
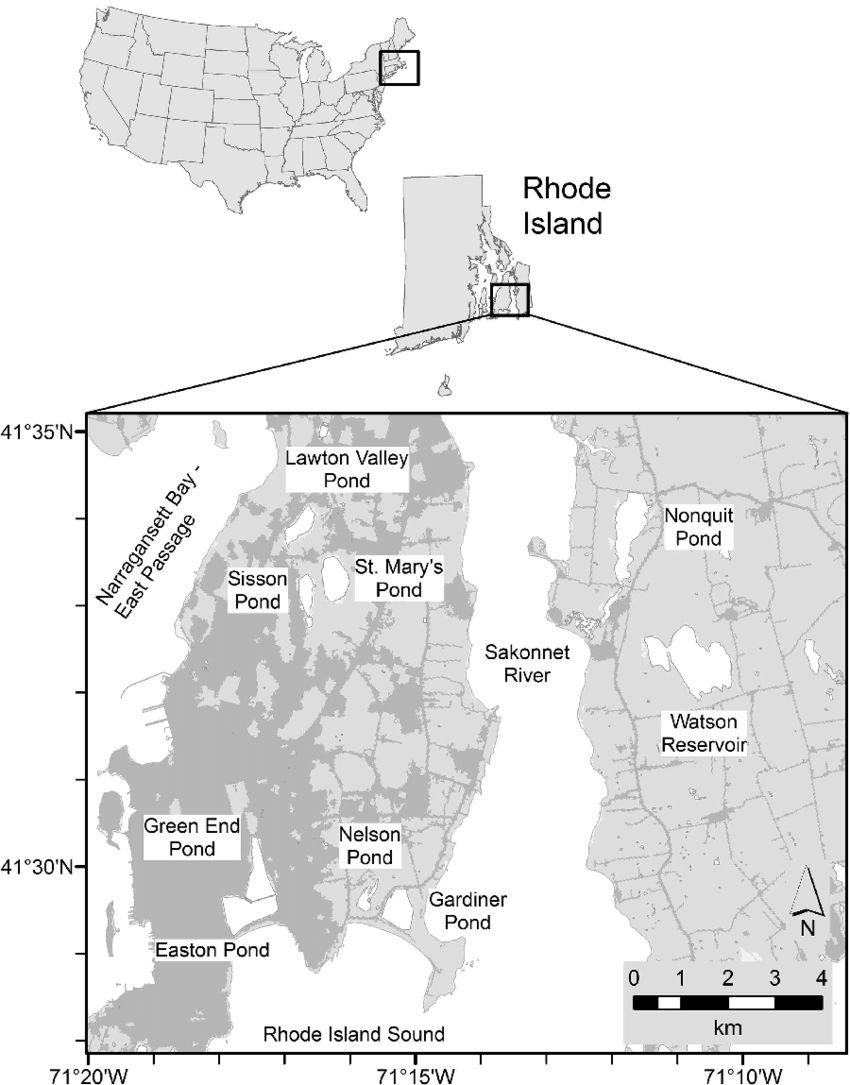
FocusareashowingEastonBeach,Memorial Boulevard(RI138A),andSouthEastonPond; totalarea:approx.190acres
OverallObjective Assessthevulnerabilityofthedrinking waterreservoirnorthofEastonBeachin Newport,RItotheeffectsofstormsurge andsealevelrise,andtodevelopmitigation measuresforprotectingthewatersupply.
Toapproachthisproblem,thegroupbrokedowninto smallersubgroups.
● Datacollectionandinstrumentation
● Coastalmodeling
● Geotechnical/coastalengineering
● Environmentalengineering
Baxter2020
SubgroupDynamic:FlowChart Data Collection & Instrumentation
Transect Lines of the Embankment
Geotechnical Engineering for Embankment
Design and Seepage Analysis
TopoBathy Data
Coastal Modeling
Characterization of Physical Environment/ Environmental Data
KEY:
Blue Text: Information is provided by data collection group
Green Text: Information is provided by coastal modeling group
Environmental Engineering: Analysis of Drinking Water Quality
DataCollection& Instrumentation Improvethequalityoftopo-bathymetricdatabyusingcustom builtorexistinginstrumentationtechnologies
JordanBeason,ShawnChambers,DeclanTierney,AlbertGesualdi
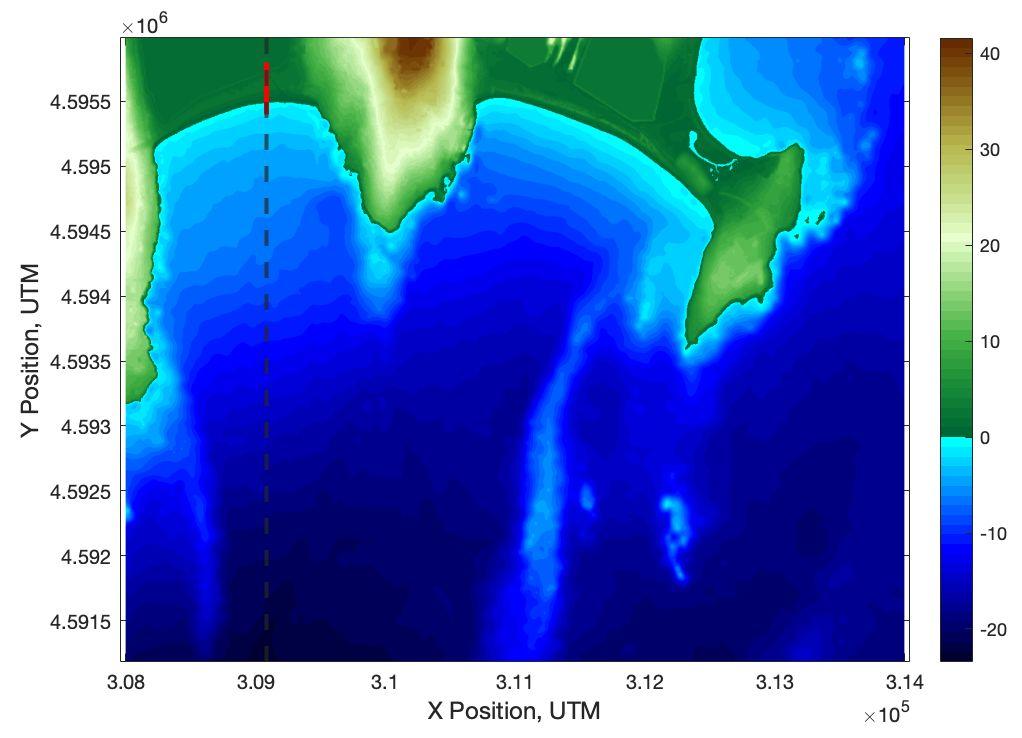
Topography,BathymetryandSalinity Survey Locations Topography Bathymetry
Salinity
Datawascollectedfor comparisonwithexisting publisheddataandto demonstratethecapabilitiesof newcost-effectiveand autonomoustechnologies
Embankment& BeachSurvey SurveyPoints
locations
● Elevationdatawascomparedwithexisting USGSelevationmapstoverifydata
EastonBeachandPond survey
TopographySurveyResults EastonBeachmodelgivento CoastalModelinggroup
TopographySurveyResults Transect
Surf-ZoneBathymetryMethodology ● InflatablePaddleboard withsonardevice ● LowranceSonar System ● 2-3persondeployment
SurfZoneBathymetry SystemtestingatEaston Beach
LowranceTransducer
BeachBathymetry Transectlineslopes=0.05
SalinitySurveyofPondandMoat Overthecourseofamonth 85Datapointsonmoat conductivityweretakenand 2datapointsweretakenon pondconductivity
Pondcond. 1:485and2:496μS/cm
W.Moatcond. 545-559μS/cm
S.Moatcond. 504-567μS/cm
Inletcond. 729μS/cmandover
2018-2020 SouthPondaverage406μS/cm
MoatdatashownwascollectedonApril 12thPondmeasurementsweretakenon
Assesspresenceofseasprayaerosols.
Freshwater < 1,500μS/cm
Seawater ~50,000μS/cm.
ValuesfromHRWC: Mostfreshdrinkingwater >=100μS/cm
Lakeandriverwater 50-1500μS/cm
PondBathymetry Mostrecentbathymetric surveyofEastonPond,Apex Environmental,Fuss& O’Neill,2004
Left:PayloadmountedtoUSV LEO,courtesyDr.MingxiZhou
Top:Cornerswathdatabeing collected
USVSurveyMethods Payload testing with added IMU and updated microcontroller with higher flash memory
ComparedFuss&O’Neill2004survey,elevationin feetNGVD29,conversionofunitsfromSIDand NGVD29toNAVD88showslessthan.2merror
FutureProjects:AutomatedSurvey CoastalModeling Usenumericalmodelstoassesscoastalerosion
Provideinformationtoassistinpossiblemitigationmeasures inthestudyarea
Agnella
Dougal,MontanaLigman,andDrewSierra,
DeterminingSurgeLevelsNACCSvsNOAA NACCS ○ Databaseofprojectionsforfuture climatescenarios.
○ Includecatalogofstormsurge,wave heights,andextremalstatistics
○ provideariskmanagement framework
NOAA ○ Stormsurgeinformationisprovided tofederal,state,andlocalpartnersto
○ Assistsinarangeofplanning processes,riskassessmentstudies, andoperationaldecision-making.
DeterminingBoundary ConditionsforStormModeling TransectLocations SWANModelMethodology Domain
Largescale modelofRhode IslandSound
Resolution= 70m.
ChildDomain
Smallscale modelof Easton Beach,Newport
Resolution= 10m.
XBeachModelMethodology ● A numericalmodelwhichallowsthe simulationofhydrodynamicand morphodynamicprocessesalongsandy coasts.
● Basedonwave-actionequation
● Utilizestheadvection-diffusion equationaswellforsedimenttransport.
● Calculatesswash,collision,overwash, andinundationregimes
XBeachgrid.Replaceschildgrid inSWAN
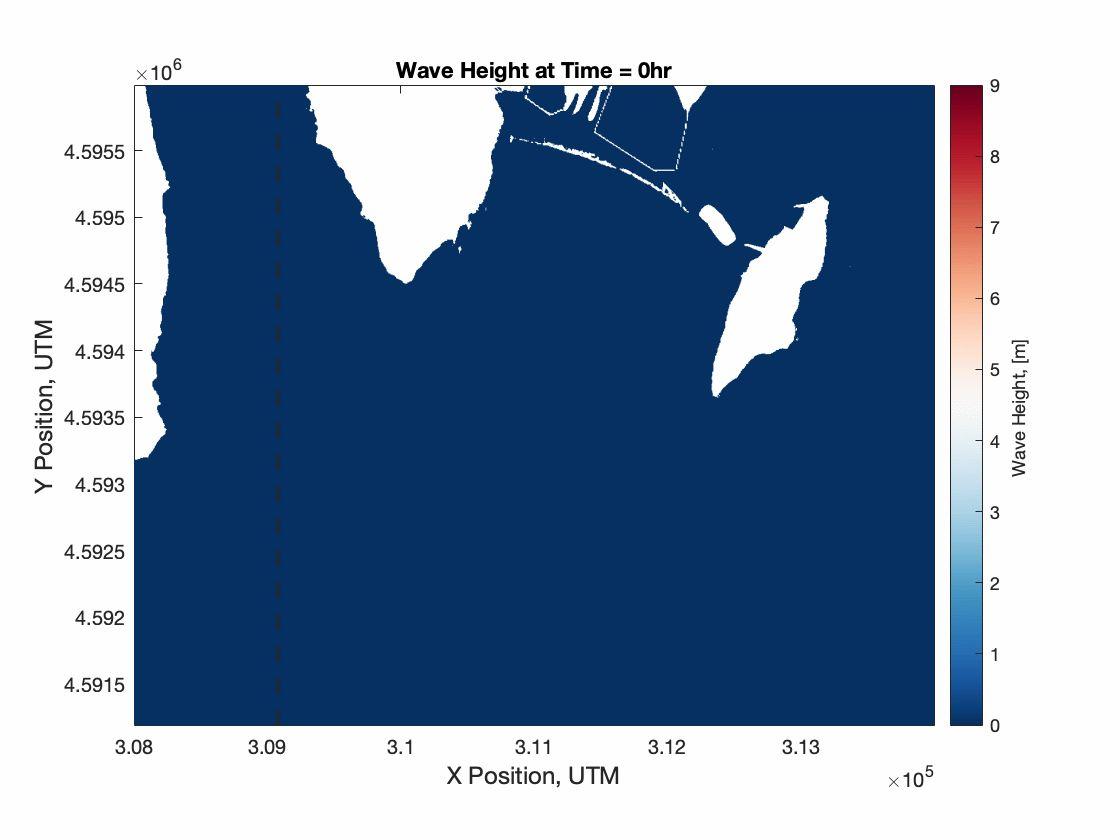
SWANResults:50-YearNOAASurge XBeach,50-YearStorms w/NOAASurgew/oSLR Inputsat
Boundary:
SetSurge:2.8m (9.19 ft)
WaveHeightat Boundary:8.38m (27.49 ft)
Period:16s
XBeach:50-YearStorms ValuesatEmbankment Inputs
SetSurge:2.8m (9.19 ft) WaveHeightat Boundary:8.38m (27.49 ft)
Period:16s
Summaryof XBeachResults RedText:Erodiblelayer
BlackText:Non-erodible layerimposed
ExampleofStormtoolsFloodmap
RainfallLeadingtotheRunoffofSaltfromtheWatershed Redx’sarethechosenrainfallevents
(Frazaretal.,2019)
TopRainfallEventsandtheEstimatedRunoffthatOccurred During andPostEvent Showswhatthe dischargelookslike, withthetailofthedata captured.
BaileyBrookwatershedareaaccordingtoFrazaretal.,onurban watershedanalysiswasabout6.6kilometerssquared.
BaileyBrook MonitorStation
RIGIS(2011)
SoilConservationServiceCurve IndirectSaltDepositionFromDischarge:EstimatedSaltFlux(kg) Peak most likely measurement error
GeotechnicalEngineering Designmitigationmeasurestopreventovertoppingand/or breachingoftheembankments.
CaitlinDaly,RebeccaMeyers,RoseShayer
FailureMechanismsConsidered ● Overtoppingduetoextremestormevents
● Scouronthedownstreamfaceduetostormsurgeandwaves
25yr+2’SLR
● Seepageinducedfailurefromextremeprecipitationevents
BFEsForStormReturnPeriodandSLR 100Year Overtopping Protection Red:Contourline
Yellow:Proposedwall location,17.6ft(5.4m) elevation
ProvidenceHurricaneBarrier(GoogleMaps)
I-Wall ftNAVD88for25yearw/2ftSLR 2ftaboveembankmentcrest 10.5ftNAVD88for50yearstorm 0.3ftaboveembankmentcrest 15.4ftNAVD88for50yearw/3ftSLR
5.2ftaboveembankmentcrest
TransectGeometry HorizontalDistance(m)
withsomegravel
GlacialTill Deposits:silty, gravellysandwith cobbles
Moat
Pond
Upstream
Downstream
I-WallStabilityAnalysis Extending theDune Red=9.5ft(2.9m)
contourline
Blue=Dunelocation
HeightofDune:
10.5ftNAVD88for25yearw/2ftSLR 1.6ftabovewestparkinglot
3ftaboveeastparkinglot
9.5ftNAVD88for50yearstorm
0.7ftabovewestparkinglot
2ftaboveeastparkinglot
3.9ftabovewestparkinglot 5.2ftaboveeastparkinglot
ScourFailureMechanism Theremovalofunderwatermaterialbywavesand currents,especiallyatthebaseortoeofashore structure.(CEM)
Anycoastalstructurerestingon,driveninto,or otherwisefoundedonsoilorsandissusceptibleto scourandpossibletoefailurewhenexposedto wavesandcurrents.(CEM)
Fornormallyincidentbreakingwaves,a slopingseawallistreatedasavertical seawall.
S=equilibriumscourdepth
H0=deepwaterwaveheight
h w=waterdepthatseawall
L0=deepwaterwavelength
Source: The Mechanics of Scour in the Marine Environment By Sumer and Fredsoe
TransectSlopeStabilityAnalysis EvidenceofSeepageonDownstreamSlope (2019)
● Seepswereobservedonthedownstreamfaceof thesouthembankmentaroundApril13,2021.
● Thelocationoftheseepsisconsistentwith reportsof“moistground”citedinaDam InspectionReportbythePareCorporationin 2019
Pare
Turtle
MitigationofSeepage:GravelBerm 12cm(6in)GravelFilterBermaddedtoslopestabilitymodel
Monitoring:DistributedTemperatureSensing(DTS) Fiber Optic DTS
ExampleofTemperatureChanges AlongtheToeofaDam
Quinnetal.(2019)
● Monitoringofseepscanbe accomplishedusingfiber-optic cablesasaDTSinstalledalongthe toeoftheembankment
● Backscatteredlightwithinthefiberis sensitivetochangesintemperature (warmwater)
● DTSisacosteffectivemonitoring toolforunderdocumenteddams
EnvironmentalEngineering: AnalysisofDrinkingWater Assesstheriskofelevatedsalinitylevelswithinthereservoir toconsumerhealthanddesignmitigationmeasures
JamesTraglia,CraigBarry,IsaacParraMartinez,AnthonySaucier
THMSpeciation Bothtreatment facilitiesupdated in2014
Maximum Contaminant Level(MCL) changedin2002 from100to80 ug/LforTTHM
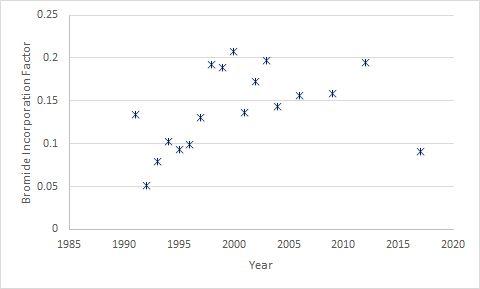
YearlysystemwideaverageofTHMspeciation,providedbytheRhodeIslandDepartmentofHealthandNewportWater
BromideIncorporationFactor(BIF) ● BromideIncorporationFactoratvariouspointsinthe distributionsystem.
● BromideIncorporationFactoratvariousdistribution pointsforStation1andLawtonValley
Hua, Guanghui, and DavidA. Reckhow. “Evaluation of Bromine Substitution Factors of DBPs during Chlorination and Chloramination.” Water Research, vol. 46, no. 13, 2012, pp. 4208–16. Crossref, doi:10.1016/j.watres.2012.05.031.
ConductivityasanIndicatorofBIF Maintenance in South Pond
Conductivitydataofthe9reservoirsforAquidneckIslandfrom2018-2020,providedby NewportWater
Station 1
Lawton Valley
Moat data by Data Collection and Instrumentation group
Conductivityoftributariesandreservoirswithinthe Newportdrinkingwatersystemasafunctionofdistanceto surfzone.Sizeofdatapointindicatessizeofwatershed.
ConductivityoftributariesandreservoirswithintheNewportdrinkingwatersystemasafunctionof distancetosurfzonecomparedtotheoreticalvaluesforaerosolconcentrationsbyDeLeeuwetal.,2000
ConductivityoftributariesonAquidneckIslandand reservoirswithintheNewportdrinkingwatersystemasa functionofPercentofWatershedDevelopment (Residential/Commercial/Transportationlanduse)per RIDEMwatershedmodeling(2018).Sizeofdatapoint indicatessizeofwatershed.
FutureTreatmentDesignConsiderations WillBIF increase? Designfor Regulations Financial Considerations Health Considerations
Designformost prevalent(CHCl3)
Hotspotbasedonriskcalculation. GoogleMaps
THMMitigation-Post-treatmentAeration ExampleofAerationtreatmentdeviceknownasa PackedTower.
● Packingmaterialwithhighsurfacearea.
● Waterflowthroughthepackingmaterialwith induceddraftupwardairflow.
● Liquid-Gasequilibrium.
● MassTransferofTHMsbasedonHenry’s Law.
● NotallTHM’shavethesametoxicity
● Air-to-WaterRatio RemovalRate
Resultsofbench-scalediffusedaerationof TTHMsasafunctionofair-to-waterratio.
Butterworth-Heinemann, 2017
Brook, Ethan, Posttreatment Aeration to Reduce THMs, 2011.
RecommendedDesign Specifications Assumptions:
- 9MGDNewportwaterflow.
- Henry’sConstant=5.35x10⁻⁴
- MassTransferCoefficient(KLa)=0.39
ResultingDesign:
- ResultingVolume= 600,000Gallons(75,000ft3) - Polypropyleneaspackingmaterial(4ftdepth) - Totalcostestimate=3.2milliondollars.
Differentdimensionstomeetthedesignedvolume. Costestimatesassociatedwithvariousaerationtankvolumes.
Costcurvefrom1979adjustedto2021dollar(inflation) “EstimatingWaterTreatmentCosts”,Volume 2 Curve Applicable to 1-200 mgd treatment plant” page452-467
RisktoHumanHealth - FourStepprocess
- DataCollectionandEvaluation
- ToxicityAssessment
- ExposureAssessment
- RiskCharacterization
- ToxicityAssessment-Defines relationshipbetweenexposureand effects(bothoccurrenceandseverity)
- Animalstudiesareused
- Highdosesadministeredtoanimals
- Humanlowdoseresponseextrapolatedbasedonconservativeassumptionoflinear correlationbetweendoseandlifetimecancer probability Slope Factor
Waddell,WilliamJ.“Dose-responsecurvesinchemical carcinogenesis.” Nonlinearity in biology, toxicology, medicine vol.2,1 (2004):11-20.doi:10.1080/15401420490426954
Davis,M.L.,andMasten,S.J.(2013).
Risk Acceptableriskof6in 60,000(EPA Risk Assessment)
RiskEstimatesbyyearfromTHMdata: Imageshowstheestimatedadditional incrementalcancerrisktoindividualsingestingdrinkingwaterfromtheNewport Drinkingwatersystem.EstimatesfromsystemwideaveragesobtainedfromDOHdata.
StepstoCalculateRisk ● ObtainthevaluesfromEPA recommendedvaluesfor estimatingintake.
● CDI=(CW)(IR)(EF)(ED)/(BW)( AT)
● RISK=CDI*SF
CW:Chemicalconcentrationinwater (mg/L)
IR:Ingestionrate(L/day)
EF:Exposurefrequency(day/year)
ED:Exposureduration(years)
BW:Bodyweight(Kg)
AT:Averagingtime(days)
CDI:ChronicDailyIntake
SF:Slopefactor
Risk Acceptableriskof6in 60,000(EPA Risk Assessment) EastonPond“Worst-Case”
Estimatedincrementalcancerriskfromingestingdrinkingwater. Estimatesbasedonassumedlinearextrapolationofstudieson laboratoryrodents.Note:ForfutureriskcalculationsBIFincreased from2019-20levelsof0.3to0.7.PopulationofNewporttaken takenas60,000(2019U.S.CensusBureau).2019-20THM
speciationfromNewportWaterData.
SummaryandConclusion https://web.uri.edu/lar/files/Building-a-Resilient-Newport.pdf
EastonBeachfacingSouth
SummaryandConclusions ● TherearenosetdesignstandardsfortheEaston Pondreservoirduetoitsagedespiteitsproximity totheocean
● Advancedmodeltoolswereusedtoassessthe vulnerabilityofthereservoirtovariousstorm eventswithandwithoutsealevelrise.
● Itisestimatedthatanystormgreaterthanreturn periodof25yearsand2ftofsealevelrisewill resultinovertoppingofthereservoirembankment.
● Severaldifferentmitigationstrategieswere evaluatedtopreventovertopping,includingalarge hurricanebarrier,I-wallsonthecrestofthe embankment,andacontinuousdunealongthe beach
SummaryandConclusions ● Cost-effectiveandautonomoustoolsformeasuring bathymetryweredevelopedandtestedto demonstratetheirfeasibilityforcoastalresilience projects.
● Saltsprayandsubsequentrunoffintoreservoirs wasidentifiedasapotentiallysignificant contributortodisinfectionby-products
● Waterconductivitywasusedasanindicatorof BrominatedTrihalomethanes(BTHMs)throughout AquidneckIsland
● Aconceptualaerationtreatmentdevice(Packed Tower)wasdesignedtomitigatepotentialfuture increasesinBTHMsduetoincreasedsealevelrise andstormactivity


