DBVW Easton's Beach Assessment of Existing Structures with Recommendations 2-3-26 final
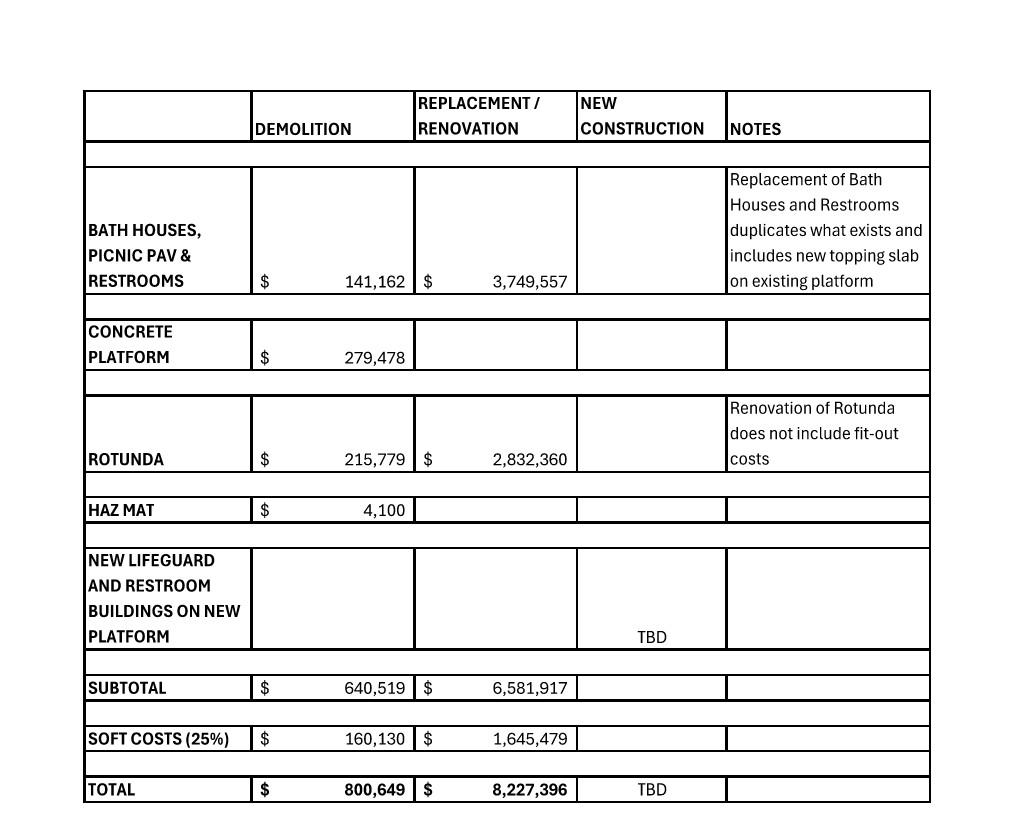
It is important to note that the costs summarized here are based on construction occurring in the fall of 2027. Escalation factors need to be applied to any construction that may be planned for a later date. THE PRELIMINARY COSTS BELOW DO NOT INCLUDE SITE WORK, BEACH NOURISHMENT, OR DUNES.
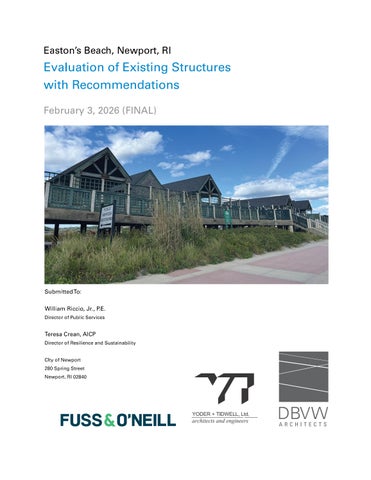
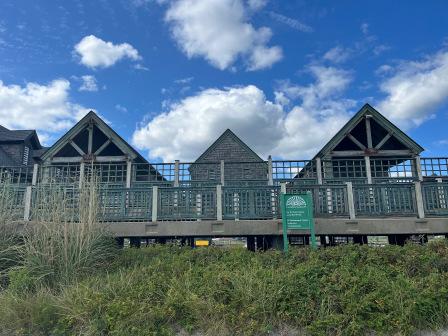
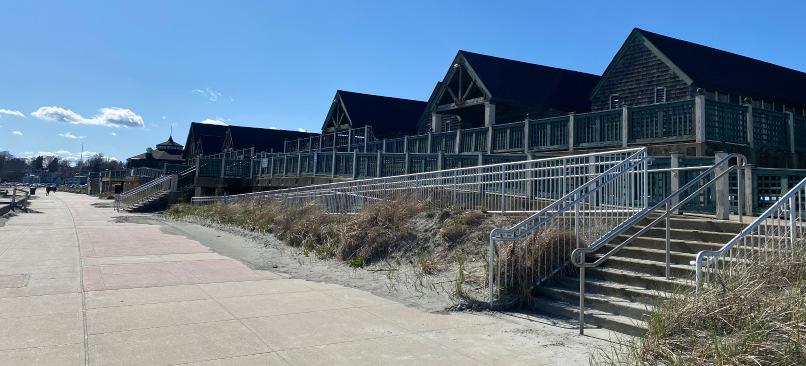
This is a summary report of the structural observations made by Yoder + Tidwell on August 29, 2024, October 17, 2024, and October 28, 2024, at Easton’s Beach in Newport, RI. The four primary structures that were observed during these three site visits were as follows:
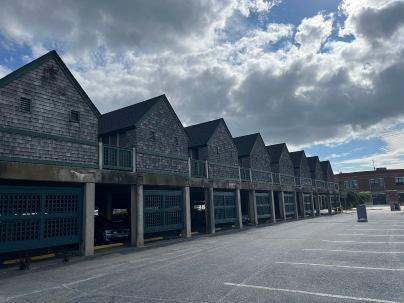
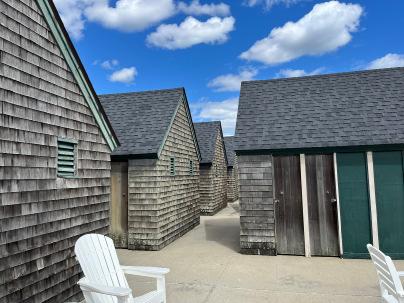
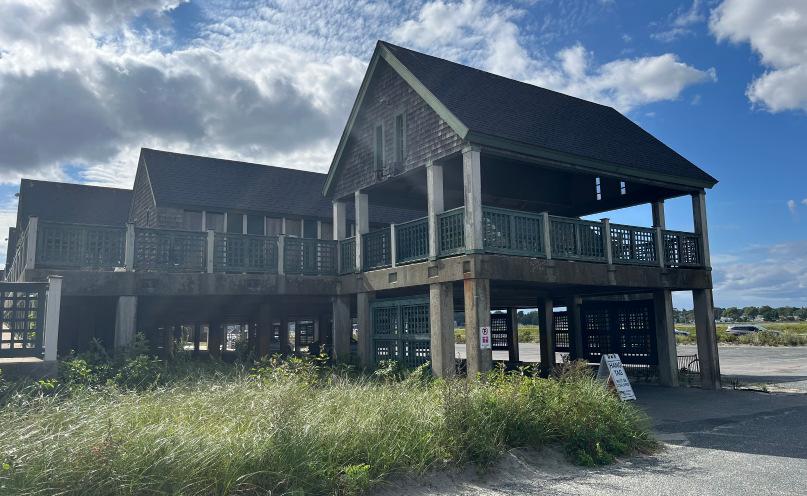
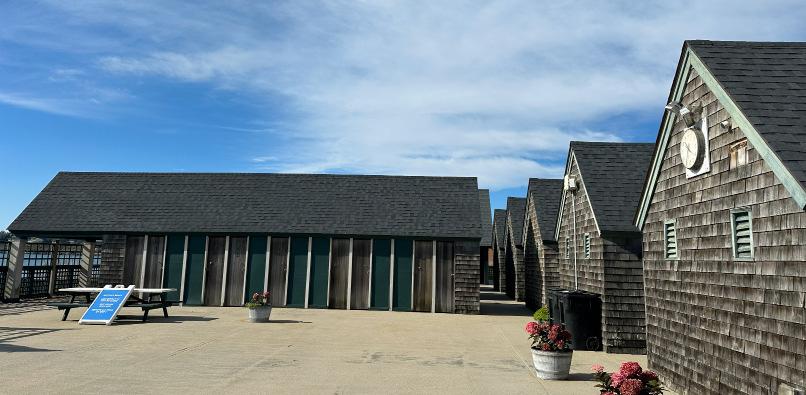
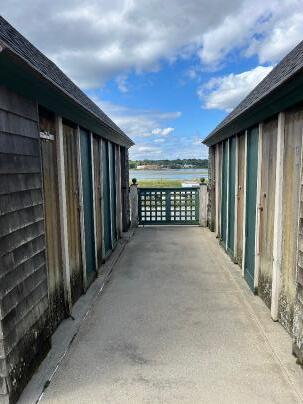
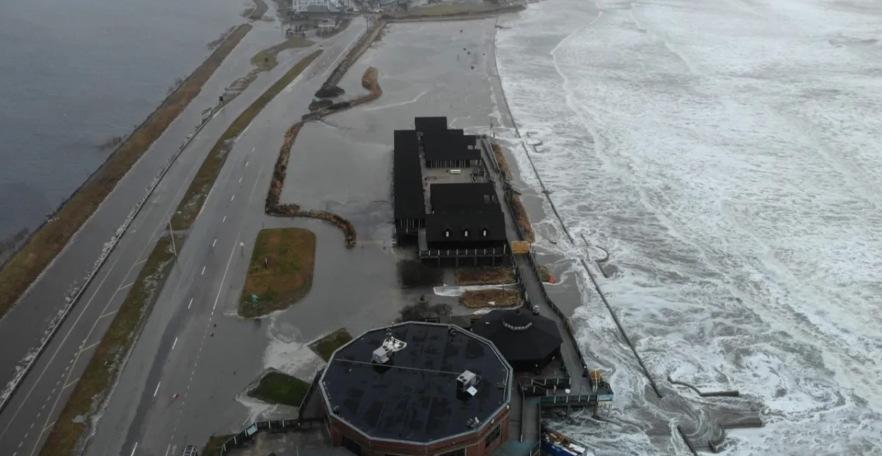
1. Bath Houses. There are a total of 17 bath houses of varying sizes located on top of the elevated concrete deck.
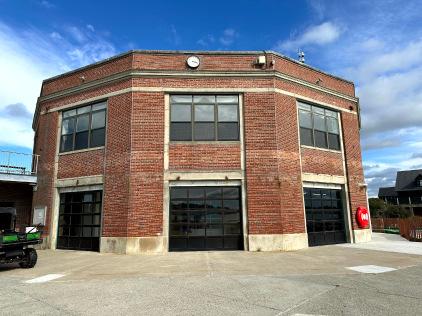
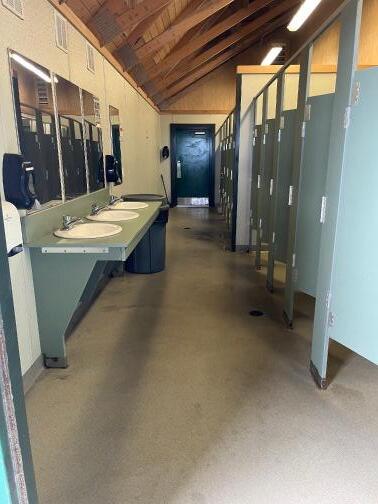
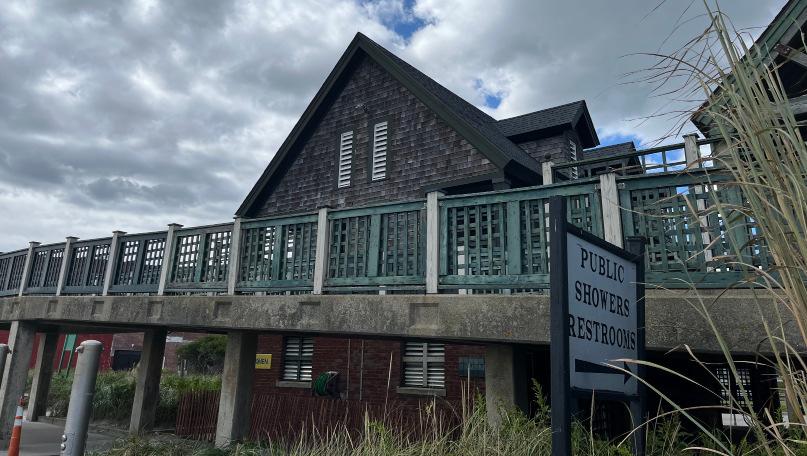
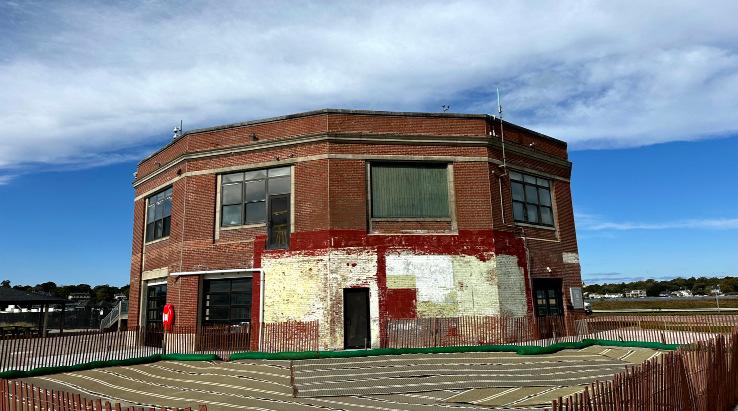
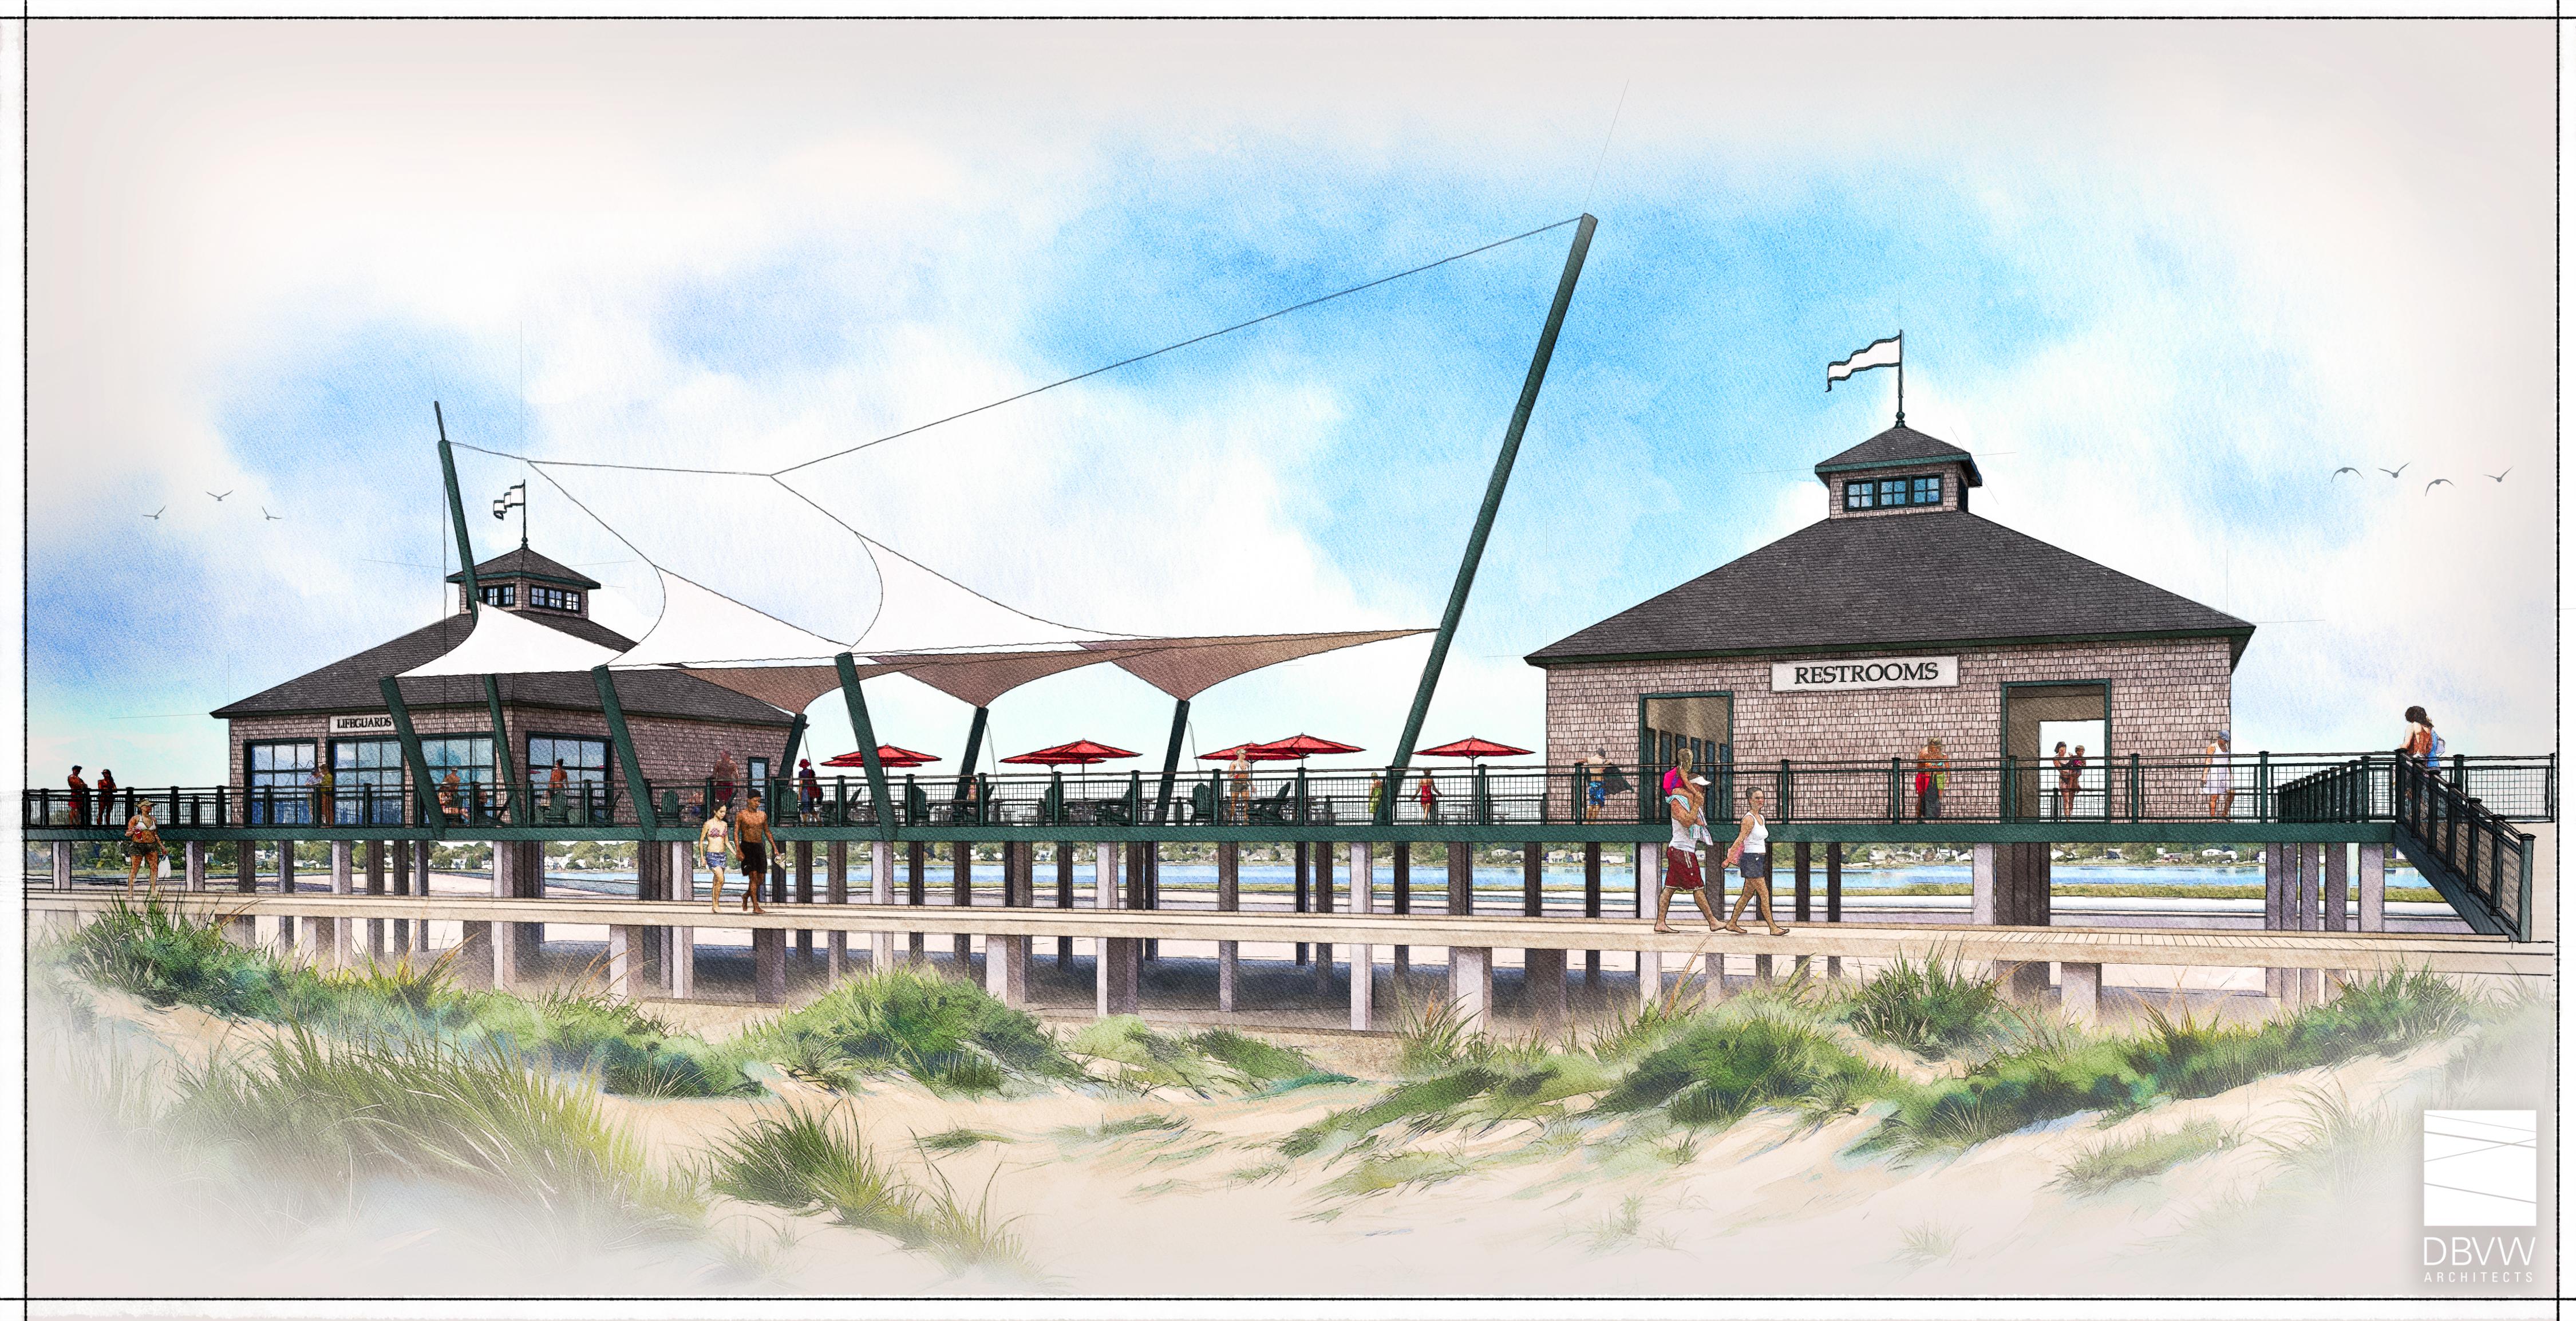
2. Restroom Building. This is the two story building adjacent to the west side of the elevated concrete deck.
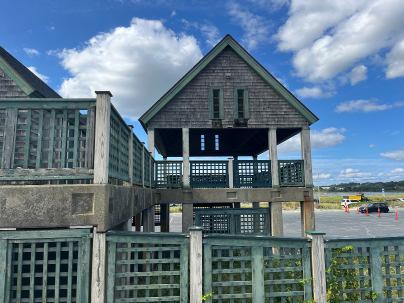
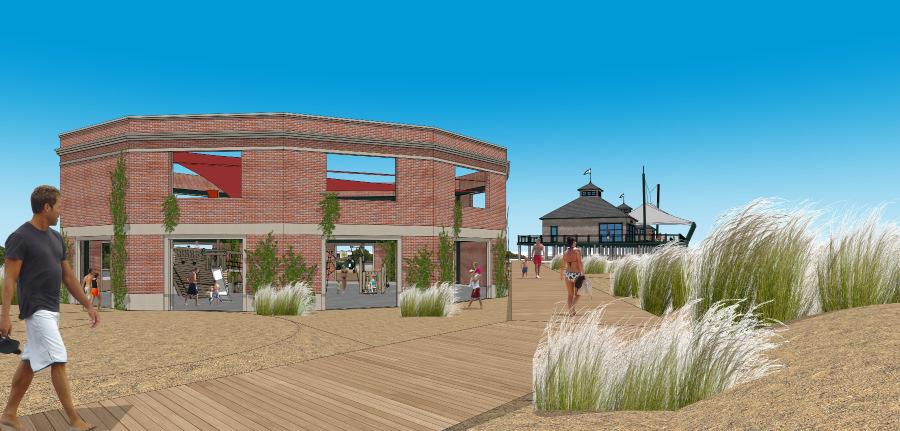
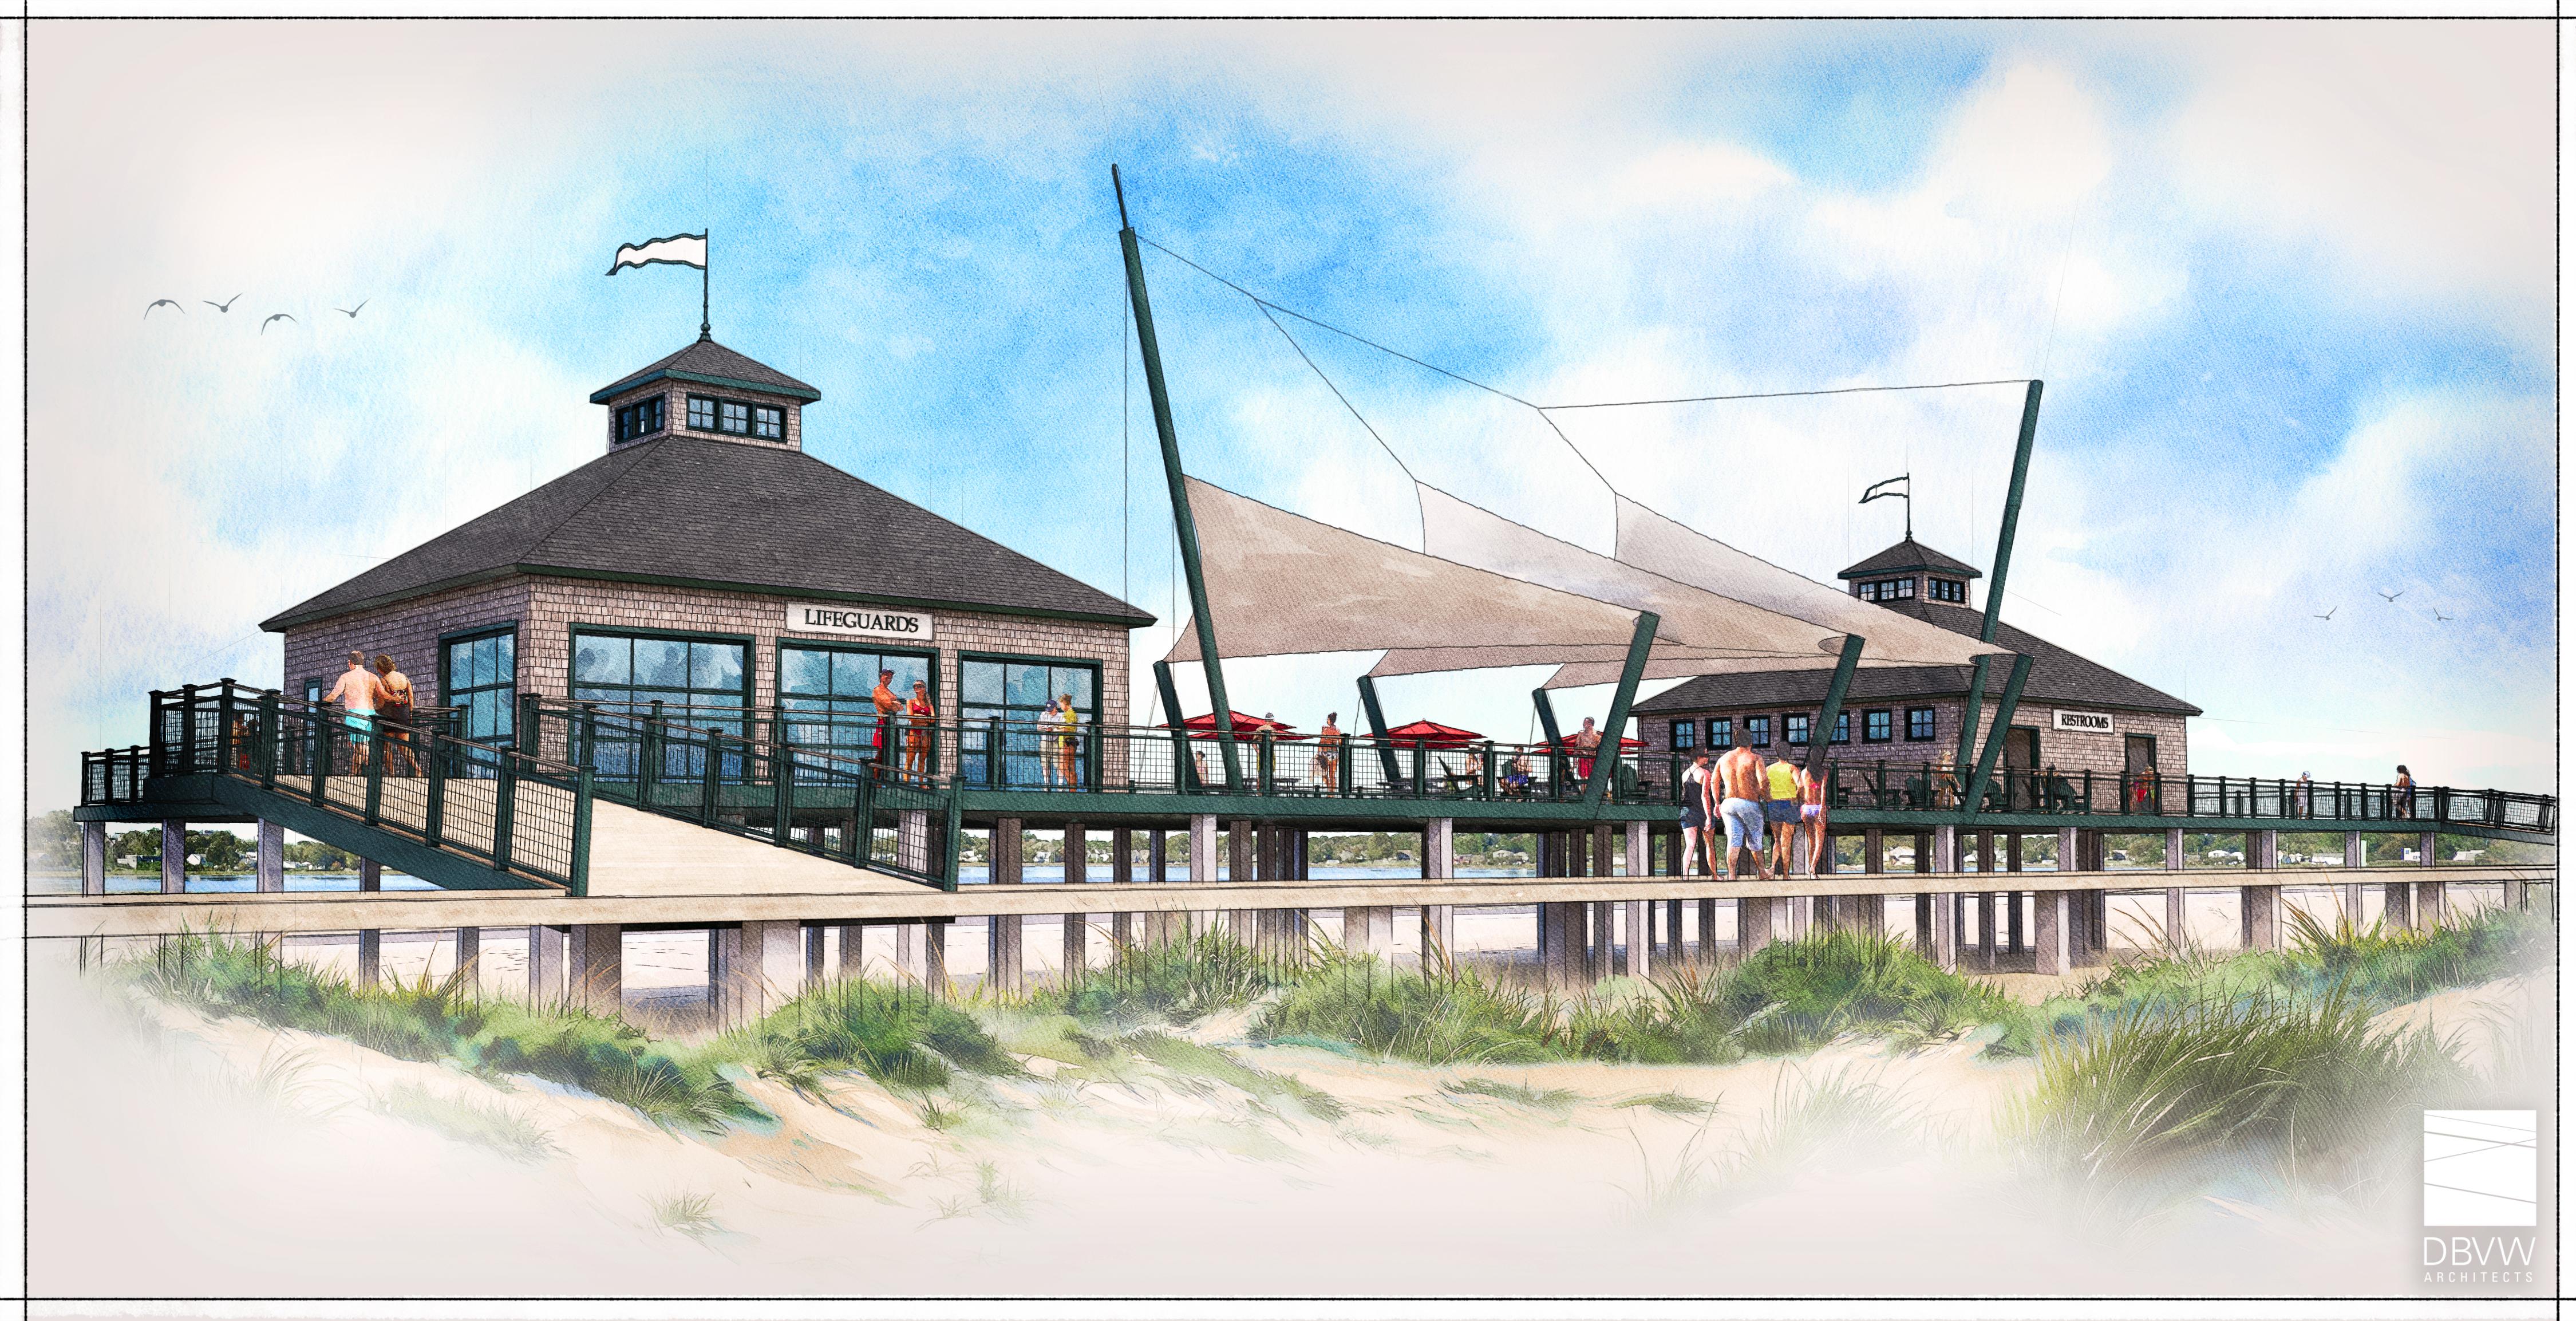
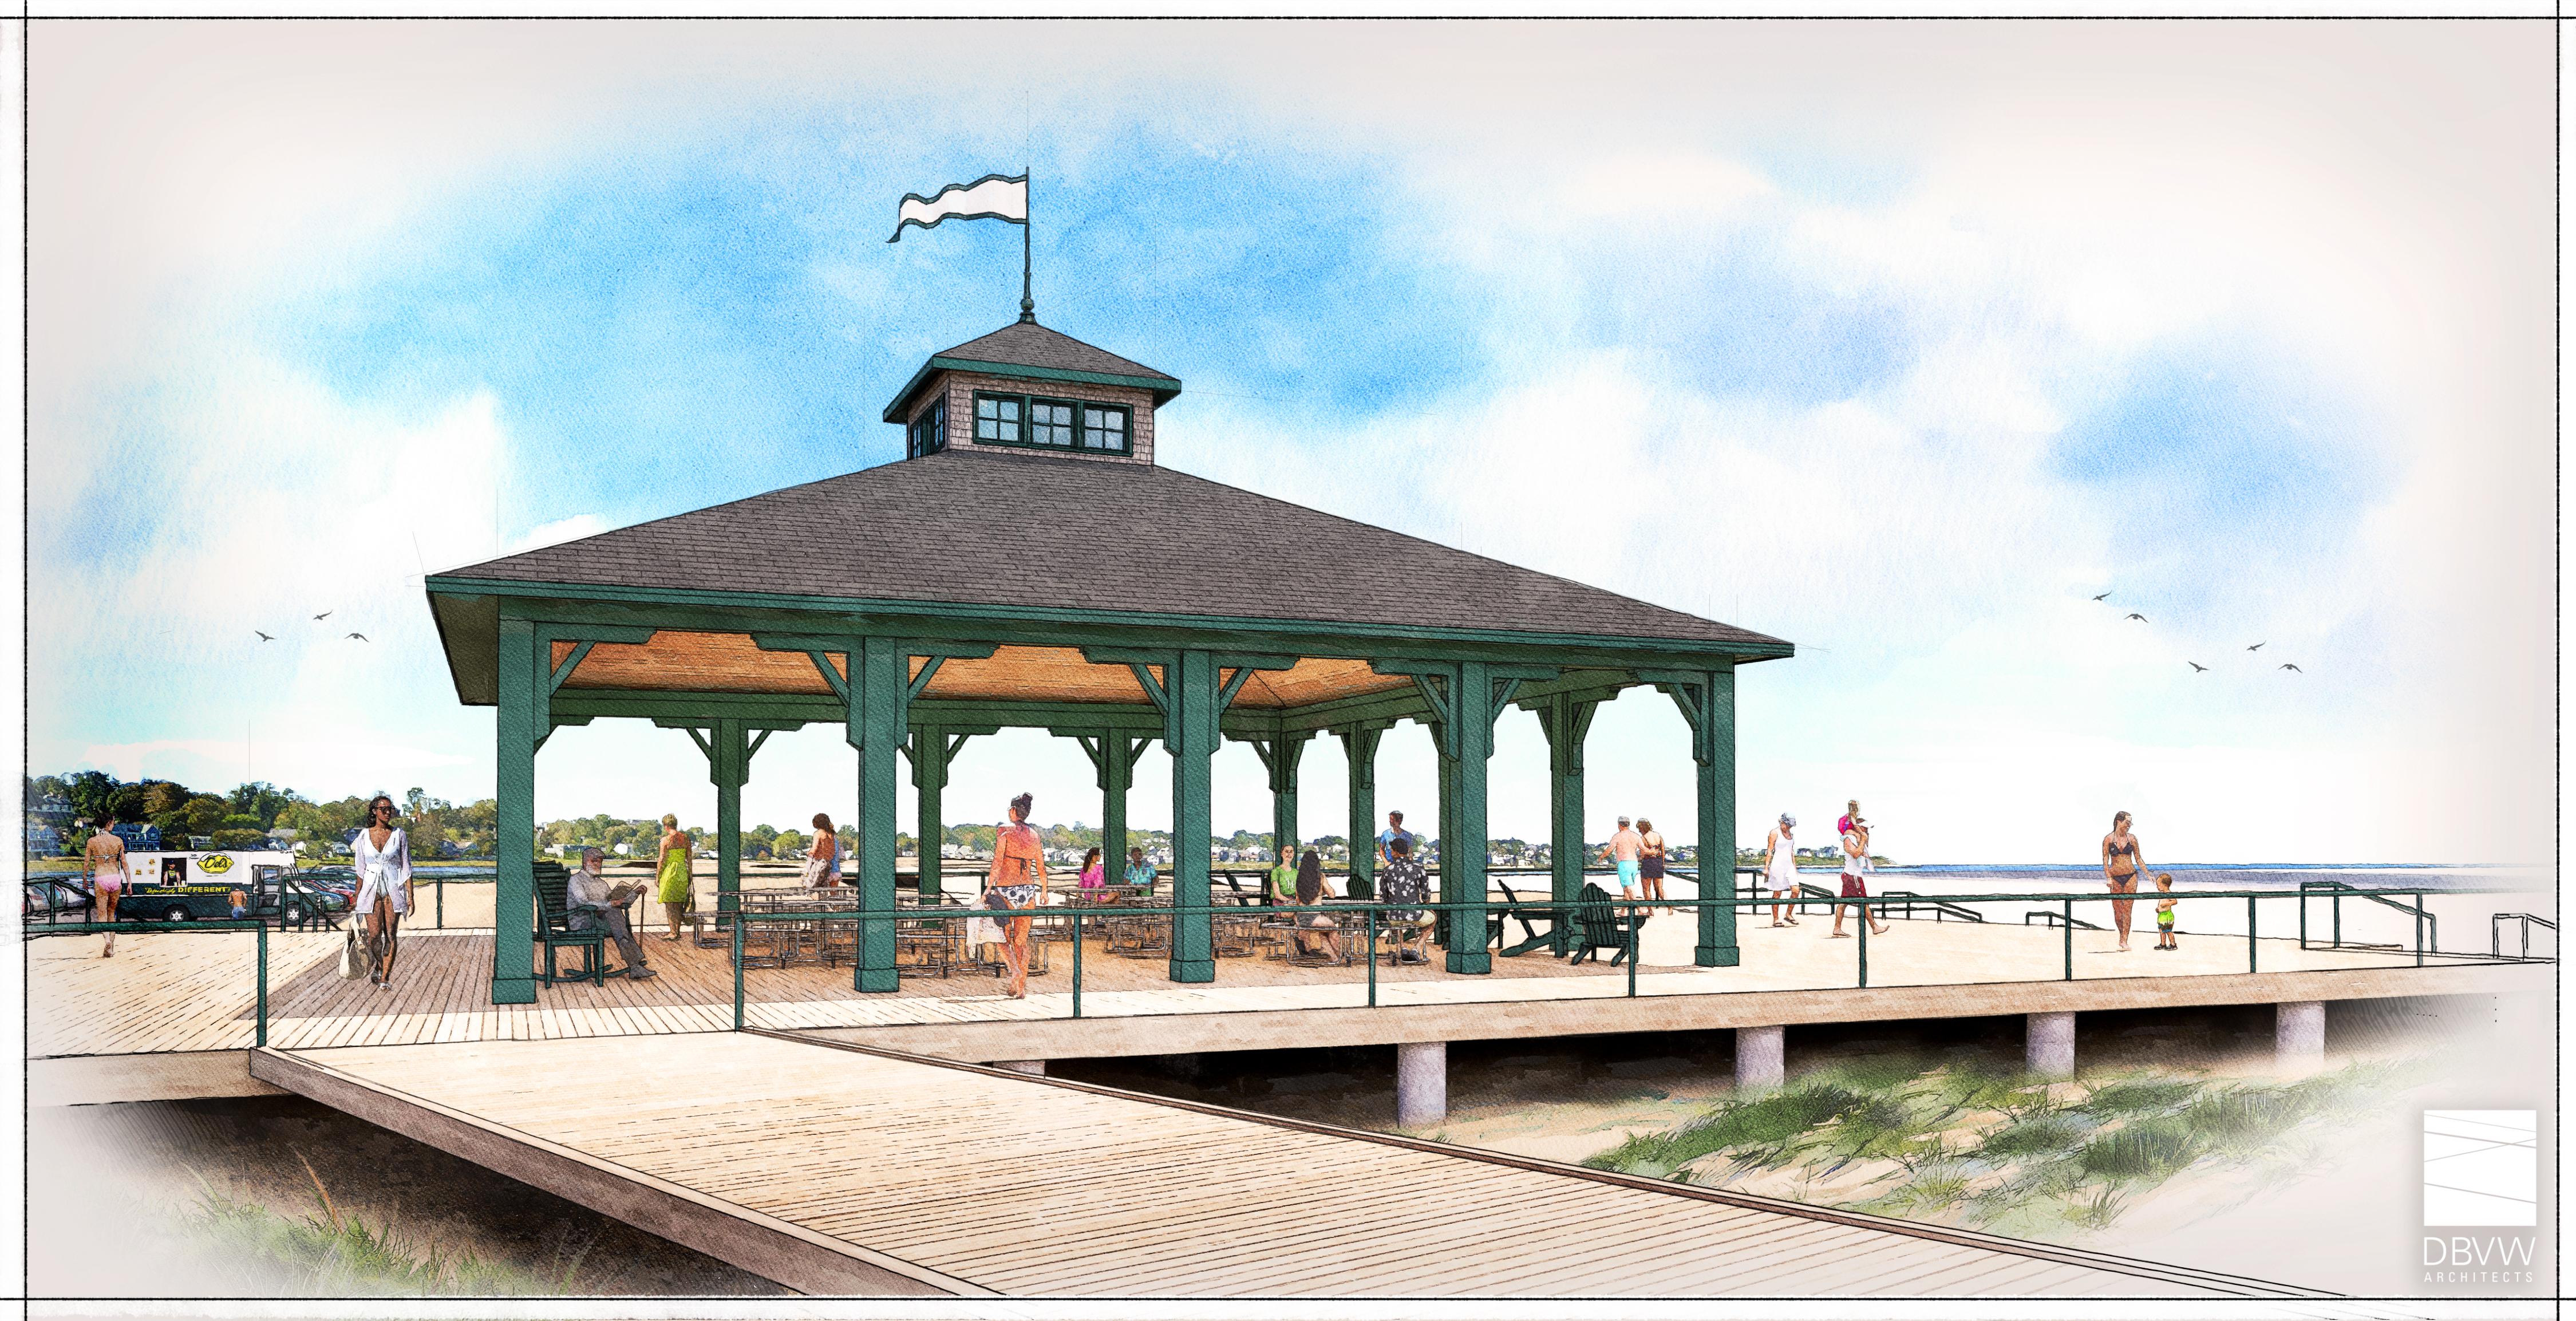
3. Pavilion. An open wood framed structure located on the east side of the elevated concrete deck.
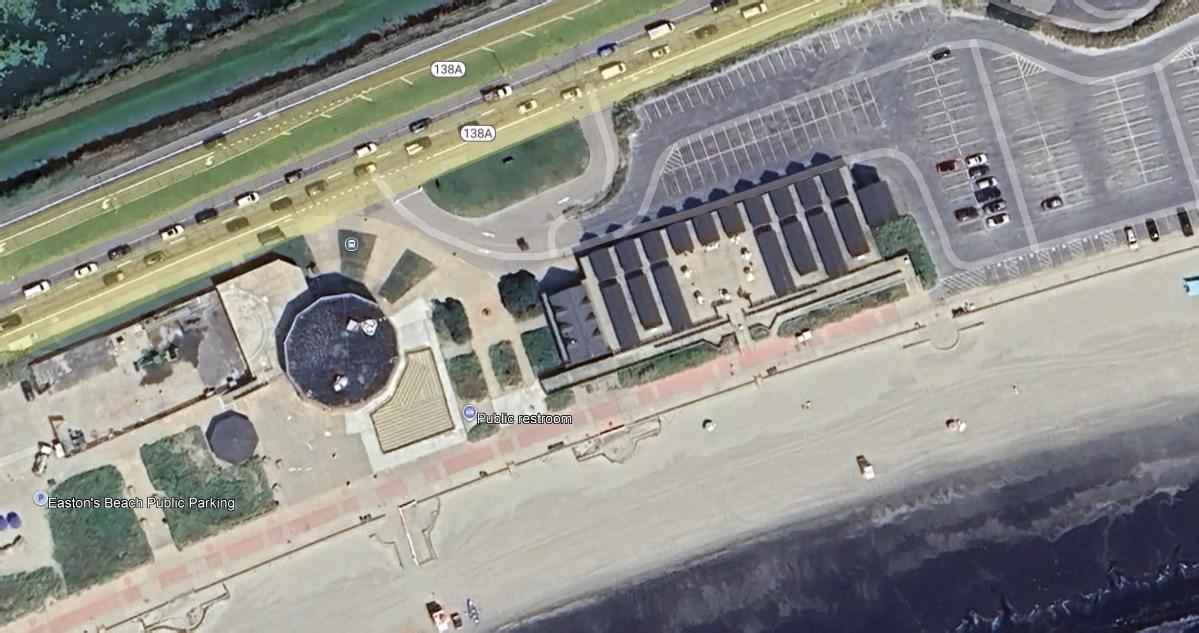
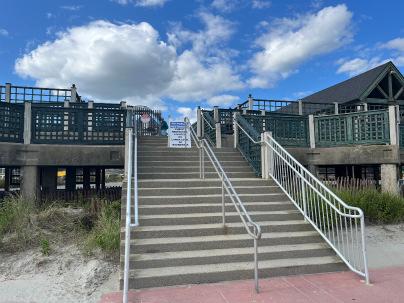
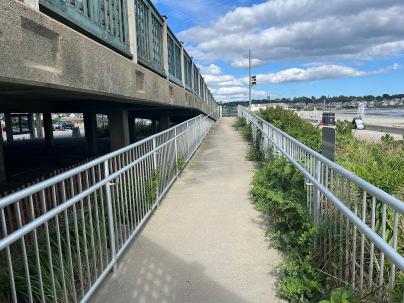
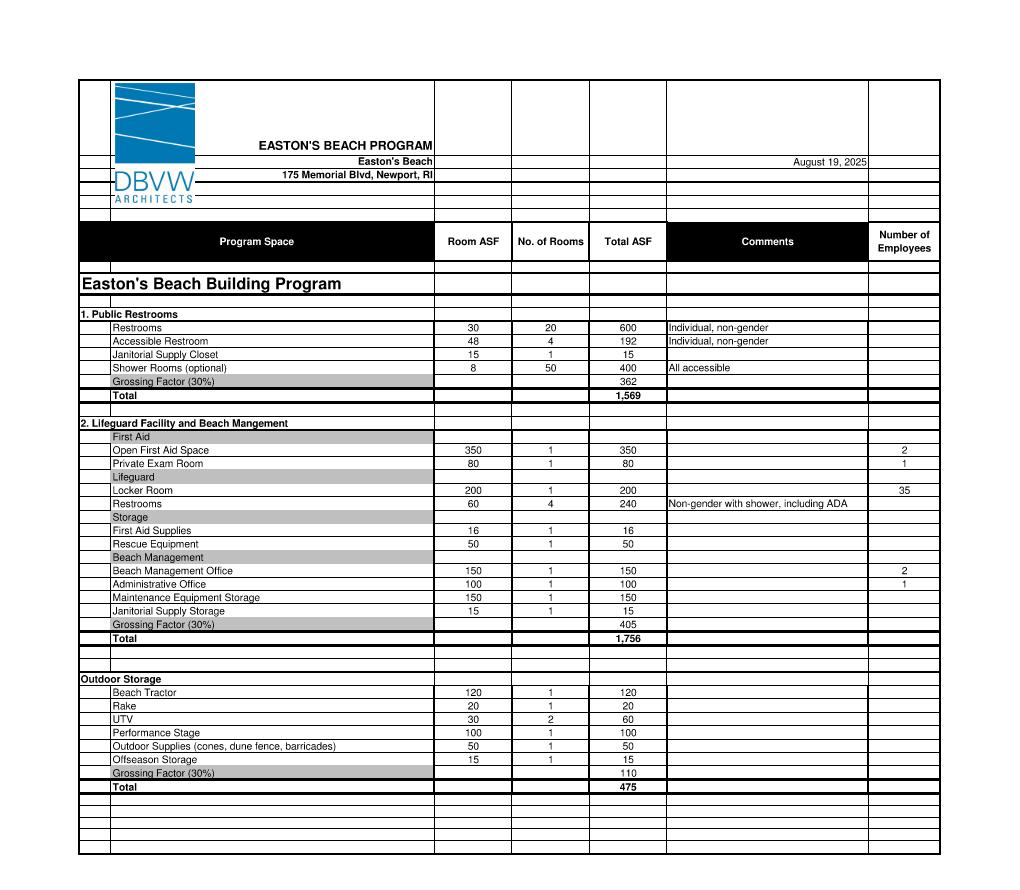
4. Elevated Concrete Deck. The existing concrete deck (with a footprint of approximately 74’x222’) including the concrete ramps and stairs that provide access to the deck on the beach side.
Our site visits consisted of structural observation of typical exposed conditions, no destructive investigation or testing was performed during these visits, except for one small area of the precast prestressed concrete plank which is discussed in more detail later in this report. The following is a brief structural description of each of the four primary structures, followed by a summary of any significant structural deficiencies observed, including a preliminary narrative of recommendations for each deficiency observed. This report is subject to the limitations stated at the end of the report.
GENERAL STRUCTURAL
Bath Houses
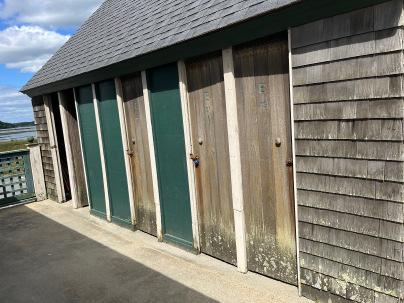
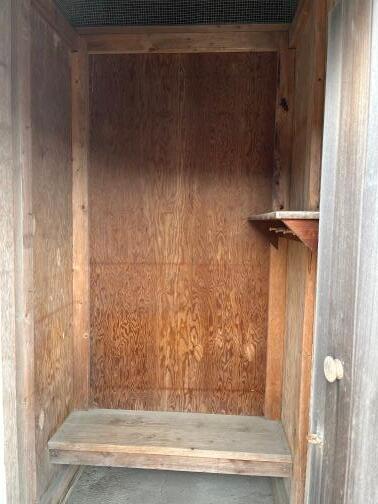
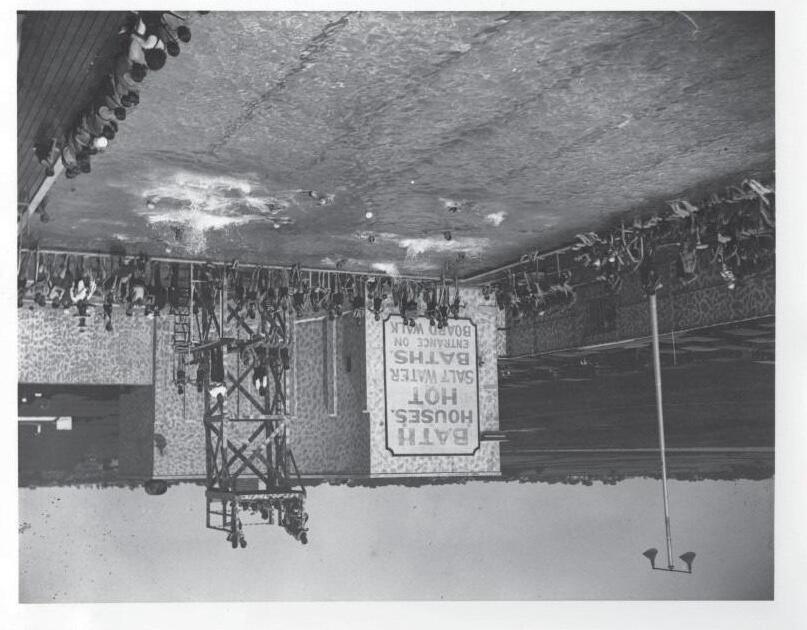
There are a total of 17 bath houses located on top of the elevated concrete deck. The buildings are closely spaced along the east and west sides of the deck, but are arranged to allow for a large central open deck area at the top of the ramp and stair entrance to the deck on the south (beach) side. The bath houses are simple wood framed structures with gable roofs. Each demising wall between changing rooms consists of a 2x4 wood frame with plywood sheathing that act as the structural support and shear wall for the building. Plywood roof sheathing is supported by 2x4 wood purlins (on the flat) that span between each of the main wood frame demising walls. The bottom of the walls are supported on top of a double 2x4 wood plate that bears directly on the concrete deck. The anchors into the deck are concealed, although speaking with the maintenance staff, anchors to the concrete deck do exist and have been discovered when replacement of the bottom wood plates has been required. We did not go into each of the changing rooms in all of the bath houses, but we did observe several typical changing rooms in multiple buildings. Based on this, the primary structural elements of the bath houses were in good condition with the exception of the two lower wood sill plates that are in contact with moisture and the concrete deck. The sill plates had localized deterioration, and it was clear that many of the sills had been replaced over the years. The exterior components and cladding of the buildings (siding, doors, trim, etc.) were in poor condition, but the main structural components on the interior generally appeared to be in good condition.
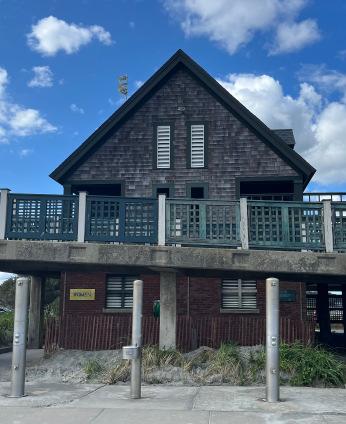
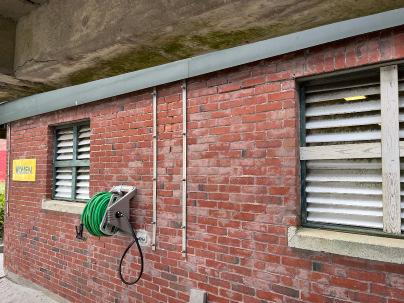
Bathroom Building
The existing bathroom building is a two story structure located adjacent to the west edge of the elevated concrete deck. The upper level of this building is relatively new (2014), wood framed construction, consisting of clear span, prefabricated, scissor type roof trusses, supported on wood bearing walls that are built on top of the lower level brick walls. The second floor framing appears to be conventionally framed wood floor joists that are supported by the brick walls of the lower level. The lower level of this building is older construction (1993) and consists of unreinforced brick bearing walls, similar to the buildings that were recently demolished adjacent to the Rotunda. The exterior walls of the upper level are connected to the older brick walls below using long metal straps that are visible on the outside face of the brick. The lower level floor appears to be a slab on ground. All of the exposed structural elements of the bathroom building appear to be in good condition. However, since the lower level of the building was constructed without regard for wave forces (solid unreinforced masonry walls on shallow footings rather than on piers or piles like the newer adjacent deck structure), the longevity of this building is limited. The structure is very vulnerable to the next major storm that could exert wave forces on the large wall surfaces that are within the flood elevation. So even though the current structural condition of the lower building appears to be good, its construction type is not well suited for this type of site. And because the newer second story building was constructed on top, and was not independently supported, it puts the upper building at the same risk during a significant storm event. If the lower level walls are compromised, it directly impacts the walls above.
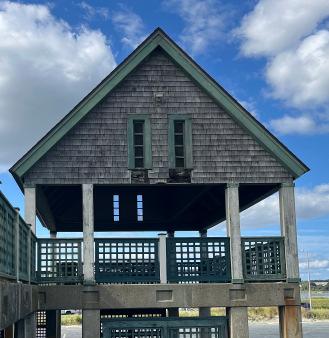
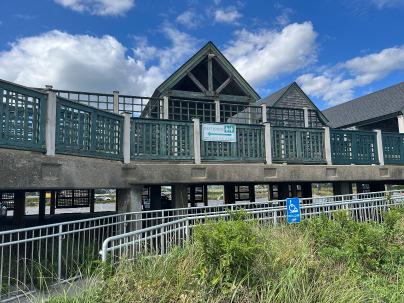
Picnic Pavilion
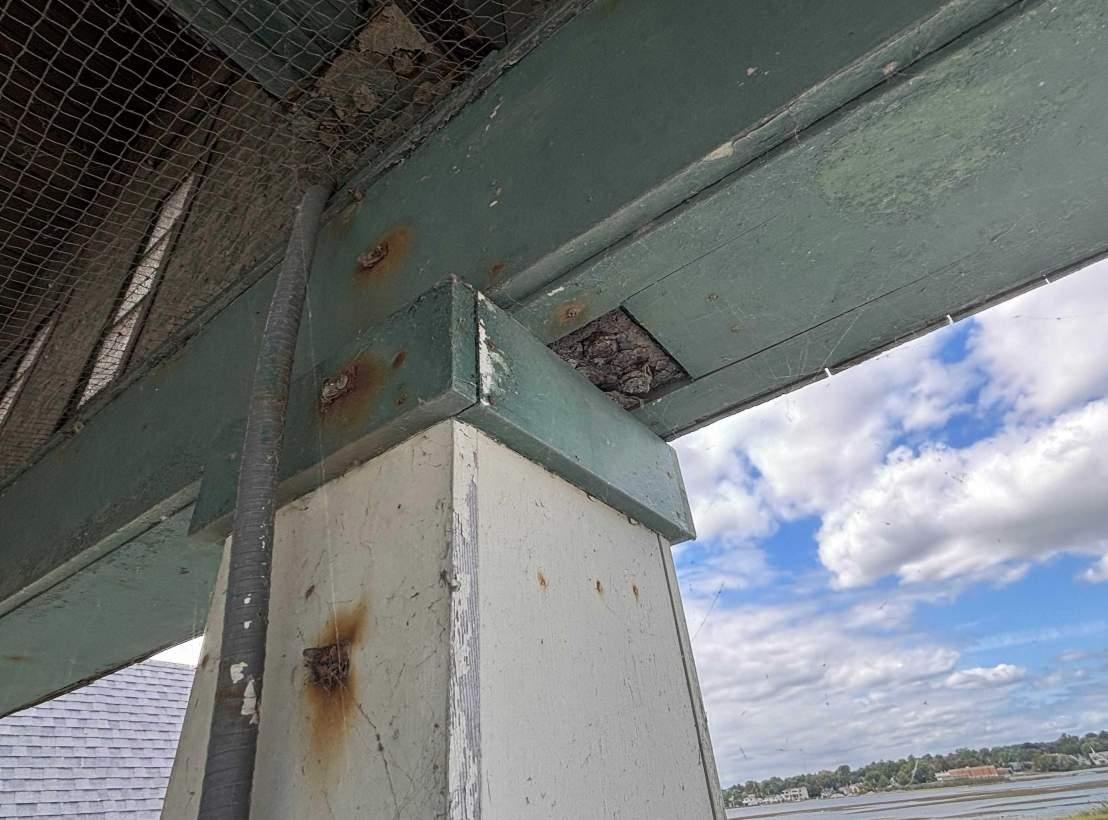
The picnic pavilion is a one story open structure with a simple gable roof. The pavilion is constructed on top of the elevated concrete deck at the eastern most end. The pavilion roof is supported by four wood posts along each gable end of the building. There are four wood roof beams that span the long direction from gable to gable that support exposed wood rafters. The upper portion of the gable roof is tied with steel tie rods. All of the wood posts and roof beams are concealed with wood trim. Only the roof decking and rafters are fully exposed. For this reason, many of the structural elements could not be directly observed, but there is visible deterioration at some of the primary beams, tie rods, and connectors that is described later in this report.
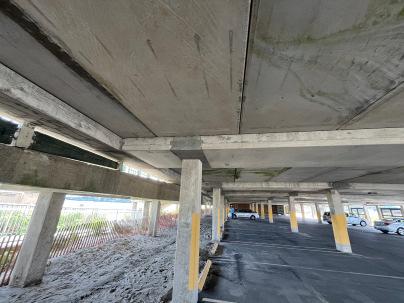
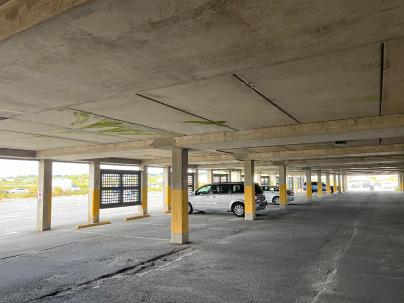
Elevated Concrete Deck (including attached ramp and stair)
The elevated concrete deck is approximately 74 feet wide and 222 feet long. The construction of the deck consists of a +/- 3” thick concrete slab poured on top of 4” and 6” thick precast prestressed concrete plank. The planks contain prestressed steel strands that are in tension and reinforce the planks. The planks are supported by precast prestressed concrete beams that span between the precast concrete piles. The attached ramps and stairs on the south side of the deck consist of reinforced, cast in place concrete supported on concrete piles/piers. A review of the original shop drawings for the precast plank indicated that the deck slopes 1/8” per foot from a high point at the interior column line (Line E on the drawing), and down towards the north (-6”) and south (-3”) edges of the deck. In general, the condition of the concrete deck, piles, ramps, and stairs is in fair condition, but there are early signs of deterioration that are starting to appear.
OBSERVED STRUCTURAL DEFICIENCIES
The observed structural deficiencies have been grouped into three general categories, as was done with our evaluation of the carousel and snack bar buildings, which were recently mostly demolished. This was done based on preliminary observation alone and may need to be modified based upon any future investigation and discovery. The three categories are:
1. Structurally Unsound and Unsafe: Areas where the structural elements are severely deteriorated and/or have failed. These areas should not be open to the public.
2. Substantial Deterioration: Areas that exhibit significant deterioration but are not currently structurally unsafe. These areas should be repaired in the next one to two years to avoid becoming an unsafe condition.
3. Limited Deterioration: These areas should be repaired within the next two to three years to avoid additional deterioration.
The items within each of the categories below are not listed in any particular order of importance.
Category 1 Deficiencies (Structurally Unsound and Unsafe)
There were currently no deficiencies observed that would fall into this category of being structurally unsafe, failing, or that should be closed to the public. There were observed deficiencies that require prompt attention, and that if not addressed soon, could very quickly move into this category.
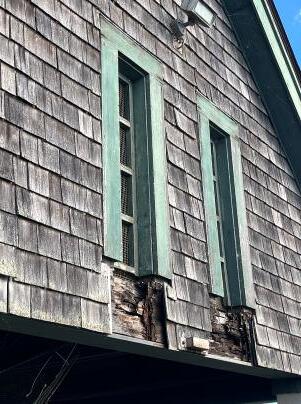
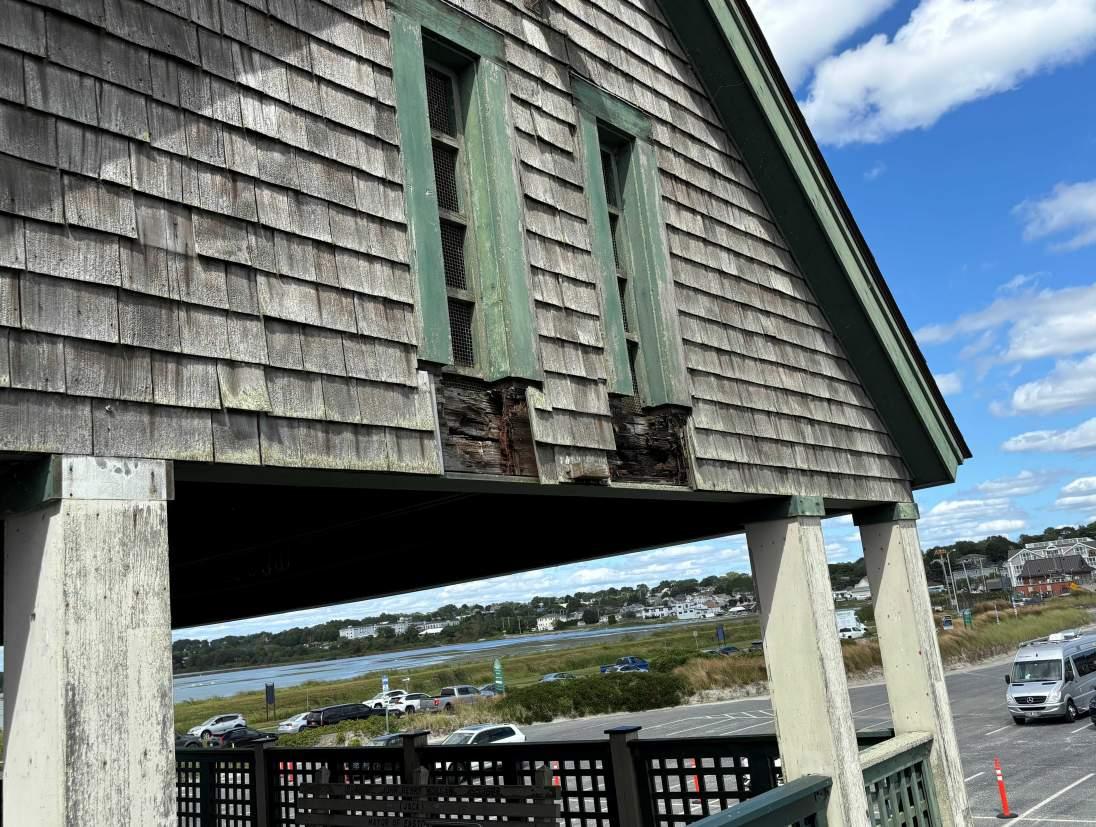
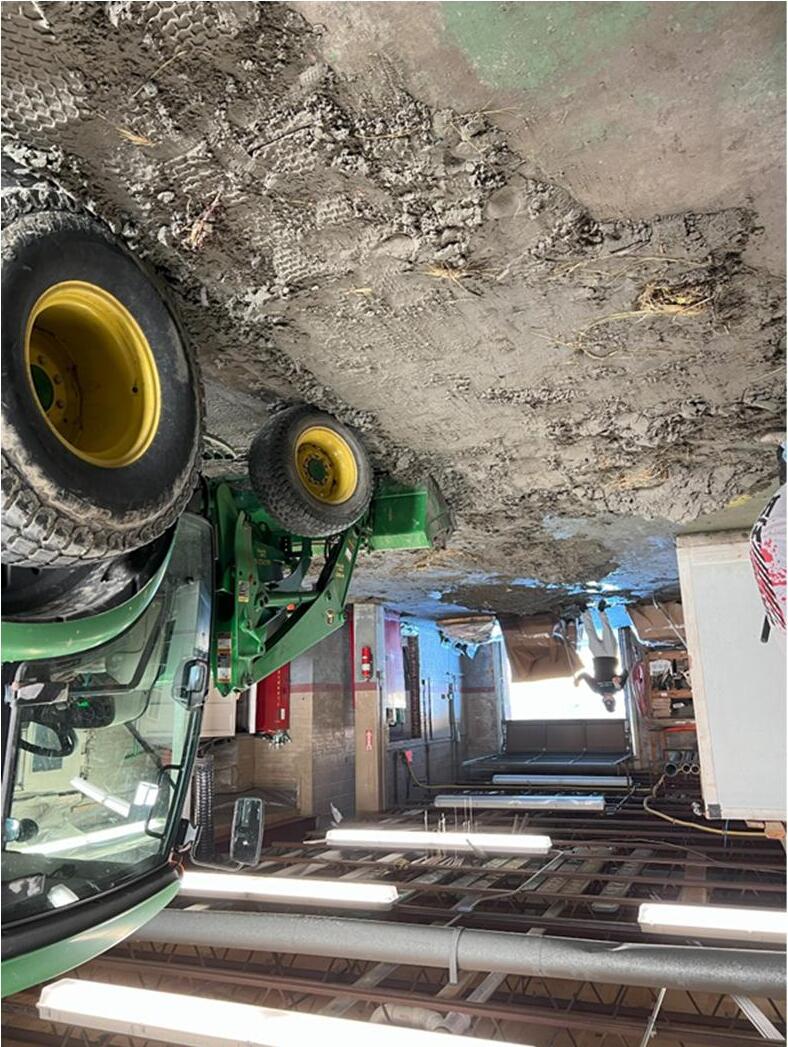
2.1 Deterioration of Picnic Pavilion Structural Elements (Reference Photos 2.1a, 2.1b, 2.1c, and 2.1d)
There were numerous areas of observed deterioration at the Picnic Pavilion. As previously mentioned in this report, the beams and columns that support the Picnic Pavilion roof are covered with trim boards. For this reason, a couple of localized areas were removed prior to our visit, to allow for more detailed inspection. What was discovered is that some localized portions of the gable end beams are severely deteriorated. It was also found that some of the bottoms of the posts were rotted and at least one had been repaired. Many of the steel connectors that were used were not galvanized and are severely deteriorated. The steel tie rods at the upper portion of the roof are also severely deteriorated with significant loss of cross section.
The required repairs to the pavilion are extensive. Even just to do a full structural evaluation and make repairs, all of the trim boards around the main support beams and posts will need to be removed. It is likely that the north and south gable end beams will need to be replaced entirely. It should also be assumed that the lower portion of all the wood posts will need to be replaced. All bolted steel connectors will need to be replaced throughout the structure with new galvanized or stainless steel connectors and bolts to match the existing sizes and quantities. Finally, all of the steel tie rods will need to be replaced in kind with new galvanized or stainless steel tie rods and bolts. It is likely that additional items will require repairs once all of the trim boards have been removed and all structural members exposed.
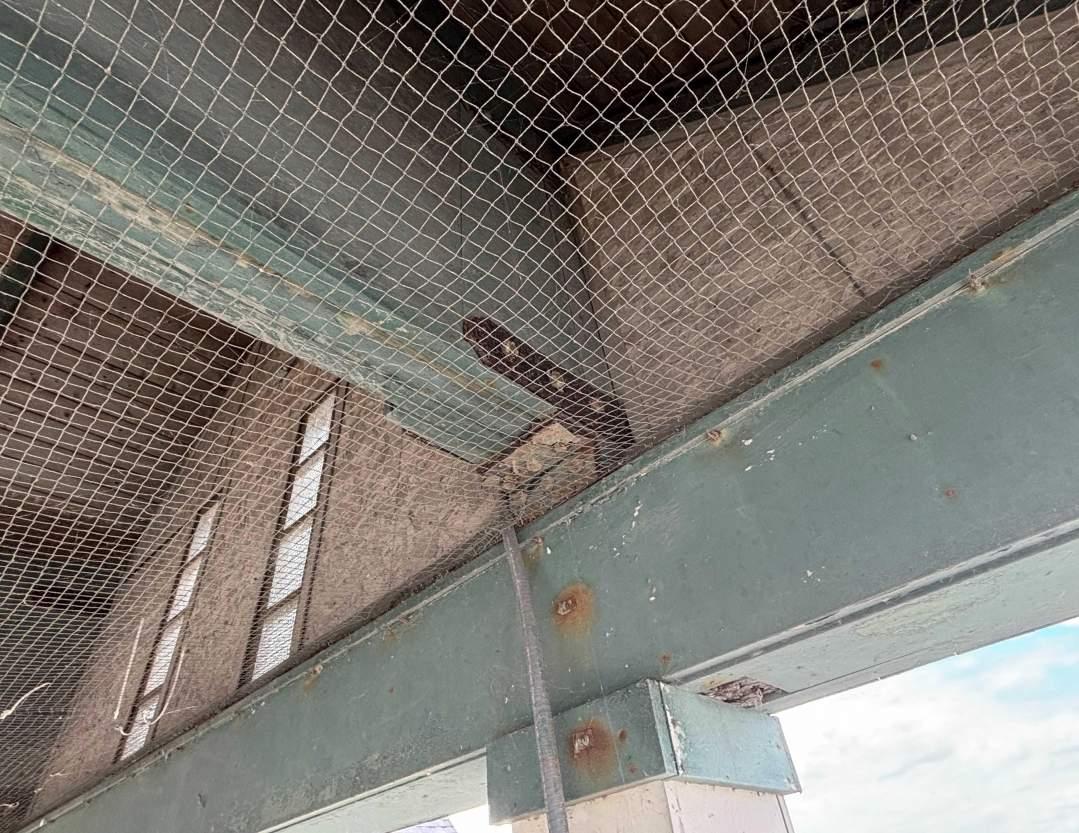
2.2 Deterioration of Metal Truss Plate Connectors
(Reference Photo 2.2a)
The steel connector plates at the gable end “porches” of the bath houses are severely deteriorated. These occur on the outside face of the gable end timber truss that supports the exposed covered porch roof framing on the south side of the elevated deck. There are four bath houses that have these exposed gable end trusses with deteriorated connector plates.
All connector plates will need to be removed and replaced with new galvanized or stainless steel plates and bolts to match the existing.
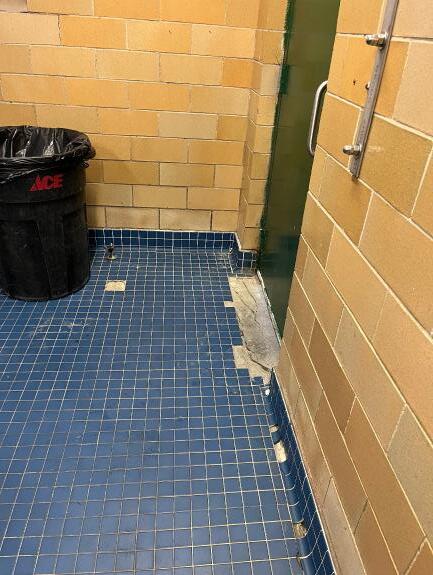
2.3 Ponding Water on Elevated Concrete Deck
(Reference Photo 2.3a)
Currently there are numerous locations where a significant depth of water ponds on the concrete deck surface. This makes some of the bath house changing rooms unusable. It also leads to rapid deterioration of the building sill plates described above, as well as allowing water to migrate through the topping slab and into the precast prestressed planks below. The original precast shop drawings for the deck were reviewed, and it was found that the original design called for a 1/8” per foot slope in the precast from the middle of the deck down towards the outside edges. Using a laser level, this slope was confirmed to exist in the precast plank units, when measured from the underside of the plank in the parking area. However, when measuring the slope from the top surface of the concrete deck, the same slope does not exist. The southern bay of the concrete deck slopes as designed from the interior to the outside edge. But the northern two bays of the deck slope from the high point at the interior down towards the north edge, but when you get to within about 6 to 8 feet of the edge, the deck surface starts to slope back up. This creates a low point in the deck surface roughly 6 to 8 feet from the north edge. This would mean that even though the main precast components slope correctly, the topping slab that was poured over the plank did not maintain the uniform thickness of 3”, and so there is a counter slope to the slab along most of the north edge that was not intended. The counter slope was confirmed using a laser level, but is also evident during rain events, and the visible water staining on the concrete surface where the water ponds.
Several small drain holes were drilled through the concrete deck in order to reduce the ponding and allow the water to drain through the deck to the parking area below. But since the concrete surface was not pitched to shed water towards these new drain holes, they are only minimally effective, and they do not fully remove all the standing water from the deck. Drilling larger or more frequent holes in the deck is not an option, because it is critical that the prestressing strands in the planks not be cut. The solution to this issue needs to be considered in conjunction with the item described in the following Section 2.4. The proposed coating described in that section would include adding some additional slope to the concrete surface that would move the water to several new drains installed along the north edge of the deck. The bath houses would need to be removed in order to properly slope the deck to the new drains.
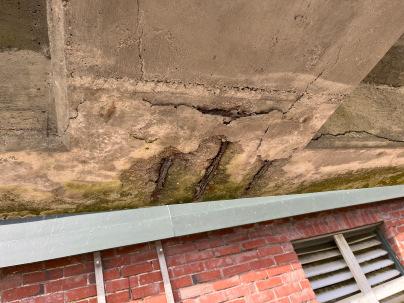
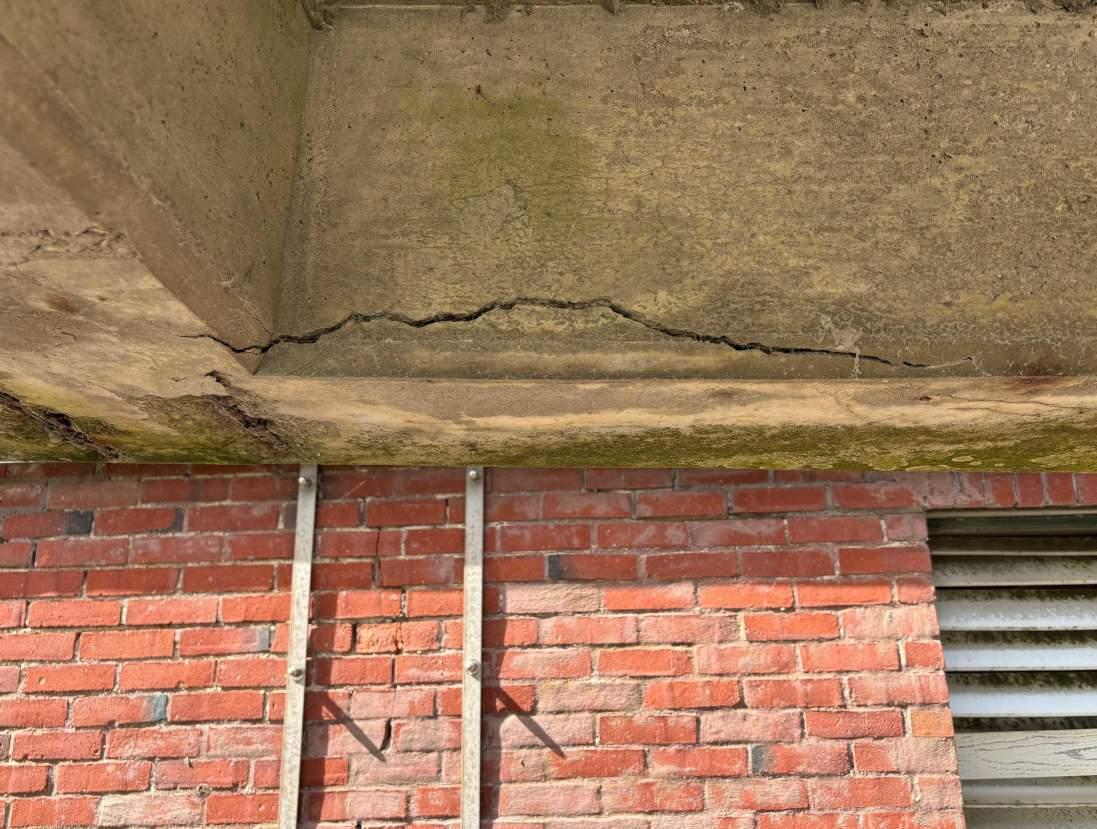
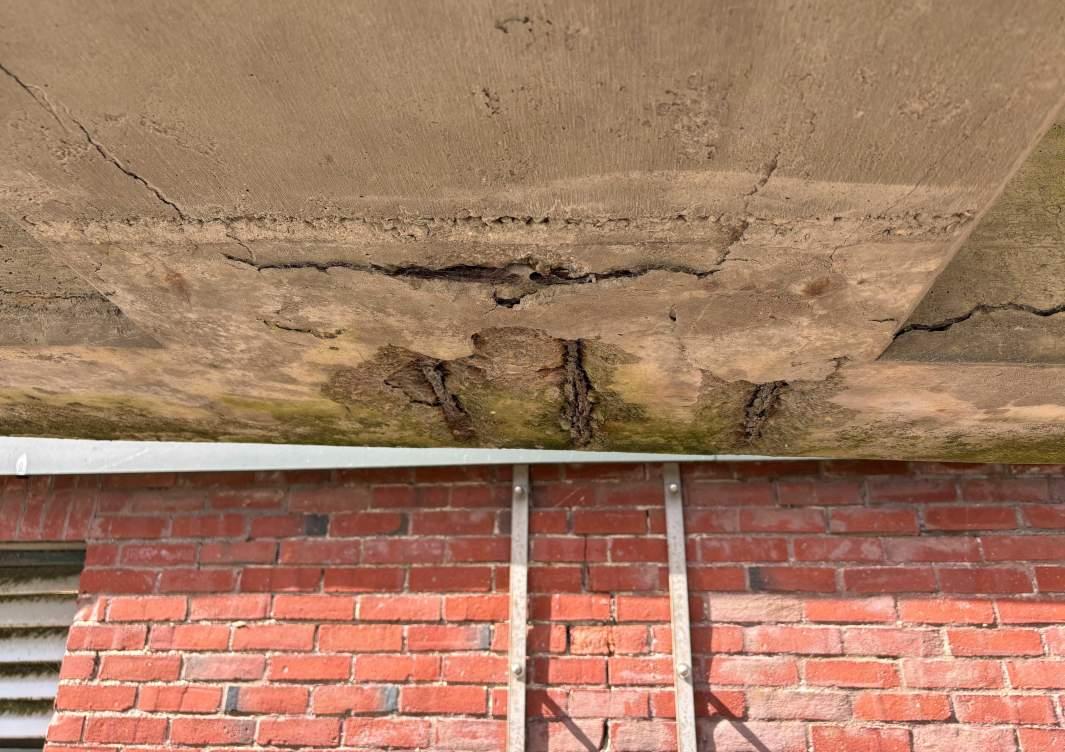
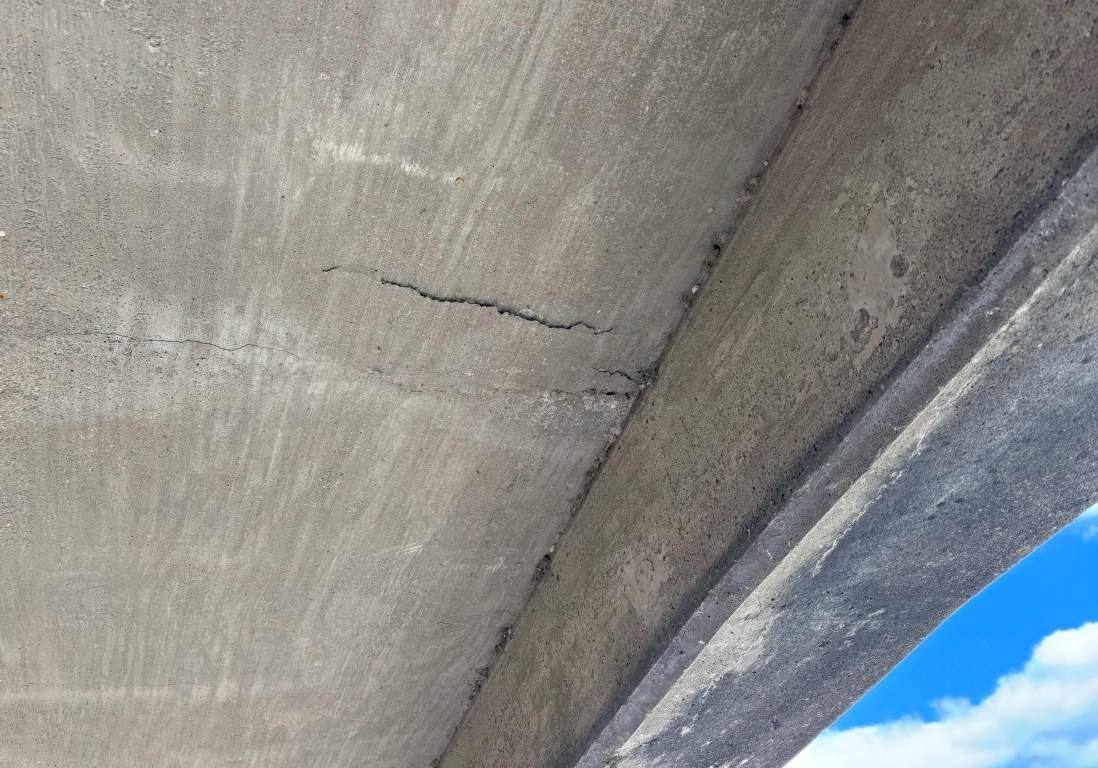
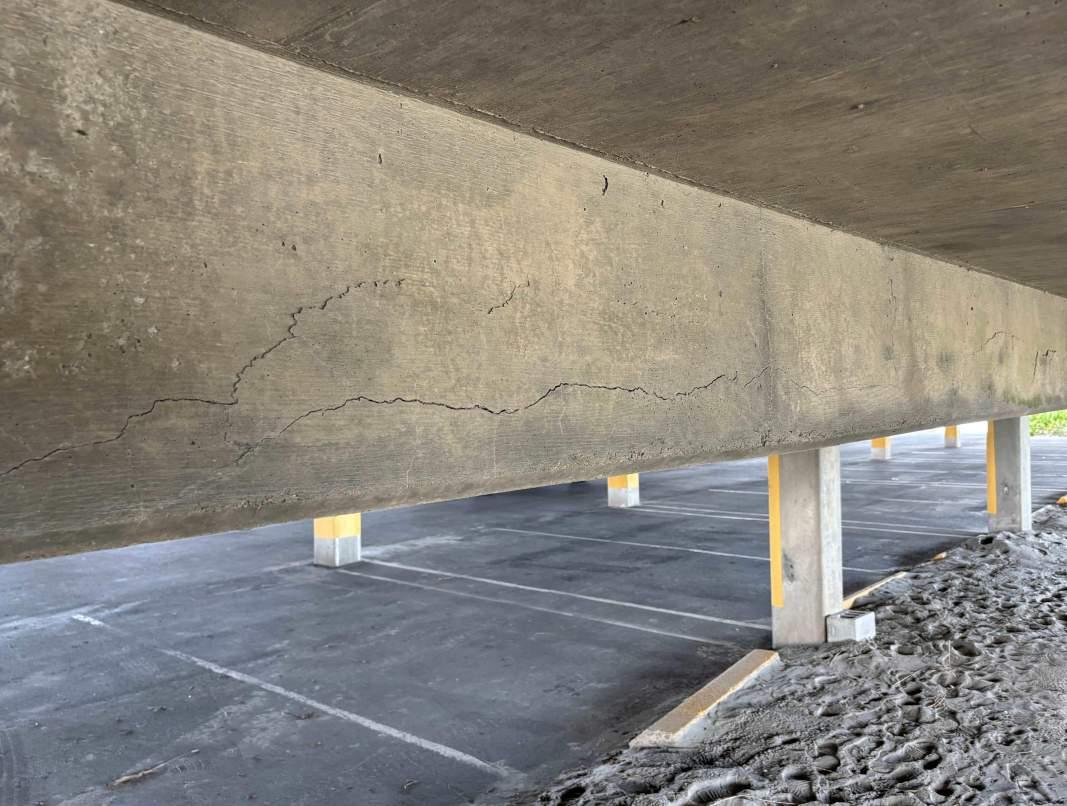
2.4 Cracks in Precast Concrete Plank
(Reference Photos 2.4a, 2.4b, and 2.4c)
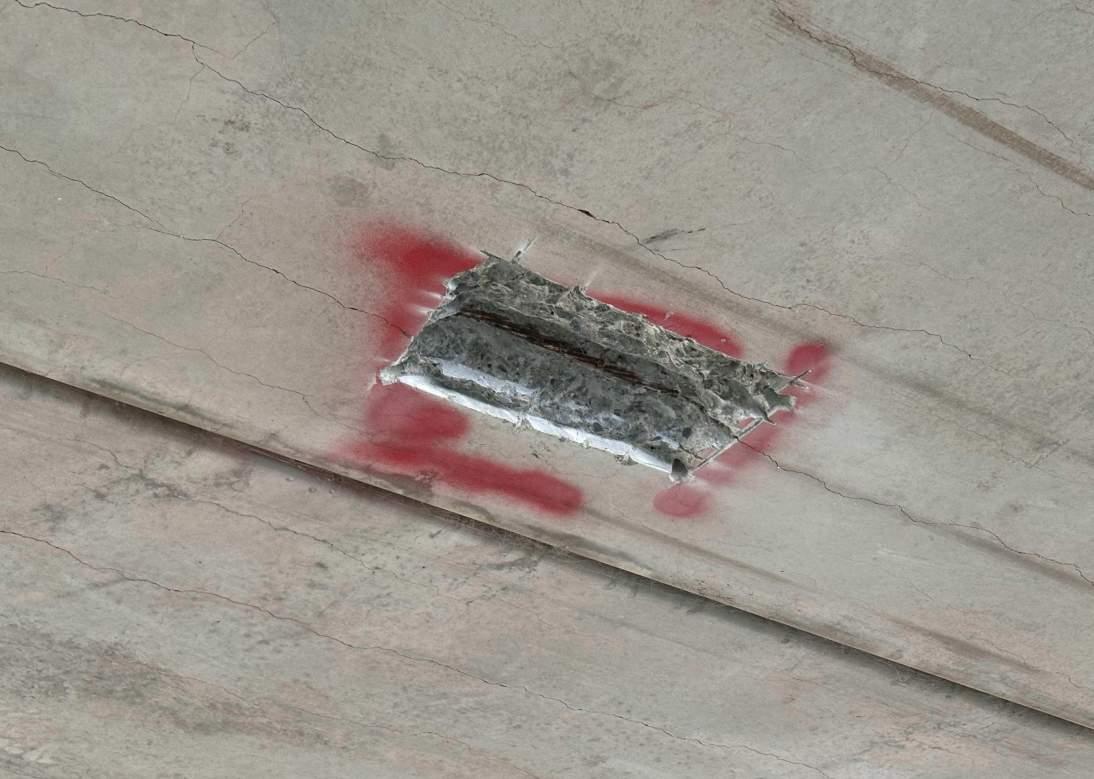
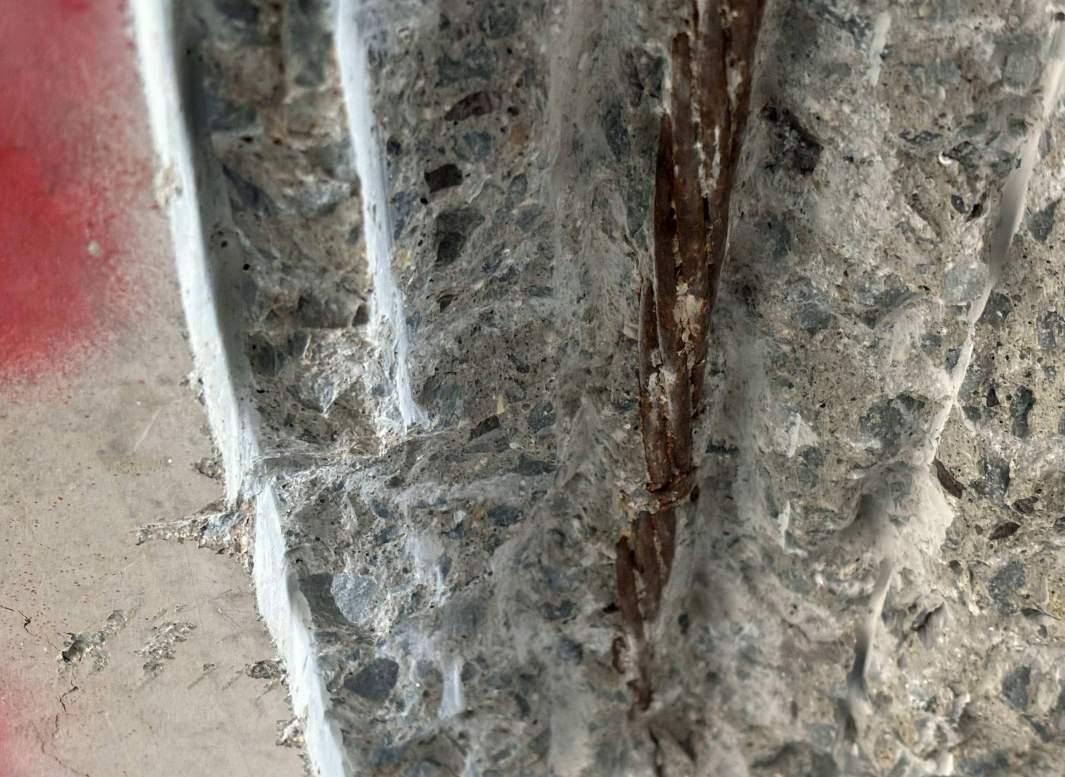
There are numerous hairline cracks and lines of discoloring that are visible from the underside of many of the precast concrete planks. These occur along the lines of where there are reinforcing
strands in the bottom of the plank, and are a sign of early deterioration of the plank reinforcement. The most noticeable locations are the planks that are below the area that has open deck above, and not protected by the bath houses. In order to investigate the level of deterioration further, we had a small section of the underside of the concrete cover removed from below one of the reinforcing strands. We chose a location that appeared to have the greatest amount of cracking and discoloration. This test observation location indicated that the cracks do occur along the lines of the prestressing strands. The strand at this location had approximately 1.25” of concrete cover below the strand. The strand had some surface rusting, but did not appear to have any significant loss of material at this point. The strand was approximately 5/16” in diameter.
Based on this discovery, it appears that the deterioration of the strands is in the early stages and at the point where it can be remedied without complete removal of the structure. Because there has not been significant loss of material, if the cause of the deterioration can be eliminated or greatly reduced, then the existing structure can remain safe for its continued use for years to come. There are a variety of concrete repair products that can be used to coat and seal the surface of the concrete deck above to prevent water from migrating through to the plank. It would also be advantageous to treat the underside of the plank with a corrosion inhibiting product to prevent further strand deterioration. It is also critical that no areas of ponding water exist, and that the bath house buildings allow for all surface water to freely move to drains or off the edge of the deck. This can be done by introducing additional drains, and creating positive pitch towards those drains prior to coating and sealing the concrete surface. In order to do this work, the bath houses would need to be removed, or temporarily removed and replaced, in order to fully coat and seal the entire deck surface, and provide the proper sloping of the surface to the new drains.
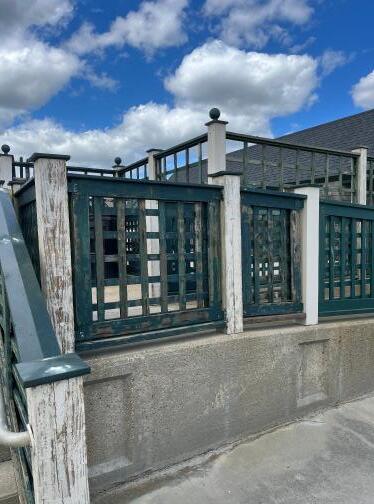
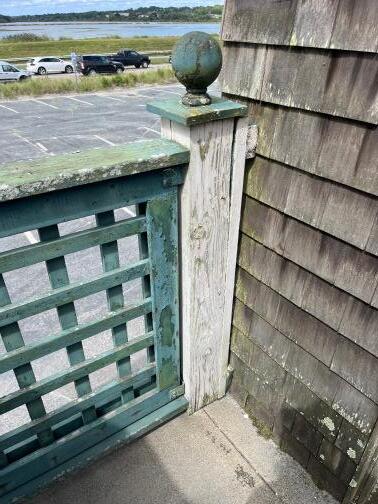
2.5 Deteriorated and Loose Railing Posts
Many of the railing posts along the edge of the elevated concrete deck are loose and can be swayed with little effort. Most of the rail posts appear to have been mounted to the concrete deck with a surface mounted metal base flange with a welded vertical pipe that is sleeved and through bolted into the bottom of the wood rail post. In many observed cases the bottom of the wood post is in direct contact with the concrete deck and therefore wicks up moisture which causes deterioration over time. Once the lower portion of the post has been compromised, the sleeved pipe becomes loose and allows for movement at the top of the rail post.
All loose rail posts should be replaced with new posts, either using the same or a similar surface mounted system. It would be preferable to develop a slightly modified surface mounted detail that allows for more of a standoff above the surface of the concrete. It would also be good to treat the cut bottom of all new posts with a wood preservative prior to installation. Another approach would be to use all galvanized steel rail posts and then clad with wood if desired.
2.6
Localized
Spalling of Cast in Place Ramp Beams and Slab
(Reference Photos 2.6a and 2.6b)
In general, the condition of the cast in place concrete ramps and slabs is not bad, but there are several observed isolated areas that require more urgent attention than the majority of the structure. These are areas where there has already been spalling of the concrete caused by deterioration of the steel reinforcing, or where there are very large cracks that are on the verge of having concrete spalling.
These areas need to be repaired by removing all loose concrete material, then wire brushing and cleaning the exposed steel reinforcing, coating the exposed steel with a rust inhibitive primer, and finally repairing the portions of spalled concrete with concrete repair mortar.
Category 3 Deficiencies (Limited Deterioration)
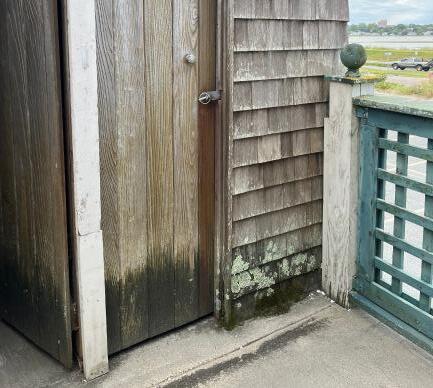
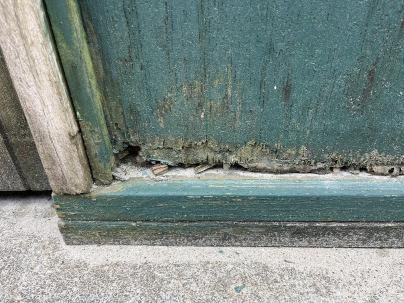
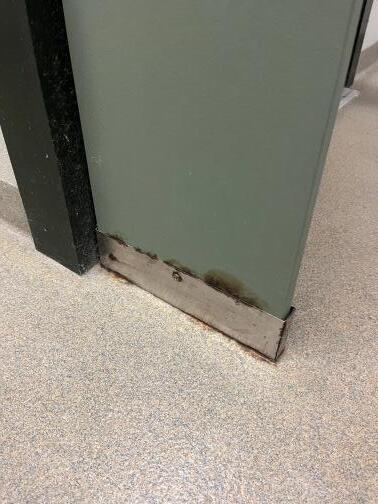
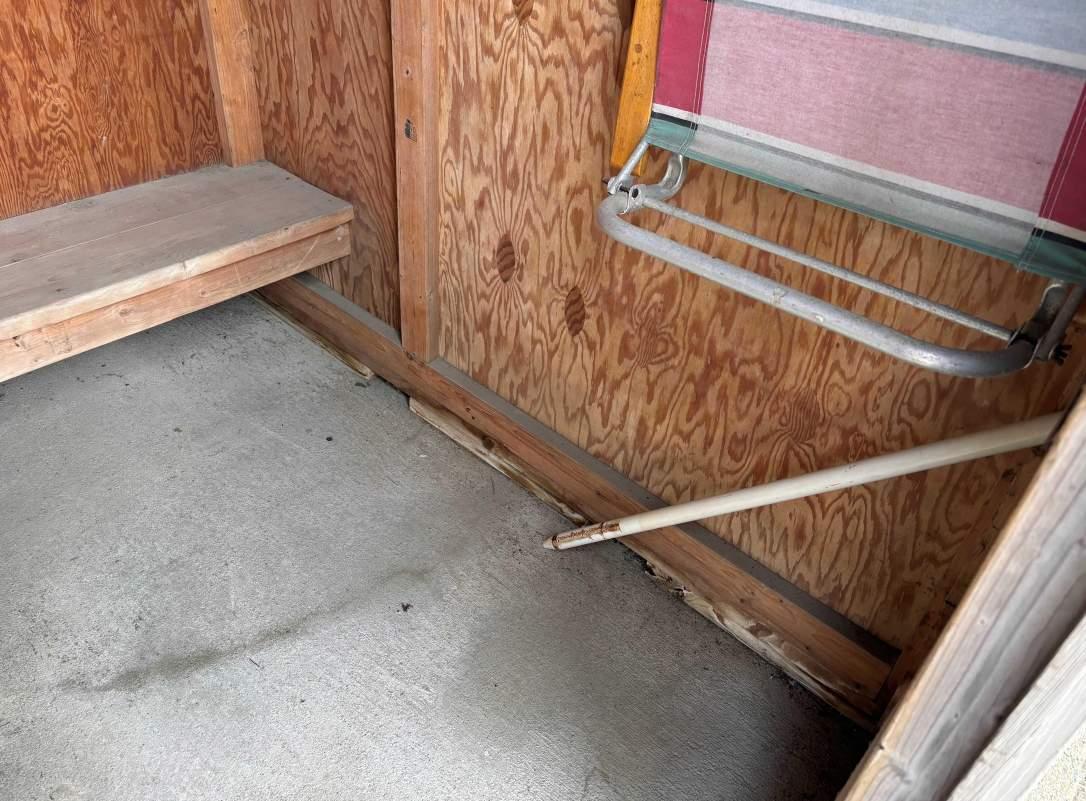
3.1 Sill Deterioration at Bath Houses
(Reference Photo 3.1a)
Many of the wood sills at the bath houses are soft or rotted and some have been replaced with new pressure treated sills. Because these sills are in direct contact with the concrete deck, and continually exposed to moisture due to standing water, deterioration will be an ongoing issue. If the bath houses are to remain, it is recommended that an alternative detail be developed for the bath house sill plates, that elevates the wood sills above the concrete, and also allows the water to freely move off the deck.
3.2 Cracks in Cast in Place Ramp Beams and Slab
(Reference Photos 3.2a, 3.2b, and 3.2c)
As mentioned in Section 2.4, the general condition of the cast in place concrete ramps and slabs is not bad, but there are some areas that indicate early signs of deterioration. These areas should be addressed in the same way as described for the concrete piles/piers in the following section, by repairing and sealing all cracks with an epoxy concrete crack repair product, and then coating with a high quality concrete corrosion inhibitor.
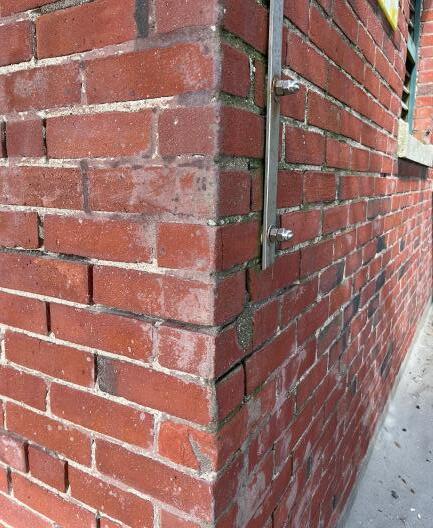
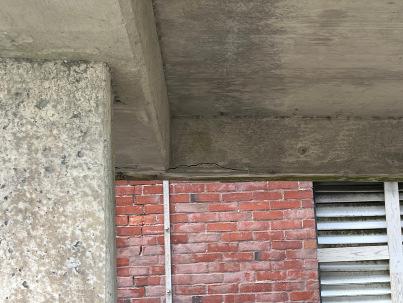
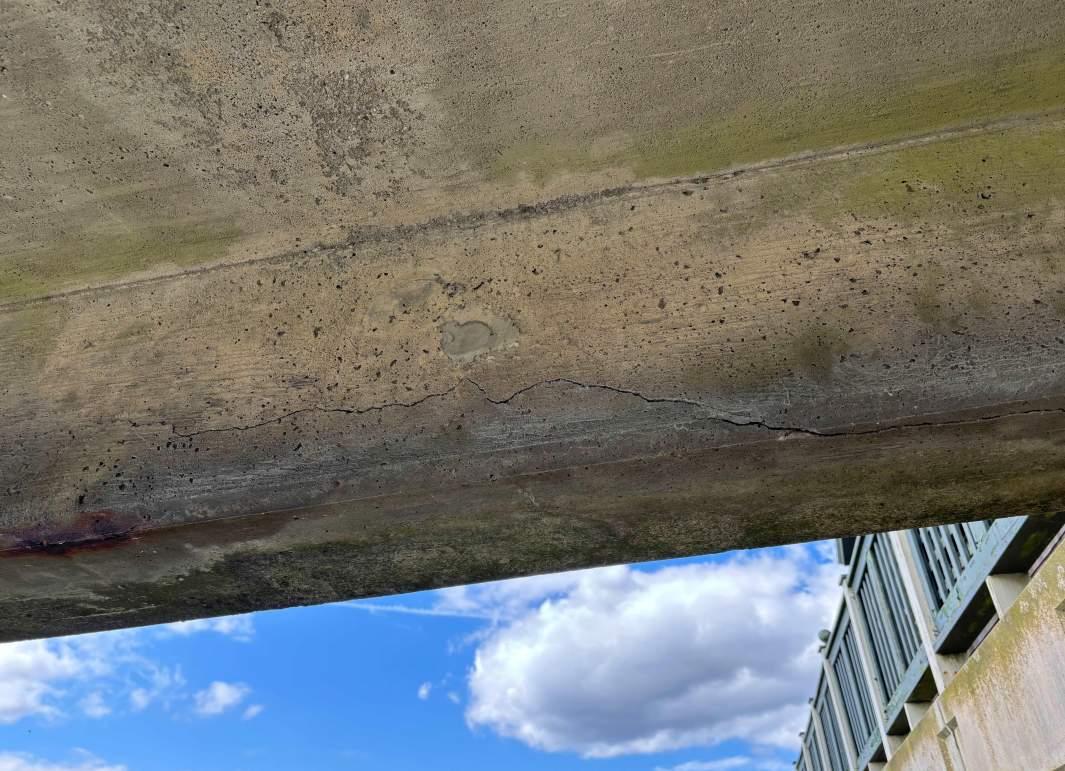
3.3 Cracks in Concrete Piles/Piers
(Reference Photos 3.3a)
There are numerous hairline cracks in many of the concrete piles/piers that support the elevated concrete deck. These small cracks can quickly grow into larger cracks as water is able to penetrate the pier and cause deterioration of the steel reinforcing. Cycles of freeze/thaw can also lead to localized spalling the concrete. All cracks should be repaired and sealed with a high quality, epoxy concrete crack repair product. Due to the harsh environment, it is also recommended that we coat all piers with a concrete corrosion inhibitor product. Sika makes several products that would be suitable for both types of repairs.
LIMITATIONS OF REPORT
The conclusions and recommendations contained in this report are based on observation of those structural items that were visible and reasonably accessible at the time of my visits. They are also based on conditions that existed at the time of my visit. Other than the general visual observation of typical structural conditions that was done during the walk through, no detailed survey, probing, or structural analysis was made of existing structural elements. Due to finished ceilings and walls in some of the spaces, some structural elements could not be directly observed.
3.2a
3.2c
3.3a
Supplemental Hazardous Building Materials Inspection Report
Easton’s Beach Building Complex – Phase 2
175 Memorial Boulevard
Newport, Rhode Island
DBVW Architects
Providence, Rhode Island
September 2025
September 23, 2025
Ms. Martha L Werenfels Senior Principal DBVW Architects
111 Chestnut Street
Providence, RI 02903
RE: Supplemental Hazardous Building Materials Inspection
Easton’s Beach Building Complex – Phase 2
175 Memorial Boulevard, Newport, Rhode Island
Fuss & O’Neill Reference No. 20060901.C10
Dear Ms. Werenfels:
Enclosed is the Supplemental Hazardous Building Materials Inspection Report for the inspection conducted at the Rotunda, Bathhouses, Restrooms, Parking Structure, and Sea Walls at the Easton Beach Building Complex located at 175 Memorial Boulevard in Newport, Rhode Island
On August 29, 2024, a Fuss & O’Neill, Inc. state-licensed Asbestos Inspector performed a limited, supplemental asbestos inspection, a visual lead-based paint screening, a fluorescent light ballast and mercury-containing equipment inventory, and a presumed polychlorinated biphenyl (PCB)-containing source building materials inventory prior to proposed renovation activities.
The information summarized in this report is solely for the abovementioned materials only. The work was performed in accordance with our written scope of services dated April 25, 2024
If you should have any questions regarding the contents of the enclosed report, please do not hesitate to contact me at 401-595-8270. Thank you for this opportunity to have served your environmental needs.
Sincerely,
Jonathan L. Hand Project Manager
Enclosure
1 Introduction
On August 29, 2024, Fuss & O’Neill, Inc. (Fuss & O’Neill) representative, Mr. Jon Hand, performed a supplemental hazardous building materials inspection at the Easton Beach Building Complex located at 175 Memorial Boulevard in Newport, Rhode Island (the “Site”).
A limited asbestos-containing materials inspection was previously conducted at the Site by Environmental Consulting & Management (ECM). Applicable information and findings from the Easton’s Beach Hazardous Material Survey prepared by ECM (November 2017) were utilized during this inspection.
1.1 Scope of Work
The work was performed for DBVW Architects (the “Client”) in accordance with our written scope of services dated April 25, 2024. This report is subject to the limitations presented in Appendix A.
The areas inspected as part of this phase of work included the Rotunda, Bathhouses, Restrooms, Parking Structure, and Sea Walls
• Fluorescent Light Ballast and Mercury-Containing Equipment Inventory; and
• Polychlorinated Biphenyl (PCB)-Containing Source Building Materials Visual Inventory.
Destructive investigations to access hidden and inaccessible areas were not conducted as part of the inspection. Hidden and inaccessible areas included, but were not limited to, wall cavities, pipe chases, spaces above fixed ceilings, underneath flooring, beneath/behind window and door systems, areas/voids behind exterior siding/facade.
Fuss & O’Neill did not conduct subsurface investigations to identify concealed suspect materials throughout the subject property.
We excluded collection and analysis of suspect materials for PCBs during this inspection. Sampling for PCBs is presently not mandated by the United States Environmental Protection Agency (EPA); however, significant liability risk for disposing of PCB-containing wastes exists. Recent knowledge of PCBs within these matrices has become more prevalent, especially with remediation contractors, waste haulers, and disposal facilities. Many property owners have become subject to large changes in schedule, scope, and costs as a result of failure to identify PCBs prior to renovation or demolition activities For the purpose of this inspection, potential PCBcontaining source building materials (as recommended by the EPA) have been presumed to contain regulated concentrations of PCBs.
2 Limited Asbestos Inspection
A property owner or operator must ensure that a thorough asbestos inspection is performed prior to possible disturbance of suspect ACM during renovation or demolition activities. This is a requirement of the EPA National Emission Standards for Hazardous Air Pollutants (NESHAP) regulation located at Title 40 CFR, Part 61, Subpart M.
On August 29, 2024, Mr. Hand of Fuss & O’Neill conducted the limited inspection of visible and accessible areas Mr. Hand is a State of Rhode Island Department of Health (RIDOH)-licensed Asbestos Inspector (AI00798). Refer to Appendix B for copies of the Asbestos Inspector's license and EPA accreditation
2.1 Methodology
The inspection was conducted by visually inspecting for suspect ACM and touching each of the suspect ACM The suspect ACM were grouped into three EPA NESHAP categories: Friable; Category I Non-Friable, and Category II Non-Friable.
• Friable is defined as material that contains greater than one percent (> 1%) asbestos that, when dry, can be crumbled, pulverized, or reduced to powder by hand pressure.
• Category I Non-Friable refers to material that contains > 1% asbestos (i.e., packings, gaskets, resilient floor coverings, and asphalt roofing products) that when dry cannot be crumbled, pulverized, or reduced to powder by hand pressure.
• Category II Non-Friable refers to any non-friable material excluding Category I materials that contain > 1% asbestos that when dry cannot be crumbled, pulverized, or reduced to powder by hand pressure.
The suspect ACM were also categorized into their applications including: Thermal System Insulation (TSI), Surfacing ACM, and Miscellaneous ACM. TSI includes those materials used to prevent heat loss/gain or water condensation on mechanical systems. Examples of TSI include, but are not limited to, pipe insulation, boiler insulation, duct insulation, mudded pipe fitting insulation, etc. Surfacing ACM includes those ACM that are sprayed-on, troweled-on, or otherwise applied to an existing surface. Surfacing ACM is commonly used for fireproofing, decorative, and acoustical applications. Miscellaneous ACM include those not listed as TSI or Surfacing ACM, such as sheet flooring, floor tiles, ceiling tiles, caulking, mastics, construction adhesives, etc.
The EPA recommends collecting suspect ACM samples in a manner sufficient to determine asbestos content and separating suspect ACM into homogenous material types (similar in color, texture, and date of application). The EPA NESHAP regulation does not specifically identify a minimum number of samples to be collected for each homogeneous material, but the NESHAP regulation does recommend the use of sampling protocols included in EPA Title 40 CFR, Part 763, Subpart E: Asbestos Hazard Emergency Response Act (AHERA).
The EPA AHERA regulation requires a specific number of samples be collected based on the material type and quantity present. This regulation includes the following protocol:
1. Surfacing Materials (e.g., plaster, spray-applied fireproofing, etc.) shall be collected in a randomly distributed manner representing each homogenous area based on the overall quantity as follows:
a. At least three (3) bulk samples collected from each homogenous area that is less than or equal to 1,000 square feet.
b. At least five (5) bulk samples collected from each homogenous area that is greater than 1,000 square feet but less than or equal to 5,000 square feet.
c. At least seven (7) bulk samples collected from each homogenous area that is greater than 5,000 square feet.
2. Thermal System Insulation (e.g., pipe insulation, tank insulation, etc.) shall be collected in a randomly distributed manner representing each homogenous area. At least three (3) bulk samples shall be collected of each homogenous material type. Also, at least one (1) bulk sample of any patching material applied to TSI, presuming the patched area is less than six linear or square feet, shall be collected.
3. Miscellaneous Materials (e.g., floor tile, mastic, cement board, caulking, glazing, etc.) should have at least two (2) bulk samples collected of each homogenous material type. Sample collection shall be conducted in a manner sufficient to determine the asbestos content of the homogenous material type as determined by the inspector.
Suspect ACM samples were collected, and proper chain-of-custody forms were prepared for transmission of collected samples to EMSL Analytical, Inc. (EMSL), for analysis. EMSL is a State of Rhode Island-licensed and American Industrial Hygiene Association (AIHA)-accredited Asbestos Analytical Laboratory. Initial asbestos sample analysis was conducted using the EPA Interim Method for the Determination of Asbestos in Bulk Building Materials (EPA/600/R-93/116) via Polarized Light Microscopy with Dispersion Staining (PLM/DS). Analysis was stopped upon receipt of the first positive asbestos result of each different suspect homogenous material type.
2.2 Results
The EPA, the Occupational Safety and Health Administration (OSHA), and the RIDOH define a material that contains > 1% asbestos (by PLM/DS analysis) as an ACM.
The samples collected of suspect ACM during this inspection were reported by EMSL to be “None Detected” (i.e., non-ACM). The previous report from ECM did identify one square foot (1 SF) of pipe penetration sealant through a wall in the Rotunda basement that was determined to be an ACM and was observed to be present in the previous inspection conducted by us in October 2023
Refer to Appendix C for the asbestos laboratory analytical report and chain-of-custody form from this inspection
2.3 Conclusions & Recommendations
Based on previous reports, visual observations, sample collection, and laboratory analysis, an ACM was identified within the Rotunda at the Site The previous report by ECM does reference one square foot (1 SF) of pipe penetration sealant through a wall in the Rotunda basement that was determined to be an ACM and was observed to be present in the previous inspection conducted by us in October 2023. ECM also notes windows and doorlites associated with the Aquarium area on the Rotunda first floor containing trace amounts of asbestos; this material does not meet the definition of an ACM however
If newly identified suspect materials are encountered during renovation/demolition activities that are not included in this or other reports as being non-ACM, they shall be assumed to be ACM until laboratory analysis indicates otherwise.
This report is not intended to be utilized as a bidding or a project specification document. This report is designed to aid the building owner, architect, construction manager, general contractor(s), and asbestos abatement contractor(s) in locating ACM and ACWM.
3 Lead-Based Paint Screening
On August 29, 2024, Mr. Hand of Fuss & O’Neill performed a visual lead-based paint (LBP) assessment associated with painted building components at the Site buildings that may be disturbed during renovation/demolition activities. The screening was conducted in accordance with generally accepted industry standards for non-residential (i.e., not child-occupied) buildings.
3.1 Discussion
OSHA published a Lead in Construction Standard (OSHA Lead Standard) Title 29 CFR, Part 1926.62 in May of 1993. This Standard sets no limit for the content of lead in paint below which the OSHA standards do not apply. The OSHA Lead Standards are task-based and are also based on airborne exposures and blood lead levels.
The results of this LBP screening are intended to provide guidance to contractors for occupational lead exposure controls. Building components coated with lead levels above industry standards may cause exposures to lead above OSHA standards during proposed demolition/renovation activities. The results of this screening are also intended to provide insight into waste disposal requirements, in accordance with EPA RCRA regulations.
3.2 Conclusions & Recommendations
Fuss & O’Neill observed and/or identified the following:
• Based on the age of construction of the Rotunda and the previous lead testing results, LBP was identified and is presumed to be present on coated/painted building components.
• Based on the age of construction of the new Bathhouses/covered parking and the previous lead testing results, LBP was not identified on coated/painted building components.
• The Sea Wall was not coated or painted
Contractors must be made aware that OSHA has not established a level of lead in a material below which OSHA Title 29 CFR, Part 1926.62 does not apply. Contractors shall comply with exposure assessment criteria, interim worker protection, and other requirements of the regulation as necessary to protect workers during any renovation and/or demolition activities that will impact LBP.
Based on the LBP assessment results summarized herein, a TCLP sample to characterize the expected waste that may result from possible selective demolition/renovation activities should be conducted by the Contractor prior to disposal. If disturbed and managed off-site, non-porous LBP-coated building materials (i.e., metals) may be segregated and recycled as scrap metal.
The buildings are not considered a “child-occupied facility” and therefore, they are not subject to lead safe renovation requirements.
The buildings are presently characterized as a commercial property, which is not subject to the RIDOH Childhood Lead Poisoning Prevention Program (CLPPP) Regulation. The Site may be renovated using procedures required in accordance with OSHA Title 29 CFR, Part 1926.62.
Note that the information contained in this report concerning the presence or absence of lead in paint, does not constitute a comprehensive lead inspection in accordance with RIDOH CLPPP regulations. The screened painted surfaces represent only a portion of those surfaces that would be screened to determine whether the premises are in compliance with the aforementioned regulations, which are specific to a child-occupied residence only, and not applicable to buildings of this type and current use.
Fluorescent light ballasts manufactured prior to 1979 may contain capacitors that contain PCBs. Light ballasts installed as late as 1985 may contain PCB capacitors. Fluorescent light ballasts that are not labeled as “No PCBs” must be assumed to contain PCBs unless proven otherwise by quantitative analysis. Capacitors in fluorescent light ballasts labeled as non-PCB-containing may contain diethylhexyl phthalate (DEHP). DEHP was the primary substitute to replace PCBs for small capacitors in fluorescent lighting ballasts in use until 1991. DEHP is a toxic substance, a suspected carcinogen, and is listed under RCRA and the Superfund Law as a hazardous waste. Therefore, Superfund liability exists for landfilling both PCB- and DEHP-containing light ballasts. These listed materials are considered hazardous waste under RCRA and require special handling and disposal considerations.
4.2 Mercury-Containing Equipment
Fluorescent lamps/tubes are presumed to contain mercury vapor, which is a hazardous substance to both human health and the environment. Thermostatic controls and electrical switch gear may contain a vial or bulb of liquid mercury associated with the control. Mercury-containing equipment is regulated for proper disposal by EPA RCRA regulations.
4.3 Results
On August 29, 2024, Mr. Hand of Fuss & O’Neill performed a visual inspection of representative fluorescent light fixtures to identify possible PCB-containing ballasts in the Site buildings. The inspection involved visually inspecting labels on representative light ballasts to identify manufacture dates and labels indicating “No PCBs”. Ballasts manufactured after 1991 were not listed as PCB- or DEHP-containing ballasts and were not quantified for disposal. An inventory of the fluorescent lamps/tubes and other mercury-containing equipment was completed concurrently. Refer to Table 1, attached, for an inventory of fluorescent light ballast and mercury-containing equipment identified during the inspection.
4.4 Conclusions and Recommendations
DEHP-containing fluorescent light ballasts and mercury-containing equipment were identified in the Restrooms and Rotunda during this inspection.
Fluorescent light ballasts marked as “No PCBs” with date labels indicating manufacture prior to 1991 are presumed to contain DEHP. DEHP-containing ballasts must be segregated for proper packaging, transporting, and disposal as non-PCB hazardous waste. Note that disposal requirements for DEHP-containing ballasts are slightly varied, and disposal costs are slightly less, when compared to PCB-containing light ballasts.
According to the EPA, mercury-containing equipment is characterized as a hazardous waste and mercury lamps/tubes are characterized as a Universal Waste. The mercury-containing equipment and fluorescent lamps/tubes identified in the proposed renovation areas must be recycled, reclaimed, or disposed of as hazardous waste or Universal Waste prior to disturbance.
5 Presumed Polychlorinated Biphenyls (PCB)-Containing Source Building Materials
5.1 Background
On August 29, 2024, Mr. Hand of Fuss & O’Neill completed a presumed PCB-containing source building materials inventory.
Sample collection and analysis of building materials for PCBs is presently not mandated by the EPA. However, significant liability risk exists for improperly disposing of PCB-containing waste materials. Recent knowledge and awareness of PCBs within matrices such as caulking, glazing compounds, paints, adhesives, and ceiling tiles has become more prevalent, especially among remediation contractors, waste haulers, and disposal facilities. The EPA recommends sample collection and analysis of caulking and glazing compounds installed between 1950 and 1980 to determine PCB concentration.
The EPA requirements apply and require removal of PCBs once identified, regardless of project intent as an unauthorized use of PCBs. Once it is determined that PCBs are present and a building is to remain in use, the EPA still requires PCB-containing material removal. If PCBs are present at certain concentrations, additional sampling and analysis of adjacent surfaces in contact with PCB sources, or which may have been contaminated from a source of PCBs (e.g., masonry, soil), must also be performed or remediated.
EPA requirements apply only if PCBs are present in concentrations above a specified level. Presently, PCBcontaining materials at concentrations equal to or greater than (≥) 50 part per million (ppm), or equivalent units of milligrams per kilogram (mg/kg), are regulated. Note materials containing ≥ 1, ppm but less than (<) 50 ppm may also be regulated unless proven to be an “Excluded PCB Product”. The definition of an Excluded PCB Product includes those products, or source of the products, containing < 50 ppm concentration PCBs that were legally manufactured, processed, distributed in commerce, or used before October 1, 1984.
5.2 Conclusions & Recommendations
The newer aluminum window frames at the second floor of the Rotunda were reportedly installed after the EPA cut-off date of January 1, 1980, according to on-site personnel. Therefore, the associated window caulking is presumed to be a non-PCB-containing (source) material in accordance with EPA guidance documents
The Bathhouses and related structures were reportedly constructed in 1993; after the EPA cut-off date of January 1, 1980. Therefore, the associated caulking/glazing compounds are presumed to be non-PCB-containing (source) material in accordance with EPA guidance documents.
The Seawall/Boardwalk caulking were reportedly installed after the EPA cut-off date of January 1, 1980, according to on-site personnel. Therefore, they are presumed to be non-PCB-containing (source) material in accordance with EPA guidance documents.
Identified materials should be presumed to contain regulated concentrations (≥ 50 ppm) of PCBs until sample analysis indicates otherwise. These materials should be removed and disposed of at an EPA-approved facility as regulated PCB Bulk Product Waste
1. This environmental report has been prepared for the exclusive use of the Client, and is subject to, and is issued in connection with, the general terms and conditions of the original Agreement (April 25, 2024) and all of its provisions. Any use or reliance upon information provided in this report, without the specific written authorization of the Client and Fuss & O’Neill, shall be at the User’s individual risk. This report should not be used as an abatement specification. All quantities of materials identified during this inspection are approximate.
2. Fuss & O’Neill has obtained and relied upon laboratory analytical results in conducting the inspection. This information was used to form conclusions regarding the types and quantities of ACM that must be managed (if applicable) prior to renovation or demolition activities that may disturb these materials at the subject property(ies) Fuss & O’Neill has not performed an independent review of the reliability of this laboratory data.
3. Unless otherwise noted, only suspect hazardous building materials associated within or located on the building (aboveground) were included in this inspection. Suspect hazardous building materials may exist below the ground surfaces that were not included in the scope of work of this inspection. Fuss & O’Neill cannot guarantee all asbestos or suspect hazardous building materials were identified within the areas included in the scope of work. Only visible and accessible areas were included in the scope of work for this inspection.
4. The findings, observations, and conclusions presented in this report are limited by the scope of services outlined in our original Agreement, which reflects schedule and budgetary constraints imposed by the Client. Furthermore, the assessment has been conducted in accordance with generally accepted environmental practices. No other warranty, expressed or implied, is made.
5. The conclusions presented in this report are based solely upon information gathered by Fuss & O’Neill to date. Should further environmental or other relevant information be discovered at a later date, the Client should immediately bring the information to Fuss & O’Neill’s attention. Based upon an evaluation and assessment of relevant information, Fuss & O’Neill may modify the report and its conclusions.
6. Fuss & O’Neill has obtained and relied upon information from multiple sources to form certain conclusions regarding likely environmental issues at and in the vicinity of the subject property in conducting this inspection. Except as otherwise noted, no attempt has been made to verify the accuracy or completeness of such information or verify compliance by any party with federal, state or local laws or regulations.
Asbestos Laboratory Analytical Report & Chain-of-Custody Form
August 27, 2025
Ms. Martha L Werenfels Senior Principal
DBVW Architects
111 Chestnut Street
Providence, RI 02903
RE: Hazardous Building Materials Opinion of Abatement Costs
Easton's Beach Building Complex - Phase 2
175 Memorial Boulevard, Newport, Rhode Island Fuss & O’Neill Reference No. 20060901.C10
Dear Ms. Werenfels:
Fuss & O’Neill, Inc. has prepared the hazardous building materials opinion of abatement cost provided below for the Rotunda, Bathhouses, Restrooms, Parking Structure, and Sea Walls at the abovementioned site. These cost opinions are based on our Supplemental Hazardous Building Materials Inspection report prepared for the Site, dated August 2025. Unit costs are based on current industry rates and are inclusive of typical contractor costs for a normal work schedule (1 shift/day), Monday to Friday. They do not include costs for an expedited work schedule (double shifts/ weekends/ holidays), project design, construction monitoring, air sampling, and other consultant-based fees. Estimated unit costs are based on assumption that listed materials will be removed, disposed of, and transported by the abatement contractor during one phase.
Lighting Ballast, Fluorescent Lamp, and Mercury-Containing Equipment Disposal
Paint Work Practices & Limited Disposal
Contingency
not include consultant fees
Sincerely,
Jonathan L. Hand Project Manager
EASTON’S BEACH, NEWPORT
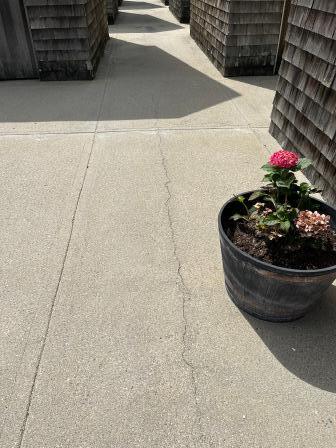
Bath Houses: Preliminary Scope of Work (For Order of Magnitude Pricing) 9-16-25 (rev.)
Overview: The City of Newport is interested in evaluating keeping the bath houses versus eliminating them altogether. To keep the bath houses, they will have to be completely rebuilt because the concrete deck they sit on is not pitched property. An order-ofmagnitude estimate of the cost to rebuild the bath houses, restroom building, and picnic pavilion should be based on the assumptions below. See attached plan and photos.
General
VE Zone: Replacement buildings will be constructed within a VE Zone and must be constructed according to applicable codes and requirements.
Concrete Platform (18,000 sf)
The concrete platform on which the bath houses are constructed must be repitched for proper drainage. Include the addition of a concrete topping slab over the existing concrete platform.
Bath Houses
1. Configuration: Existing configuration and overall design will be duplicated. There are 10 small buildings with ten units each, and 7 larger buildings with 18 units each (see attached plan). The small buildings are 260 sf each and the larger buildings are 460 sf each.
2. Utilities: There are no utilities existing and none will be added (no water, electricity, etc.).
3. Foundation: Existing concrete platform will remain and will be properly pitched for drainage (see above). Bath houses will sit atop concrete platform, similar to existing.
4. Framing: Wood framing similar to existing. PT wood for all sills.
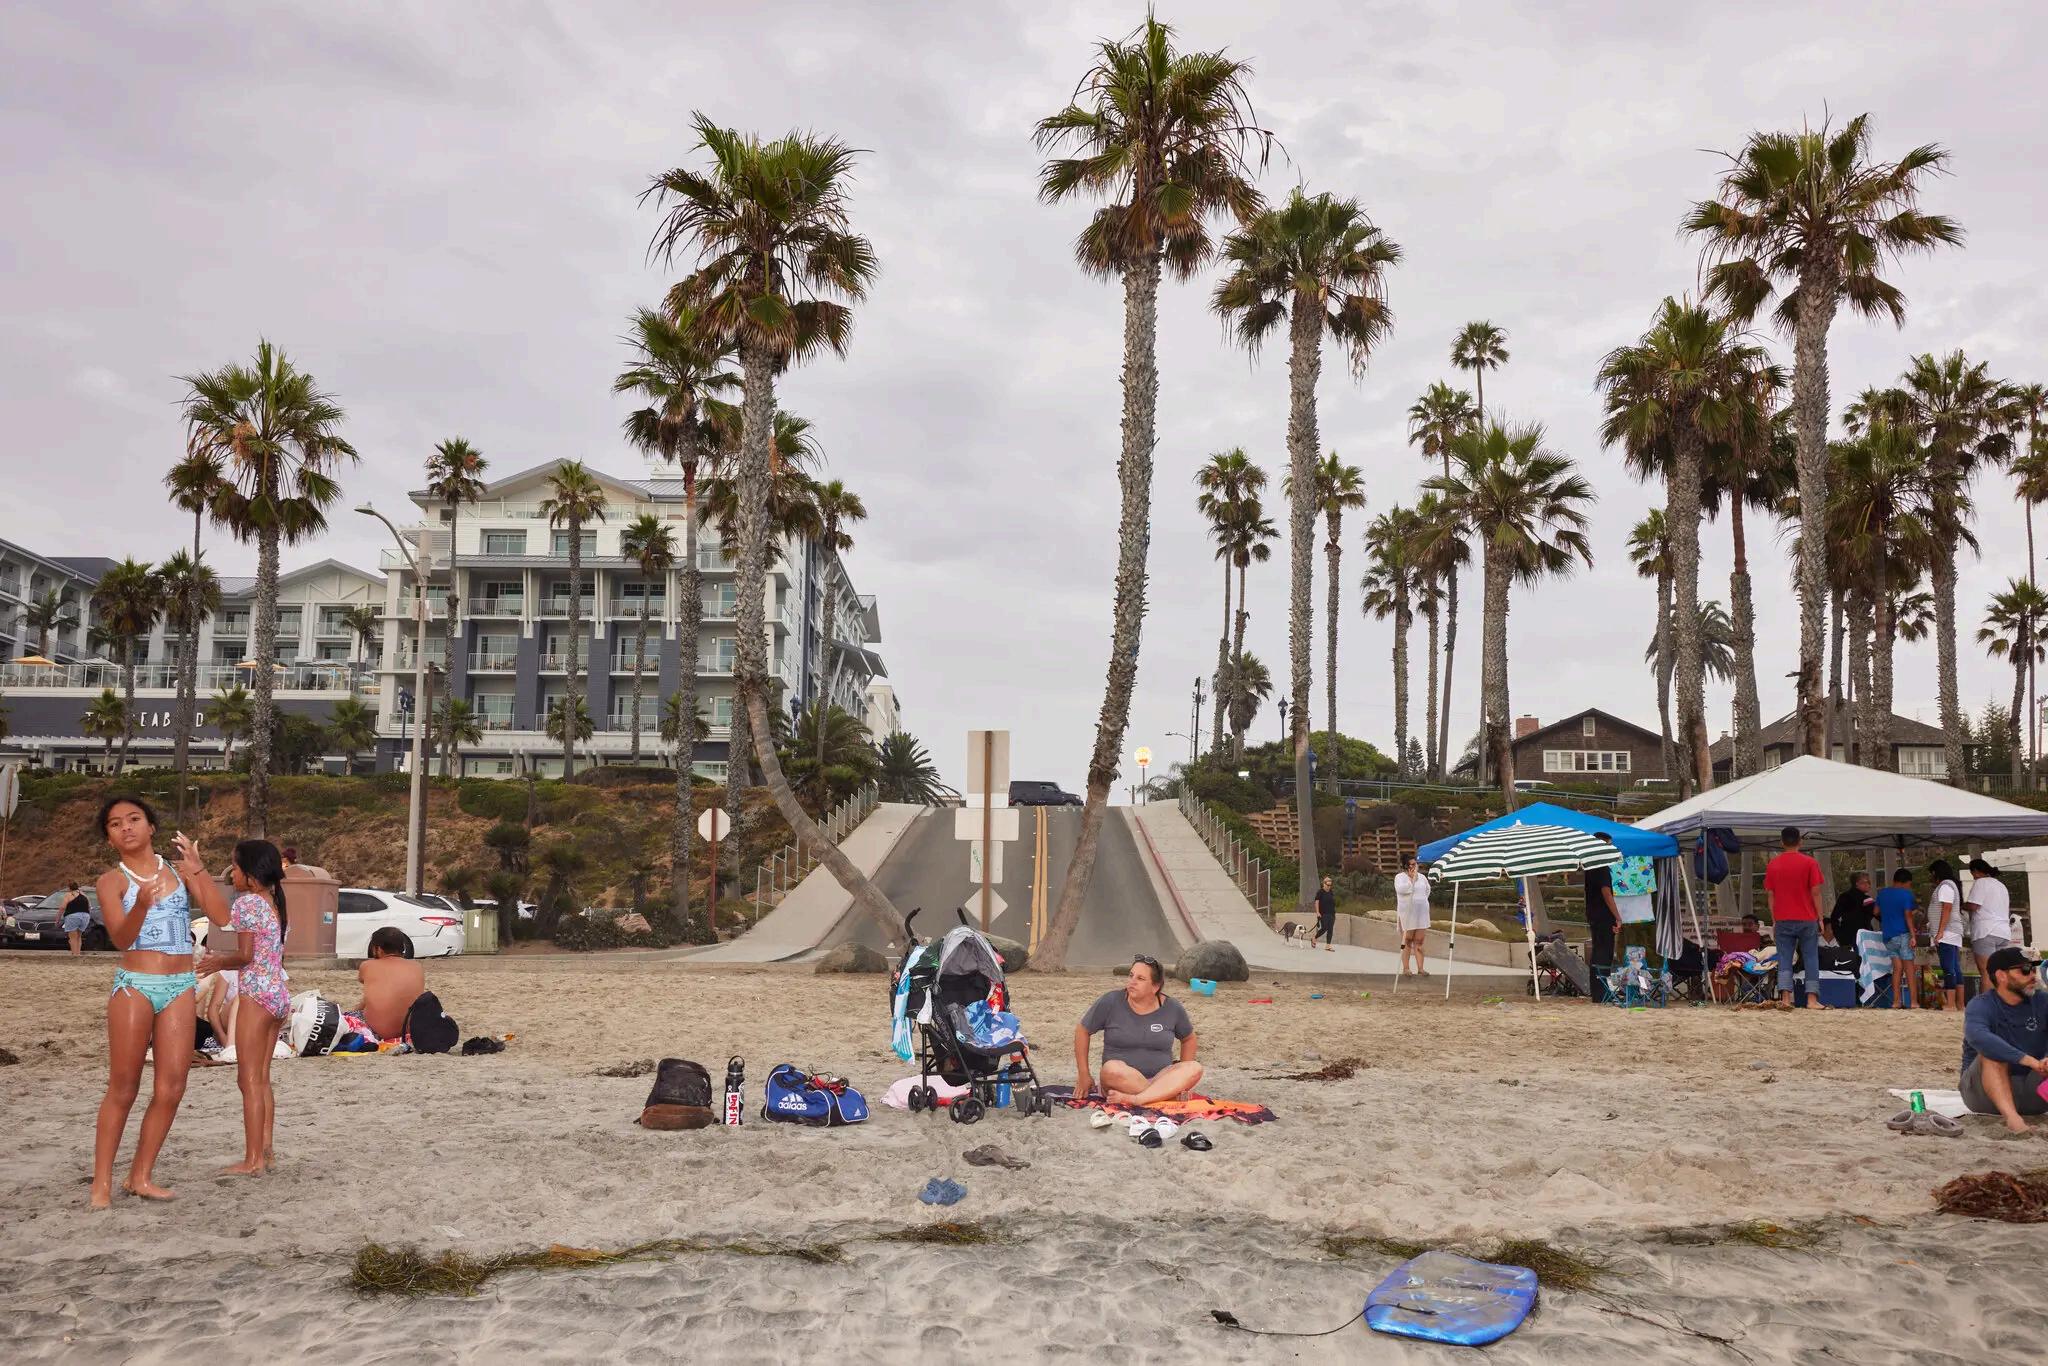
Sea-level rise and man-made projects have left Oceanside with precious little beach space. Thatʼs a problem if coastal life is part of your cityʼs identity. A California Beach Town Is Desperate to Save Its Vanishing Sand
WHY WEʼRE HERE
Weʼre exploring how America defines itself one place at a time. In this Southern California town, residents are grappling with the fear that their way of life may be fleeting.
By Jill Cowan Photographs by Maggie Shannon
Reporting from Oceanside, Calif.
Sept. 2, 2023
In Oceanside, a coastal suburb about 40 miles north of San Diego, the palm trees sway and the temperature is almost always perfect. Fishermen cast their lines from the long, wooden pier. Teenagers with salt-bleached hair watch surfers ride
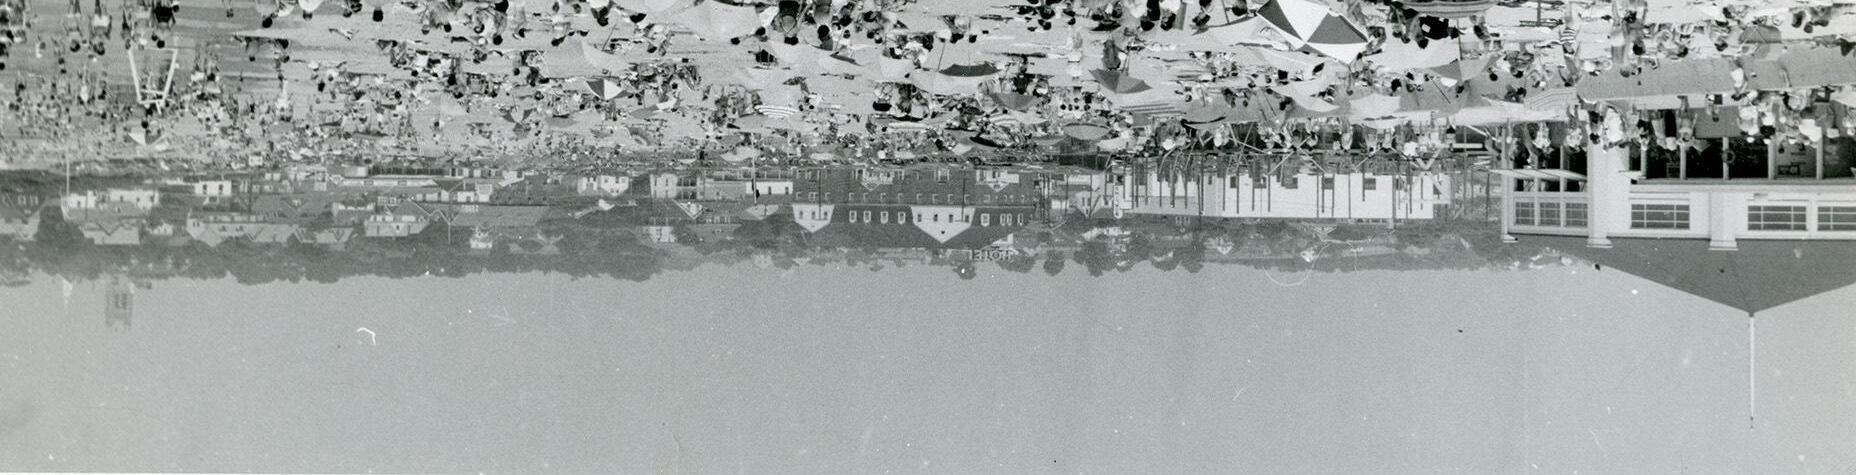
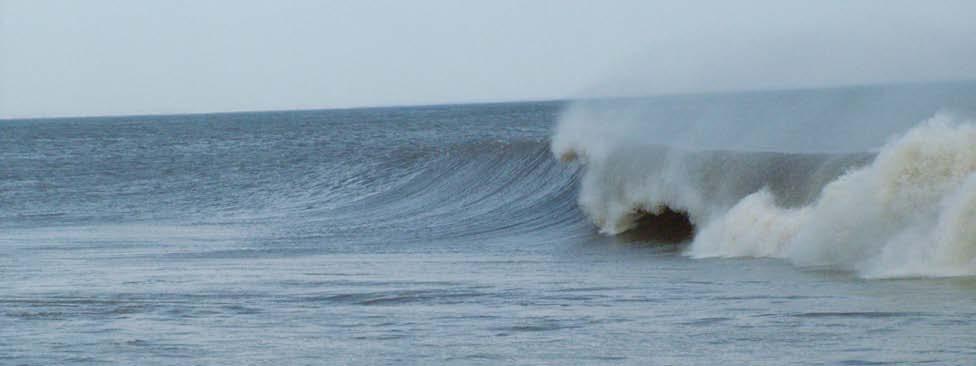
Waves crash along the coast in Oceanside, Calif.
glassy waves.
“Every day here feels like the most perfect summer day,” Mercedes Murray, 38, said as she lounged at Buccaneer Beach, a spot popular among locals.
There is just one problem: The sand is disappearing.
Where residents once played beach volleyball at Buccaneer, there are now berms of natural cobblestones that clatter around in the surf like pennies in a washing machine. Visitors who could once sprawl on wide stretches of sand near the pier must now compete for space on a narrow stretch studded with rocks.
A beach town cannot exist without a beach, and only about a third of the city’s 3.7 miles of coastline still has enough sand for people to enjoy. That’s a problem for a city that once beckoned tourists with the slogan, “Tan Your Hide in Oceanside,” and hosts several high-profile surf competitions.
Visitors can no longer sprawl on wide stretches of sand in Oceanside.
Leaders here are now rushing to reimagine the shoreline in hopes that Oceanside can transform itself into a new kind of California beach town before it is too late.
While many visitors, and even lifelong Californians, might see the state’s wide expanses of sand as part of the state’s natural beauty, the reality is that over decades, the coast has become a highly engineered marvel.
Millions of cubic yards of sand dredged from other parts of the coast or offshore sandbars known as “borrow sites” were added over decades in the last century to build postcard-worthy beaches like the one in Santa Monica. In Newport Beach and Ventura, narrow rock walls called jetties were installed decades ago to combat erosion and help keep those beaches replenished.
But a range of forces have conspired to pinch beaches all along California’s coastline. A recent study predicted that California could lose as much as 75 percent of its beaches by 2100, given projected sea level rise related to climate change.
Over time, beach sand gets swept out into the water. Some of it migrates toward other beaches in part of a complex phenomenon known as littoral drift.
If the shoreline were allowed to evolve and recede without human intervention, beaches could continue to exist as we know them. But in California, development in many places along the coast has created a hard barrier, stopping that natural ebb.
Visitors who could once sprawl on wide stretches of sand near the pier must now compete for space on a narrow stretch studded with rocks.
Over time, the boat basin and the harbor, protected by a network of rock jetties, began to stop sand from reaching the city’s beaches.
The U.S. Army Corps of Engineers dredges the mouth of the city harbor every year. It costs the city an additional $600,000 to pump thin, silty sediment from the San Luis Rey River onto beaches just south. But the effort typically yields just enough sand to cover a small area, and it is quickly swept away.
Other communities in San Diego County were contending with the same problem, so over the years, local governments banded together on a few major sand replenishment projects. But those, too, have proven to be fleeting solutions.
In recent years, as the sand’s disappearance grew more extreme, longtime Oceanside residents banded together to form Save Oceanside Sand, or S.O.S., and began lobbying their elected leaders.
Tell Us About Where You Live
We're exploring the U.S. one place at a time. What's a distinct place, activity or tradition that defines your corner of the world?*
Tell us about something that's unique to your corner of America, whether it's a special slice of history or the beloved neighborhood restaurant that feels like home
0 words
Oceanside residents have said they felt that wealthier cities were, in essence, hoarding access to the beach. Unlike nearby towns, where median home prices hover around $1 million, homes in Oceanside have prices around $570,000, according to recent census data, and are still relatively affordable to military families and working-class households.
They framed their sand plight as a class issue that beaches should not only be preserved for the wealthy and argued that Oceanside is more accessible for beach tourists who cannot afford tonier destinations.
“It’s not La Jolla,” Rick Diaz, 67, said, referring to the ritzy enclave in San Diego. “We don’t need that.”
A recent study predicted that California could lose as much as 75 percent of its beaches by 2100, given projected sea level rise related to climate change.
He sat near Oceanside’s pier during an annual weeklong visit with friends and family to escape the inland heat of San Bernardino.
In May 2022, the city hired Jayme Timberlake as its first coastal zone administrator. Ms. Timberlake, a native of the region who surfs as many mornings as she can and ferries her two children to junior lifeguard lessons, said she saw the moment as an opportunity.
She launched an international design competition aimed at finding new ways of getting and keeping sand on the city’s beaches. The solutions, she emphasized, could be quickly adapted to address changing conditions.
“It’s really a race,” she said. “We really need to get something going and implemented before there is too much sea level rise or too many storms that have a catastrophic impact on the shoreline.”
The city solicited submissions from 36 firms and in August narrowed the competitors to three teams.
At a community meeting on Tuesday, residents packed into Oceanside’s City Council chambers to listen as representatives from the teams presented their ideas for the first time.
Deltares, a Dutch firm leading one entrant, showed images of floating islands, built over the water, with kelp forests flourishing below them. Scape, an American landscape architecture firm, suggested creating a dune system that would use the natural cobblestones as a kind of anchor for sand. International Coastal Management, an engineering firm from Australia, pitched an offshore artificial reef to collect sand, similar to one it built off the Gold Coast there.
But ultimately, Oceanside and other coastal cities may have to accept that wide sandy beaches will no longer be a part of their future, said Gary Griggs, a professor specializing in coastal science at the University of California, Santa Cruz, who is serving as an adviser for the competition.
“I think we have to face the reality that in the long run there’s absolutely nothing we can do to hold back the Pacific Ocean,” he said. “Everything we do is short term.”
Jill Cowan is a Los Angeles-based reporter for the National desk covering California. More about Jill Cowan
A version of this article appears in print on , Section A, Page 12 of the New York edition with the headline: A Beach Town Grieves as Its Beach Washes Out to Sea
Sand Nourishment and Retention Pilot Project
RE:BEACH Oceanside Update:
01/04/2024: RE:BEACH is a Coastal Resilience Design Competition that brought together three design teams from around the world to develop innovative sand retention pilot projects for the City of Oceanside.
Following the third and final Public Workshop for the RE:BEACH project, a Jury/Advisory Panel comprised of a diverse group of coastal scientists, community leaders and regional representatives recently met to evaluate proposals from three international Design Team finalists.
The RE:BEACH Jury expressed their unanimous support of a preferred alternative, International Coastal Management’s “Living Speed Bumps” concept. The “Living Speed Bumps” concept includes the construction of two small headlands that will aim to stabilize sand on the back beach, with an offshore artificial reef aimed at slowing down nearshore erosive forces. ICM, based in Australia’s Gold Coast, has decades of experience implementing “speed bumps” on their own coastline, bringing forward a new concept for Oceanside’s coast, but with a proven track record of success on the East Coast of Australia. Learn more
Background:
The City of Oceanside understands the importance of sandy beaches for the protection of coastal infrastructure, recreation, and the local economy.
In 2021, a year-long study (Phase 1) was completed to identify feasible solutions to protect the beach from long-term erosion. Since the completion of the Feasibility Study in 2021, the City has been gathering information through public outreach efforts and meetings with cities within our regional littoral cell, or sediment transport zone. Several consistent concerns relating to downcoast erosion were noted, as well as recommendations to pilot a more innovative engineering solution to retention than traditional groins.
On January 25, 2023, the City Council reviewed and approved a Professional Services Agreement for Phase 2 of the Sand Nourishment and Retention Pilot Project , with GHD Inc. For further information on the Sand Nourishment and Retention Pilot project, please see, A Coastal Resilience Design Competition, Design Brief
In the next phase of the project (Phase 2), the City will further define our replenishment and retention options, with the first order of business being to locate a local sand source or decipher a method of consistent sand delivery from around the Camp Pendleton Boat Basin. This is crucial to the project; retention of any sort can only be done if we can determine a dedicated sand source that will add sand to the littoral cell. We intend to use the results of our sand investigation and our new Sand Compatibility Opportunistic Use Program permits to provide immediate relief to our shoreline while working out design features for maintaining the sand
Additionally in Phase 2, a conceptual designs for a hybrid approache to sand retention was developed through RE:BEACH Oceanside, an international design competition which began in June 2023 and will continue through January 2024. Three public workshops were held to inform the community about the conceptual designs and gather public input on the options being proposed. The conceptual designs are online at www.rebeach.org or see each team's final concept slides below:
Team SCAPE
Team MVRDV / Deltares
Team ICM
A
summary of public comments gathered thus far is available here: ReBeach Community Workshops Summary.pdf
Next Steps
A Jury has now considered each RE:BEACH competition project and selected a recommended design. The RE:BEACH Jury expressed their unanimous support of International Coastal Management’s “Living Speed Bumps” concept. The “Living Speed Bumps” concept includes the construction of two small headlands that will aim to stabilize sand on the back beach, with an offshore artificial reef aimed at slowing down nearshore erosive forces. ICM, based in Australia’s Gold Coast, has decades of experience implementing “speed bumps” on their own coastline, bringing forward a new concept for Oceanside’s coast, but with a proven track record of success on the East Coast of Australia. More information
Coupled with public feedback received throughout the RE:BEACH process, the Project Team and City staff will present the winning concept and recommended modifications to Oceanside City Council for approval at a public workshop at City Hall on January 31, 2024, at 5:30 p.m. All are welcome!
For background information on the Sand Nourishment and Retention Pilot Project, see:
City of Oceanside Feasibility Staff Report
Phase 1 Public Workshop - September 15, 2020
Phase 1 Public Workshop - June 30, 2021
Phase 1 Poll - September 15
Phase 1 Poll - June 30
New
New Jersey Coastal Community Resilience Demonstration Project Report
Ida Leigh Wood, Jenny Tirrito and Mariana Leckner
Project Partners
New Jersey Sea Grant Consortium (PI) Peter Rowe: prowe@njseagrant.org
Jenny Tirrito
New Jersey Department of Environmental Protection, Office of Coastal Management
Dorina Frizzera: dorina.frizzera@dep.state.nj.us
Ida Leigh Wood (NOAA Coastal Management Fellow)
Monmouth University, Urban Coast Institute
Tony MacDonald: amacdona@monmouth.edu
Mariana Leckner: mariana@lecknerconsulting.com
Stevens Institute of Technology
Jon Miller (NJSGC Coastal Processes Specialist): jmiller@stevens.edu
Acknowledgements
This publication is the result of work sponsored by New Jersey Sea Grant with funds from the National Oceanic and Atmospheric Administration (NOAA) Office of Sea Grant, U.S. Department of Commerce, under NOAA grant number NA10OAR4170075 and New Jersey Sea Grant Consortium. The statements, findings, conclusions, and recommendations are those of the author(s) and do not necessarily reflect the views of New Jersey Sea Grant or the U.S Department of Commerce. NJSG-10-787.
Images: Ida Leigh Wood, Jenny Tirrito and Brian Harris
Map
Map
of Maps
Map
Map
Map
Map
Map
Map
Introduction
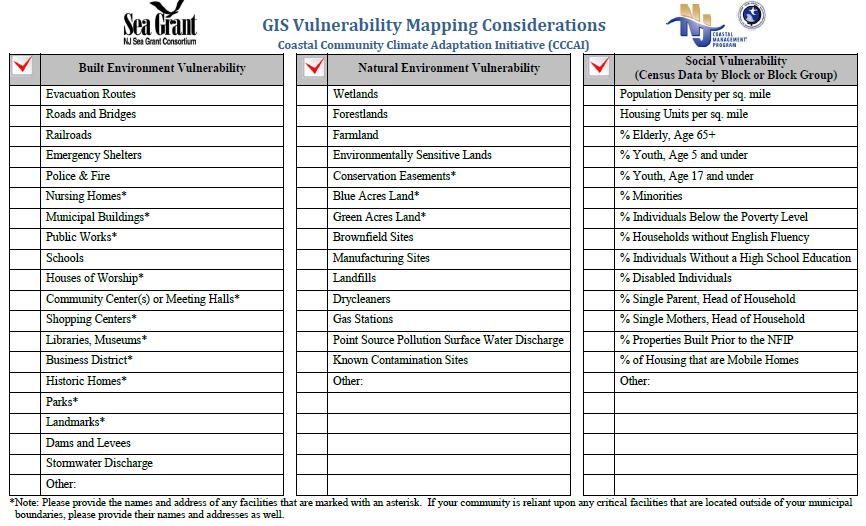
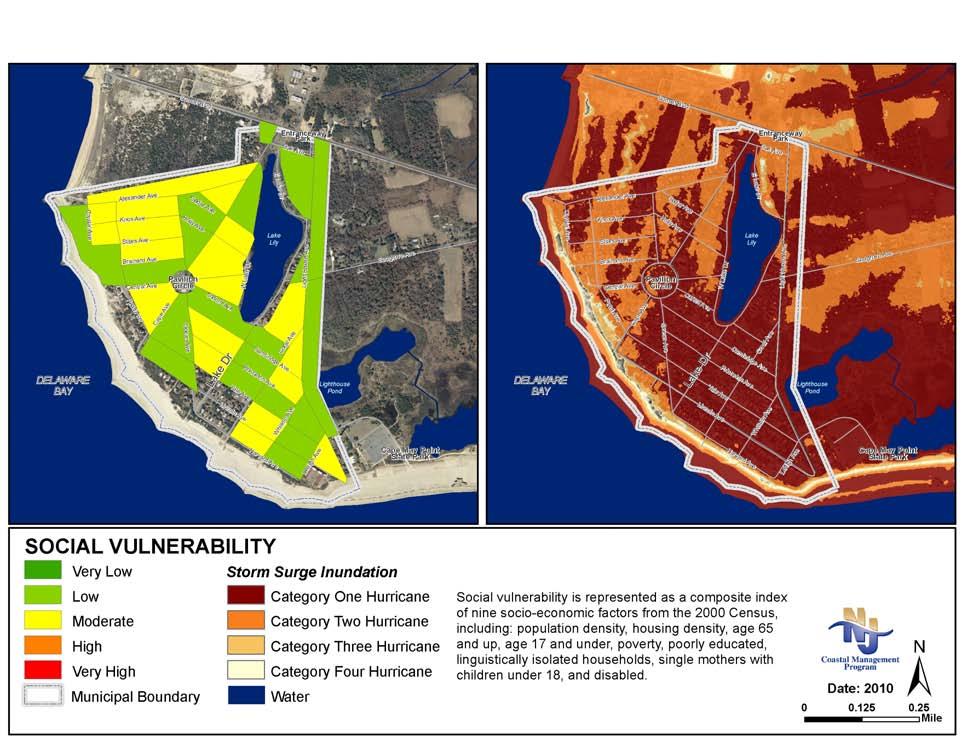
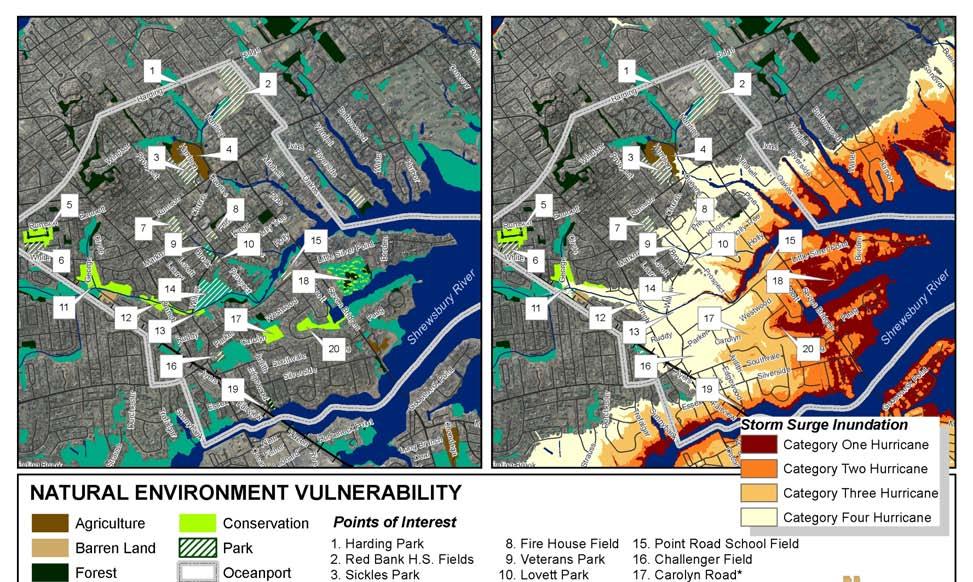
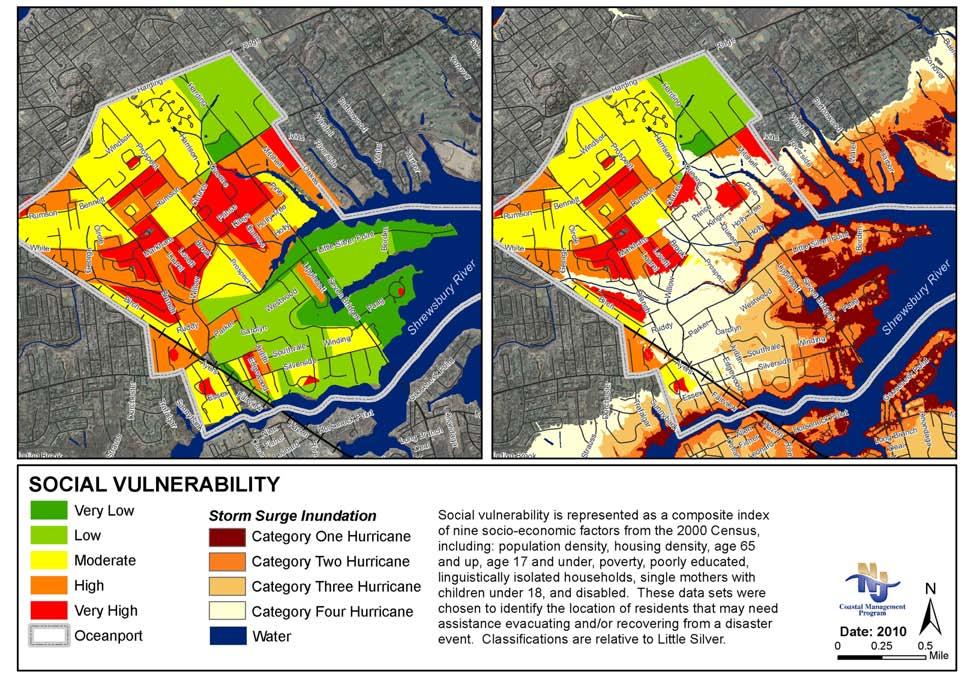
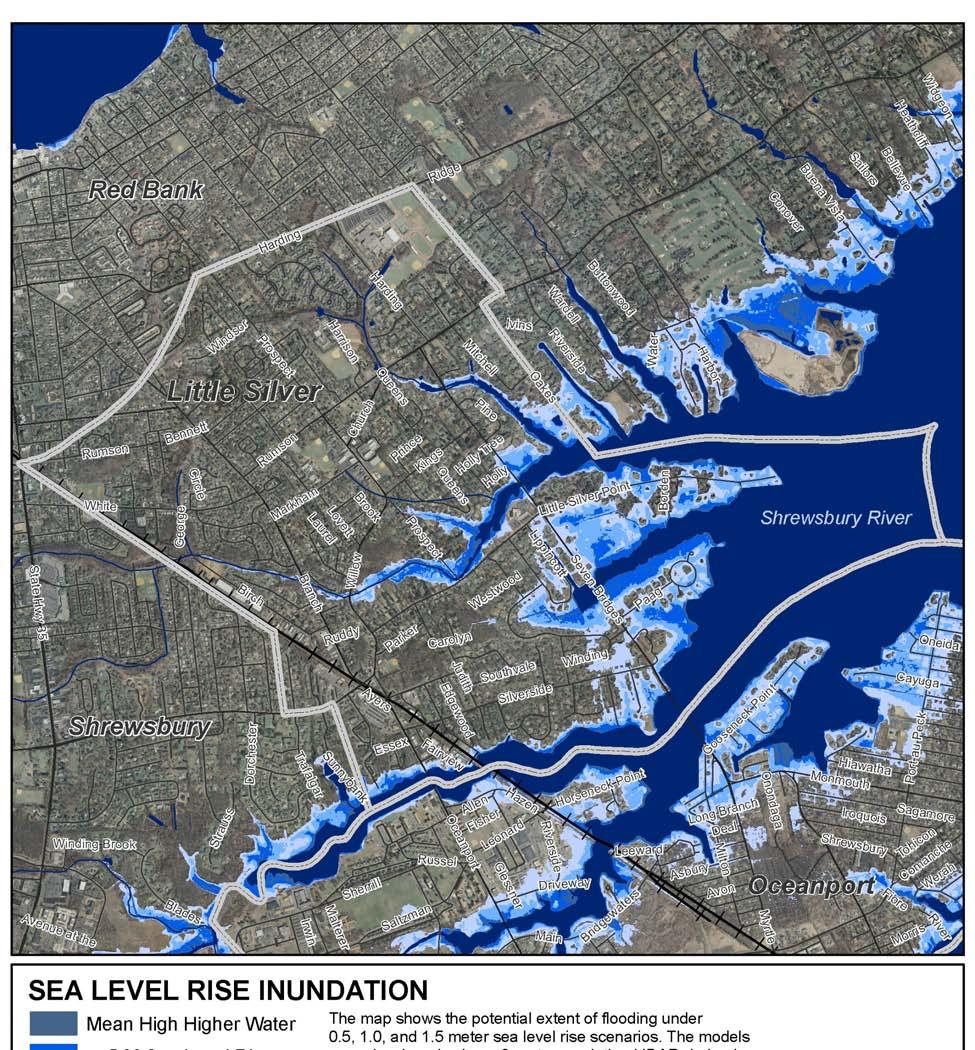
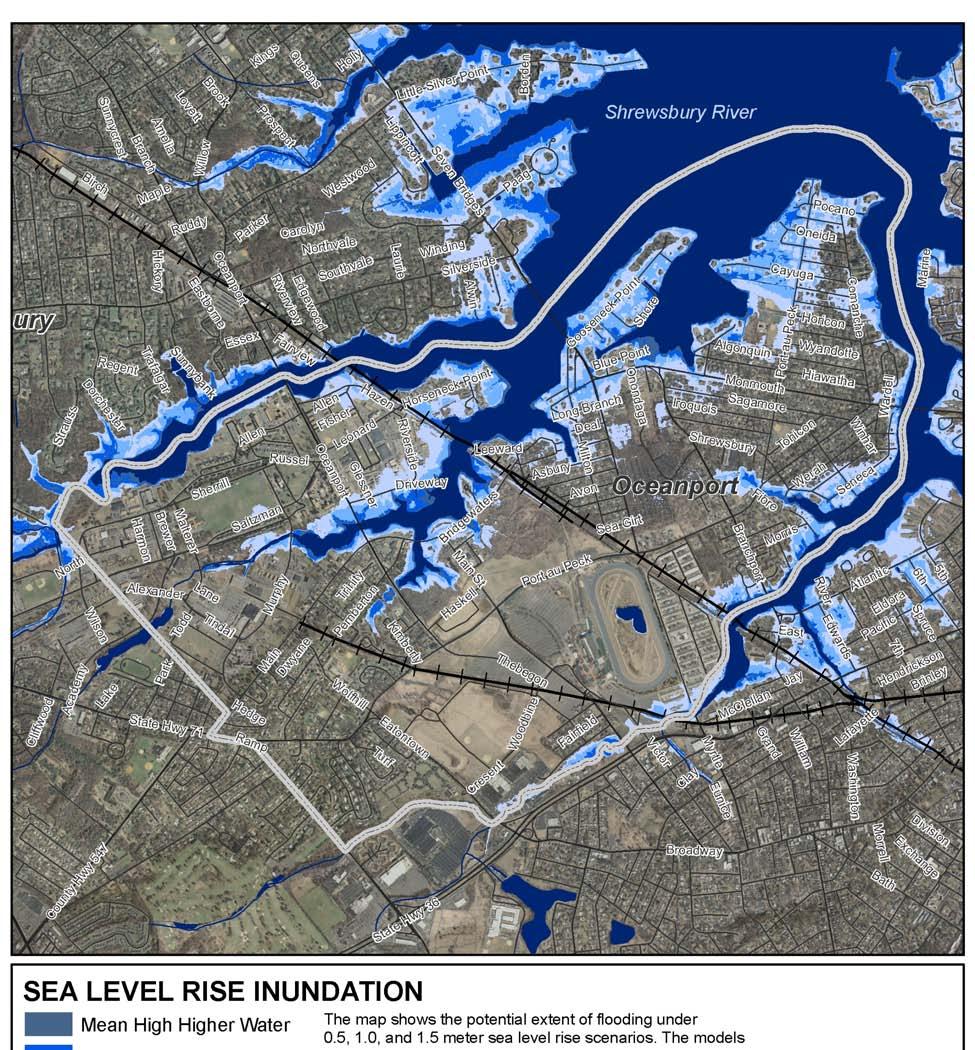
Coastal communities across the nation are faced with the challenge of how to adapt to coastal inundation associated with climate change and sea level rise. As part of the National Sea Grant Coastal Communities Climate Adaptation Initiative (CCCAI), the New Jersey Sea Grant Consortium (NJSGC) and its partners, New Jersey Department of Environmental Protection Office of Coastal Management (NJOCM), Monmouth University Urban Coast Institute (UCI) and Stevens Institute of Technology, conducted community-based, climate adaptation demonstration projects in Cape May Point, Little Silver and Oceanport, New Jersey. The objective of these projects was to provide the participating communities with an assessment of their vulnerabilities to help local decision-makers identify opportunities to improve their resiliency to coastal hazards and sea level rise. In order to accomplish this goal, virtual mapping was used to illustrate the potential scenarios for coastal inundation along with facilitated questionnaires that evaluated the communities’ existing planning strategies. The findings from these tools were presented to the communities and are summarized in this report.
Background of the Problem
The scientific community has arrived at a strong consensus that global climate change is occurring and resulting in changes to shoreline dynamics1. Climate change threatens to accelerate sea level rise and increase the frequency and intensity of coastal storms. As a result, citizens, development, and ecosystems will become more vulnerable to the impacts of coastal hazards, making it imperative to identify areas where special needs communities, vital public facilities and roads, and sensitive natural resources overlap areas of potential inundation. These issues need to be considered as New Jersey’s coastal communities plan to become more resilient.
New Jersey is truly a coastal state with 127 miles of Atlantic coastline and 1,792 miles of tidal shoreline, including Delaware Bay. Seventeen of twenty-one counties in New Jersey border tidally-influenced estuarine or oceanic waters. Nearly 9 million people live within these coastal counties, and these numbers increase dramatically during the summer months as people vacation along the shore. New Jersey’s economy is highly dependent upon its marine and coastal resources, which annually generate nearly $65.5 billion, with $39 billion generated through ports commerce (Genevieve Boehm-Clifton, NJDOT, personal communication, December 15, 2010), $22 billion through coastal tourism2 and $4.5 billion through recreational and commercial fisheries and aquaculture.3
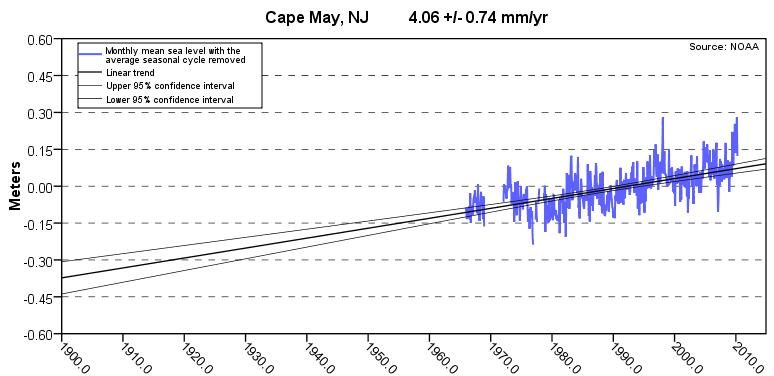
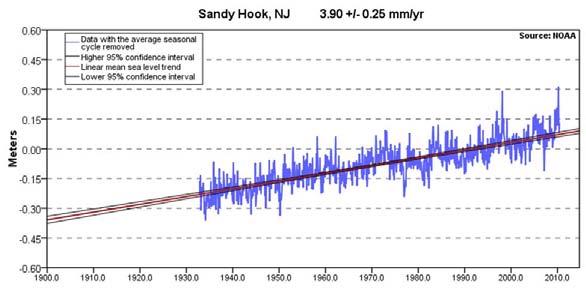
Historically, sea levels have risen approximately 0.4 meters (1.3 feet) in New Jersey since the early 20th Century4. While such an increase appears to be minimal, low-lying areas are becoming
1 The Parliament of the Commonwealth of Australia, Managing our Coastal Zone in a Changing Climate (October 2009). http://www.aph.gov.au/house/committee/ccwea/coastalzone/report/Final%20Report.pdf , New York State Sea Level Rise Task Force Report to the Legislature, Draft for Public Comment (November 2010). http://www.dec.ny.gov/docs/administration_pdf/slrtdrpt.pdf
2 IHS Global Insight, NJ Tourism: Holding Its Own During Difficult Times (2009). http://www.visitnj.org/sites/visitnj.org/files/tourism-ecom-impact-2008.pdf
3 State of New Jersey Department of Agriculture, New Jersey Fishing and Aquaculture: Harvesting the Garden State’s Waters (2005) http://www.state.nj.us/seafood/seafoodreport.pdf
more susceptible to shallow coastal flooding and coastal erosion. Coastal communities need to improve efforts to adapt to climate change but face hindrances such as political will, resource scarcity, personnel availability or other institutional variables. To take action, resources, tools and science-based information are needed to adequately plan for and address imminent impacts, to make informed decisions to become resilient, and to collaborate for multi-disciplinary planning. Local decision-makers often have the greatest capacity to influence the resiliency of their community as they already address coastal flooding issues and protect the health, safety and welfare of their constituents.
Project Scope
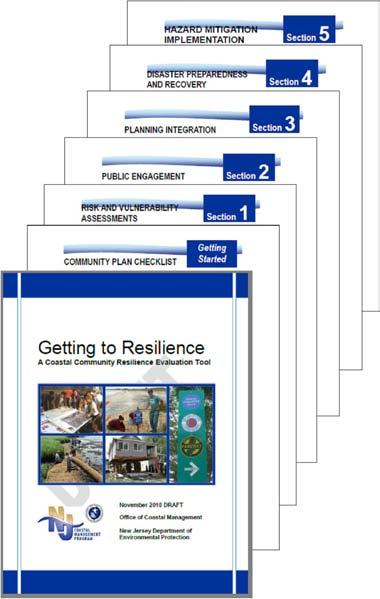
NJSGC piloted two innovative tools developed by the NJOCM: Coastal Community Vulnerability Assessment Protocol (CCVAP) and Getting to Resilience to perform the virtual mapping and questionnaire.
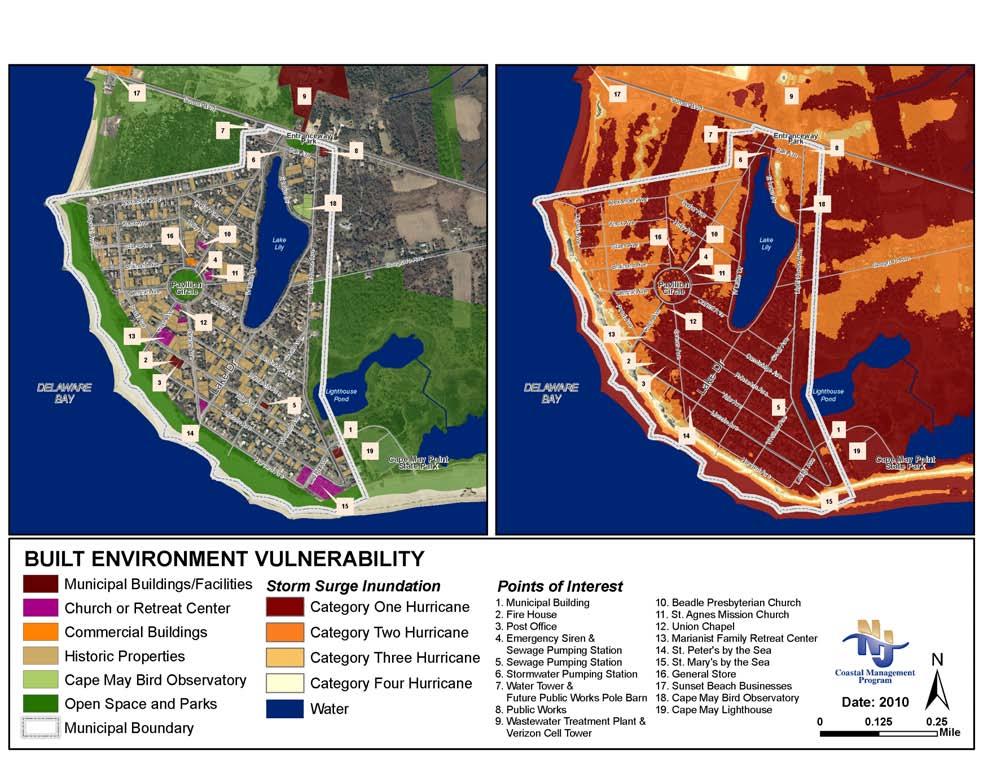
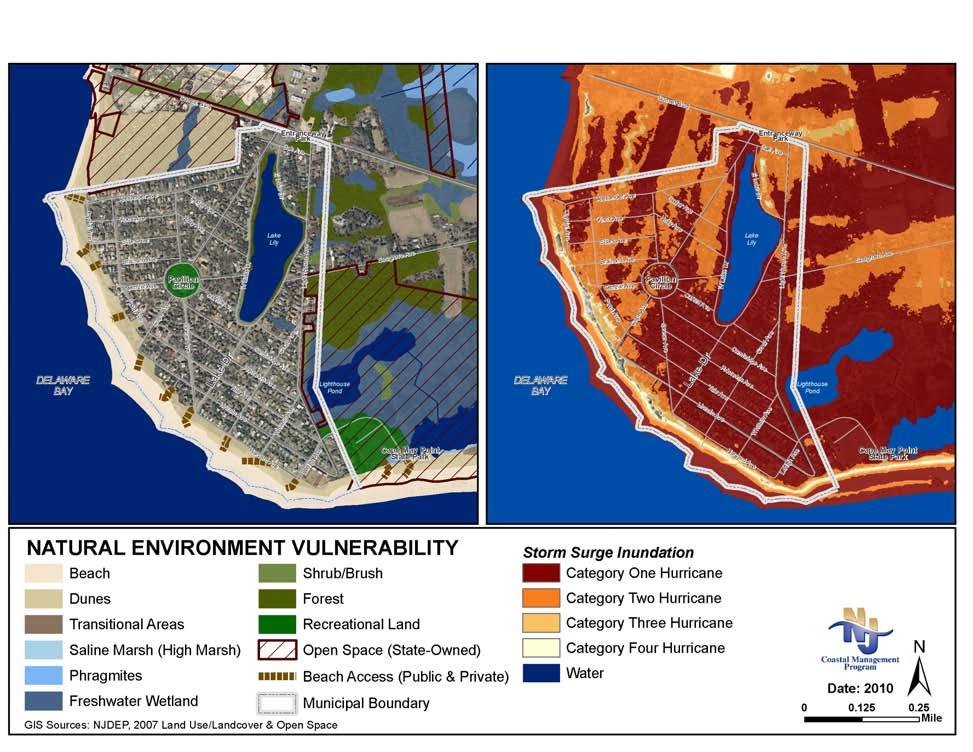
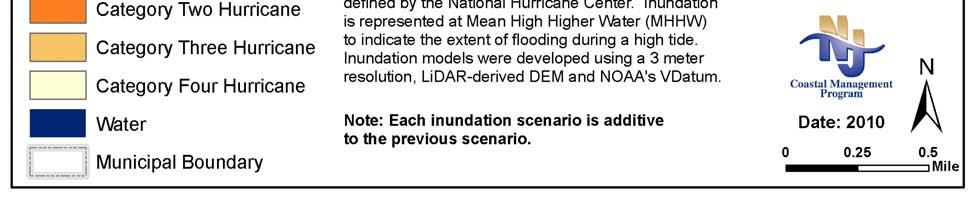
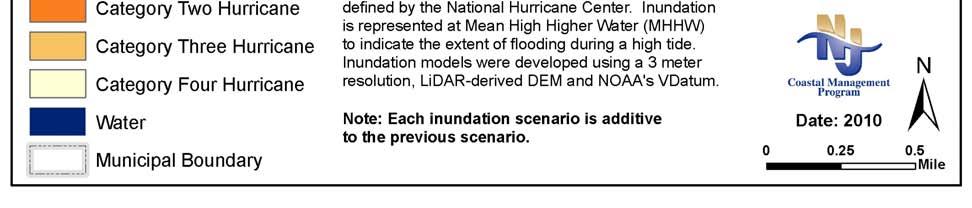
Coastal Community Vulnerability Assessment Protocol (CCVAP) is a GIS-based methodology to assist land use planners, hazard mitigation planners, emergency managers, and other local decision-makers in the identification of their community’s vulnerability through virtual mapping. By applying the methods defined in CCVAP to the pilot communities, areas were identified where built infrastructure, sensitive natural resources, and special needs populations overlapped areas of potential inundation. This vulnerability mapping supports community efforts to make the connection between the potential consequences of sea level rise and inundation to their vulnerability – ultimately to guide the community for resilience planning.
Getting to Resilience is a questionnaire developed as a non-regulatory tool to help coastal communities build capacity for resilience to coastal hazards and sea level rise. The application of the survey was intended to highlight positive actions already underway within the pilot communities and to identify opportunities to improve local resilience through planning, public outreach, mitigation, and response mechanisms. This questionnaire validates the hazard planning that the communities have begun to implement and identifies opportunities to incorporate adaptation strategies in broader community planning.
Project Phases
The New Jersey Coastal Community Resilience Demonstration Project was conducted in three phases as an integrated process of virtual mapping, plan reviews, collaborative meetings and questionnaires.
• Phase 1: Initial meetings with the communities to review project objectives, identify known vulnerabilities and other relevant social, geographic and environmental factors, and review community plans
• Phase 2: Virtual mapping using Coastal Community Vulnerability Assessment Protocol to show vulnerable areas in the communities and presenting these results to the community leaders
• Phase 3: Administration of Getting to Resilience questionnaire and final summary reporting and presentations to the communities
Related Work in the State and Region
The New Jersey Sea Grant Consortium built upon existing partnerships within the state to provide outreach to coastal communities on their vulnerability to coastal hazards and sea level rise. Partners in this project included:
• NJSGC for coordination, presentations, summary reporting, and website outreach
• Stevens Institute of Technology for support with mapping analysis and outreach to communities
• Monmouth University, Urban Coast Institute for community engagement, coordination with mapping partners and refinement of Getting to Resilience questionnaire
• NJDEP Office of Coastal Management for mapping, analysis and the development and implementation of the Getting to Resilience questionnaire
These coastal partners have worked on projects in coastal hazards and sea level rise, including the acquisition of LiDAR in the state and the installation of tidal gauges for flood warnings.
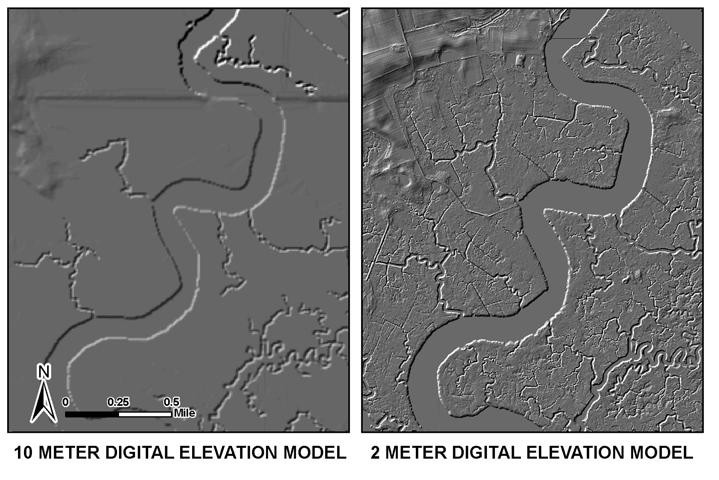
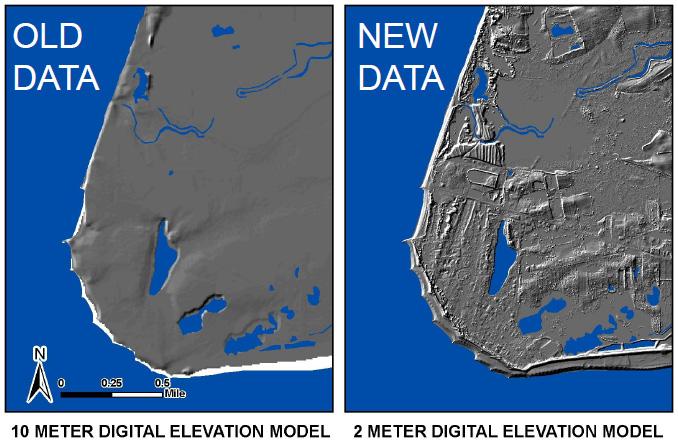
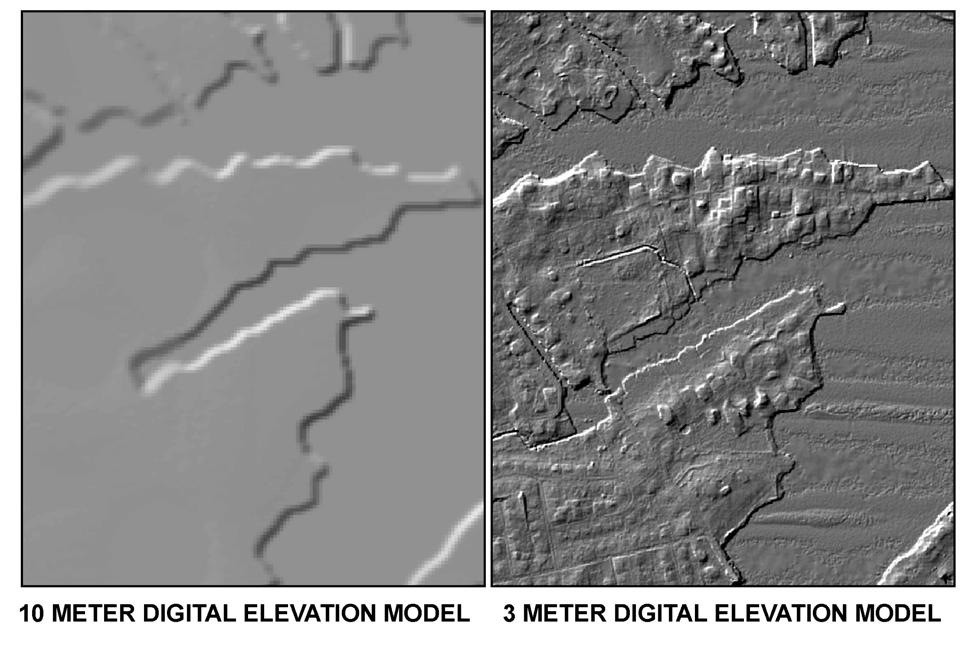
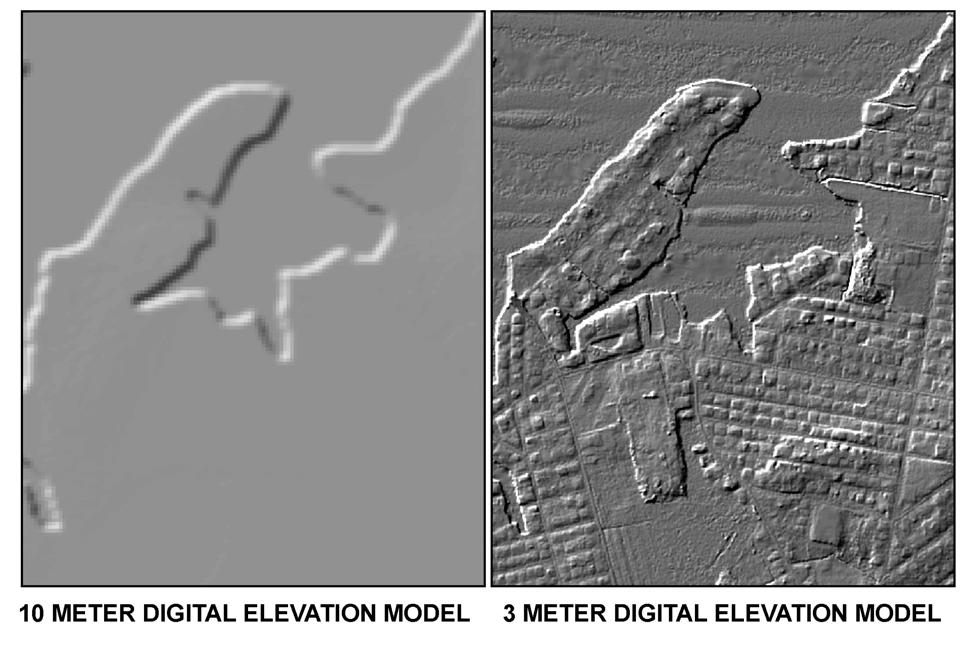
The New Jersey Office of Coastal Management partially funded the use of LiDAR technology in the state to improve inundation visualization. Improvements in elevation data and the development of tools like VDatum, which allows GIS users to identify tidal elevations, have greatly improved the ability to identify areas of potential inundation under various storm scenarios. It can also be used to identify potential sea level inundation scenarios, which can inform communities about how their vulnerability to flooding may change over the course of the next century. The image above demonstrates how elevation data has improved due to the use of LiDAR technology.
Monmouth University Urban Coast Institute and Stevens Institute of Technology have previously worked with two of the pilot communities, Little Silver and Oceanport, to install tide gauges on the Shrewsbury River and to identify impacts related to coastal flooding. The newly developed Shrewsbury Early Flood Warning System is being used to provide flood height
information to constituents and emergency managers so that they may respond more quickly to the threat of coastal flooding.
Community Descriptions
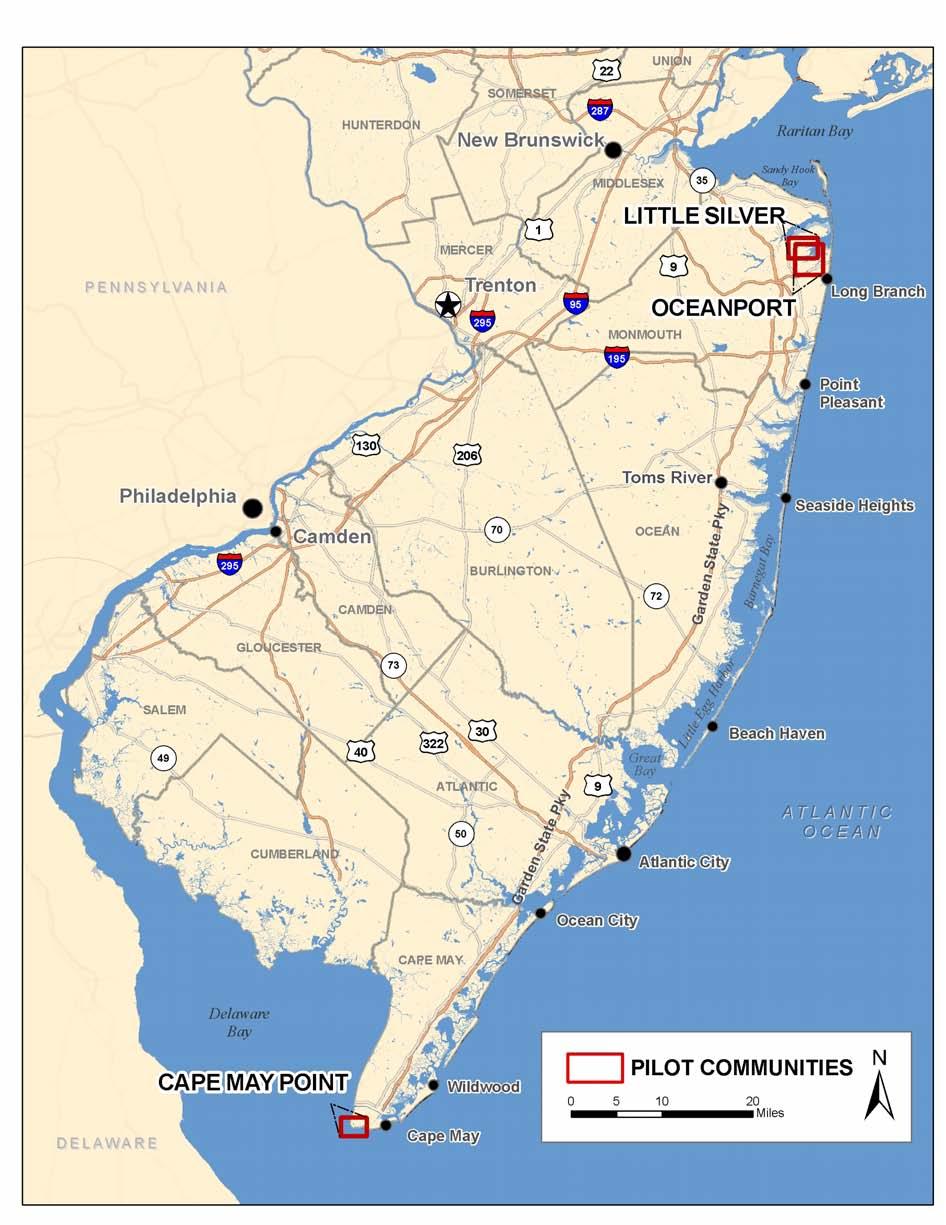
Although fourth smallest in area, New Jersey is the most densely populated state in the country. It is also located within the New York-New Jersey Metropolitan area, one of the most highly urbanized and industrialized regions in the nation. The health and management of New Jersey’s coastal waters is coupled tightly to these demographics. However, there is a strong north-south gradient from the urban north to the rural and agricultural south with coastal towns that support the thriving tourism industry. Because the character of coastal communities varies throughout the state, the NJSGC and its partners identified the opportunity to assess the hazard vulnerability and resiliency of coastal communities with differing environmental, social, and infrastructure composition. The boroughs of Cape May Point, Little Silver, and Oceanport were selected to participate in the NJSGC’s Coastal Community Climate Adaptation Initiative due to their willingness and history of dealing with similar challenges.
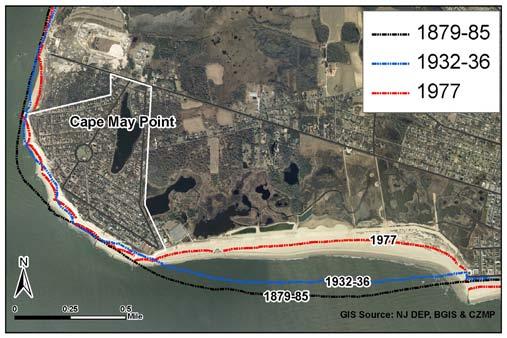
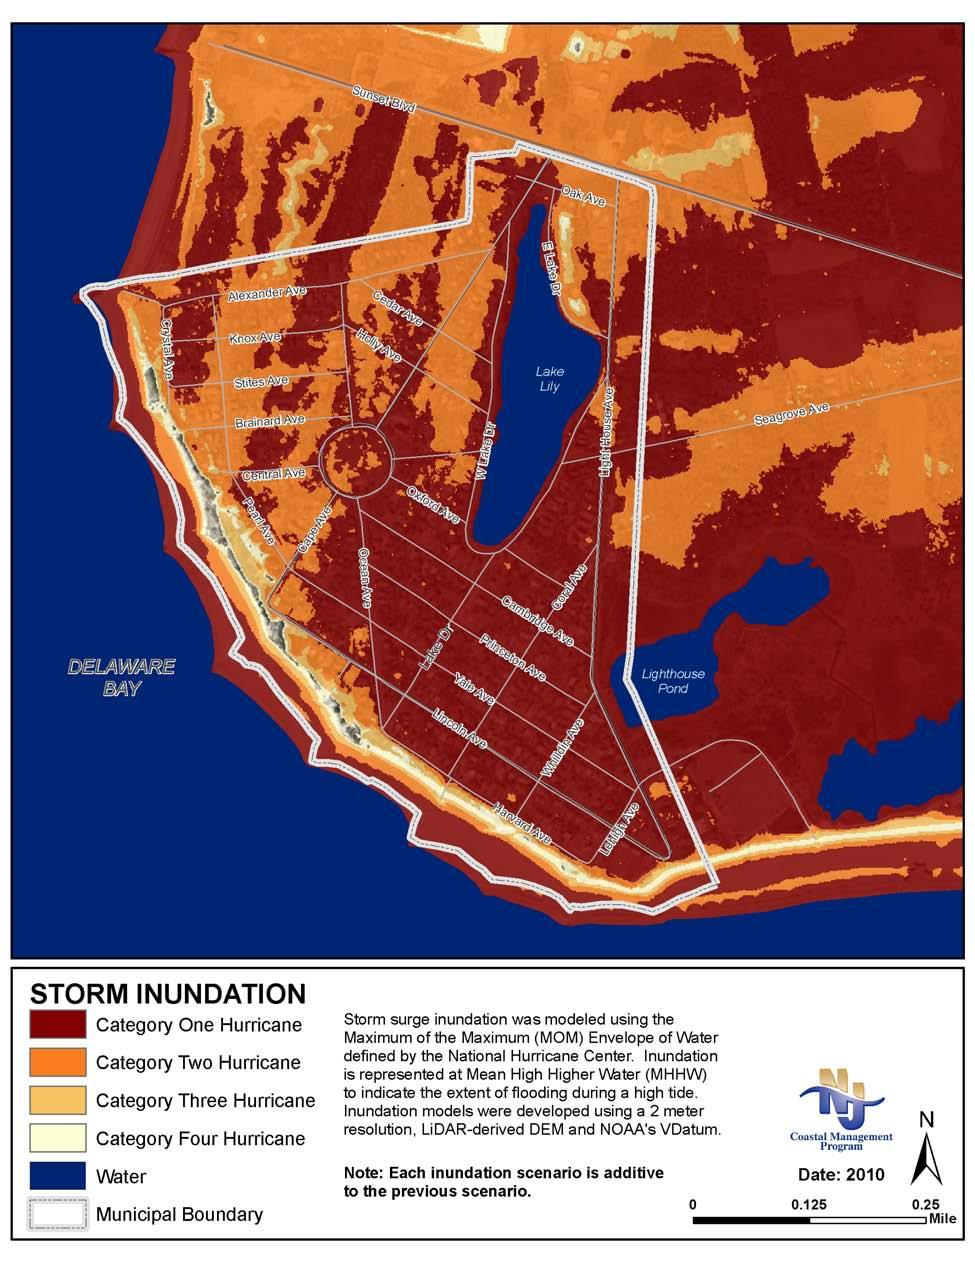
Cape May Point
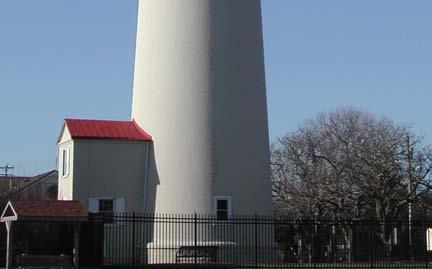
The Borough of Cape May Point is located at the most southerly end of the Cape May peninsula where the Delaware Bay meets the Atlantic Ocean. This small, residential resort community and its surrounding areas have proven to be vulnerable to coastal erosion, storms, and saltwater intrusion. The community has taken multiple strides to reduce the impacts of these hazards through beach replenishment, the placement of offshore breakwaters, and the installation of a stormwater pumping system. The community has also worked to protect habitat and vegetation through a local landscape ordinance that reduces stormwater runoff. Because the community is governed by a three-person commission, all of which lead efforts that influence community resiliency, it proved to be difficult to meet in an informal setting. Municipal representatives from the community’s environmental commission, emergency management, and planning board informally participated in the pilot study to learn more about their vulnerability to coastal hazards.
Little Silver and Oceanport
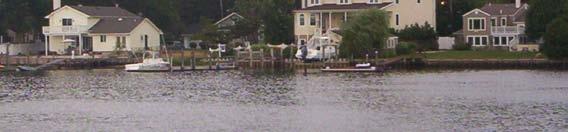
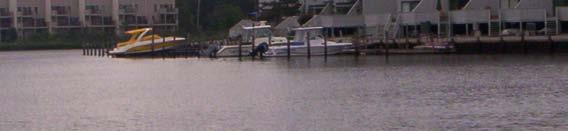
The Boroughs of Little Silver and Oceanport are located along the Shrewsbury River, which is a tidal watercourse in the northern portion of Monmouth County that is fed by the Raritan Bay. Both of these communities are nearly built out and are mainly residential with a smattering of commercial uses. Fort Monmouth is located in the middle of these adjoining communities and is slated for redevelopment after the base closes, presenting an opportunity for planning for hazard resiliency. These communities are most susceptible to coastal storms and riverine flooding, which is most prevalent during nor’easters when water levels can remain elevated for days at a time, preventing water from draining. In order to protect the lives and property of local residents, these municipalities have participated in the coordination efforts to install the Shrewsbury River Flood Warning System (SRFWS). While these communities have taken proactive steps to reduce their vulnerability to flooding, local and county decision-makers were eager to participate in NJSGC’s pilot study. Community representatives from Monmouth County Planning and Office of Emergency Management and municipal emergency managers and environmental commissioners were engaged throughout the outreach process.
Map 1: Pilot Communities
Methodology
The NJSGC and its partners worked with the boroughs of Cape May Point, Little Silver, and Oceanport to explore coastal community vulnerability, hazard resilience, and opportunities for climate adaptation on the municipal level. Through this project, the NJSGC piloted two innovative tools developed by the NJOCM to further the state’s knowledge of coastal hazard vulnerability. These tools include the Coastal Community Vulnerability Assessment Protocol (CCVAP) and the Getting to Resilience questionnaire, both of which were developed through the NOAA Coastal Zone Management Section 309 enhancement grant.
CCVAP is a GIS-based vulnerability assessment methodology developed to help local governments understand their community’s vulnerability under present and future inundation scenarios. While CCVAP provides communities with a visualization of local vulnerabilities to inundation, the Getting to Resilience questionnaire was developed to help local governments validate existing hazard planning efforts and identify opportunities to incorporate adaptation strategies into local planning, public outreach, disaster preparedness, and mitigation efforts. Through the combined application of the mapping visualization and the Getting to Resilience questionnaire, the NJSGC and its partners intended to provide the pilot communities with a strong knowledge base in coastal hazard and climate change vulnerability, building the case for local governments to take proactive steps to improve their disaster and climate resilience.
While the NJSGC applied the NJOCM’s tools to just a few pilot communities in New Jersey, the experience and knowledge gained through the application of these tools will assist in their refinement prior to their widespread application throughout the state’s coastal zone. As these tools continue to be applied, coastal municipalities will obtain the knowledge to move beyond traditional planning and mitigation practices to improve local hazard and climate change resilience.
Outreach Phases
The NJSGC and its partners met with local decision-makers and knowledgeable volunteers in a focus group setting for a series of four meetings throughout the project. Each meeting was intended to broaden participants’ understanding of their community’s vulnerability to coastal inundation and to initiate a dialogue about disaster avoidance, resilience, and adaptation. The timing of the municipal outreach meetings coincided with the completion of the research phases of the project.
Meeting 1: The project team met with municipal representatives to introduce the purpose, goals, and objectives of the Coastal Community Adaptation Initiative, along with the role of the project partners and the participating municipality.
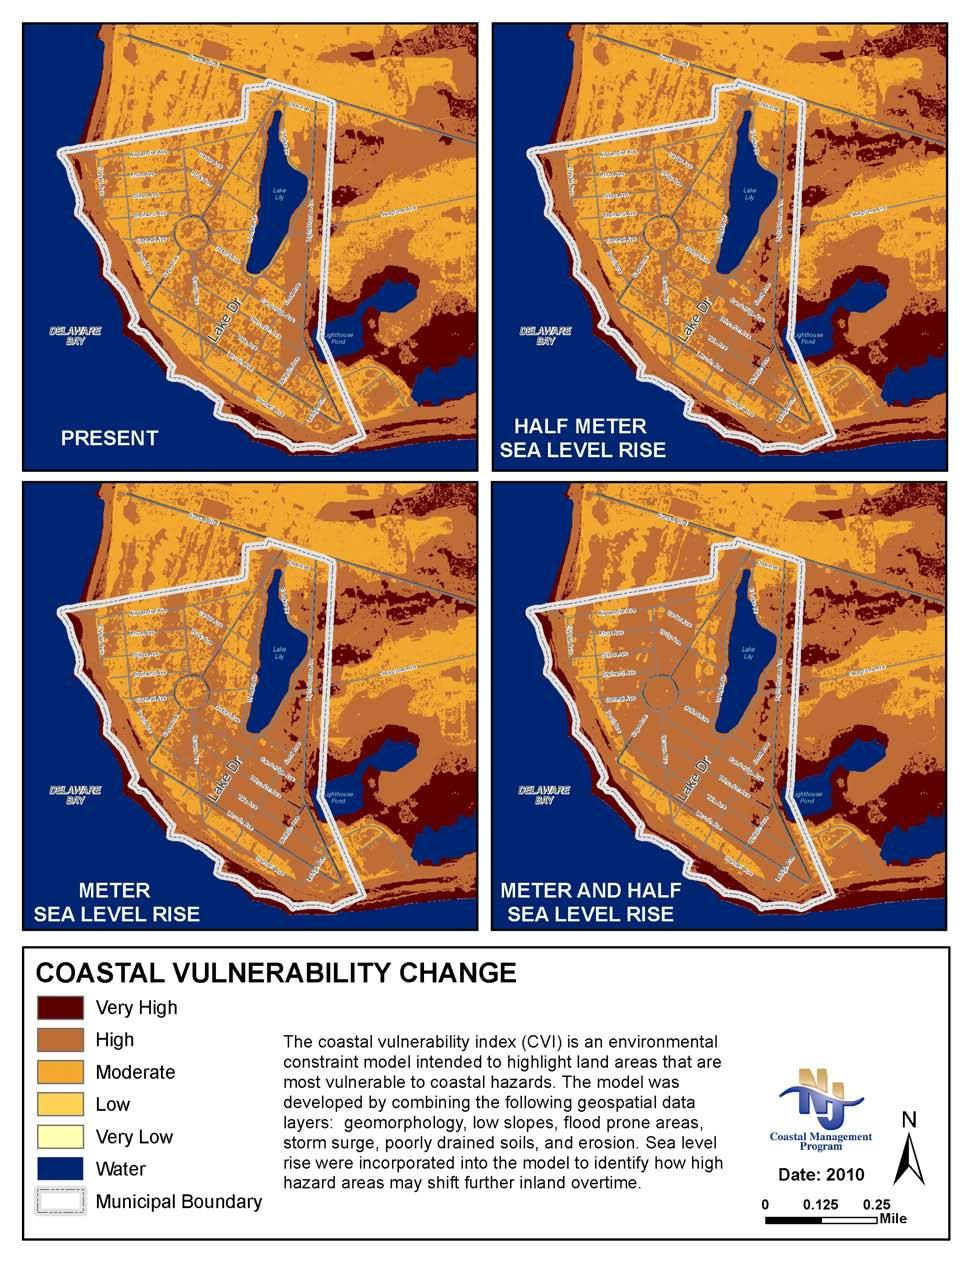
Meeting 2: A series of maps developed by the NJOCM to identify high hazard areas under present and future inundation scenarios were presented to the pilot communities. The maps not only represented current inundation threats of spring tides and hurricanes, they revealed how projected sea level rise scenarios may augment the inundation extent of future spring tides and hurricanes. By incorporating the inundation scenarios into a series of coastal vulnerability
indexes, along with other natural variables, the NJOCM modeled how high hazard areas may increase and move inland over the next century. These maps were shared with community leaders to help them target future mitigation, public outreach, disaster preparedness, planning, and zoning opportunities.
Meeting 3: The project team facilitated Getting to Resilience to a group of local representatives, typically consisting of an emergency manager, planner, and environmental commission member. The application of the Getting to Resilience questionnaire involved a thorough evaluation of existing plans, public engagement, disaster preparedness, and mitigation projects in regards to coastal hazards and sea level rise. By bringing community and county leaders to the table, the participants were able to discuss current limitations and future opportunities to improve hazard resilience.
Meeting 4: The final meetings with the pilot communities summarized the project team’s findings, which were revealed through the application of the CCVAP methodology and the Getting to Resilience questionnaire. During the final meetings, the project team identified priority actions that the pilot communities may want to consider implementing in order to reduce their vulnerability to coastal storms and to prepare for the onset effects of sea level rise.
Vulnerability Mapping
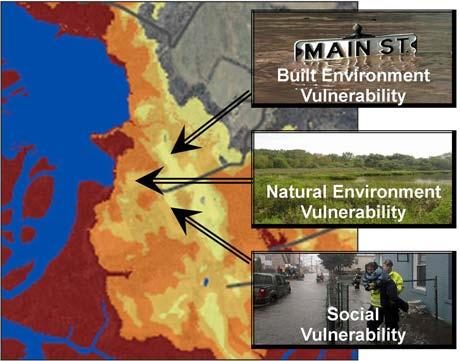
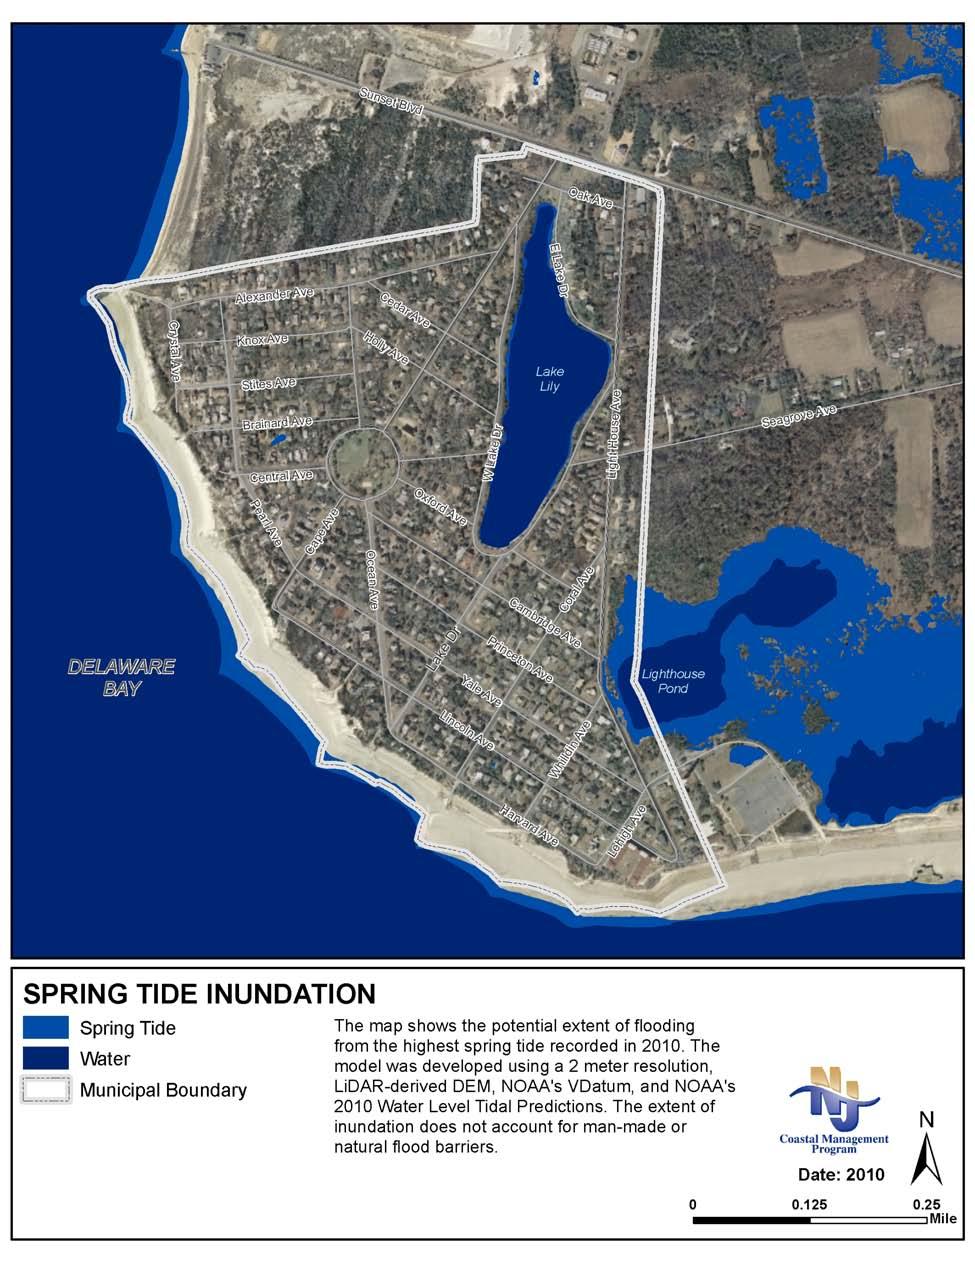
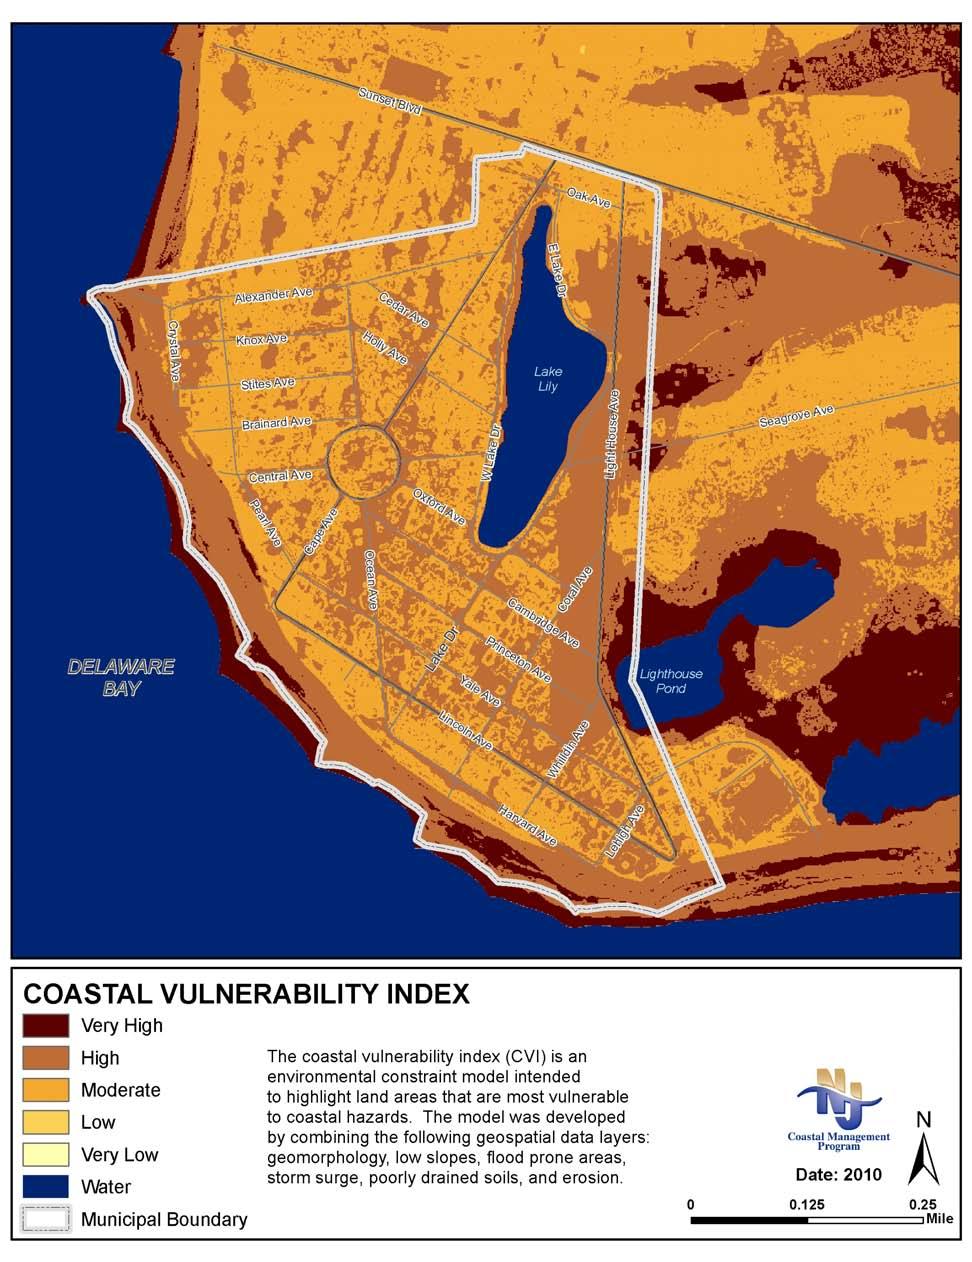
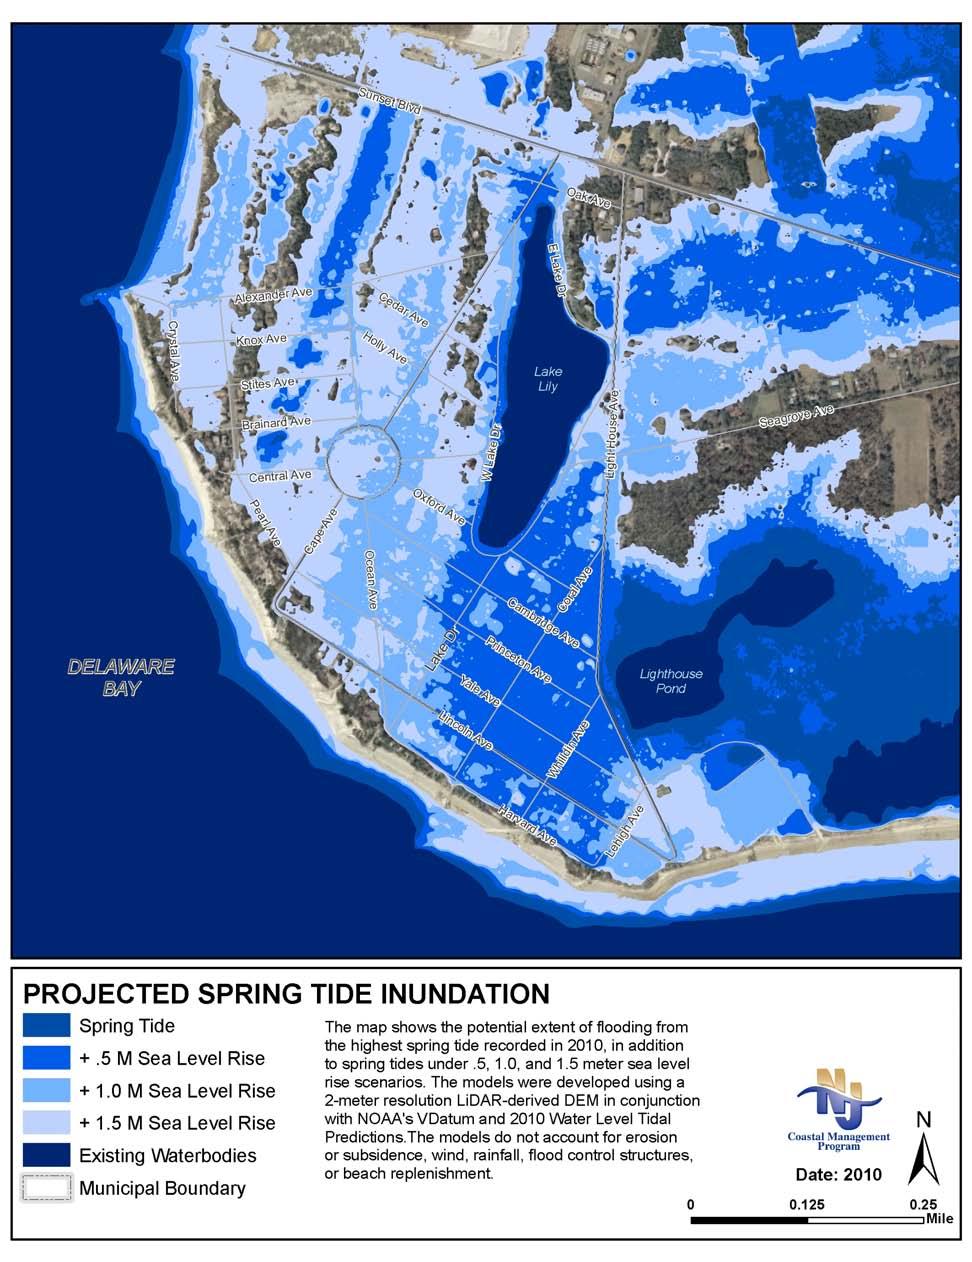
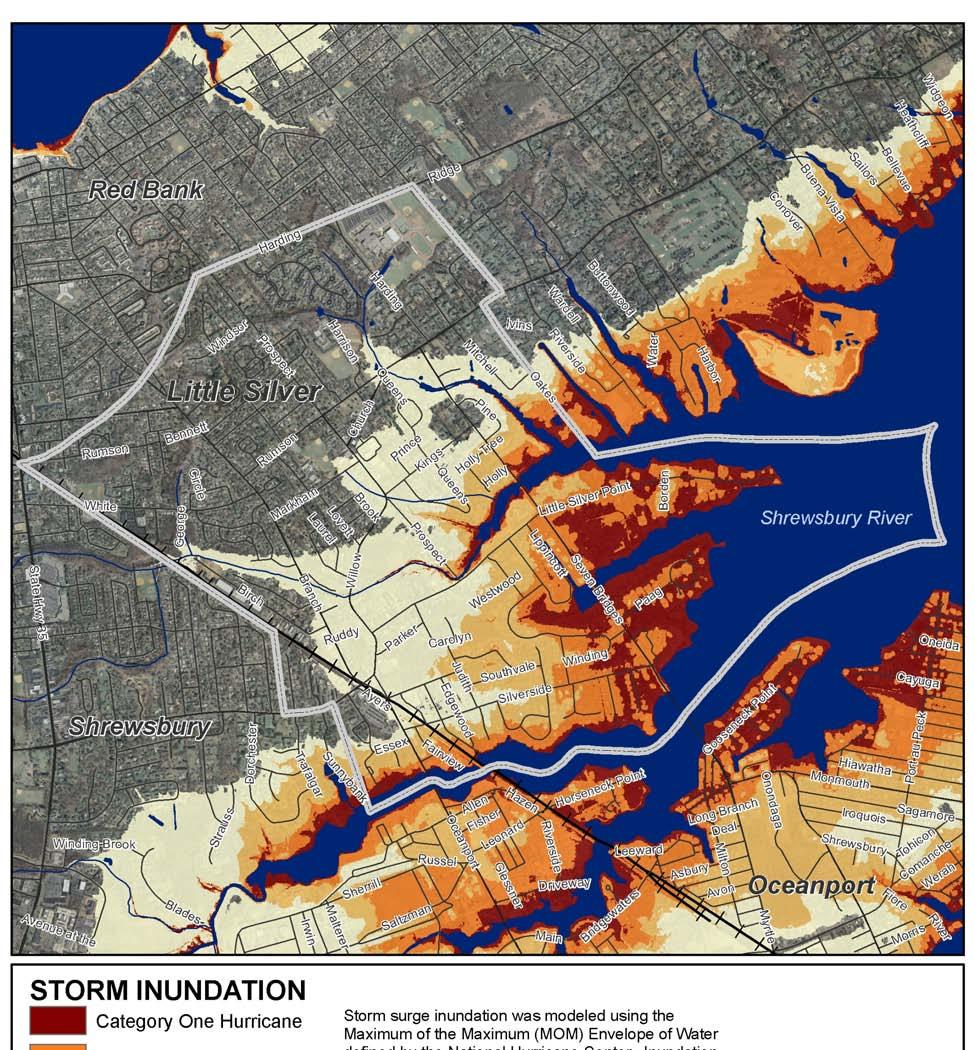
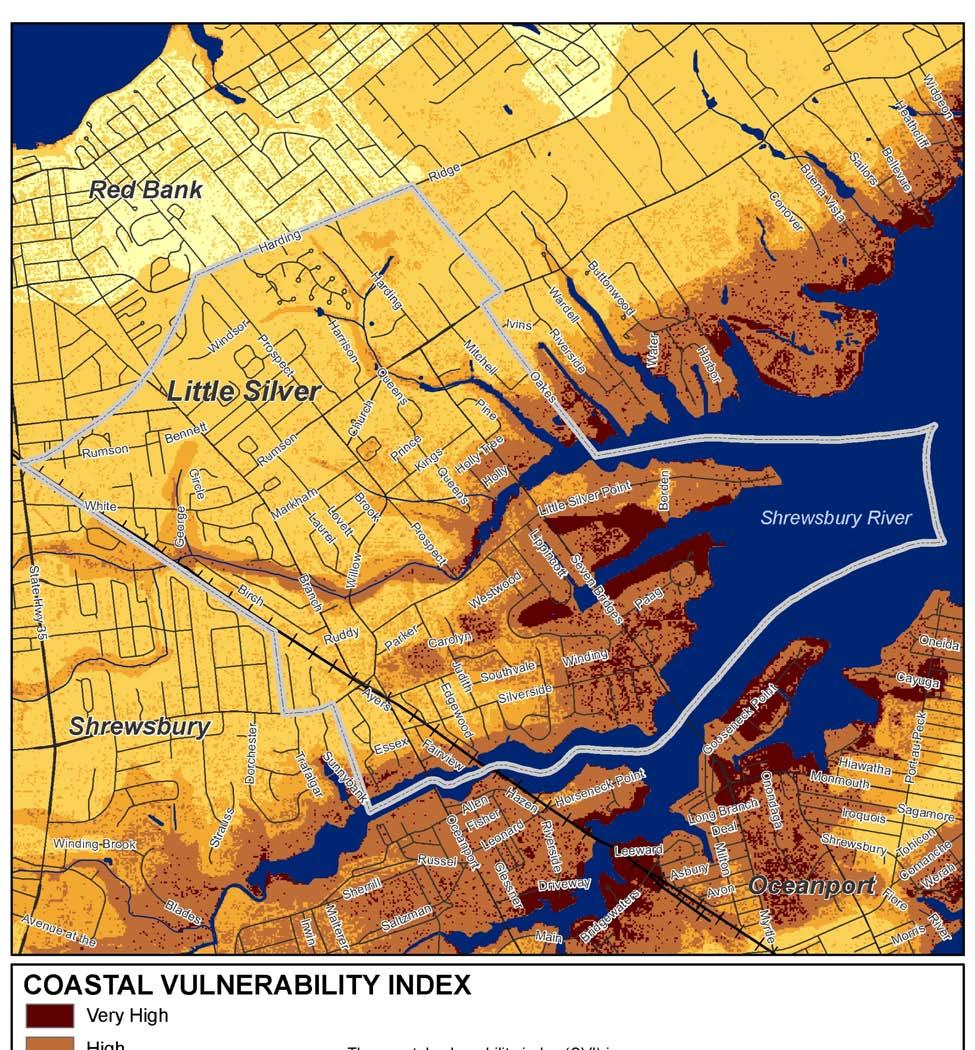
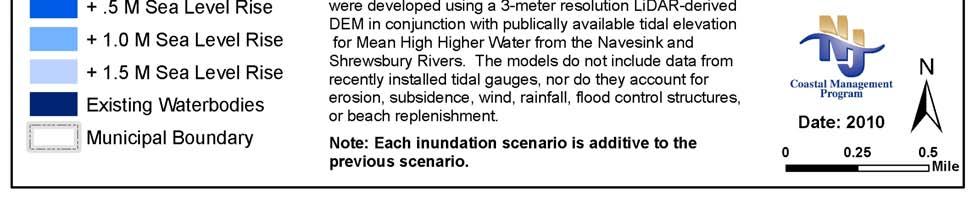
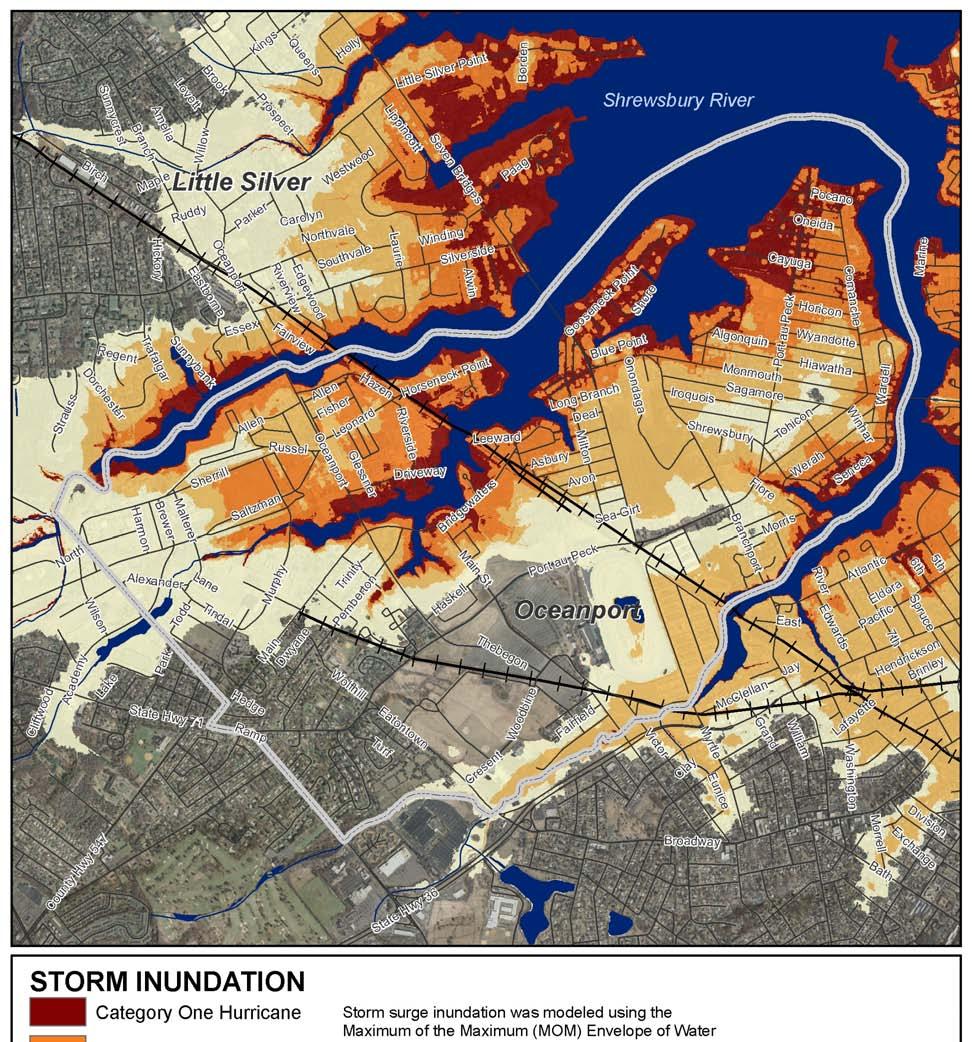
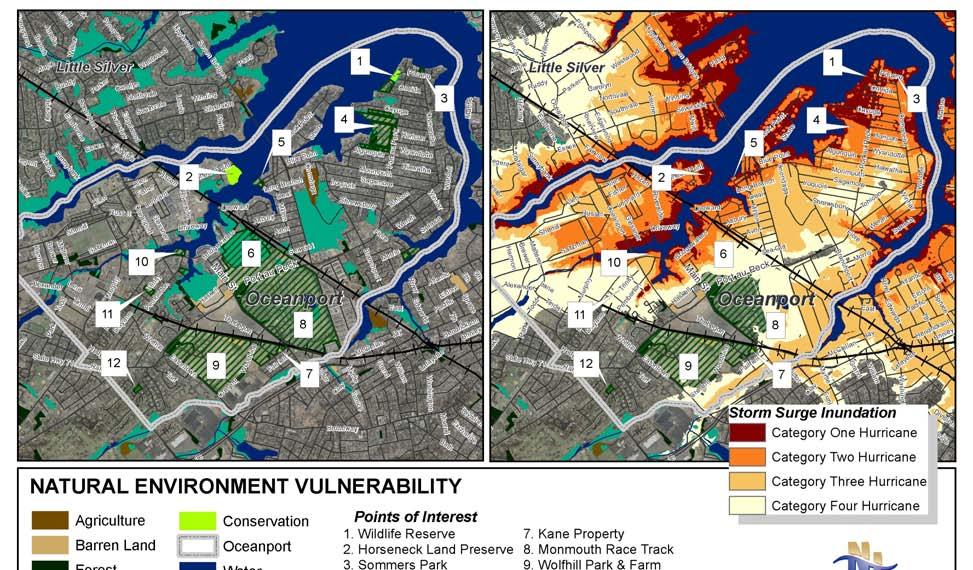
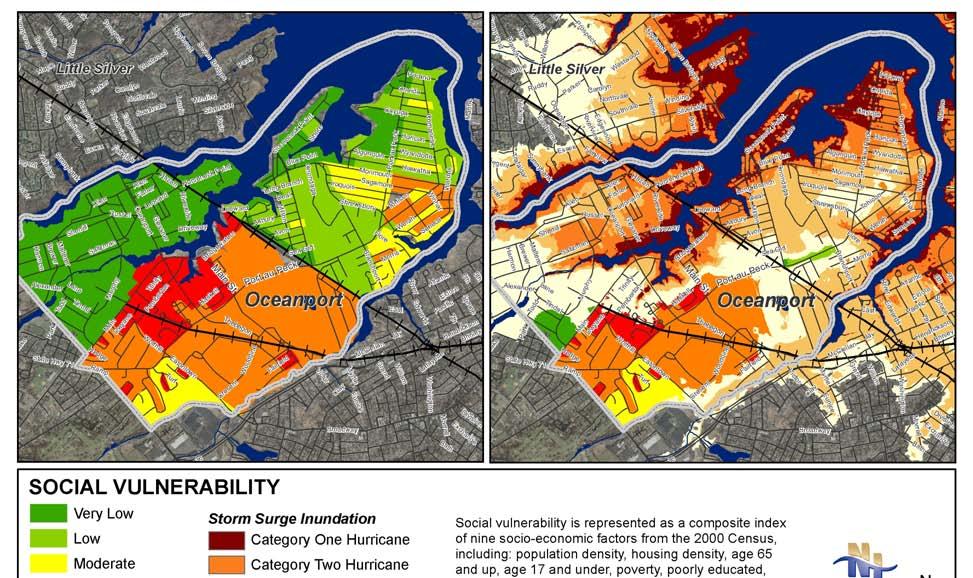
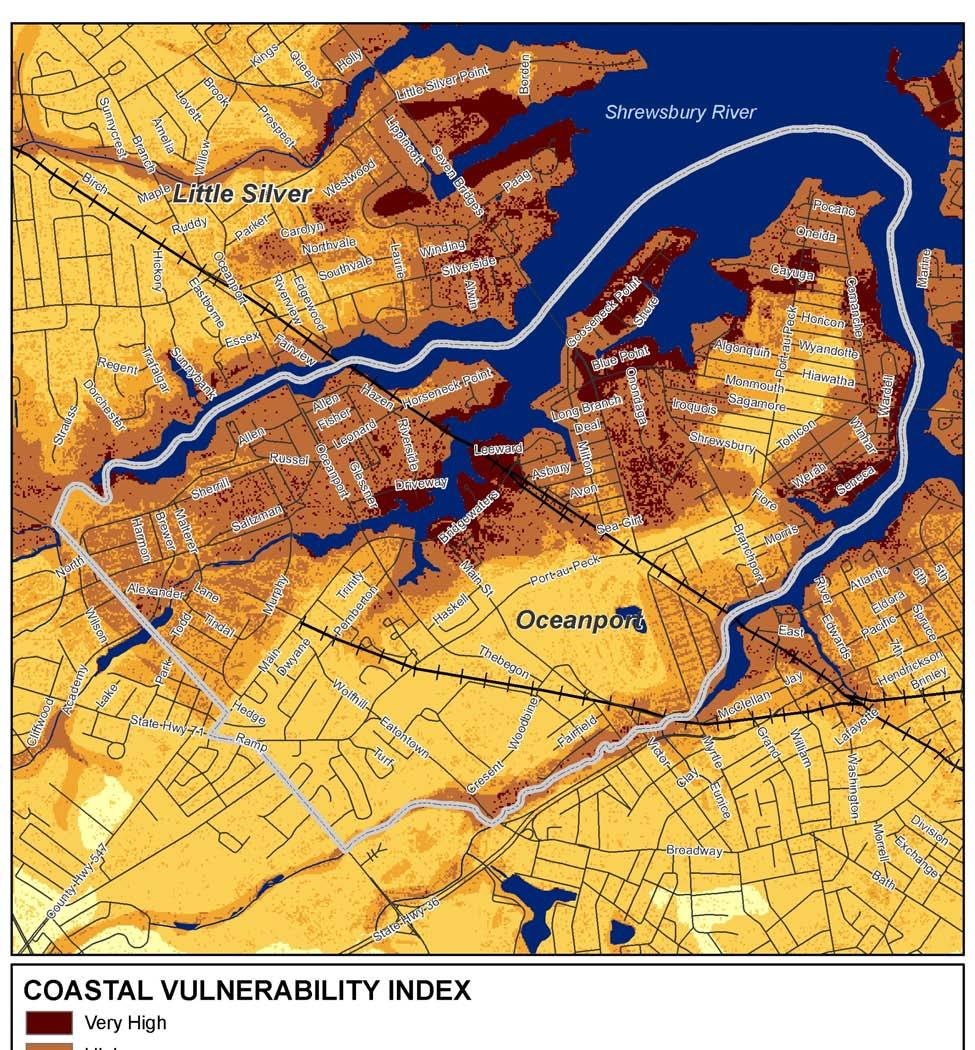
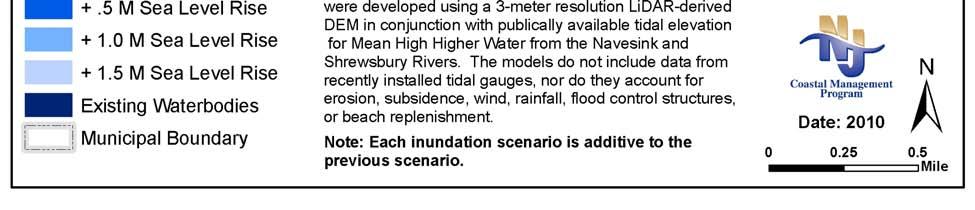
Coastal Community Vulnerability Assessment Protocol (CCVAP) is a GIS-based methodology to assist land use planners, hazard mitigation planners, emergency managers, and other local decision-makers in the identification of their community’s vulnerability to coastal hazards and sea level rise. Based off of a number of existing risk and vulnerability assessment methodologies,5 CCVAP defines the necessary steps to classify vulnerable land areas under present and future inundation scenarios. The vulnerability mapping was an iterative process that required the development of multiple inundation scenarios. Through the use of 2-3 meter resolution Light Detecting and Ranging (LiDAR) elevation data and NOAA’s Vertical Datum Transformation Tool (VDatum),6 the NJOCM developed geospatial models representing the extent of mean higher high water (MHHW), storm surge, and sea level rise inundation for each pilot community. The inundation scenarios were then fed into a coastal vulnerability index (CVI), which is a composite raster overlay model that defines high hazard areas under present and future conditions using six geospatial inputs, including storm surge inundation scenarios, low slopes, flood prone areas, poorly drained soils, erosion prone areas, and geomorphology. By incorporating sea level rise
5 Cutter, S.L.; Mitchell, J.T.; and M.S. Scott. (2000). NOAA: CSC. (1999); Thieler, E.R and E.S Hammar-Klose (1999); Lennon et al (1996); Gornitz, V. M., Daniels, R. C., White, T. W., and Birdwell, K. R. (1994) 6 NOAA. Vertical Datum Transformation Tool (VDatum). http://vdatum.noaa.gov/
Figure 1: Coastal Community Vulnerability Assessment Protocol (DRAFT), NJOCM
scenarios into existing storm surge models, the NJOCM was able to visualize how climate change may shift inundation and high hazard areas further inland overtime.
By applying the methods defined in CCVAP to the boroughs of Cape May Point, Little Silver, and Oceanport, it was possible to identify where built infrastructure, sensitive natural resources, and special needs populations intersect areas of potential storm surge and sea level rise inundation. The NJOCM then mapped the built and natural features in and around areas of potential inundation. To obtain a better understanding of the portions of the community that may need assistance in the event of a coastal storm, the NJOCM developed a social vulnerability index7 using socio-economic data available through the Census. Community representatives assisted the NJSGC and its partners in the identification of these vulnerabilities by identifying the built and natural environmental features and social characteristics that pertain to their community.
The pilot communities utilized this checklist to inform the NJOCM of vulnerabilities they were interested in having assessed within their community.
By working with community leaders and local decision-makers to identify local vulnerabilities to coastal hazards, the project team was able to bring to light the connection between local decision-making, disaster resilience, and long-term sustainability. The NJSGC and its partners shared the mapping with the pilot community representatives not only to inform them of their vulnerabilities, but also with the anticipation to inform future planning and zoning, development siting, and mitigation decisions.
7 Hazards & Vulnerability Research Institute. (2008). The SoVI Recipe. University of South Carolina. http://webra.cas.sc.edu/hvri/docs/SoVIRecipe.pdf .
Getting to Resilience is a questionnaire developed by the NJOCM as a non-regulatory tool to help coastal communities build capacity for resilience to coastal hazards and sea level rise. The questionnaire was prepared by compiling the efforts of many academics, international and federal agencies, and planning practitioners in regards to land use plan development and design, hazard mitigation and planning, and coastal resilience. Getting to Resilience incorporates many of the key components of existing local government evaluation tools into a brief and easy to facilitate questionnaire.
The questionnaire is divided into five sections: (1) Risk and Vulnerability Assessments, (2) Public Engagement, (3) Planning Integration, (4) Disaster Preparedness and Recovery, and (5) Hazard Mitigation Implementation. It highlights the importance of local plan integration and stresses the need for consistency among municipal building codes, ordinances, and zoning. The questionnaire also identifies the importance of linking localized risk and vulnerability assessments to land use planning, public expenditures, mitigation, and disaster preparedness and response because the responsibilities of limiting hazard exposure and reducing vulnerability to coastal hazards are dispersed among many local departments and offices. The following types of professionals were requested to be involved in the piloting of the tool on the municipal level:
• Land Use Planners
• Hazard Mitigation Planners
• Floodplain Managers
• Emergency Managers
• Stormwater Managers
• Natural Resource Planners
In each pilot community, the questionnaire was facilitated in a focus group setting to initiate a dialogue among local decision-makers about coastal hazards, vulnerability, and community resilience. The application of the tool was intended to highlight positive actions already underway within the pilot communities and to identify opportunities to improve local resilience through existing planning, public outreach, mitigation, and response mechanisms. Over the course of approximately two hours, community leaders completed the portions of the questionnaire in which they were most familiar. The application of Getting to Resilience not only acted as a forum for discussing ways to improve resilience, it also gave NJSGC and its partners insight on ways that they could provide technical and educational assistance to coastal communities. The NJOCM intends to use its experience in piloting Getting to Resilience to improve the tool so that it may be applied ubiquitously throughout coastal communities in New Jersey.
Figure 3: Getting to Resilience, NJOCM
Coastal Community Outreach and Assessments
Borough of Cape May Point
Cape May Point is located at the most southerly point of Cape May peninsula where the Delaware Bay meets the Atlantic Ocean. The community now known as Cape May Point was founded as Sea Grove in 1875. Sea Grove transitioned from a resort community to a religious retreat center. Today, Cape May Point is characterized as a quiet, residential shore community and vacation destination. While the 191-acre community only has 241 year-round residents8, Cape May Point contains 583 residential units9 and hosts nearly 2,500 residents during the summer months.10 Because of Cape May Point’s historic nature, many of its homes date back to the late 1800s to mid-1900s.11 The mixture of historic homes and modest cottages characterize this quaint residential community which is nearly void of all other land uses. While Cape May Point is not densely developed, the subdivision of existing properties or expansion of dwellings could result in increased development in the community. Even so, Cape May Point’s year-round population is only projected to increase to 280 by 2020.12
Cape May Point’s precarious position along the New Jersey shore makes it subject to beach erosion, coastal storms, flooding, and saltwater intrusion into freshwater resources. Since the majority of Cape May Point lies within the 100-year floodplain and most residential development sits 10 feet or below in elevation (in relationship to mean sea level), a Category 1 hurricane is a significant threat to the community. Historically, Cape May Point has experienced the impacts of hurricanes, tropical storms, and nor’easters. These episodic storm events, in addition to daily coastal processes, have resulted in extensive shoreline change. Shoreline erosion and the impacts of the 1944 hurricane and 1950 nor’easter washed away the former neighboring community of South Cape May. Periodically, bricks wash up on the beaches of Cape May Point, a reminder of nature’s volatility.
Cape May County has been identified as the 6th most difficult county to evacuate in the country.13 Cape May Point’s location, low-lying topography, and soil composition make it highly vulnerable to coastal storms when compared to other portions of the New Jersey shore. Recognizing the threat of coastal erosion, storms, flooding, and even saltwater intrusion, Cape May Point has taken steps to reduce their vulnerability to these hazards. Despite municipal, state, and federal efforts to reduce Cape May Point’s vulnerability, climate change and sea level rise threaten to exacerbate the existing threat of coastal hazards.
8 American Factfinder, Census 2000
9 American Factfinder, Census 2000
10 Cape May Point Municipal Master Plan. (2007).
11 Cape May Point Municipal Master Plan. (2007).
12 Cape May County Comprehensive Plan. (2002).
13 Cape May County Disaster Preparedness Conference. (2010).
Figure 4: Historic Shorelines near Cape May Point
Figure 5: Cape May Point's Historic Sea Level Rise Trends
Source: NOAA. 2010. Sea Level Rise Trends
Cape May Point has experienced approximately 4 mm/year of sea level rise since 1965. If this trend were extrapolated without the consideration of glacial and ice sheet melting, Cape May Point would experience approximately 0.4 meters (16 inches) of sea level rise over the next century. Unfortunately, sea level rise projections incorporating global climate trends indicate the Delaware Estuary will experience approximately 0.5 – 1.5 meters (20 – 60 inches) or greater of sea level rise by 2100.14 As climate change alters the natural processes of the New Jersey shore, Cape May Point will likely experience increased rates of erosion and saltwater intrusion, more frequent flooding, and changes in and loss of critical habitat, and changes in the frequency and intensity of coastal storms.
In order to obtain a better understanding of the vulnerabilities that presently threaten Cape May Point, the Coastal Community Vulnerability Assessment Protocol and the Getting to Resilience questionnaire were piloted in the community. By working with municipal leaders and volunteers, the project team was able to assess the existing vulnerabilities within the community and identify how high hazard areas may shift inland over time due to sea level rise. The partners used this information to validate the hazard planning that the community has already begun to implement and to identify opportunities to incorporate mitigation and adaptation strategies into broader community planning to ensure the long-term resilience of Cape May Point.
Vulnerability Assessment
The New Jersey Sea Grant Consortium piloted NJOCM’s Coastal Community Vulnerability Assessment Protocol in Cape May Point as part of the demonstration project. The application of CCVAP not only validated the risk and vulnerability protocol, it allowed the partners to identify infrastructure, natural resources, and vulnerable populations that may be exposed to storm surge inundation and sea level rise. The application of the protocol also informed the partners of the local government’s data and technical needs regarding coastal hazards and sea level rise.
By applying CCVAP, the New Jersey Office of Coastal Management developed multiple inundation scenarios, including spring tide, storm surge, and sea level rise models. Two-meter resolution, digital elevation models (DEMs) derived from LiDAR15 technology enhanced the identification of inundation prone areas, helping to accurately map surges and sea level rise. Elevation data was used in conjunction with the National Hurricane Center’s Sea, Lake, and Overland Surges from Hurricanes (SLOSH)16 models and NOAA’s Vertical Datum Transformation Tool (VDatum)17 to define the extent and depth of storm surge at a high tide.
14 Partnership for the Delaware Estuary. 2010. Climate Change and the Delaware Estuary. P. 6
15 Cape May County LiDAR (Light Detecting and Ranging) elevation data was funded by NOAA, FEMA, the New Jersey Department of Environmental Protection, and the New Jersey Office of Coastal Management.
16 National Hurricane Center. SLOSH Model. http://www.nhc.noaa.gov/HAW2/english/surge/slosh.shtml
The mapping revealed that Cape May Point does not presently experience flooding during spring tides. It does, however, indicate that the majority of Cape May Point is susceptible to flooding during a Category 1 hurricane and that the entire community will likely be inundated under a Category 2 hurricane. While the presence of dunes and beach restoration activities will likely dampen the impacts of a major coastal storm, Cape May Point remains susceptible to back-bay flooding from low lying tidal creeks and marsh areas such as Higbee Beach Wildlife Management Area and surges flowing from Cape Island Creek, located behind Cape May. Higher intensity storms correlate with greater flood depths and greater areas of inundation. For a storm traveling up the Delaware Bay at high tide, storm surge elevations may reach upwards of 14 feet without accounting for potential wave heights (see table below).18 In all cases, Sunset Boulevard, Cape May Point’s only evacuation and reentry route, is expected to flood.
CATEGORY HURRICANE
18Surge depths modeled with the National Hurricane Center’s SLOSH, two-meter resolution LiDAR, and NOAA’s VDatum are accurate within ± (20 percent + approximately 1 foot).
Figure 6: Elevation Data Improvements
Table 1: Potential Water Depths (in feet)
Map 2: Spring Tide Inundation, Cape May Point
Map 3: Storm Surge Inundation, Cape May Point
Built Environment
Cape May Point is comprised mainly of residential structures and churches. Many of these structures date back to the late 1800s and early 1900s and were not built to withstand a major flooding event. Luckily, Cape May Point has never been directly hit by a hurricane, even though it has experienced the flooding due to nor’easters and large snowfalls. Unfortunately, the majority of the community is susceptible to storm surge inundation of a Category 1 hurricane, and the entire community will likely be submerged under a Category 2 storm. The destruction resulting from a hurricane or major nor’easter could have an immense impact on the community. Failing to install flood vents, elevate low-lying homes, and install proper window protection could threaten historically significant structures, community character, and public safety. Knowing this, existing and new development should be retrofitted or designed to withstand hurricane wind and flood impacts; otherwise, homeowners should be prepared to rebuild or relocate when a major storm impacts Cape May Point. Unquestionably, residents should always evacuate when a hurricane is approaching the Cape May peninsula.
Table 2: Potential Spring Tide and Hurricane Inundation versus the Built Environment CATEGORY
Natural Environment
Cape May Point, Cape May Point State Park, Cape May Migratory Bird Refuge, and surrounding salt and freshwater wetlands all provide significant habitat for wildlife. Cape May Point and the surrounding areas are a well known stopover location for migratory birds, and the beaches of the Delaware Bay are one of the most significant spawning grounds for horseshoe crabs in the world. Dragonflies and monarch butterflies also use Cape May Point as a stopover location during their migration. All of these species rely upon the diverse habitat available in Cape May Point, including beaches, freshwater wetlands, and lush canopy. The vitality of these habitats have previously been challenged, and recently, Cape May Point, the NJDEP Office of Coastal Engineering, the US Army Corps of Engineers and other partners have worked to restore the beaches of Cape May Point and the freshwater wetlands in Cape May Meadows. These collaborative efforts will help reduce the rate at which these resources change or are lost, but will require continuous efforts to maintain the condition of the habitat. Significant storms threaten to disrupt, alter, or destroy existing habitats through erosion, saltwater intrusion, and high winds. Map 5 represents the potential extent of storm surge in relationship to ecosystems in and around Cape May Point. Accelerated rates of sea level rise will challenge the integrity of these natural resources, which may alter or be lost over time.
Social Vulnerability
Approximately, 240 residents live year round in the Borough of Cape May Point. The community consists mainly of married retirees with no children. Residents are well-educated and have a moderate to high income. The most vulnerable populations within the community include elderly and disabled residents. In the event of a coastal storm, all residents will be equally exposed to the impacts of flooding and should evacuate. In order to identify the location of the most susceptible people to coastal storms and to identify the areas of the community to focus evacuation assistance, the New Jersey Office of Coastal Management developed a social vulnerability index for Cape May Point. Many of the socio-economic data inputs were only available at the Census Block Group level, and the community’s low year-round residential population qualified it for only one Census Block Group, limiting the ability to discern where the most vulnerable populations in the community reside. Additionally, the Census does not account for seasonal populations, which are perhaps the most vulnerable residents because they are not aware of their geographic vulnerability, nor are they likely aware of the proper measures to evacuate if a storm threatens the New Jersey shore. By applying the social vulnerability index in a small, vacation community, it was determined that the social vulnerability index does not adequately define the location of the most vulnerable residents in relationship to storm hazards at this scale. Municipal leaders and emergency managers have a greater capability to identify the individuals that may need evacuation or recovery assistance in the event of a storm.
Coastal Vulnerability Index
Inundation mapping can inform planners, emergency managers, and environmental leaders of the potential exposure of built and natural resources and socio-economically vulnerable populations, while a coastal vulnerability index (CVI) can inform local government of land areas that are the most prone to the impacts of coastal hazards. The CVI is a composite, environmental constraint model that incorporates six overarching inputs, including geomorphology, low slopes, flood prone areas, storm surge scenarios, and poorly drained and erosion prone soils. While these factors contribute to the vulnerability of coastal lands, other geospatial factors can be incorporated into a coastal vulnerability index. By combining the available data sets, the CVI revealed that the most hazard prone areas in and around Cape May Point include the freshwater wetlands within Cape May Meadows and the beaches surrounding the community. These vulnerable areas correspond with the National Flood Insurance Program’s designated V-zones and lands within the Coastal Barrier Resource System, both of which are the most risk prone areas within the NFIP.
Map 7: Coastal Vulnerability Index, Cape May Point
Sea Level Rise Vulnerability
Sea level rise is a highly likely threat to Cape May Point over the next century. Historically, Cape May and the surrounding areas have experienced approximately 4 mm/year of sea level rise since 1965. While 4 mm/year appears to be insignificant, if this trend were extrapolated into the future, the peninsula of Cape May will experience 0.4 meters (16 inches) of sea level rise by 210019. Unfortunately, sea level rise in the Delaware Estuary is anticipated to increase 0.5 – 1.5 meters (20 – 60 inches) or greater by 2100 due to glacial and ice sheet melting20. Even under a low scenario, over a third of the properties in Cape May Point will be susceptible to flooding during a spring tide and Sunset Boulevard will be permanently inundated. If sea levels increase by 1.0 meter, the extent of flooding during a spring tide will reflect the extent of inundation during a present day, Category 1 hurricane. And under a 1.5 meter sea level rise scenario, nearly all of the properties in the community will be inundated during a spring tide. The map on the following page reveals the extent of future spring tides, highlighting the threat to Cape May Point over the next century. Residential development and coastal habitats will be the first land areas impacted by sea level rise and the future extent of spring tides. By adding sea level rise into the storm surge scenarios of the coastal vulnerability index, Map 9 indicates how high hazard areas may increase in size and shift inland over time. The beachfront and adjacent freshwater wetlands appear to be very highly vulnerable to coastal hazards, while the majority of Cape May Point becomes highly vulnerable over time. Understanding how the coastal landscape may change due to sea level rise can inform future development and hazard mitigation decisions.
Table 3: Built Environment and Sea Level Rise Inundation
Map 8: Future Spring Tide Inundation, Cape May Point
Map 9: Coastal Vulnerability Change Due to Sea Level Rise, Cape May Point
Getting to Resilience
Cape May Point is governed by a three commission form of government, supported by a number of volunteer organizations within the community. The commissioners and community leaders are dedicated to taking proactive measures to protect the people and properties within the community. Due to staffing constraints, Cape May Point informally participated in the demonstration project. Community leaders from the environmental commission, emergency management, and the planning board provided their knowledge of existing planning documents and local initiatives to complete the Getting to Resilience questionnaire. Through the completion of the questionnaire, the participants identified actions the community has taken to address their vulnerability to coastal hazards and discussed future opportunities to continue to improve their resilience to episodic storm events and gradual changes in the coastal environment. The following are some of the highlights from the five-part questionnaire:
Risk and Vulnerability Assessments
• The Cape May Point portion of the Cape May County Hazard Mitigation Plan identifies the threat and location of potential hazards, along with the existing planning and funding mechanisms to support hazard protection and mitigation.
• State and federally funded beach and wetland restoration projects have required such assessments.
• Beach erosion information is provided through New Jersey’s Beach Profile Network21 maintained by Stewart Farrell, Director of the Coastal Research Center at Richard Stockton College.
Public Engagement
• Municipal leaders provide homeowners with information on storm hazards, evacuation procedures, and the appropriate contents of emergency kits.
• Storm and sea level rise education materials have been disseminated through mailers from the tax payers association.
• Cape May Point’s “Ready” Program is available on the municipal website.
• Information on the Community Rating System, flood hazards, and evacuation routes are also available on the municipal website.
• Emergency managers are challenged by ways to educate and prepare vacationers on storm hazards and evacuation measures.
Planning Integration
• Cape May Point’s Municipal Master Plan identifies coastal hazards as a threat to the community.
• Cape May County’s Hazard Mitigation Plan identifies residential mitigation, stormwater management, wetland maintenance, and dune and beach restoration as actions to reduce community vulnerability to coastal hazards.
• Landscape and Vegetation Plan requirement protects natural habitat to ensure wildlife and migration patterns are not threatened by development; in turn, the planning requirement limits future impervious coverage.
• Flood Hazard Protection Ordinance defines the threat of flood hazards and the construction requirements for new development and substantial improvements in flood hazard areas.
• Stormwater Control Ordinance provides impervious coverage limits and information on nonstructural stormwater management strategies.
Disaster Preparedness and Recovery
• The local government has a community registry to identify the location of vulnerable populations. The registry is available on the municipal website.
• Residents are interested in information on affordable window treatments to deflect wind impacts.
• Residents are interested in flood protection options for non-elevated structures or structures that were built prior to the National Flood Insurance Program.
• County and municipal leaders are concerned that a standard 24-hour evacuation announcement may not provide an adequate amount of time to evacuate Cape May Point residents and vacationers.
Hazard Mitigation and Implementation
• The community has utilized beach replenishment, breakwaters, and dune and wetland restoration to attenuate erosion and habitat loss.
• The community participates in the National Flood Insurance Program’s Community Rating System, helping to provide insurance rate reductions.
• A stormwater pumping system was recently installed to pump excess water from the community and Cape May Meadows back into the bay.
• Municipal height restrictions limit the elevation of existing properties to 10.5-11.5 feet, which may inhibit mitigation options, especially for pre-NFIP structures. The height requirement is intended to protect the existing character of the community.
Cape May Point Findings & Recommendations
Cape May Point is located in one of the most vulnerable locations along the New Jersey shore. Inundation mapping confirmed that Cape May Point’s low elevation makes it highly susceptible to storm surge inundation and sea level rise. Higbee Beach Wildlife Management Area and Cape Island Creek serve as conduits for tidal surges. Not surprisingly, the beaches and freshwater wetlands that surround Cape May Point were revealed as the most vulnerable land areas to coastal hazards under present and future conditions. Because Cape May Point is almost fully developed, the most appropriate measures to ensure the resilience of the community include disaster preparedness and response, structural mitigation, environmental restoration, and recovery planning.
Cape May Point has already taken multiple measures to reduce its vulnerability to erosion, episodic storm events, and accelerated rates of sea level rise. By partnering with the Army Corps of Engineers and the State’s Shore Protection Program, the community has invested in the restoration and maintenance of the protective dunes and beachfront. With efforts of local volunteers, dunes are now well established with vegetation, helping to fortify and defend the community from overwash and storm surge. Through additional collaboration, the community
has made headway in reducing flood threats by installing a stormwater pumping system and restoring Cape May Meadows.
Knowing Cape May Point is vulnerable even under a Category 1 hurricane, the community has taken preemptive measures to inform residents and property owners of the necessity to evacuate if threatened by a hurricane. Local and county emergency managers have identified that the community should evacuate at least 36 hours prior to a storm, even though mandatory evacuations are not typically announced until 24 hours prior to a storm. The Borough has taken the initiative to provide residents with information on storm hazards, the evacuation process, and the suggested contents of emergency and evacuation kits. Additionally, the Borough has developed a local registry of residents that can be used to identify the need for evacuation assistance. While the community utilizes a reverse 911 call system to alert the community of storm threats and evacuation orders, many vacation homes do not have landlines. During the summer months, vacationers are likely the most vulnerable residents within the community because they are not aware of their geographic vulnerability, nor are they aware of the proper measures to evacuate if a storm threatens the shore. As community leaders continue to host public information sessions on storm vulnerability and preparedness, they should explore opportunities to inform vacationers of storm threats and the proper measures to evacuate in time. In addition, emergency managers should continue to collaborate with Cape May County on evacuation, disaster response, and re-entry procedures.
While restoration efforts, public education, and storm preparedness are effective measures to ensure community resilience, Cape May Point can also ensure the community’s resilience through planning and construction standards. Cape May Point has already integrated many measures into its planning and ordinances. The Borough may want to explore redevelopment planning options and pursue additional actions identified in the NFIP’s Community Rating System (CRS). Coinciding with CRS suggested actions and identified needs of residents, community leaders should identify appropriate housing mitigation options that will not only protect homes from flood and wind damage, but also seamlessly fit into the character of the community. Such measures may include the installation of architecturally appropriate storm shutters, flood vents, and the elevation of electric boxes, air conditioning units, and hot water heaters. By providing the public with information on appropriate mitigation options, municipal leaders will be able to further the resilience of the community.
The Borough of Cape May Point has taken many actions to decrease shoreline erosion and flooding, engage the public, and ensure planning consistency. Despite these efforts, the community remains vulnerable to coastal hazards. As climate change threatens the coast, Cape May Point will experience the effects of the lowest projected rates of sea level rise. Higher sea levels will likely result in increased rates of erosion and saltwater intrusion, more frequent flooding, and changes in and loss of critical habitat. While the community may presently be able to defend against the threat of coastal erosion and flooding, these threats will become more of a challenge to resist over the course of time. Over the next century, sea levels around Cape May Point are expected to rise approximately 0.5 – 1.5 meters (20 - 60 inches). Local decisionmakers should be aware of the challenges this will pose on the community as it pursues future restoration projects, mitigation opportunities, and plan updates.
Borough of Little Silver
The Borough of Little Silver was incorporated in 1923 and comprises 2.8 square miles of territory adjacent to the Shrewsbury River.22 There are approximately 6,200 residents and as Little Silver is nearly built out, projected population growth is low (6,370 by 2025).23 As of the 2000 Census, 94.1% of housing units are owner-occupied and the median income for the community’s 2,264 households is $94,094.24 As with neighboring communities, Little Silver is a popular location for people interested in water-related activities. Little Silver’s commuter train station dates back to the 1890’s and is on the National Register of Historic Places.
Little Silver experiences flooding from the Shrewsbury River, Little Silver Creek, Parker’s Creek and Town Neck Creek during heavy rains and coastal events despite elevations averaging around 30 feet (the highest point in the Borough is 80’).25,26 With the extensive exposure to waterways and peninsular nature of the Borough, flood events occur regularly with minor to moderate flooding occurring from nor’easters, high tide and heavy rainfall events. There have been over $3,200,000 in losses paid under the National Flood Insurance Program due to flooding in Little Silver, comprising 156 properties.27
The Borough participated with the County during the development of the county All-Hazard Mitigation Plan, and detail on hazard risk and vulnerability are presented in both tabular and mapped formats in that plan, with overlays that include infrastructure, environment, multiple hazards and storm surge impacts. The Borough is a participant in the multi-jurisdictional Shrewsbury River Flood Warning System. The Little Silver Master Plan identifies land uses, soils, wetlands and other environmental, social and economic features in maps and descriptions, including the 100 and 500-year floodplains, referencing ordinances to protect sensitive environments and hazard-prone areas.
The majority of Little Silver’s land area is also at risk to inundation from storm surge from hurricanes, with the majority of land area modeled to be inundated in a Category 1 or 2 storm surge. Approximately 34 hurricane or tropical storm tracks have passed within 75 miles of Monmouth County since 1850, including nine tropical storms that tracked through the County directly.28 Little Silver has addressed flood hazards and losses through master planning and Borough ordinances.29
22 Monmouth County Planning Board. 2009. Monmouth County at a Glance. p. 26. http://co.monmouth.nj.us/documents/24%5C2009%20At%20A%20Glance%20Report.pdf
23 Ibid., p. 26.
24 Ibid. p. 26.
25 Borough of Little Silver, Emergency Operations Plan, Basic Plan. undated (received 2010).
26 Borough of Little Silver. 2005. Stormwater Management Plan. p. 8.
Unfortunately, climate change threatens to exacerbate the impacts of natural hazards through the increase in intensity and frequency of coastal storms and accelerated rates of sea level rise. Sandy Hook, the closest available tide gauge with historic sea level records, indicates that the northeastern portion of coastal New Jersey has experienced approximately 3.9 mm/year of sea level rise since the early 1900s.30 If this trend were extrapolated without the consideration of glacial and ice sheet melting, this region would experience approximately 0.39 meters (~15 inches) of sea level rise over the next century. By incorporating global climate trends with regional subsidence and accelerated glacial and ice sheet melting, the Mid-Atlantic is actually expected to experience 0.5 – 1.5 meters (20 – 60 inches) or greater of sea level rise by 2100. As climate change alters the natural processes of the New Jersey shore, Little Silver will likely experience increased riverine flooding, shoreline erosion, and greater tidal surges, resulting in increased property damages and the loss of critical wetland habitat.
In order to obtain a better understanding of the vulnerabilities that presently threaten Little Silver, the Coastal Community Vulnerability Assessment Protocol and the Getting to Resilience questionnaire were piloted in the community. By working with municipal leaders, the project team was able to assess the existing vulnerabilities within the community and identify how high hazard areas may shift inland over time due to sea level rise. The partners used this information to validate the hazard planning that the community has already begun to implement and to identify opportunities to incorporate mitigation and adaptation strategies into broader community planning to ensure the community’s long-term resilience.
Vulnerability Assessment
The New Jersey Sea Grant Consortium piloted the NJOCM’s Coastal Community Vulnerability Assessment Protocol in Little Silver as part of the demonstration project. The application of CCVAP not only validated the risk and vulnerability protocol, it allowed the partners to identify infrastructure, natural resources, and vulnerable populations that may be exposed to storm surge inundation and sea level rise. The application of the protocol also informed the partners of the local government’s data and technical needs regarding coastal hazards and sea level rise.
By applying CCVAP, the New Jersey Office of Coastal Management developed multiple inundation scenarios, including mean higher high water, storm surge, and sea level rise models. Newly available three-meter resolution, digital elevation models (DEMs)31 derived from LiDAR technology enhanced the identification of inundation prone areas, helping to improve the accuracy of storm surge maps and identify the inundation threat of sea level rise. Storm surge was modeled using the National Hurricane Center’s Sea, Lake, and Overland Surges from
31 National Geospatial-Intelligence Agency (NGA) and United States Geological Survey (USGS).
Hurricanes (SLOSH)32 at mean higher high water to identify potential inundation at a high tide. Because NOAA’s Vertical Datum Transformation Tool (VDatum)33 does not presently extend to the Shrewsbury River, the elevation of mean higher high water was determined by extrapolating tide data from available gauges along the Shrewsbury and Navesink Rivers.34 While mean higher high water was modeled using the best available information, the tidal heights are likely an underestimation of mean higher high water along the Shrewsbury River, resulting in an underestimation of potential storm surge and sea level rise extents and depths. Lack of tidal data also inhibited the ability to map the potential extent of spring tide inundation under present and future scenarios. As tide data becomes available for the newly installed gauges along the Shrewsbury River, it should be used to improve the accuracy of storm surge and sea level rise models. The tide gauge data may also be used to predict the inundation of future flood events under various rainfall and tidal scenarios, thus providing information that can be used to reduce the threat to human life and property.
The mapping indicated that Little Silver is susceptible to storm surge inundation, which varies throughout the community depending upon topography and the direction and strength of an
approaching hurricane. A Category 1 storm has the potential to flood nearly 12 percent of the parcels within the community, which all are residential properties. Inundation from a Category 2
32 National Hurricane Center. SLOSH Model. http://www.nhc.noaa.gov/HAW2/english/surge/slosh.shtml
34 NOAA. (2010) Tides and Currents. Gauges 8531942, 8531753, and 8531833. http://tidesandcurrents.noaa.gov/gmap3/index.shtml?type=VerifiedData®ion=NewJersey
Figure 8: Elevation Data Improvements
storm could impact approximately 17 percent of the community, exacerbating storm damage with greater storm surge heights. Under both a Category 1 and Category 2 storm, flooding will likely follow the natural features of the community, impacting tidal wetlands and overflowing tidal creeks into low-lying areas. Residential properties along the peninsular portions of the community and Parker’s Creek are the most vulnerable to storm surge inundation.
Hurricanes with different directional paths, strength, and size will have different flood impacts on the community. A Category 1 or 2 hurricane tracking up the Delaware Bay will have the greatest flooding effect on the community when compared to a similar strength storm traveling towards Atlantic City or New York Harbor. A Category 1 and some Category 2 storms could have a similar flood pattern as seen during a major nor’easter. Under some Category 2 scenarios, Monmouth Beach and Seaside Beach will be overwashed, resulting in a much greater surge along the Shrewsbury River. Category 3 and 4 hurricanes are highly likely to result in beach overwash, causing extensive storm surge impacts in Little Silver. Unlike the Category 1 and 2 storms, a Category 3 or 4 hurricane tracking into New York Harbor will cause the greatest surge heights and flood extents within the community. A Category 4 hurricane could flood nearly 50 percent of the municipality’s parcels, and storm surges heights could reach 18 feet in the lowest lying areas of the community.
Table 4 identifies the greatest storm surge heights for any hurricane approaching the community at high tide. 35 While the storm surge maps were developed using the best available surge and tidal information, the accuracy of the extent and flood depths is limited by the lack of tide elevation data throughout the Shrewsbury River and its tidal creeks limits. Additionally, the National Hurricane Center’s SLOSH models do not account for wave action, upland rainfall, or tides that are unable to ebb due to slow moving storms; therefore, Map 10 and Table 4 are likely an underestimation of the worst case flood scenarios in the community.
CATEGORY HURRICANE
35Surge depths modeled with the National Hurricane Center’s SLOSH, three-meter resolution LiDAR, and available tidal gauge data. Accuracy is unknown because USGS and NGA have not released the metadata for the three-meter resolution LiDAR.
Table 4: Potential Water Depths (in feet)
Map 10: Storm Surge Inundation, Little Silver
Built Environment
Little Silver is comprised of single-family homes and distinct commercial districts. By far, residential structures are the most vulnerable portion of the built environment to storm surge inundation, which is reflective in the community’s previous flood losses. Those properties that lie east of Winding Way and Lippincott Road and south of Silverside Avenue are the most flood prone properties within the community. Approximately 12 percent of the community’s parcels are susceptible to the storm surge impacts of a Category 1 hurricane. The floodwaters from a Category 1 storm could make Seven Bridges Road and the eastern portion of both Silverside Avenue and Point Road impassible. A Category 2 storm has the ability to overwash Seaside and Monmouth beaches, resulting in greater floodwaters in the Shrewsbury River. Category 3 and Category 4 hurricanes could have significant flood impacts, inundating nearly half of the community’s properties.
While hurricanes pose a great threat to Little Silver, the majority of the Borough’s facilities are located in elevations that exceed the extent of storm surge inundation. Little Silver’s Public Works and Point Road Elementary School are the most susceptible facilities to flooding. The Volunteer Fire House and Little Silver Train Station are most vulnerable to surge from a Category 4 hurricane. While most municipal and county infrastructure is protected from flood impacts, roads approaching Little Silver from Oceanport are vulnerable to flooding, especially the base of the bridges at Oceanport Avenue and Seven Bridges Road. Emergency managers should be aware of evacuation and reentry alternatives.
Table 5: Potential Storm Surge Inundation versus the Built Environment HURRICANE CATEGORY
PROPERTY ONE TWO THREE FOUR
1. Borough Hall
2. Library & Post Office Museum
3. Volunteer Fire House
4. Public Works
Partial
X X X
5. Point Road Elementary School PartialPartialX X
6. Markham Place School
7. Red Bank Regional High School
8. Montessori School
9. Little Silver Train Station
X
10. Oceanport Ave Commercial Area PartialPartialMost Most
12. Prospect St & Church St Commercial Area- - - Partial
13. St. John’s Episcopal Church PartialPartialX X
14. Embury United Methodist Church
15. Parker Homestead
TOTAL PARCELS (2626 total)
- Partial
Map 11: Built Environment Inundation Vulnerability, Little Silver
Natural Environment
Significant storms threaten to disrupt, alter, or destroy existing habitats through erosion, saltwater intrusion, and high winds. Luckily, the community has taken many measures to preserve and maintain the existing riparian buffers along Little Silver and Town Neck Creeks. Besides bulkheads located along the peninsula of Little Silver Point Road and the placement of dredge spoils along Town Neck Creek, very little alteration to natural riparian buffers has occurred in Little Silver. A wetland mitigation bank along Town Neck Creek is working to restore the creek’s damaged wetlands. Wetlands serve as a sponge for extreme high tides and tidal surges, reducing the flood impacts of tidal surges. Map 12 represents the potential extent of storm surge in relationship to ecosystems in and around Little Silver. Accelerated rates of sea level rise will challenge the integrity of these natural resources, which may be altered or lost over time due to sea level rise. The rate at which this occurs will be dependent upon the rate of sea level rise, upland development prohibiting the migration of tidal wetlands, and the presence of shore protection structures. Preserving, restoring, and creating tidal wetlands will not only mitigate the impacts of coastal storms today, these natural barriers will reduce the impacts of sea level rise.
Map 12: Natural Environment and Inundation Vulnerability, Little Silver
Social Vulnerability
As of the 2000 Census, approximately 6,200 people resided in Little Silver Borough. Residents are well-educated and have a moderate to high income. The distribution of senior citizens, disabled, and non-English speaking households are lower than national averages. Owneroccupancy exceeds 94 percent of the total housing units, indicating an economically stable community. Compared to the rest of Monmouth County and the State of New Jersey, Little Silver has low social vulnerability to coastal storms. Despite this, local government officials and emergency managers may be interested in utilizing a Social Vulnerability Index (SoVI) to identify where to focus preparedness, evacuation, and recovery assistance.
Through the pilot of the SoVI, the New Jersey Office of Coastal Management identified that the least socio-economically vulnerable populations are located in the most surge prone areas of the community. While this is a positive reflection upon the community’s resilience, the application of the methodology revealed that there are limitations in the spatial accuracy of the SoVI. Many of the socio-economic data inputs were only available at the Census Block Group level, of which, Little Silver is only divided into four of these designations. The lack of refined geospatial Census data for this size community limits the ability to adequately discern the location of the most vulnerable populations. The New Jersey Register Ready Program or a local special needs registry may be more effective to identify where to focus preparedness, evacuation, or recovery assistance.
Map 13: Social Vulnerability and Potential Inundation Exposure, Little Silver
Coastal Vulnerability Index
Inundation mapping can inform planners, emergency managers, and environmental leaders of the potential exposure of built and natural resources and socio-economically vulnerable populations, while a coastal vulnerability index (CVI) can inform local government of land areas that are the most prone to the impacts of coastal hazards. The CVI is a composite, environmental constraint model that incorporates six overarching inputs, including geomorphology, low slopes, flood prone areas, storm surge scenarios, and poorly drained and erosion prone soils. While these factors contribute to the vulnerability of coastal lands, other geospatial factors can be incorporated into a coastal vulnerability index. By combining the available data sets, the CVI revealed that the most hazard prone areas in and around Little Silver include tidal wetlands and the low-lying portions of the community that have had repetitive flooding and drainage problems. The CVI is ranked in relationship to the hazards in northern Monmouth County where high resolution elevation data was available.
14: Coastal Vulnerability Index, Little Silver
Map
Sea Level Rise Vulnerability
Over the next century and beyond, sea level rise will threaten natural resources and properties of the Borough of Little Silver. Historically, Sandy Hook and surrounding areas have experienced approximately 4 mm/year of sea level rise since the early 1900s. While 4 mm/year appears to be insignificant, if this trend were extrapolated into the future, Little Silver could expect a minimum vertical inundation of 0.4 meters (16 inches) of sea level rise by 2100. Unfortunately, sea level rise in the Mid-Atlantic is anticipated to exceed this historic trend, increasing 0.5 – 1.5 meters (20 – 60 inches) or greater by 2100 due to glacial and ice sheet melting. Even under a low scenario, approximately 250 parcels in Little Silver would experience some permanent inundation, let alone the potential inundation of future spring tides. A mid-range sea level rise scenario reflects the inundation of a present day Category 1 hurricane, while a 1.5 meter sea level rise scenario would inundate a portion of approximately 16 percent of the parcels in the community.
Map 15 reveals the extent of likely sea level rise inundation in Little Silver over the next century. Coastal habitats and low-lying residential development on the peninsulas will be the first land areas impacted by sea level rise and the future extent of spring tides. Seven Bridges Road and its connection into Oceanport will be threatened by rising waters. Fortunately, properties west of Winding Way will be less likely to experience the impacts of sea level rise, except during a major storm event. Luckily, the majority of Little Silver west of these areas will not be vulnerable to permanent inundation over the next century. Understanding how the coastal landscape may change due to sea level rise can inform future development and hazard mitigation decisions. By incorporating sea level rise into the storm surge scenarios of the coastal vulnerability index, Map 16 indicates how high hazard areas may increase in size and shift inland over time. While areas presently prone to flooding are highlighted as being highly vulnerable, an additional area south of Silverside Avenue and east of Seven Bridges Road will become more susceptible to flooding, storm surge inundation, and sea level rise over the next century.
1. Borough Hall
2. Library & Post Office Museum
3. Volunteer Fire House
4. Public Works
5. Point Road Elementary School
6. Markham Place School
7. Red Bank Regional High School
8. Montessori School
9. Little Silver Train Station
10. Oceanport Ave Commercial Area
11. Branch & Birch Ave Commercial Area
12. Prospect St & Church St Commercial Area-
13. St. John’s Episcopal Church
14. Embury United Methodist Church
15. Parker Homestead
Table 6: Built Environment and Sea Level Rise Inundation
Map 15: Potential Sea Level Rise Inundation, Little Silver
Map 16: Coastal Vulnerability Change Due to Sea Level Rise, Little Silver
Getting to Resilience
The Borough of Little Silver is governed by a mayor-council form of government, which is supported by a number of departments and commissions. A representative from the environmental commission, Monmouth County Planning, and Monmouth County Emergency Management provided their knowledge of existing planning documents and local initiatives to complete the Getting to Resilience questionnaire. Through the completion of the questionnaire, the participants identified actions the community has taken to address their vulnerability to coastal hazards and discussed future opportunities to continue to improve their resilience to episodic storm events and gradual changes in the coastal environment. The following are some of the highlights from the five-part questionnaire:
Risk and Vulnerability Assessments
• Monmouth County’s All Hazard Mitigation Plan identifies the threat of potential hazards and critical facilities at-risk.
• Monmouth County’s All Hazard Mitigation Plan includes a cumulative risk map of each community in the county although it does not include storm surge maps by municipality.
• The Shrewsbury Early Flood Warning System was recently installed and will be used by researchers at Monmouth University and Stevens Institute of Technology to predict flooding.
• Erosion and sea level rise are anticipated to be addressed in the update to the All Hazard Mitigation Plan.
Public Engagement
• Little Silver Police Department is partnering with residents to identify flooding and flood heights in the community at various tidal stages.
• The Boroughs of Little Silver and Shrewsbury, along with the school districts of Red Bank Regional High School, Little Silver and Shrewsbury, participate in the Two River Alert System which allows for a mass notification during an emergency.
• While the community provides access to floodplain maps, there are opportunities to increase public awareness and preparedness education on natural hazards and mitigation.
Planning Integration
• Little Silver’s Municipal Master Plan is contracted to an area consultant. There may be opportunities to incorporate hazard information from the Monmouth County All Hazard Mitigation Plan into future updates.
• Little Silver has a Coastal Wetlands Ordinance intended to maintain the “borough’s natural coastal water courses, coastal wetlands and tidal marshes…prevent damage from erosion or siltation…protect against the loss of vital coastal natural resources…avoid the danger of flood and storm tide damage and pollution,” and protect the quality of these natural resources for “conservation, economics, aesthetics, recreation and other public uses and values.”36
36 Little Silver Borough Ordinances, Chapter 19. http://www.littlesilver.org/ls/Administration/Borough%20Ordinances/Chapter%2019%20Coastal%20Wetlands.pdf
• Flood Damage Prevention Ordinance defines the threat of flood hazards and the construction requirements for new development and substantial improvements in flood hazard areas.
• The Open Space Management Plan identifies floodplain management as a priority.
Disaster Preparedness and Recovery
• The Disaster Preparedness and Recovery portion of the questionnaire was not completed due to scheduling conflicts.
Hazard Mitigation and Implementation
• Through land acquisition of riverine and tidal buffers, the Borough is simultaneously protecting habitat, open space, and natural flood protection.
• The Vivian Chimento Wetlands Mitigation Bank not only restores degraded tidal wetlands, it restores a protective natural buffer.
Little Silver Findings & Recommendations
Little Silver is located along the Shrewsbury River, a tidal system flowing from Sandy Hook and Raritan Bays in northeast Monmouth County. Because the Shrewsbury River terminates at Little Silver’s eastern boundary, extreme high tides, upland rain events, and coastal storms have caused extensive flooding in the low lying portions of the community. Inundation and vulnerability mapping confirmed that portions of Little Silver are highly vulnerable to flooding, as repetitive loss properties already indicate. The low-lying elevations of the community’s peninsulas and tidal wetlands make them highly susceptible to storm surge and sea level rise, but these same features also protect upland development from greater storm impacts. Despite the fact that the community has not sustained the direct impacts of a hurricane, it is vulnerable to these destructive storms. Most of the vulnerable development in Little Silver consists of single-family housing, but the community's public works facility and Point Road Elementary School are also susceptible to storm surge inundation. As climate change threatens to increase the frequency and intensity of coastal storms, additional development in Little Silver will be subjected to coastal flooding. To improve community resilience both today and into the future, Little Silver continues research on the flood patterns of the Shrewsbury River and its tributaries, pursues additional wetland restoration projects, provides public education on flood mitigation, and ensures local plans address hazard vulnerability.
Fortunately, Little Silver has already taken multiple measures to reduce its vulnerability to episodic storm events. With the assistance of New Jersey's Green Acres Program, Little Silver has vested in the protection and restoration of coastal wetlands and riparian open space. Collaboration with neighboring communities and coastal partners has also led to the installation of tide gauges and an early flood warning system, both of which are intended to inform the community about potential flood threats. The Police Department is working with residents to identify when and where flooding occurs and at what flood depths in order to triangulate flood patterns with the tidal stages of the Shrewsbury River. As flood data is collected and analyzed from the public and the tide gauges, the community will be able to identify the potential extent of inundation during different storm events and tidal cycles. Having more accurate flood data will not only inform emergency responders of potential threats in the community, it will also provide residents with information that will help them prepare for storm impacts, thus, reducing storm
damage and financial losses. The most low-lying areas of the community are primarily residential development. Homeowners should be aware of mitigation options, such as elevating outside utilities, installing flood vents and window protection measures. Community leaders should consider hosting public information sessions on storm vulnerability and preparedness, in addition to mitigation options. By providing the public with information on appropriate mitigation options, municipal leaders will further the resilience of the community and reduce property damage.
While restoration efforts, public education, and storm preparedness are effective measures to ensure community resilience, Little Silver should explore opportunities to address hazards in its planning documents and ordinances. Presently, the majority of Little Silver's planning processes and documents are produced by consultants. The Borough may benefit by having a municipal official or employee champion hazard reduction among community planning documents, public works projects, and other future municipal investment. Little Silver has already taken some steps to address hazards by participating in the Community Rating System and adopting the Monmouth County All-Hazard Mitigation Plan. As the municipal master plan, environmental resource inventory, capital improvements projects, and other municipal projects are approved, council members and the planning board should ensure that development decisions appropriately address coastal hazards. By adopting strong development and construction standards, the municipality can also set the tone for potential redevelopment and post-storm reconstruction.
While the Borough of Little Silver has taken many actions to improve its understanding of potential flood impacts, the community remains vulnerable to coastal hazards. As climate change threatens the coast, the Borough will experience the effects of sea level rise. Higher sea levels will likely result in increased rates of erosion, more frequent flooding, and changes in and loss of critical habitat. While the community struggles to defend against the threat of flooding, these threats will become more of a challenge to resist over the course of time. Over the next century, sea levels around Little Silver are expected to rise approximately 0.5 – 1.5 meters (2060 inches). Local decision-makers should be aware of the challenges this will pose on the community as it pursues future restoration projects, mitigation opportunities, plan updates, and public investment projects.
Borough of Oceanport
Oceanport is a primarily residential community located along the Shrewsbury River in Monmouth County bordering Little Silver, Long Branch, and Eatontown. Fort Monmouth occupies 254 acres in Oceanport as well, and is under redevelopment by the Fort Monmouth Economic Revitalization Planning Authority.37 Formed in 1920, the Borough is 3.10 square miles in size and has approximately 6,000 residents. Oceanport is nearly built out, so projected population growth is low (6,108 by 2025).38 Over 85% of housing units are owner-occupied and the median income for the community’s 2,065 households is $71,458.39 Oceanport is a popular destination due to its accessibility to water resources and water-related activities. Monmouth Park Racetrack is also located within Oceanport and creates special considerations for stormwater management within the Borough.40
The waterways impacting Oceanport include the Shrewsbury River, Branchport Creek, Oceanport Creek and Blackberry Creek. Flooding from the Shrewsbury River and the Branchport Creek occurs regularly in the Borough with minor to moderate flooding experienced for most loss events. Oceanport is particularly susceptible to flooding in the northern Port-auPeck section as it is a peninsula into the Shrewsbury River. Significant flood events have occurred in 2010, 2007, 2006, 2005 and 1999, with minor to moderate flooding occurring annually with nor’easters, high tide and heavy rainfall events. There have been over $6,800,000 in losses paid under the National Flood Insurance Program due to flooding in Oceanport, comprising 371 properties.41
The Borough participated with the County during the development of the county All-Hazard Mitigation Plan. Details on hazard risk and vulnerability are presented in both tabular and mapped formats in that plan, with overlays that include infrastructure, environment, multiple hazards and storm surge impacts. The Borough actively investigates the extent and magnitude of tidal flooding, stormwater issues, and possible mitigation projects. The Borough spearheaded the 2010 installation of a multi-jurisdictional flood warning system on the Shrewsbury River.42
The majority of Oceanport’s land area is also at risk to inundation from storm surge from hurricanes, with the majority of land area modeled to be inundated in a Category 1 or 2 storm surge. Approximately 34 hurricane or tropical storm tracks have passed within 75 miles of Monmouth County since 1850, including nine tropical storms that tracked through the County directly.43 Flooding potential from such storms includes heavy rainfall as well as storm surge and tidal impacts on the Shrewsbury River. Coastal hazards are a part of Oceanport’s history and future, as acknowledged by past, present and planned mitigation activities.
37 FMERPA. 2998. Fort Monmouth Reuse and Redevelopment Plan.
38 Monmouth County Planning Board. 2009. Monmouth County at a Glance. p. 39. http://co.monmouth.nj.us/documents/24%5C2009%20At%20A%20Glance%20Report.pdf
39 Ibid. p. 39.
40 Borough of Oceanport. 2009 (revised). Stormwater Management Plan. p. 5-7.
41 Oceanport PD, FEMA NFIP data report.
42 Ibid., p. 6.
43 Monmouth County. 2009. Multi-Jurisdictional Hazard Mitigation Plan – Monmouth County, New Jersey. Section 3a.
Unfortunately, climate change threatens to exacerbate the impacts of natural hazards through the increase in intensity and frequency of coastal storms and accelerated rates of sea level rise. Sandy Hook, the closest available tide gauge with historic sea level records, indicates that the northeastern portion of coastal New Jersey has experienced approximately 3.9 mm/year of sea level rise since the early 1900s.44 If this trend were extrapolated without the consideration of glacial and ice sheet melting, this region would experience approximately 0.39 meters (~15 inches) of sea level rise over the next century. By incorporating global climate trends with regional subsidence and accelerated glacial and ice sheet melting, the Mid-Atlantic is actually expected to experience 0.5 – 1.5 meters (20 – 60 inches) or greater of sea level rise by 2100. As climate change alters the natural processes of the New Jersey shore, Oceanport will likely experience increased riverine flooding, shoreline erosion, and greater tidal surges, resulting in increased property damages and the loss of critical wetland habitat.
In order to obtain a better understanding of the vulnerabilities that presently threaten Oceanport, the Coastal Community Vulnerability Assessment Protocol and the Getting to Resilience questionnaire were piloted in the community. By working with municipal leaders, the project team was able to assess the existing vulnerabilities within the community and identify how high hazard areas may shift inland overtime due to sea level rise. The partners used this information to validate the hazard planning that the community has already begun to implement and to identify opportunities to incorporate mitigation and adaptation strategies into broader community planning to ensure the community’s long-term resilience.
Vulnerability Assessment
The New Jersey Sea Grant Consortium piloted the NJOCM’s Coastal Community Vulnerability Assessment Protocol in Oceanport as part of the demonstration project. The application of CCVAP not only validated the risk and vulnerability protocol, it allowed the partners to identify infrastructure, natural resources, and vulnerable populations that may be exposed to storm surge inundation and sea level rise. The application of the protocol also informed the partners of the local government’s data and technical needs regarding coastal hazards and sea level rise.
By applying CCVAP, the New Jersey Office of Coastal Management developed multiple inundation scenarios, including mean higher high water, storm surge, and sea level rise models. Newly available three-meter resolution, digital elevation models (DEMs)45 derived from LiDAR technology enhanced the identification of inundation prone areas, helping to improve the accuracy of storm surge maps and identify the inundation threat of sea level rise. Storm surge was modeled using the National Hurricane Center’s Sea, Lake, and Overland Surges from
45 National Geospatial-Intelligence Agency (NGA) and United States Geological Survey (USGS).
Hurricanes (SLOSH)46 at mean higher high water to identify potential inundation at a high tide. Because NOAA’s Vertical Datum Transformation Tool (VDatum)47 does not presently extend to the Shrewsbury River, the elevation of mean higher high water was determined by extrapolating tide data from available gauges along the Shrewsbury and Navesink Rivers.48 While mean higher high water was modeled using the best available information, the tidal heights are likely an underestimation of mean higher high water along the Shrewsbury River, resulting in an underestimation of potential storm surge and sea level rise extents and depths. Lack of tidal data also inhibited the ability to map the potential extent of spring tide inundation under present and future scenarios. As tide data becomes available for the newly installed gauges along the Shrewsbury River, it should be used to improve the accuracy of storm surge and sea level rise models. The tide gauge data may also be used to predict the inundation of future flood events under various rainfall and tidal scenarios, thus providing information that can be used to reduce the threat to human life and property.
10: Elevation Data Improvements
NEW DATA OLD DATA
The mapping indicated that Oceanport is extremely susceptible to storm surge inundation, which varies throughout the community depending upon topography and the direction and strength of an approaching hurricane. A Category 1 storm has the potential to flood nearly 25 percent of the parcels within the community, as well as major roads. Inundation from a Category 2 storm could encompass approximately 44 percent of the community, exacerbating storm damage, impacting
46 National Hurricane Center. SLOSH Model. http://www.nhc.noaa.gov/HAW2/english/surge/slosh.shtml
48 NOAA. (2010) Tides and Currents. Gauges 8531942, 8531753, and 8531833. http://tidesandcurrents.noaa.gov/gmap3/index.shtml?type=VerifiedData®ion=NewJersey
Figure
additional residences, and flooding multiple municipal facilities. Residential properties along tidal creeks and historically filled land areas are the most vulnerable to storm surge inundation. The western portion of Monmouth Boulevard and the northern portion of Port au Peck Avenue, which are located on historically filled lands, are inclined to serve as conduits for floodwaters to encroach further inland.
Hurricanes with different directional paths, strength, and size will have different flood impacts on the community. While lower grade storms have less strength, high winds will likely inhibit the typical ebb of tidal waters, forcing a similar flood pattern as seen during a major nor’easter. A Category 1 or 2 hurricane tracking up the Delaware Bay will have the greatest flooding effect on the community when compared to a storm traveling towards Atlantic City or New York Harbor. Some Category 2 storms and all Category 3 and 4 storms will overwash Monmouth Beach and Seaside Beach, resulting in a much greater surge along the Shrewsbury River. A Category 4 hurricane could flood over 80 percent of the parcels within the community, and storm surges heights could reach nearly 20 feet in the lowest lying areas of the community. Unlike the Category 1 and 2 storms, a Category 3 or 4 hurricane tracking into New York Harbor would be expected to cause the greatest surge heights and flood extents in Oceanport.
Table 7 identifies the greatest storm surge heights for any hurricane approaching the community at high tide.49 While the storm surge maps were developed using the best available surge and tidal information, the accuracy of the extent and flood depths is limited by the lack of tide elevation data throughout the Shrewsbury River and its tidal creeks limits. Additionally, the National Hurricane Center’s SLOSH models do not account for wave action, upland rainfall, or tides that are unable to ebb due to slow moving storms; therefore, Table 7 and Map 17 are likely an underestimation of the worst case flood scenarios in the community.
49Surge depths modeled with the National Hurricane Center’s SLOSH, three-meter resolution LiDAR, and available tidal gauge data. Accuracy is unknown because USGS and NGA have not released the metadata for the three-meter resolution LiDAR.
Table 7: Potential Water Depths (in feet)
Map 17: Storm Surge Inundation, Oceanport
Built Environment
Oceanport is mainly comprised of single-family residences, community facilities, Fort Monmouth and minimal commercial development. Residential structures are the most vulnerable to storm surge inundation, which is reflective in the community’s previous flood losses. Properties along Oceanport Creek, Gooseneck Point, and north of Monmouth Boulevard along Port au Peck Avenue are the most vulnerable to a Category 1 hurricane. Much of these developed areas were placed on fill material, and today, they are prone to flooding during major rainfall events and extreme high tides. Besides residential development, municipal facilities are vulnerable to flood damage. The municipal building, police department, library, and public works are all conglomerated at the intersection of Monmouth Boulevard and Myrtle Avenue. Flooding would surround the facility under a Category 1 hurricane, and more severe storms would result in high infrastructure costs, the potential loss of elevation certificates, and many other financial losses to the community. Because this facility and all of the community’s first responder units are susceptible to storm surge inundation, the community must use its only safe public school, Wolfhill Elementary School, as an emergency responders’ evacuation center. The community’s other evacuation shelter, Maple Place School, is vulnerable to storm surge. While the Fort Monmouth Reuse & Redevelopment Plan identifies potential locations for municipal offices and for a new school, the plan locates them in areas that are equally prone to storm surge inundation. Existing and new facilities should be retrofitted or designed to withstand hurricane wind and flood impacts; otherwise, public safety may be impaired and potential damage to municipal facilities could result in unexpected expenses. Similarly, homeowners should be informed of ways to flood-proof their homes. For the time being, Oceanport should seek an agreement with a neighboring community to determine a safe evacuation shelter for its residents.
5. Maple Place Elementary School
6. Wolfhill Elementary School
Calvary Baptist Church
8. Oceanport United Methodist Church
9. Community Center
10. Old Wharf House
11. The Jockey Club
12. Oceanport Gardens 13. Fort Monmouth Historic District
Shrewsbury Sailing & Yacht Club
Monmouth Race Track
Monmouth Park Train Station
Table 8: Potential Storm Surge Inundation versus the Built Environment
Map 18: Built Environment Inundation Vulnerability, Oceanport
Natural Environment
Oceanport is nearly surrounded by tidal waters, and the community contains many parks and recreation areas. Wetlands located along Oceanport Creek and in the wooded area behind the municipal building make up the majority of the established natural habitat within the community. Many low-lying areas in the community that are most vulnerable to frequent flooding and storm surge are located on fill material. While these areas may have once supported wetland buffers, they are nearly void of vegetated storm buffers. Blackberry Park and the Wildlife Preserve support wetland buffers. Horseneck Preserve, east of Fort Monmouth, has been acquired for conservation through New Jersey’s Blue Acres Program. This property will continue to experience flooding and increased rates of erosion. Significant storms and accelerated rates of sea level rise threaten to disrupt, alter, or destroy the natural habitats that remain in the community. Map 19 represents the potential extent of storm surge in relationship to ecosystems in and around Oceanport. Interestingly, Monmouth Park Racetrack, Wolfhill Recreation Area, and Main Street Park are the least vulnerable areas within the community.
Map 19: Natural Environment and Inundation Vulnerability, Oceanport
Social Vulnerability
As of the 2000 Census, approximately 5,800 people resided in Oceanport. Residents are welleducated and owner-occupancy exceeds 85 percent of the housing stock, indicating an economically stable community. While age distributions reflect national averages, the percentage of non-English speaking households, disabled, and poor are lower than national averages. In all, Oceanport has relatively low social vulnerability when compared to the rest of Monmouth County and the State of New Jersey. Despite this, local government officials and emergency managers may be interested in utilizing a Social Vulnerability Index (SoVI) to identify where to focus preparedness, evacuation, and recovery assistance.
Through the pilot of the SoVI, the New Jersey Office of Coastal Management identified that the most surge prone areas were void of socio-economically vulnerable populations with the exception of an area to the East of the Community Center and another area surrounding Oceanport Gardens and The Jockey Club. While the general lack of social vulnerability is a positive reflection upon the community’s resilience, the application of the methodology revealed that Census data for this size community may limit the ability to adequately determine the location of the most vulnerable populations. The New Jersey Register Ready Program or a local special needs registry may be more effective to identify where to focus preparedness, evacuation, or recovery assistance.
Map 20: Social Vulnerability and Potential Inundation Exposure, Oceanport
Coastal Vulnerability Index
Inundation mapping can inform planners, emergency managers, and environmental leaders of the potential exposure of built and natural resources and socio-economically vulnerable populations, while a coastal vulnerability index (CVI) can inform local government of land areas that are most prone to the impacts of coastal hazards. The CVI is a composite, environmental constraint model that incorporates six overarching inputs, including geomorphology, low slopes, flood prone areas, storm surge scenarios, and poorly drained and erosion prone soils. While these factors contribute to the vulnerability of coastal lands, other geospatial factors can be incorporated into a coastal vulnerability index. By combining the available data sets, the CVI revealed that the most hazard prone areas in and around Oceanport include the low-lying portions of the community that have had repetitive flooding and drainage problems. The CVI is ranked in relationship to the hazards in northern Monmouth County where high resolution elevation data was available.
Map 21: Coastal Vulnerability Index, Oceanport
Sea Level Rise Vulnerability
Over the next century and beyond, sea level rise will threaten natural resources and properties of the Borough of Oceanport. Historically, Sandy Hook and surrounding areas have experienced approximately 4 mm/year of sea level rise since the early 1900s. While 4 mm/year appears to be insignificant, if this trend were extrapolated into the future, Oceanport could expect a minimum vertical inundation of 0.4 meters (16 inches) of sea level rise by 2100. Unfortunately, sea level rise in the Mid-Atlantic is anticipated to exceed this historic trend, increasing 0.5 – 1.5 meters (20 – 60 inches) or greater by 2100 due to glacial and ice sheet melting. Without the consideration of future spring tides, 0.5 meters of sea level rise could inundate portions of approximately 370 parcels in Oceanport. A mid-range scenario could flood nearly a quarter of the community’s parcels, while a 1.5 meter sea level rise scenario would be reflective of the inundation of a Category 2 hurricane.
Map 22 reveals the likely extent of sea level rise inundation in Oceanport over the next century. Riverine and low-lying residential development will experience the impacts of sea level rise first. Gooseneck Point will be entirely lost to sea level rise, and Gooseneck Bridge into Little Silver will be threatened by rising waters. Additionally, the southern portion of Fort Monmouth along Oceanport Creek will likely be permanently inundated. Luckily, the redevelopment of Fort Monmouth provides Oceanport with an opportunity to develop in consideration of the coastal hazards that threaten the resilience of the community. Understanding how the coastal landscape may change due to sea level rise can inform future development and hazard mitigation decisions. By incorporating sea level rise into the storm surge scenarios of the coastal vulnerability index, Map 23 indicates how high hazard areas will increase in size and shift inland over time.
Table 9: Built Environment and Sea Level Rise Inundation
1. Municipal Building, Police Dept, Library, Public Works-
Map 23: Coastal Vulnerability Change Due to Sea Level Rise, Oceanport
Getting to Resilience
The Borough of Oceanport is governed by a mayor-council form of government, which is supported by a number of departments and commissions. Representatives from the environmental commission, emergency management, Monmouth County Planning, and Monmouth County Office of Emergency Management provided their knowledge of existing planning documents and local initiatives to complete the Getting to Resilience questionnaire. Through the completion of the questionnaire, the participants identified actions the community has taken to address their vulnerability to coastal hazards and discussed future opportunities to continue to improve their resilience to episodic storm events and gradual changes in the coastal environment. The following are some of the highlights from the five-part questionnaire:
Risk and Vulnerability Assessments
• Monmouth County’s All Hazard Mitigation Plan identifies the threat of potential hazards and critical facilities at-risk.
• Monmouth County’s All Hazard Mitigation Plan includes a cumulative risk map of each community in the county although it does not include storm surge maps by municipality.
• The Shrewsbury Early Flood Warning System was recently installed and will be used by researchers at Monmouth University and Stevens Institute of Technology to predict flooding.
• Erosion and sea level rise are anticipated to be identified as hazards in the update to the Monmouth County All Hazard Mitigation Plan.
Public Engagement
• The All Hazard Mitigation Plan and the Fort Monmouth Reuse & Redevelopment Plan provided residents with the opportunity to participate in the planning process.
• Emergency managers have attempted to reduce flood impacts by informing residents of water depths along flooded roads.
• The municipal website and newsletters serve as the hazard/flood outreach for residents.
• The website contains information on the Community Rating System and flood insurance.
Planning Integration
• The Fort Monmouth Reuse & Redevelopment Plan considers the 100-year floodplain and environmental features in its environmental analysis. While the eastern portion of the redevelopment is considered to be the least economically viable, the plan supports a neighborhood center, housing retail, residential development, and other adaptive reuse of existing buildings. Unfortunately, the redevelopment plan does not consider the extent of potential storm surge.
• The Fort Monmouth Reuse & Redevelopment Plan suggests that Oceanport’s municipal building and a FEMA Headquarter Office relocate to the redevelopment site. The suggested reuse sites are located in a flood hazard area.
• The municipality has a stormwater management plan that identifies low-impact development alternatives.
• The community has a flood damage prevention ordinance.
Disaster Preparedness and Recovery
• Oceanport is recognized by the National Weather Service as Storm Ready.
• Oceanport utilizes NJ’s Register Ready Program to identify the location of vulnerable populations in the event of a hazard.
• The newly installed early flood warning system is expected to inform residents of a potential flood.
• Emergency managers are aware that all municipal buildings are located in highly vulnerable flood areas.
• Emergency managers are aware that Maple Place School, an evacuation shelter, is susceptible to storm surge inundation; therefore, Wolfhill Elementary School would likely be used for a shelter for emergency responders.
• The municipality hosts a substantial amount of flood protection and storm safety information and links on its website.
• Residents may benefit from education workshops on flood protection options for nonelevated structures or structures that were built prior to the National Flood Insurance Program.
Hazard Mitigation and Implementation
• The community has utilized New Jersey Blue Acres funds for the Horse Neck Preserve.
• The community participates in the National Flood Insurance Program’s Community Rating System, helping to provide insurance rate reductions.
• The municipality has submitted grant applications to relocate public buildings outside of flood prone areas, although unsuccessfully.
• The community has utilized Pre-Disaster Mitigation Grant funds.
• Community Development Block Grants have been utilized to improve drainage at flood prone intersections.
Oceanport Findings & Recommendations
The Borough of Oceanport is located along the Shrewsbury River, a tidal system flowing from Sandy Hook and Raritan Bays in the northeastern portion of Monmouth County. Because Oceanport is located at the terminus point of the Shrewsbury River, high tides typically contribute to flooding. Many roads in the community experience flooding during significant rainfall events and nor'easters, including, but not limited to, Monmouth Boulevard, Port au Peck Avenue, Comanche Drive, and Pocano Avenue. Such flooding not only poses a threat to drivers and personal vehicles, it can hinder response times for emergency vehicles. In order to improve their knowledge of flood vulnerability in the community, tide gauges were recently installed at Gooseneck and Oceanport bridges.
The same hydrologic dynamics that make the low-lying portions of Oceanport susceptible to riverine flooding contribute to storm surge and sea level rise inundation. Inundation and vulnerability mapping confirmed that Oceanport is located in one of the most vulnerable portions of Monmouth County. Much of Oceanport's development is located in surge prone areas, while extensive recreational and open spaces are located in the least vulnerable portions of the community. Gooseneck Point and the northeastern portion of the community are extremely vulnerable to storm surge inundation. Unfortunately, most of the community's public facilities,
including the municipal complex and Maple Place Elementary School, lie within flood prone areas. The flood vulnerability of the police department, volunteer firehouses, first aid & rescue facility, and the primary municipal storm shelter threatens public safety. Because Maple Place Elementary School is vulnerable to storm surges, Wolfhill Elementary School has been identified as an evacuation shelter for emergency responders and their families. Oceanport should consider establishing a relationship with neighboring communities to identify shared evacuation shelters for its remaining residents. While the community has begun to address the threat to public safety posed by the flooding of its critical facilities, it has yet to relocate these facilities outside of flood prone areas.
As new development and redevelopment occurs within the community, the Borough should proactively address the threat of flood hazards and environmental constraints through land use planning and building design. Doing so will not only protect public investments, it will ensure that the community is capable of bouncing back quickly in the event of a major storm or disaster. Incorporating stormwater management, open space acquisition, hazard mapping, and hazard mitigation into land use planning is necessary to ensure the Borough's resilience. Regular coordination and collaboration amongst the municipal planning board, emergency managers, engineer and county planners and emergency managers could result in creative ways to build resilience through the various sectors and decision-making within the community. The redevelopment of Fort Monmouth serves as an opportunity to develop in concert with nature, protecting natural resources in addition to private and public investments. Unfortunately, the Fort Monmouth Redevelopment and Reuse Plan proposes the location of new development and the municipal offices to a high hazard area that is prone to flooding and susceptible to storm surge. To influence hazard resilience, the community needs to designate a local champion that is responsible for interagency collaboration and coordination of the Monmouth County All-Hazard Mitigation Plan, the Fort Monmouth Redevelopment and Reuse Plan, and municipal planning and investment.
In addition to planning, emergency preparedness, education, and mitigation are also critical to ensuring the resilience of a community. Oceanport has taken multiple strides to not only inform residents of its flood vulnerabilities, it has also taken many preparatory actions to reduce the vulnerabilities of its residents and its properties. In recent years, Oceanport has been identified as a Storm Ready community by the National Weather Service. The community has also been granted insurance rate reductions through its participation in the National Flood Insurance Program's Community Rating System. The municipal website serves as a resource for homeowners to learn about these programs, storm preparedness, and evacuation processes. Because the majority of the community is comprised of owner-occupied, residential development, Oceanport should focus on providing additional education, resources, and workshops on storm preparedness and mitigation options. Residents may need information on effective storm shudders, flood vents, and the elevation of electric boxes, air conditioning units, and hot water heaters. By providing the public with information on appropriate mitigation options, municipal leaders will be able to further the resilience of the community.
As climate change threatens the coast, higher sea levels will likely result in more frequent flooding, changes in and loss of critical habitat, and increased flood damages. While the community may be able to rapidly recover from flood events, flood threats and expedient
recovery will become more of a challenge over the course of time. Over the next century, sea levels in and around Oceanport are expected to rise approximately 0.5 – 1.5 meters (20 - 60 inches). Local decision-makers should be aware of the challenges this will pose on the community. Adapting land use management, coordinating local and inter-jurisdictional decisionmaking, continuing public education and outreach, and obtaining a better understanding of flood patterns in the Shrewsbury River will build the Borough's capacity to become disaster resilient.
Outreach Findings and Recommendations
New Jersey’s coastline is comprised of varying shoreline types, natural resources, demographics, and levels of development; as a result, its communities have varying degrees of vulnerability to coastal storms and sea level rise. Because of these factors, blanket assumptions cannot be made as to how natural hazards may impact the differing regions of New Jersey’s coastal zone. In order to identify the differences, the New Jersey Sea Grant Consortium and its partners examined vulnerability and resilience indicators in three coastal communities, including the boroughs of Cape May Point, Little Silver, and Oceanport. By piloting the New Jersey’s Office of Coastal Management’s Coastal Community Vulnerability Assessment Protocol and the Getting to Resilience questionnaire, the New Jersey Sea Grant Consortium and its partners were able to discover the coastal hazard vulnerability and challenges of small coastal communities in various regions of the state. The mapping process revealed the environmental constraints within the participating boroughs and identified the physical vulnerabilities of each community. In addition, community outreach opened a dialogue among key players in the communities, helping them to voice their concerns about the existing threats to development and public safety. While each of the communities has varying educational and technical needs to address coastal hazards, some universal needs were identified through the mapping process and questionnaire facilitation.
Coastal Community Vulnerability Assessment Protocol
Coastal communities may not be fully aware of all of the potential impacts of coastal hazards and accelerated sea level rise on their vulnerable populations, infrastructure, and natural resources. While a detailed risk and vulnerability analysis can often qualify communities for mitigation funding, it is often overlooked that this analysis can also help them guide the location of future development. Presently, all three communities rely upon their county all-hazard mitigation plans and coastal research to help inform them of the threats and vulnerabilities of their communities. While these resources are extremely helpful, they do not always address structural, natural, cultural, and demographic vulnerabilities, limiting the community’s awareness. Unfortunately, small communities typically do not have the staff to develop a thorough coastal hazard vulnerability mapping and assessment. The application of the Coastal Community Vulnerability Assessment Protocol helped identify vulnerabilities in the three pilot communities with the anticipation that they will incorporate its findings into future decision-making.
Storm surge and sea level rise maps identified the varying degrees of inundation vulnerability in each of the pilot communities. Cape May Point’s location at the convergence of the Delaware Bay and the Atlantic Ocean make it highly susceptible to all types of coastal hazards. While the community is not presently threatened by shallow coastal flooding, sea level rise will likely cause regular flooding. Unlike Cape May Point, Little Silver and Oceanport are affected by shallow coastal flooding multiple times during the year. The frequency and intensity of flooding will increase as climate change threatens this coastal riverine system. In all three communities, storm surge maps revealed that flood insurance is only required in areas subjected to Category 1 and potentially Category 2 hurricanes. Considering that many homes in these communities are historic in nature or no longer carry mortgages, many homes may be uninsured or underinsured for flooding. As sea levels rise, storm surges will be able to inundate further inland, affecting additional properties that are currently outside of the designated flood zones. It is important for
community leaders and property owners to be aware that the National Flood Insurance Program does not require insurance in all flood prone areas of a community. They should also be aware that sea level rise is not considered in the development of the flood insurance rate maps. As the coastal environment is constantly in flux and properties change ownership, communities should initiate or continue flood, storm, and sea level rise education and outreach.
Utilizing the best available data and geospatial mapping methodologies, the Coastal Community Vulnerability Assessment Protocol helped to characterize the general vulnerabilities in each of the three pilot communities. Despite the fact that the maps are static in nature and do not account for episodic flooding from upland rainfall and waves, or projected erosion rates, the storm surge, sea level rise, and coastal vulnerability indexes were very informative for the identification of development constraints and flood risks in the three pilot communities. As more accurate tide, subsidence, storm surge, erosion, and elevation data becomes available; it can be incorporated into these models. Since the mapping provides the pilot communities with visualizations of their inundation vulnerability, they should consider incorporating the mapping and findings from this report into their planning decisions and all-hazard mitigation plan updates. They should also consider sharing the storm surge and sea level rise maps with their constituents.
Another finding from the application of CCVAP was that a Census-based social vulnerability assessment is not applicable in small municipalities due to the limited number of Census blocks or Census block groups, which inhibits the ability to spatially identify the location of the most vulnerable populations in relationship to hazardous threats. At this scale, municipal leaders and emergency managers should consider using a local registry to capture the location of special needs populations or utilize the existing New Jersey Register Ready Program to identify the individuals who may need preparedness, evacuation, or recovery assistance. In addition, Census data should not be used to identify the location of future vulnerable populations. It is suggested that local governments use storm surge and sea level rise models to identify hazard prone areas where the future development of affordable and low income housing, municipal facilities, schools, and homeless shelters should be avoided. By doing so, communities can proactively limit their susceptibility to coastal hazards.
Getting to Resilience
The facilitation of the Getting to Resilience questionnaire should involve a broad range of municipal officials and community leaders to be most effective. Through the piloting of the questionnaire, the coordination of local stakeholders involved in building community resilience proved to be difficult. Despite the fact that many community leaders were unable to participate in the completion of the questionnaire due to political and/or time constraints, the discussion among the local representatives proved to be productive and gave participants the opportunity to voice their concerns and ideas. The dialogue spurred in each of the communities disclosed the differing job responsibilities of local planners, emergency managers, and environmental commissions. Not only did the process reveal that the various sectors address hazards in different ways, they all use terminology which is specific to their job. Finding common ground and terminology will improve communication and coordination among local government leaders. Future applications of the questionnaire should be expanded to include invitations to local clerks, engineers, building officials, planning board members, town administrators, and council members. Facilitators should also consider completing the questionnaire over a series of
meetings or develop workshops based off of the sections to ensure that community participants can learn about the importance of the various actions identified in each section of the questionnaire. The Getting to Resilience questionnaire exercise can also be repeated as local plans are updated and modified to gauge how well coastal hazard/vulnerability issues are being incorporated in and amongst the various local plans.
Through the facilitation of the Getting to Resilience questionnaire multiple cross-cutting educational and training needs of New Jersey coastal communities were identified. The following represent some of those needs:
• Additional Community Rating System training for local floodplain managers, emergency managers, planners, engineers, and other local decision-makers
• Flood and sea level rise education programs for municipal leaders, residents, and business owners
• Partnerships between neighboring communities and county government to identify additional storm and pet shelters or shared facilitates for neighboring communities
• Storm preparedness and evacuation education, resources, and/or workshops with municipal leaders, residents, and business owners
• Local coordination between county and municipal planners, emergency managers, and consultants in regards to coastal hazards and land use planning
• Mitigation education, resources, and/or workshops for residential property owners on mitigation options for pre-NFIP homes, especially historic homes
• Mitigation funding and grant writing education or workshops for coastal communities
• Training of best management practices in coastal construction for building inspectors, developers, and engineers
Through these community-based climate adaptation demonstration projects, the New Jersey Sea Grant Consortium and its coastal research partners provided three communities and over thirty citizens with information and tools to address local hazard resiliency and reduce vulnerabilities to coastal inundation. The New Jersey Coastal Community Resilience Demonstration Project provided insight on the positive actions that local governments are already taking to adapt to coastal hazards, as well as identify opportunities to strengthen their resilience through local decision-making. The findings from this project also helped to identify the technical training and education needs of coastal communities, and inform the New Jersey Office of Coastal Management of the effectiveness and potential modifications to its vulnerability and resilience evaluation tools. By contributing solutions to coastal issues at the community level and encouraging growth balanced with environmental stewardship, NJSGC will help to empower communities to make sound science-based decisions for planning a sustainable future.
Works Cited
American Factfinder, Census 2000. Oceanport Borough, New Jersey Fact Sheet.
….……Little Silver Borough, New Jersey Fact Sheet.
………Cape May Point Borough, New Jersey Fact Sheet.
Borough of Little Silver. Emergency Operations Plan, Basic Plan. undated (received 2010).
Borough of Little Silver Ordinances. (2010). Chapter 22: Flood Damage Prevention Ordinance.
Borough of Oceanport. (2009). Stormwater Management Plan. (revised).
Borough of Oceanport Police Department. FEMA NFIP data report.
Cape May County Planning Board. (2002). Cape May County Comprehensive Plan. Updated February 15, 2005. http://www.capemaycountygov.net/FCpdf/COMPLAN2002.pdf
Cape May County Board of Chosen Freeholders. (2010). 2010 Disaster Preparedness Conference.
Cape May Point Planning Board. (2007). Borough of Cape May Point Master Plan: March 2007. Updated August 2008. http://www.cmpnj.com/masterplan.pdf
Cutter, S.L.; Mitchell, J.T.; and M.S. Scott. (1997). Handbook for Conducting a GISBased Hazards Assessment at the County Level. Hazards Research Lab, Department of Geography, University of South Carolina.
………(2000). “Revealing the Vulnerability of People and Places: A Case Study of Georgetown County, SC.” Annals of the Association of American Geographers, 90(4). 713-737
Fort Monmouth Economic Revitalization Planning Authority. (2008). Fort Monmouth Reuse and Redevelopment Plan http://www.state.nj.us/fmerpa/library/memoranda.html
Gornitz, V. M., Daniels, R. C., White, T. W., and Birdwell, K. R. (1994). “The Development of a Coastal Risk Assessment Database: Vulnerability to Sea-level Rise in the U.S. Southeast.” Journal of Coastal Research, Special Issue No. 12, p. 327-338.
Hazards & Vulnerability Research Institute. (2008). The SoVI Recipe. Department of Geography, University of South Carolina. http://webra.cas.sc.edu/hvri/docs/SoVIRecipe.pdf .
IHS Global Insight, NJ Tourism: Holding Its Own During Difficult Times (2009). http://www.visitnj.org/sites/visitnj.org/files/tourism-ecom-impact-2008.pdf
Lennon et al. (1996). Living with the South Carolina Coast. Program for the Study of Developed Shorelines (PSDS). Duke University Press. P. 58
Monmouth County Planning Board. (2009). Monmouth County at a Glance. http://co.monmouth.nj.us/documents/24%5C2009%20At%20A%20Glance%20Report.pdf
National Geospatial-Intelligence Agency (NGA) and United States Geological Survey (USGS). Northeastern New Jersey Digital Elevation Model (DEM). Metadata Unavailable.
……… Tides and Currents. Gauges 8531942, 8531753, and 8531833. http://tidesandcurrents.noaa.gov/gmap3/index.shtml?type=VerifiedData®ion=NewJersey
NOAA, National Hurricane Center. SLOSH Model. http://www.nhc.noaa.gov/HAW2/english/surge/slosh.shtml
NOAA, Coastal Services Center. (1999). Community Vulnerability Assessment Tool: New Hanover County, North Carolina. NOAA/CSC/99044-CD. CD-ROM
NOAA, National Geodetic Survey. (2010). Vertical Transformation Tool (VDatum). http://vdatum.noaa.gov
New Jersey Department of Agriculture. (2005). New Jersey Fishing and Aquaculture: Harvesting the Garden State’s Waters. http://www.state.nj.us/seafood/seafoodreport.pdf
New Jersey Department of Environmental Protection (NJDEP), Office of Information Resources Management (OIRM), Bureau of Geographic Information Systems (BGIS). (2010). NJDEP 2007 Land Use/Land Cover Update, Version 20100712 (NJ-GeoWeb Layer)
New York State Sea Level Rise Task Force Report to the Legislature, Draft for Public Comment (November 2010). http://www.dec.ny.gov/docs/administration_pdf/slrtdrpt.pdf
New Jersey Department of Environmental Protection (NJDEP), Green Acres. (1995). NJDEP State Owned, Protected Open Space and Recreation Areas in New Jersey (Version 200812)
The Parliament of the Commonwealth of Australia, Managing our Coastal Zone in a Changing Climate (October 2009). http://www.aph.gov.au/house/committee/ccwea/coastalzone/report/Final%20Report.pdf
Partnership for the Delaware Estuary. 2010. Climate Change and the Delaware Estuary: Three Case Studies in Vulnerability Assessment and Adaptation Planning. http://www.delawareestuary.org/pdf/Climate/Climate%20Change%20and%20the%20Del aware%20Estuary%20&%20Appendicies_PDE-10-01.pdf
Thieler, E.R and E.S Hammar-Klose (1999) National Assessment of Coastal Vulnerability to Future Sea Level Rise: Preliminary Results for the US Atlantic Coast. U.S. Geological Survey, Open File Report 99-593.
U.S. Geological Survey and the New Jersey Department of Environmental Protection. (2007). Digital Elevation Model (DEM), South New Jersey (Cape May, Cumberland and Salem Counties).
Town Residents Paid $600,000 for Sand. It Lasted a Few Days.
Residents who live on Salisbury Beach, a seaside community in northern Massachusetts, paid for the sand dunes to protect their beachfront homes from storms. Then a storm came.
By Lola Fadulu
March 15, 2024
The owners of beachfront homes in the seaside community of Salisbury Beach in northern Massachusetts spent nearly $600,000 to have around 15,000 tons of sand dropped near their properties to protect themselves from future storms.
But the Atlantic Ocean had something else coming. The high tide and winds that pounded the area on Sunday washed nearly half of the sand away, mere days after it was placed.
The storm left the beach area stripped and defenseless before the ocean waters that draw vacationers to that beach town every year.
“People are depressed, discouraged, angry,” said Tom Saab, the president of Salisbury Beach Citizens for Change, a group representing property owners that spearheaded the sand project. “The dunes did their job. They sacrificed themselves to protect the properties — no properties were really damaged.”
The citizens group decided in January to purchase the sand that was placed in midFebruary along a 1.5 mile stretch of Salisbury Beach near the properties, Mr. Saab said. Around 150 buildings line the stretch of beach, including single houses and
condos. The beach stretches for about four miles, and the adjoining properties are estimated to be collectively worth $2 billion, he said.
The sand dune project came to be after Salisbury Beach had been hit hard by storms over the past couple of months. It was inundated by a high tide and a nor’easter in December 2022, which “devastated” the beach, said Mr. Saab, who has lived on Salisbury Beach for decades.
In January, two more nor’easters hit the area, he said.
“Those two storms basically wiped the whole beach out,” Mr. Saab said of the January storms. “Properties were damaged — decks were destroyed,” he said, adding that stairways and patios had been damaged too. “One home was condemned, not allowed to be lived in,” he said.
In an effort to take matters into their own hands, the citizens group initiated the sand project in mid-February, raising the required funds from property owners. It had wrapped up the project last week, on Wednesday, March 7. It was cause for celebration, just a few days before the next washout.
“Everybody had beautiful dunes, all paid for out of their own pockets not a penny from the State of Massachusetts at all,” Mr. Saab said. “We built this one and a half miles of beach ready to protect us.”
Then the nor’easter landed and took 50 percent of the sand and an estimated $300,000 worth of work, according to the group.
Two access points to the Salisbury Beach State Reservation were closed on Sunday and remained closed on Thursday because of storm damage, according to the Massachusetts Department of Conservation and Recreation.
Some area residents are calling for help from state leaders. They contend that state officials should chip in, partly because the protection afforded by the dunes extends beyond their properties to the infrastructure of the town and the state. The beach has received state and federal assistance before.
3/25/24, 9:49AM
BeachTown Residents Paid $600,000 for Sand It Lasted a Few Days -The NewYorkTimes
The state “remains in regular communication with representatives from the town, the legislative delegation and the community and will continue to work with them to address the impacts of erosion at the beach,” said a spokeswoman for the state’s Conservation and Recreation Department.
It is not uncommon for the East Coast to be struck by nor’easters and other storms, according to the National Center for Atmospheric Research.
About half of Salisbury Beach properties have been owned by the same families since the period from the 1950s to the 1970s, and those owners are loath to renounce their ocean views, Mr. Saab said.
“Nobody wants to give up,” he said. “I will never give up on protecting Salisbury Beach.”
Lola Fadulu reports on the New York City region for The Times. More about Lola Fadulu
A version of this article appears in print on , Section A, Page 9 of the New York edition with the headline: Beach Residents Paid $600,000 for Sand to Protect Homes. It Lasted a Few Days.