

Existing and Future Conditions: A Graphical Summary

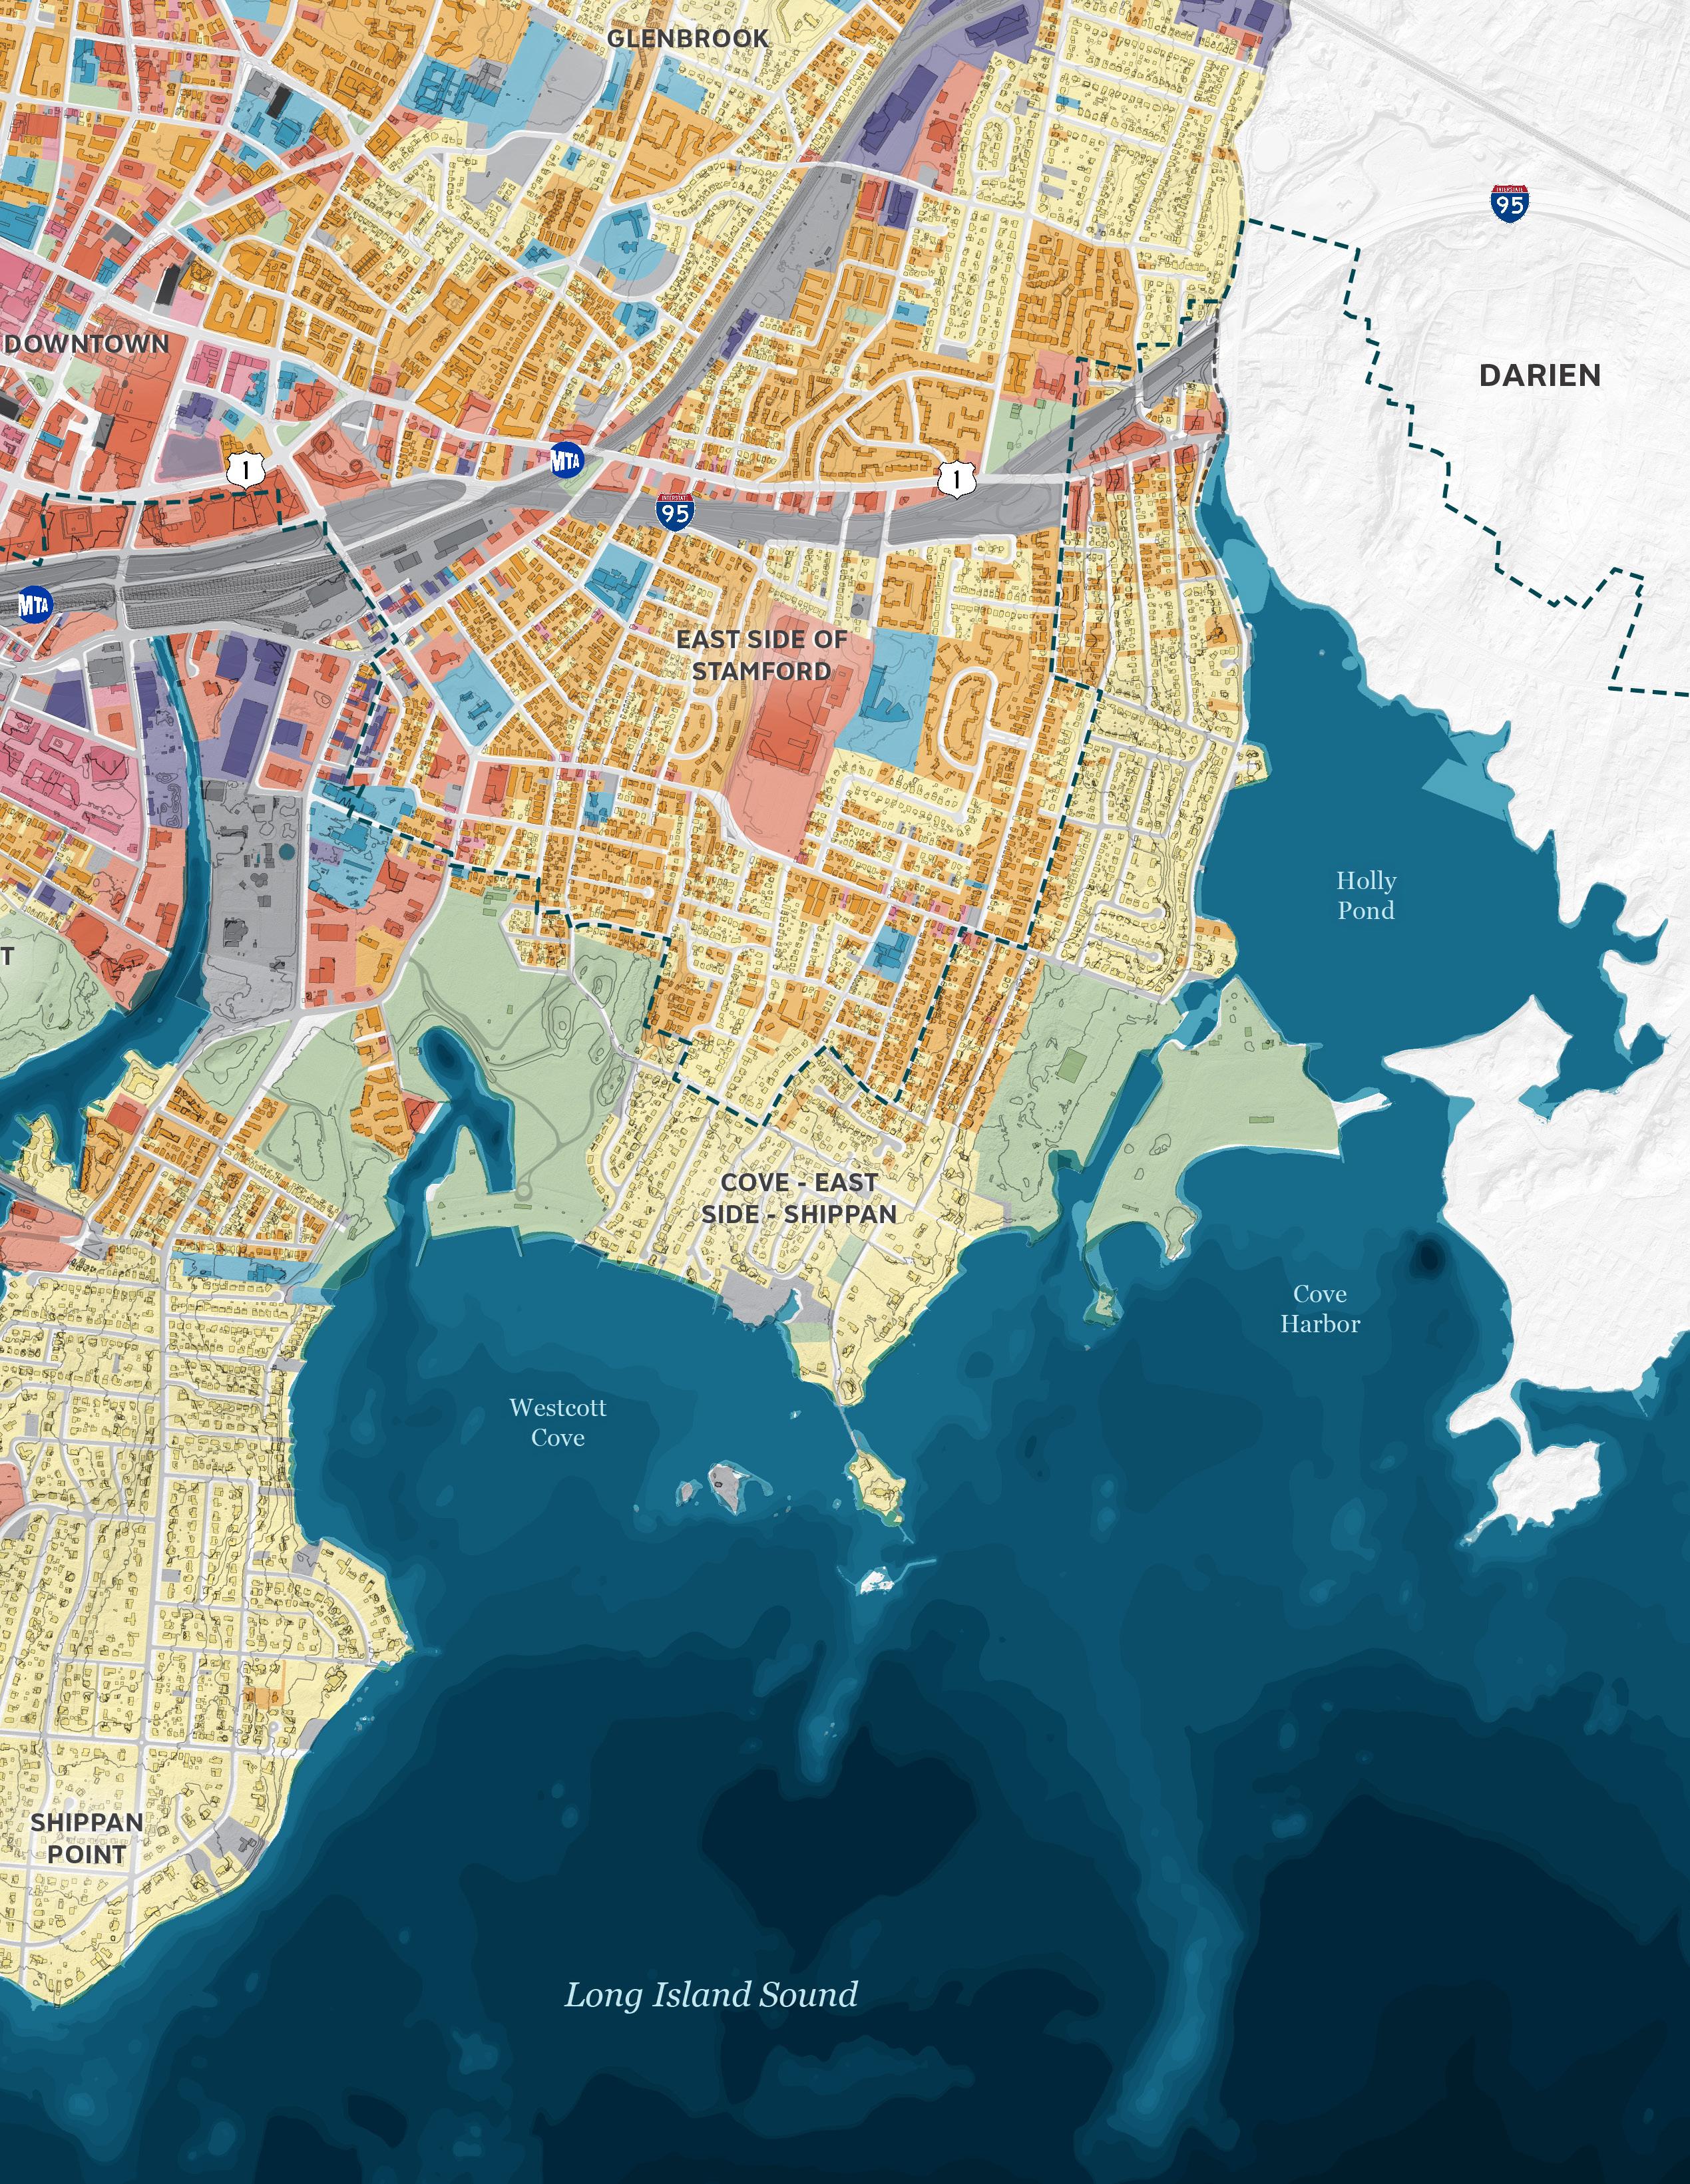
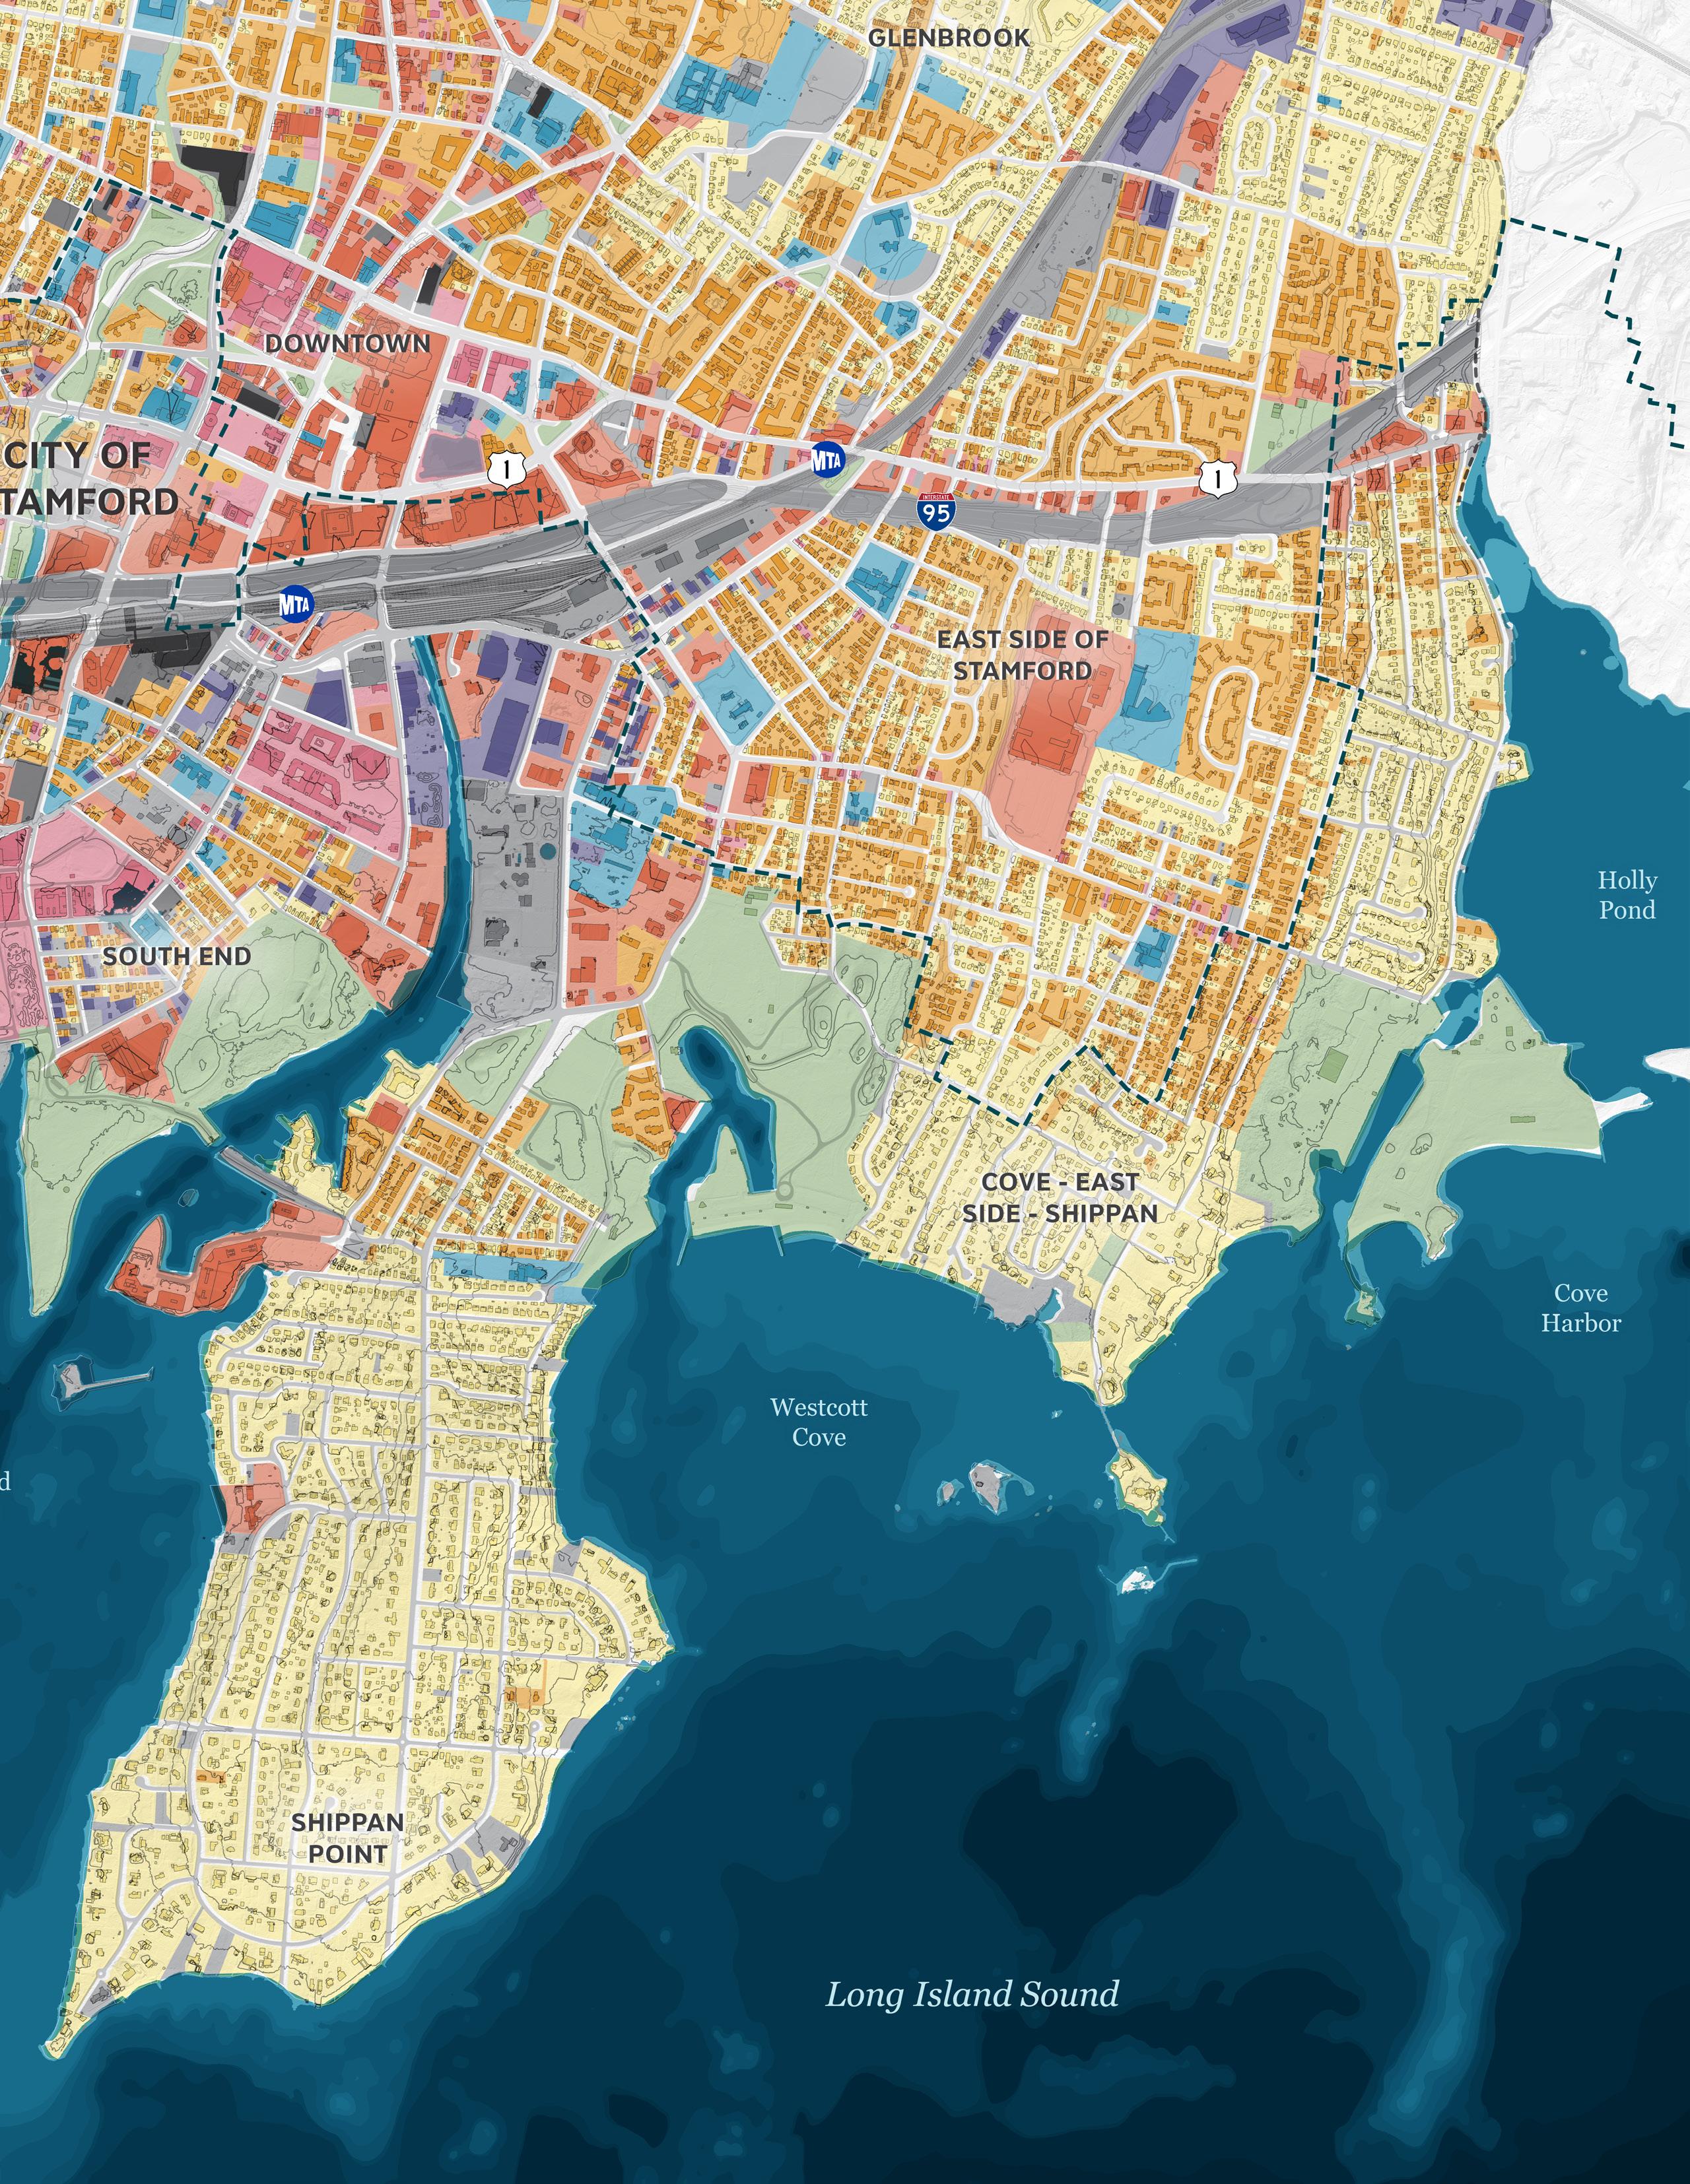
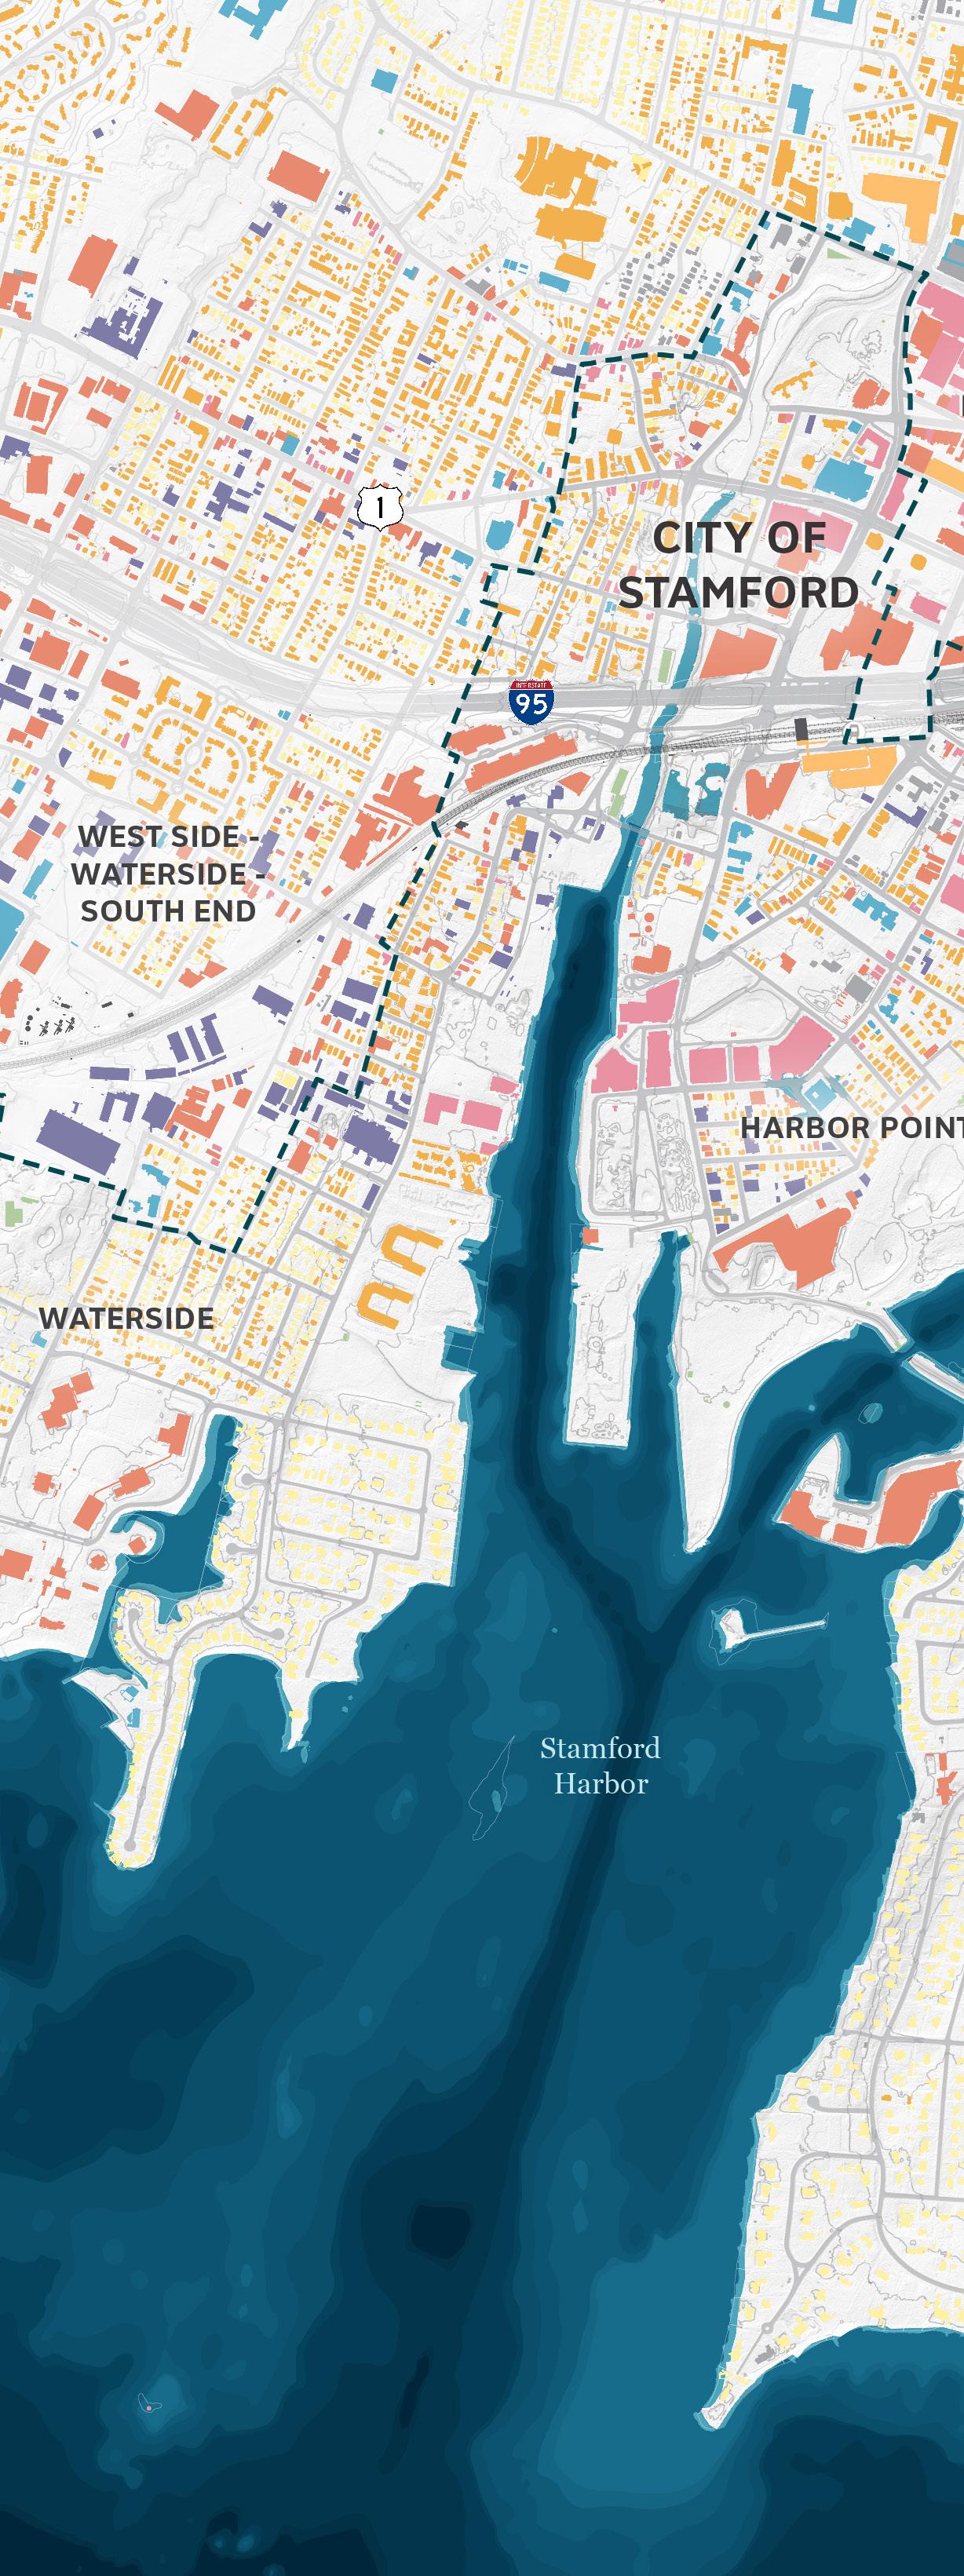
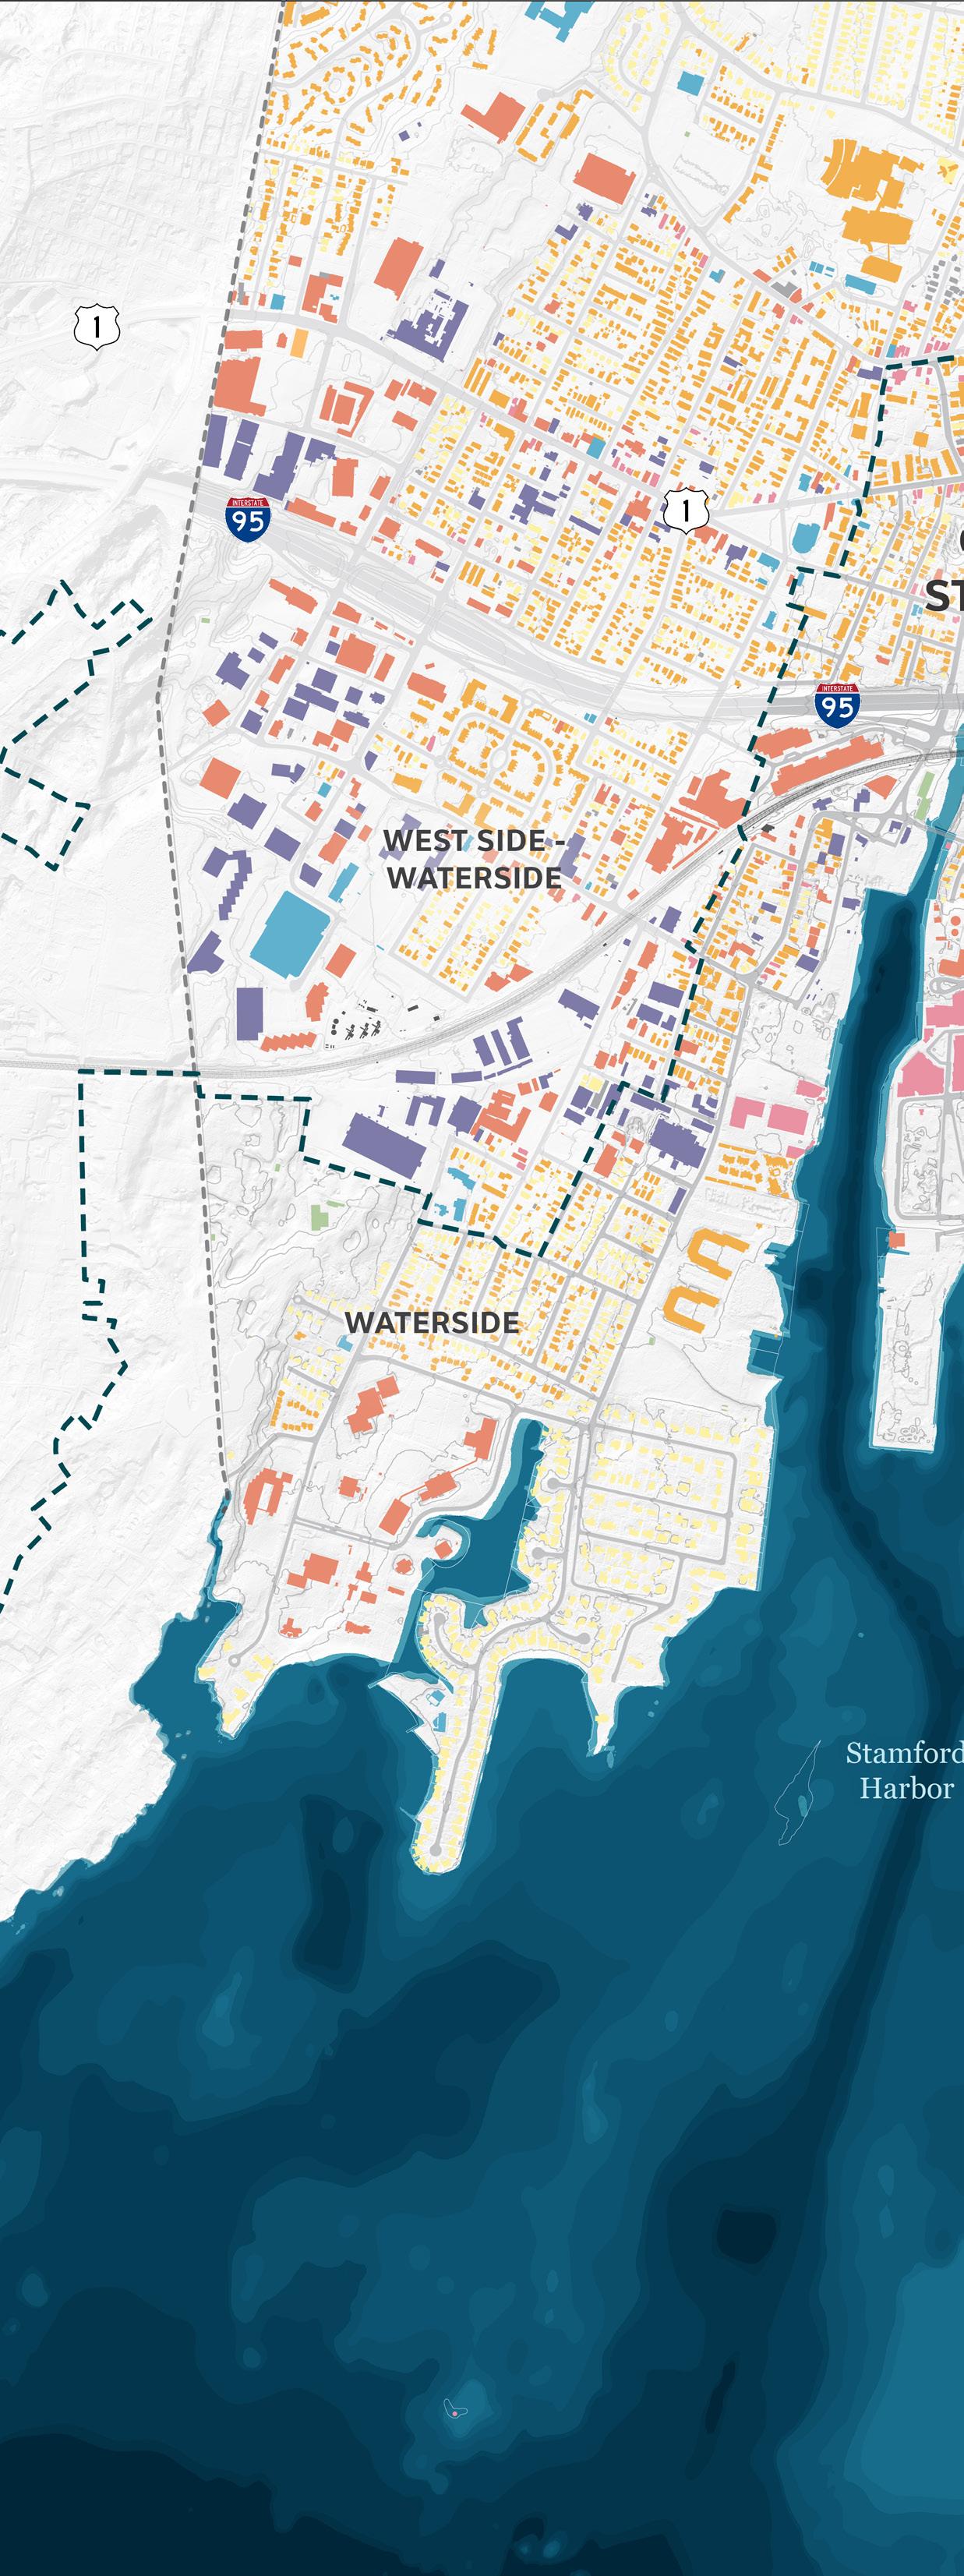
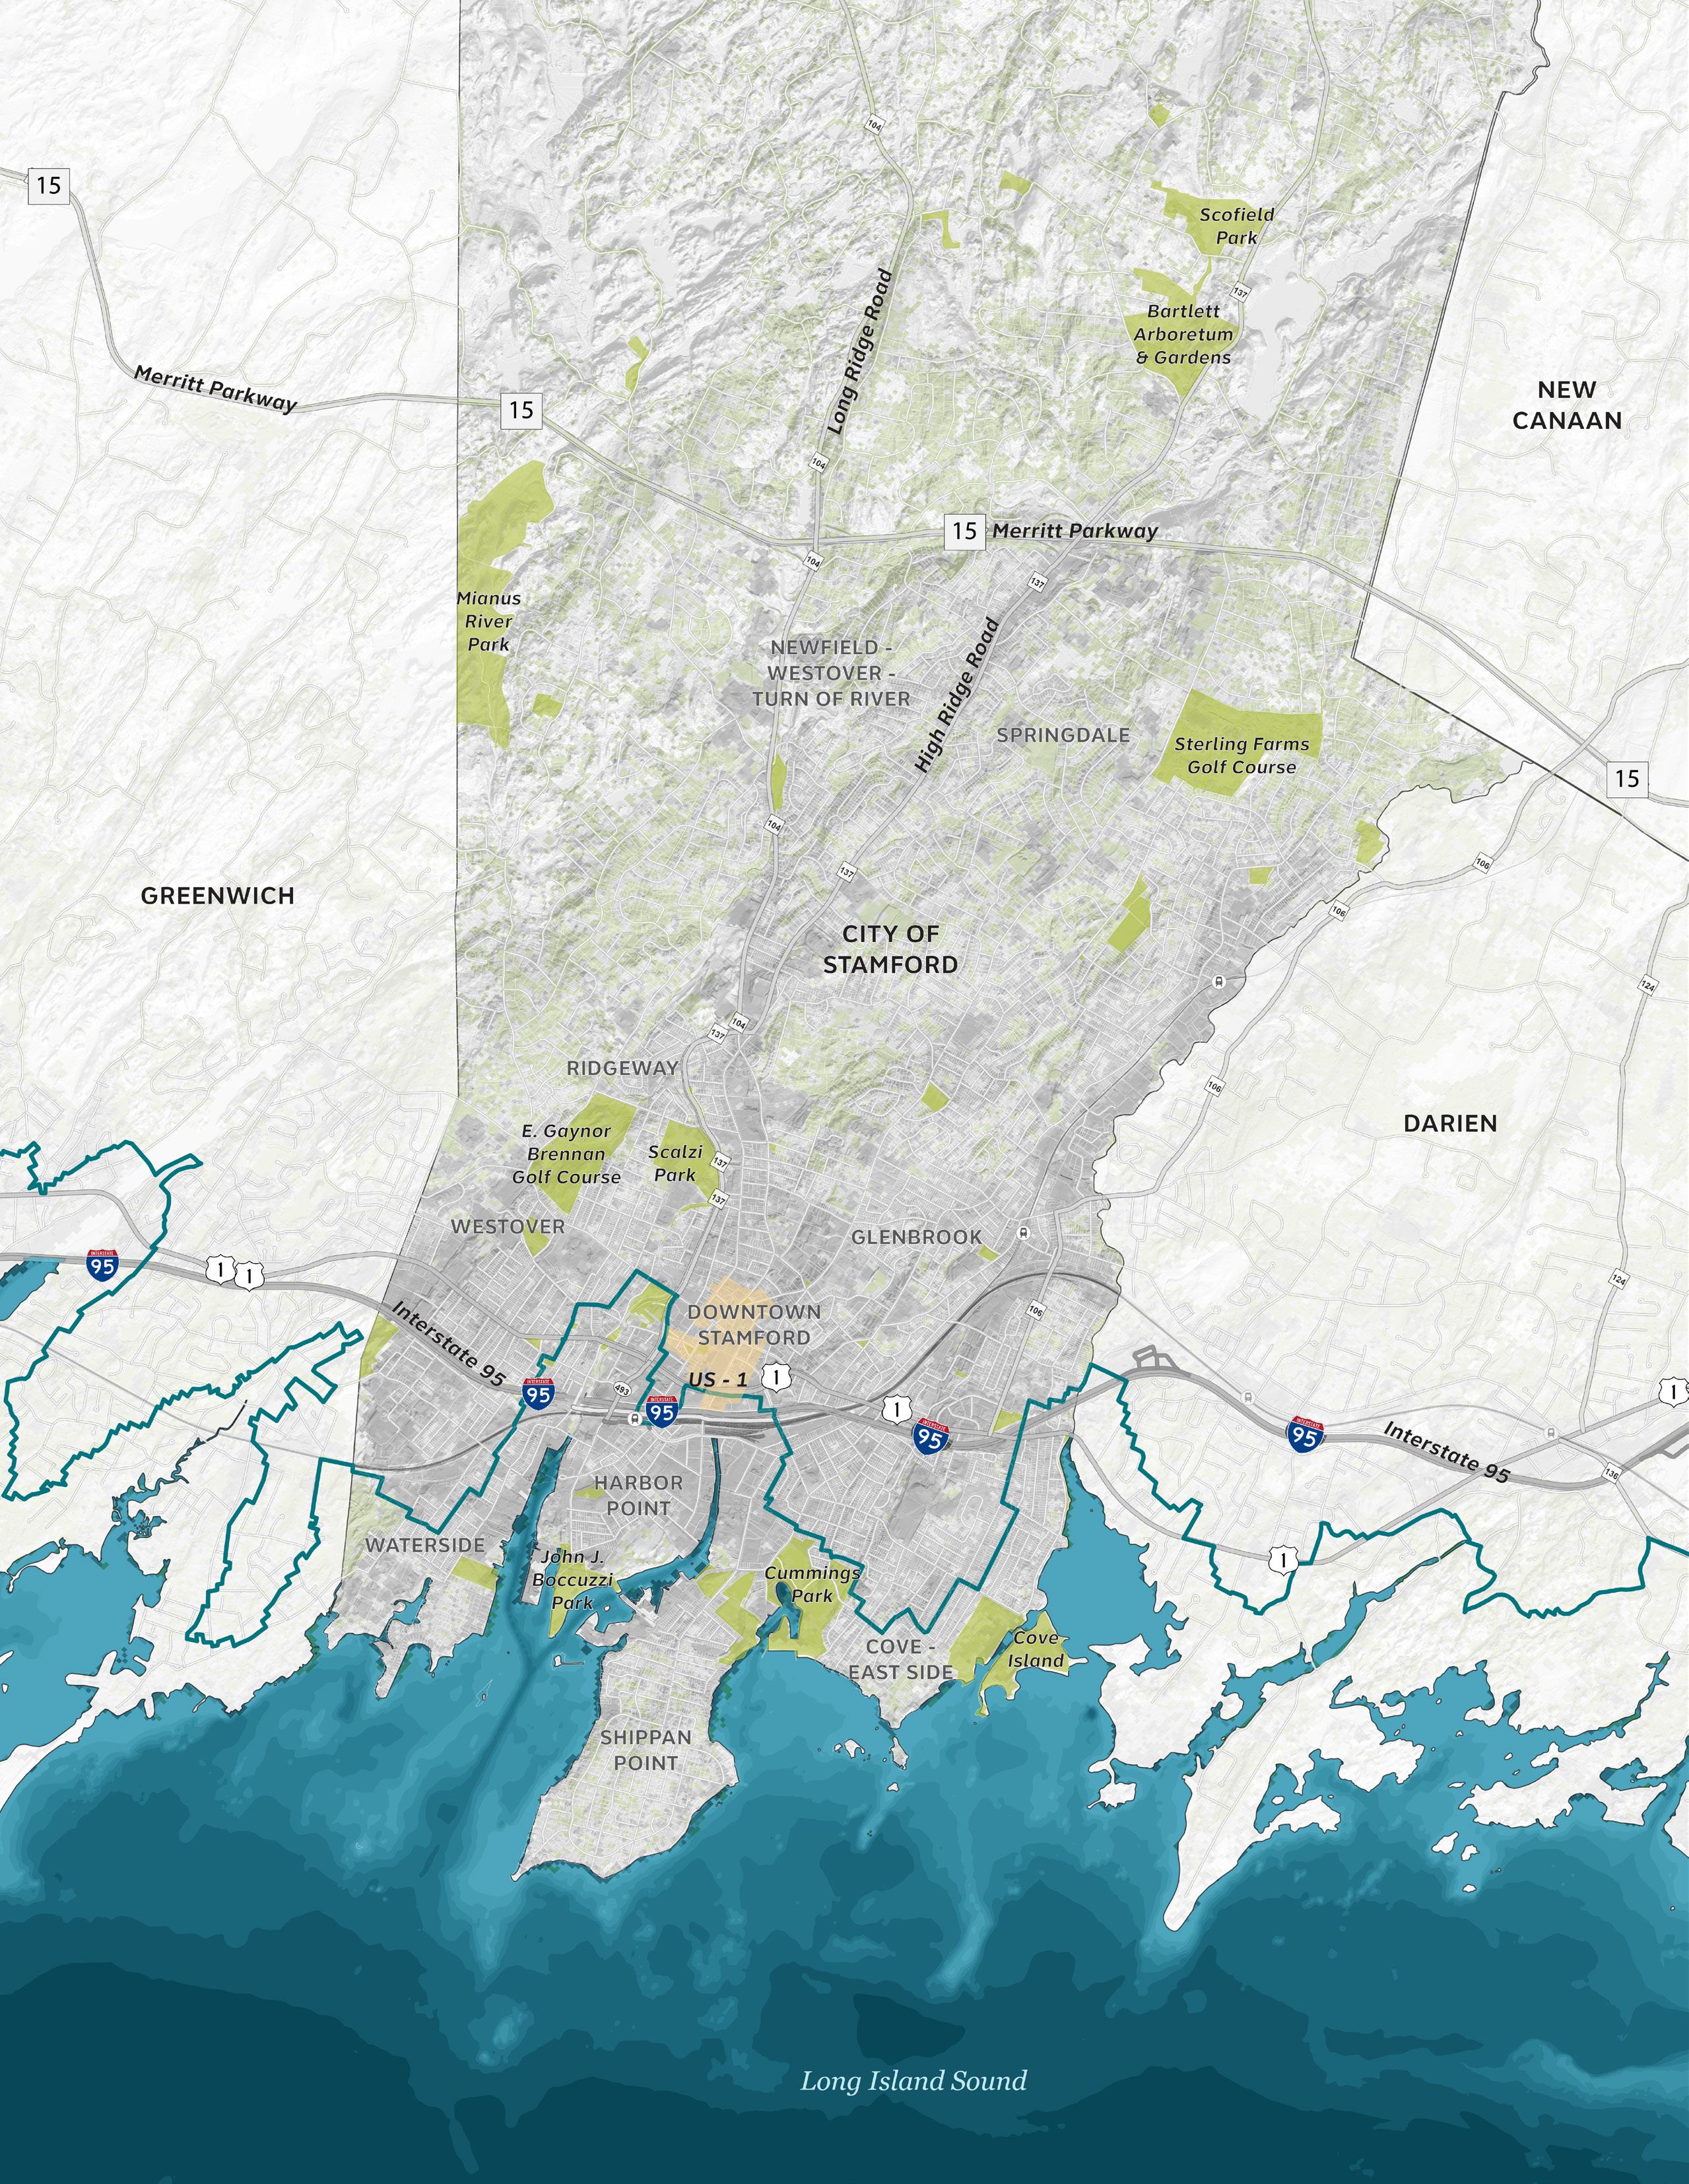
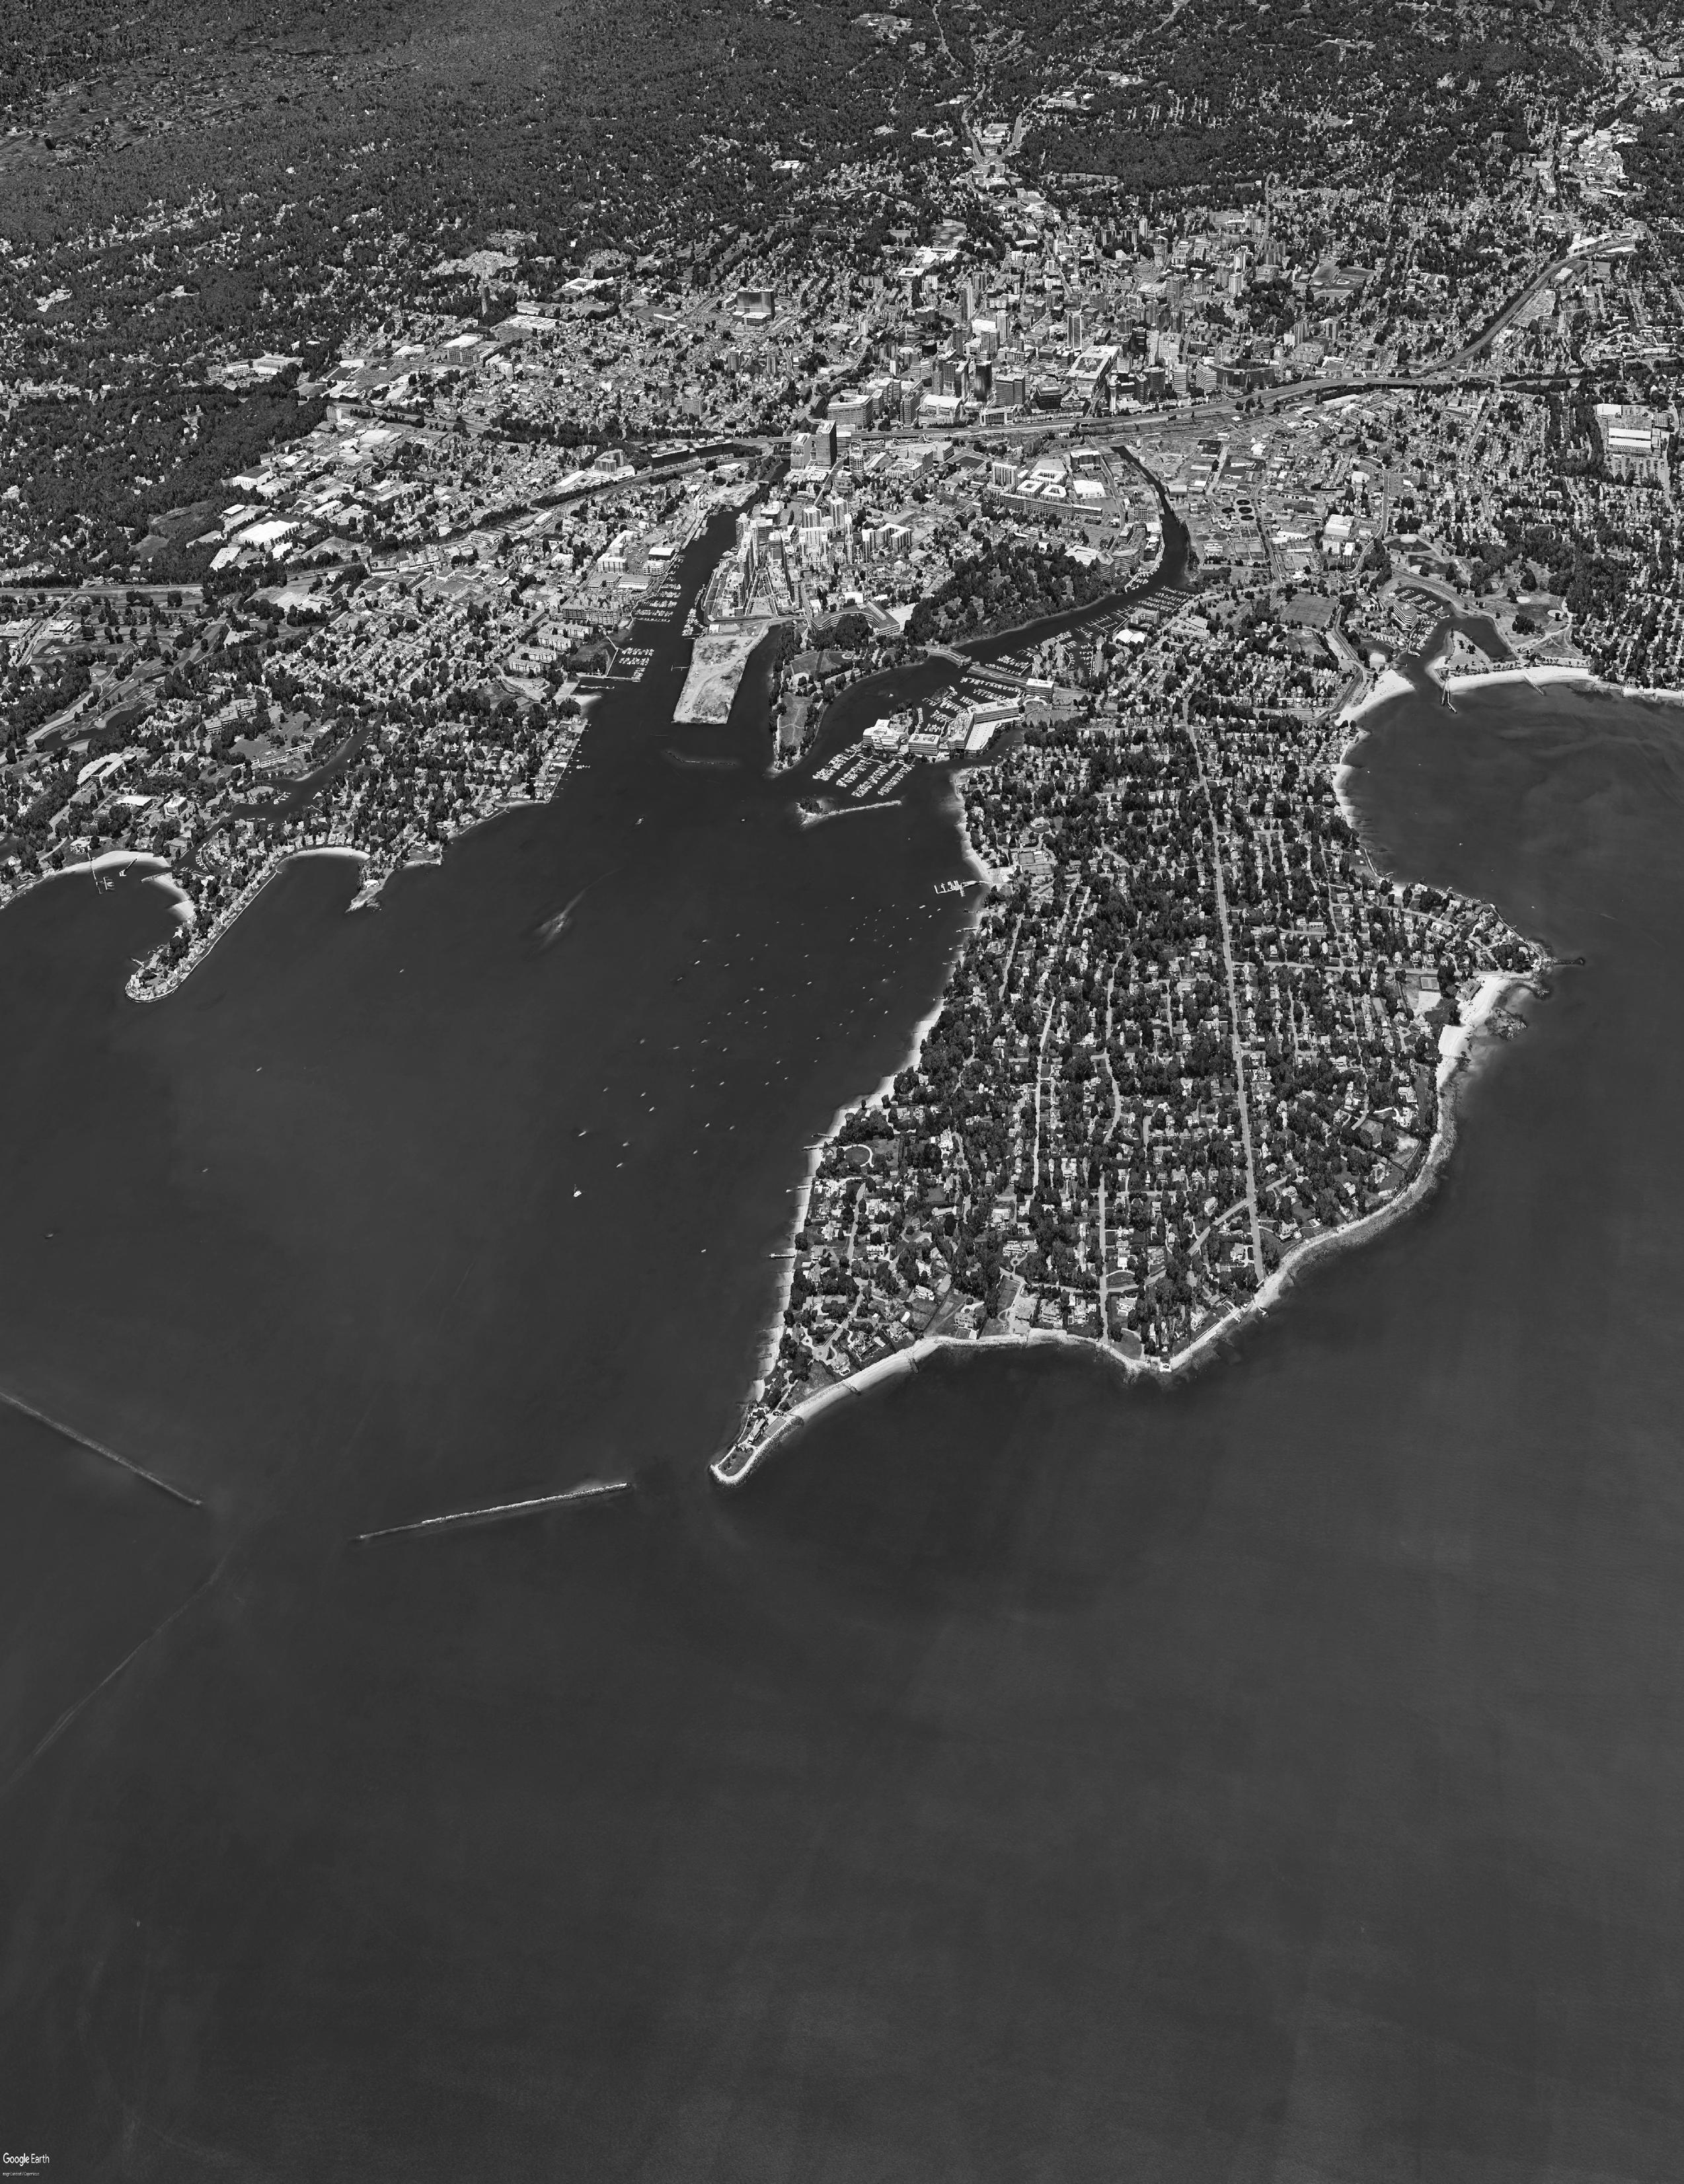
The City of Stamford is situated along the Long Island Sound, approximately 35 miles northeast of New York City. The City’s growth and development have long been shaped by its proximity to the ocean and Rippowam River, which have supported various water-dependent industries over time and provided scenic and recreational opportunities for members of the community.
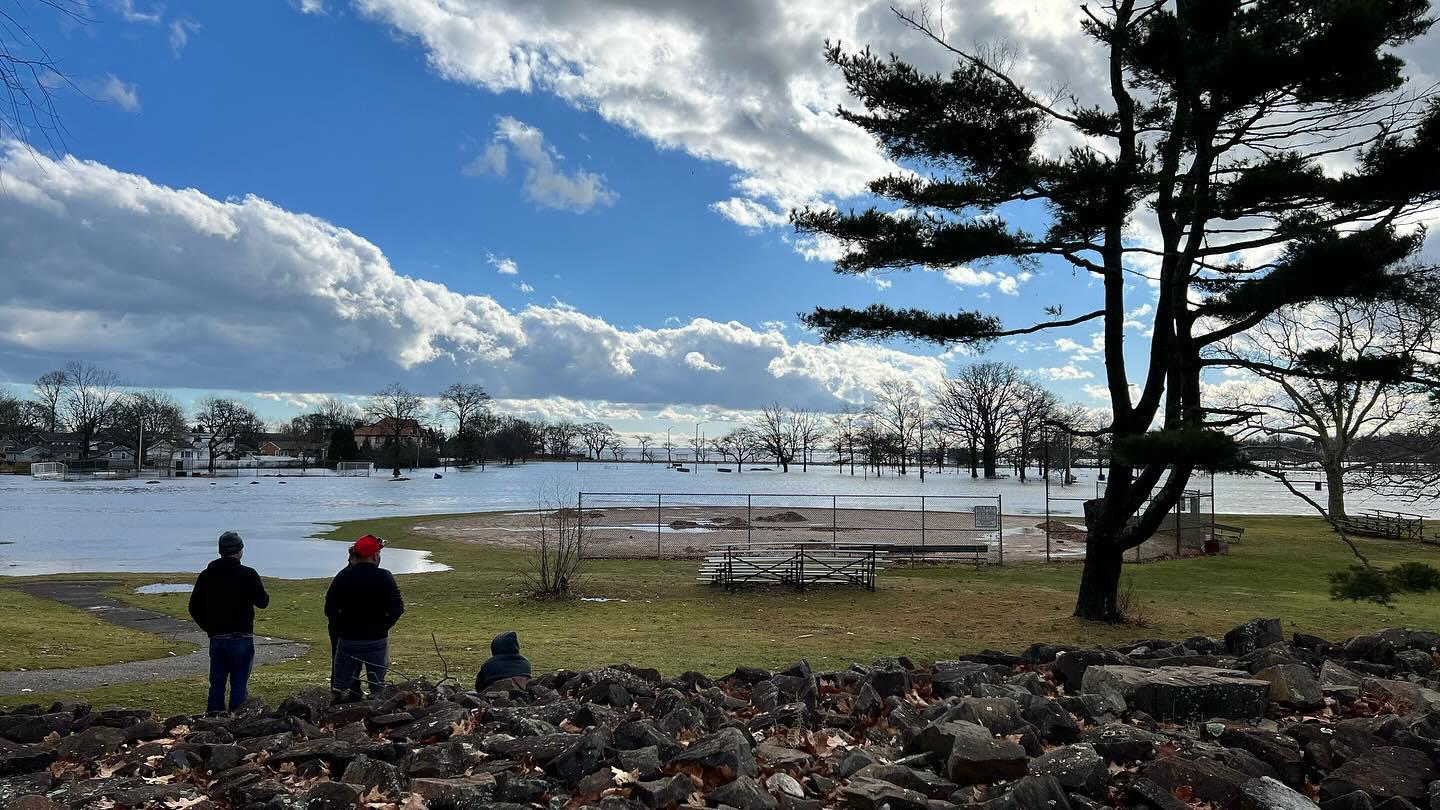
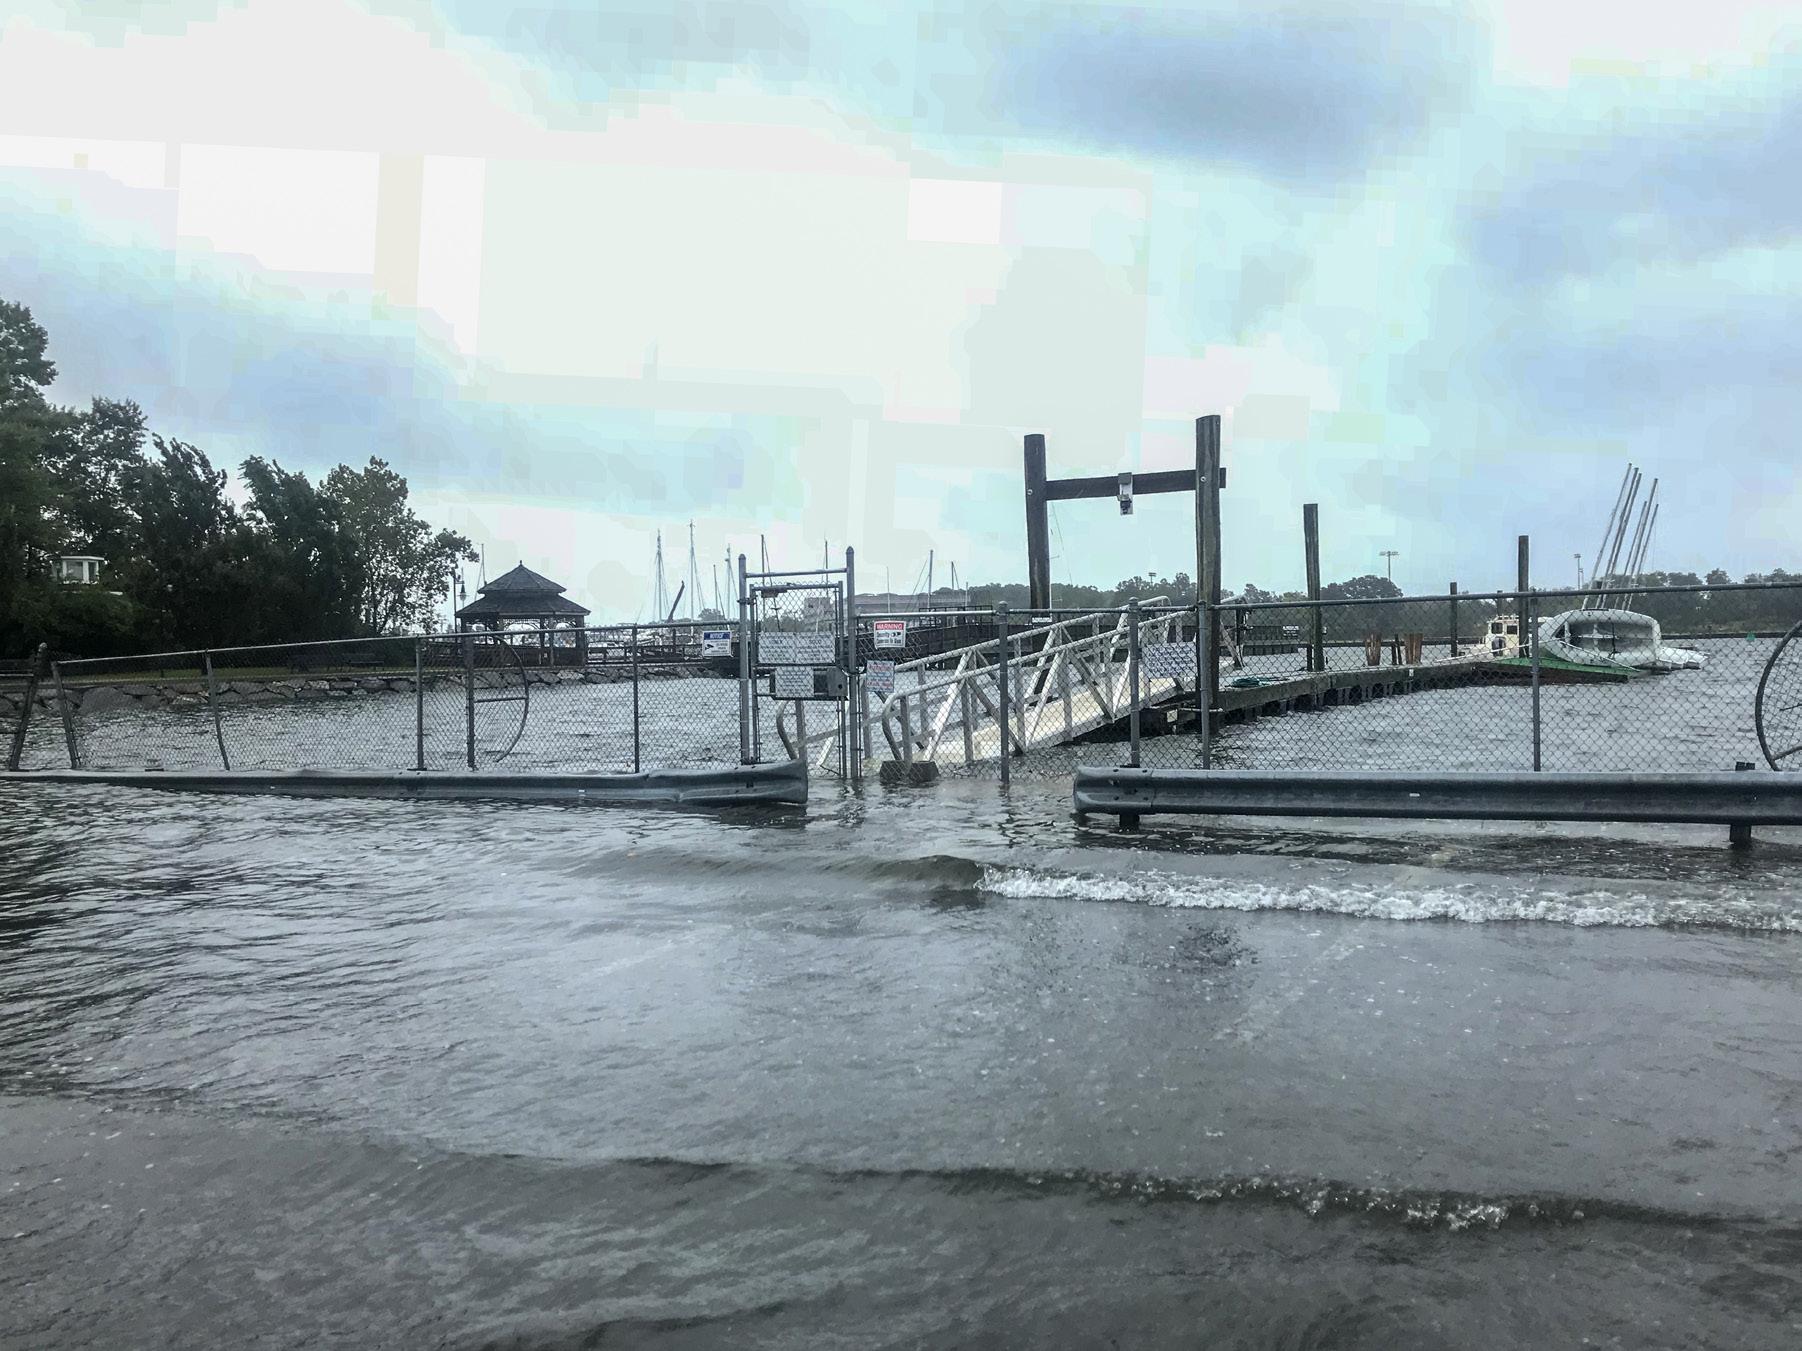
As experiences with recent coastal storms in Stamford have shown, coastal flooding poses a serious hazard to homes, businesses, and communities across the City—especially in the southern areas of Stamford surrounding the inner harbor where there is a higher concentration of commercial development, transportation and other critical infrastructure, and priority populations.1 As the climate continues to
change, rising sea levels and more intense storms are likely to amplify the impacts of coastal flooding. This graphical summary presents maps and brief highlights related to Stamford’s coastal resources, demographic composition, and spatial layout, along with information on Stamford’s existing and future coastal flood risk. Altogether, these maps help foreground where and in what ways the City may be vulnerable to coastal flooding now and into the future.
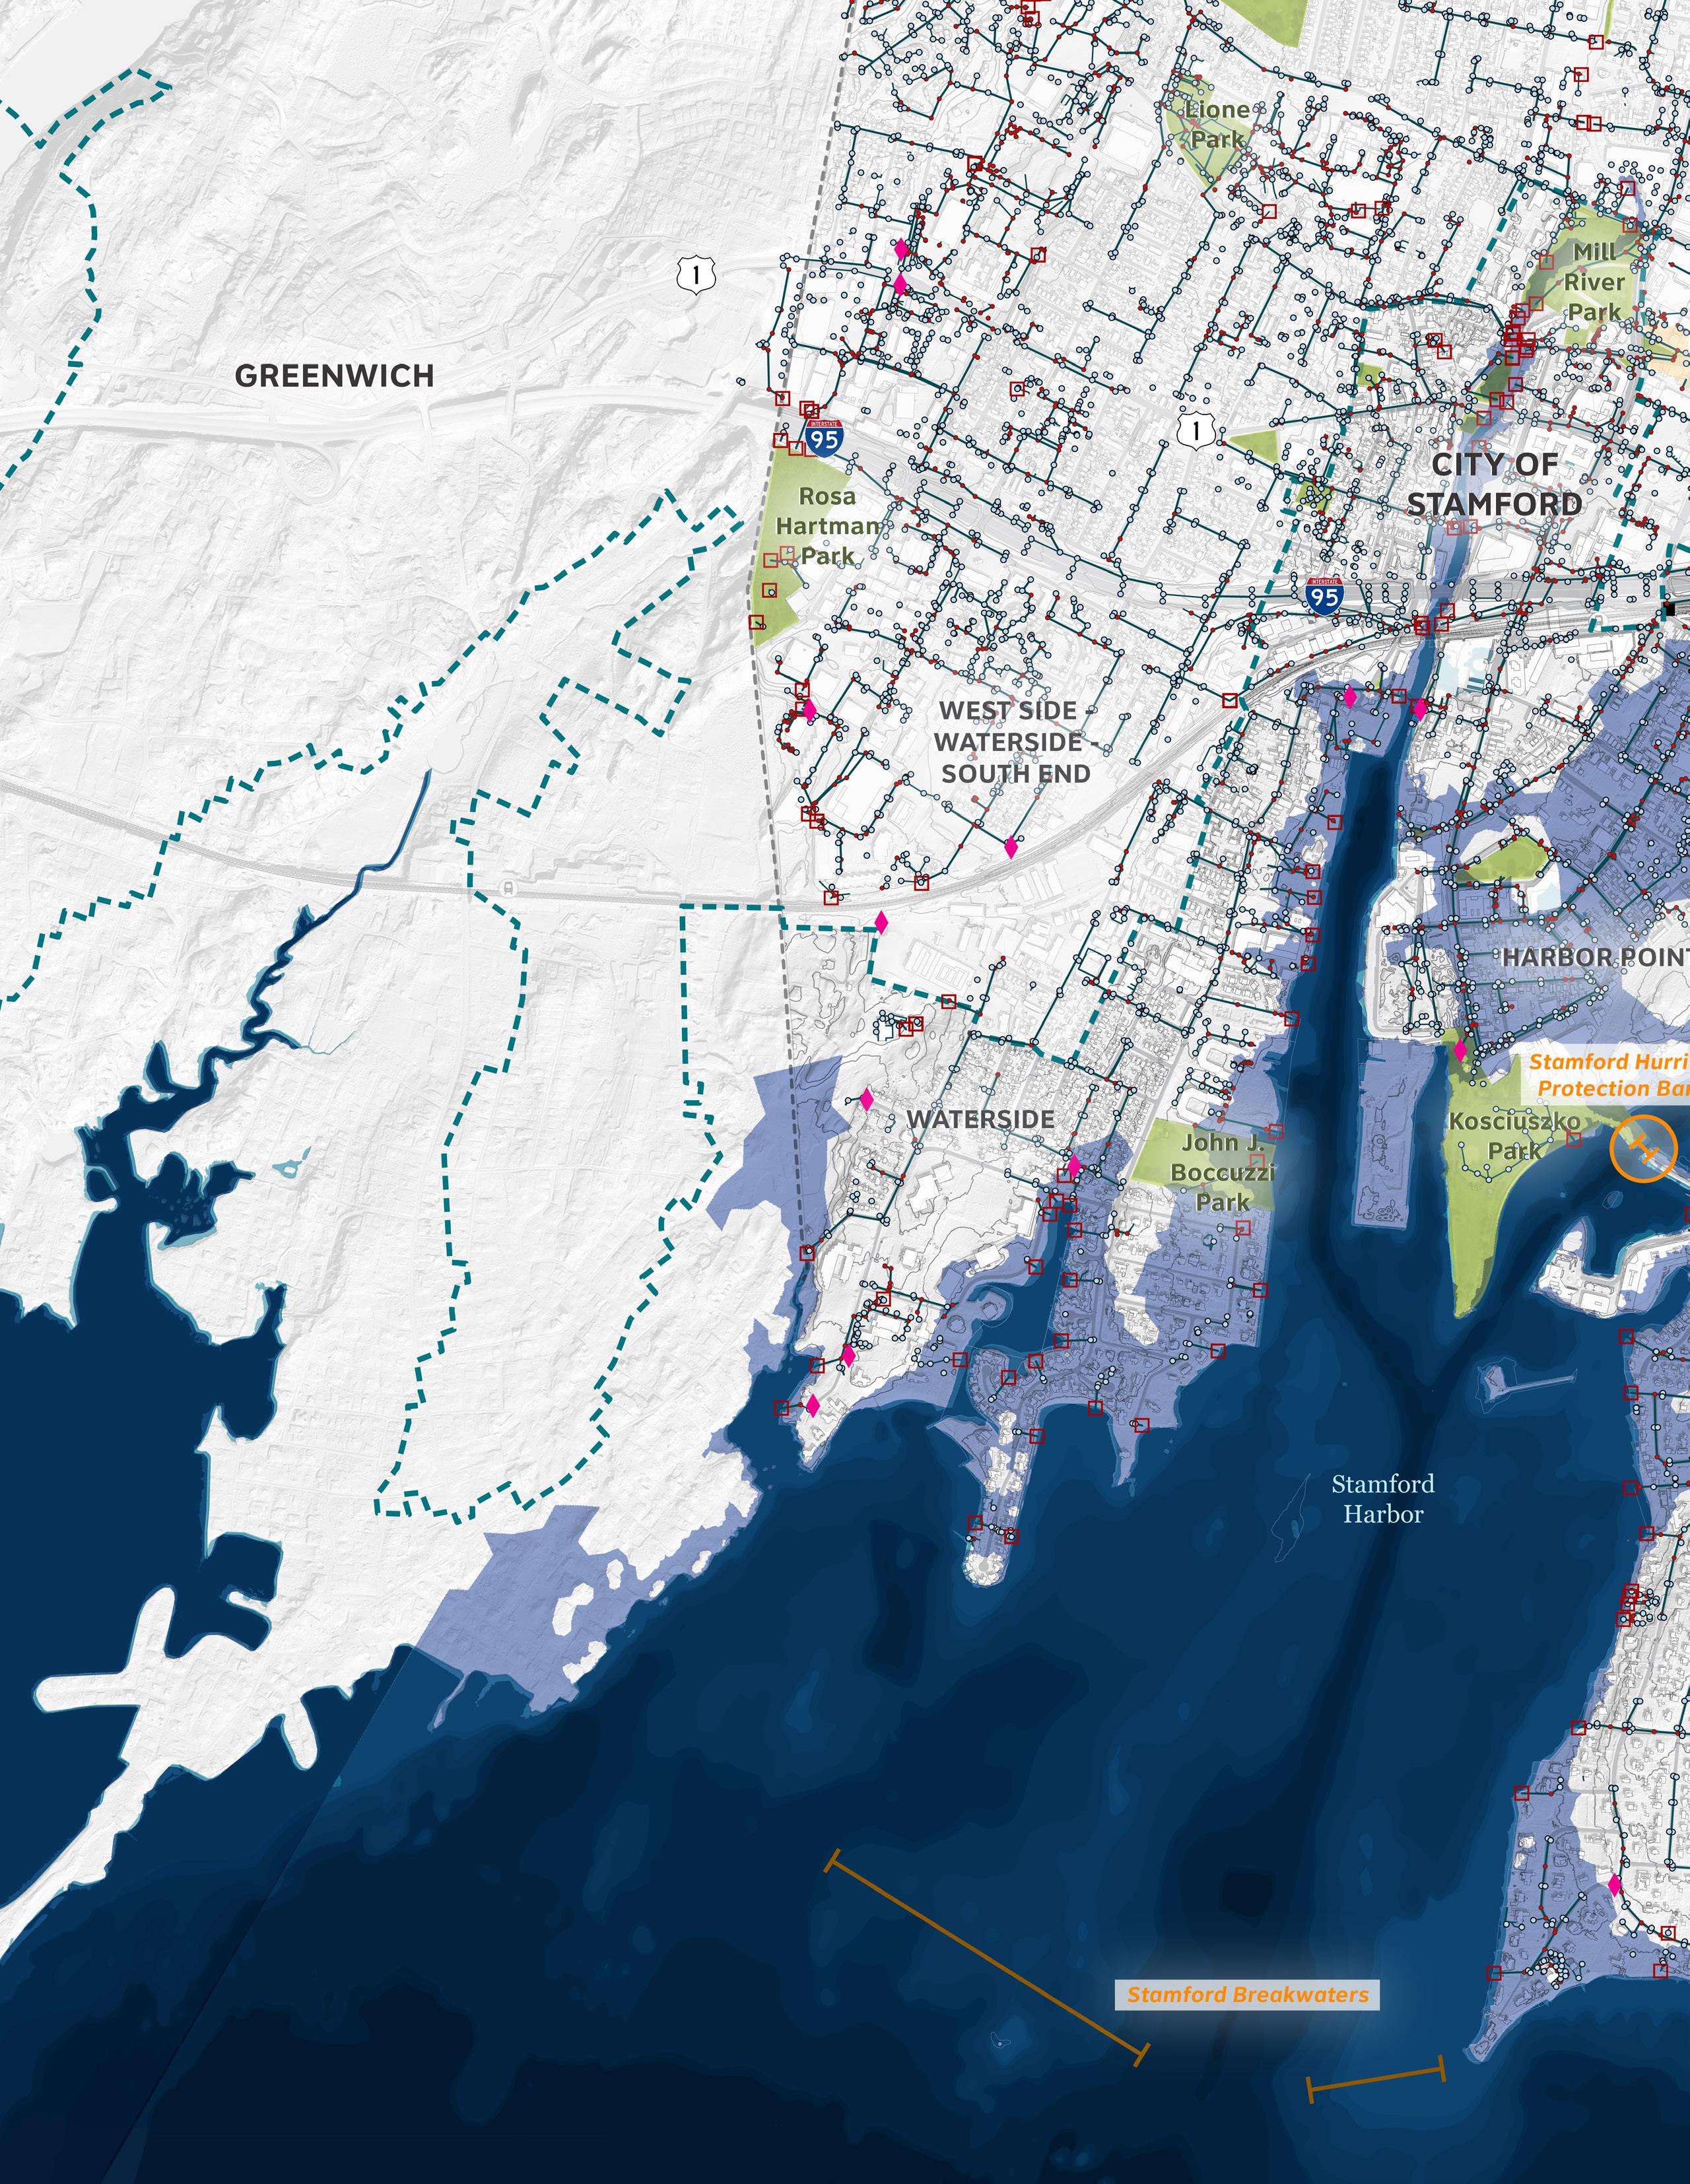
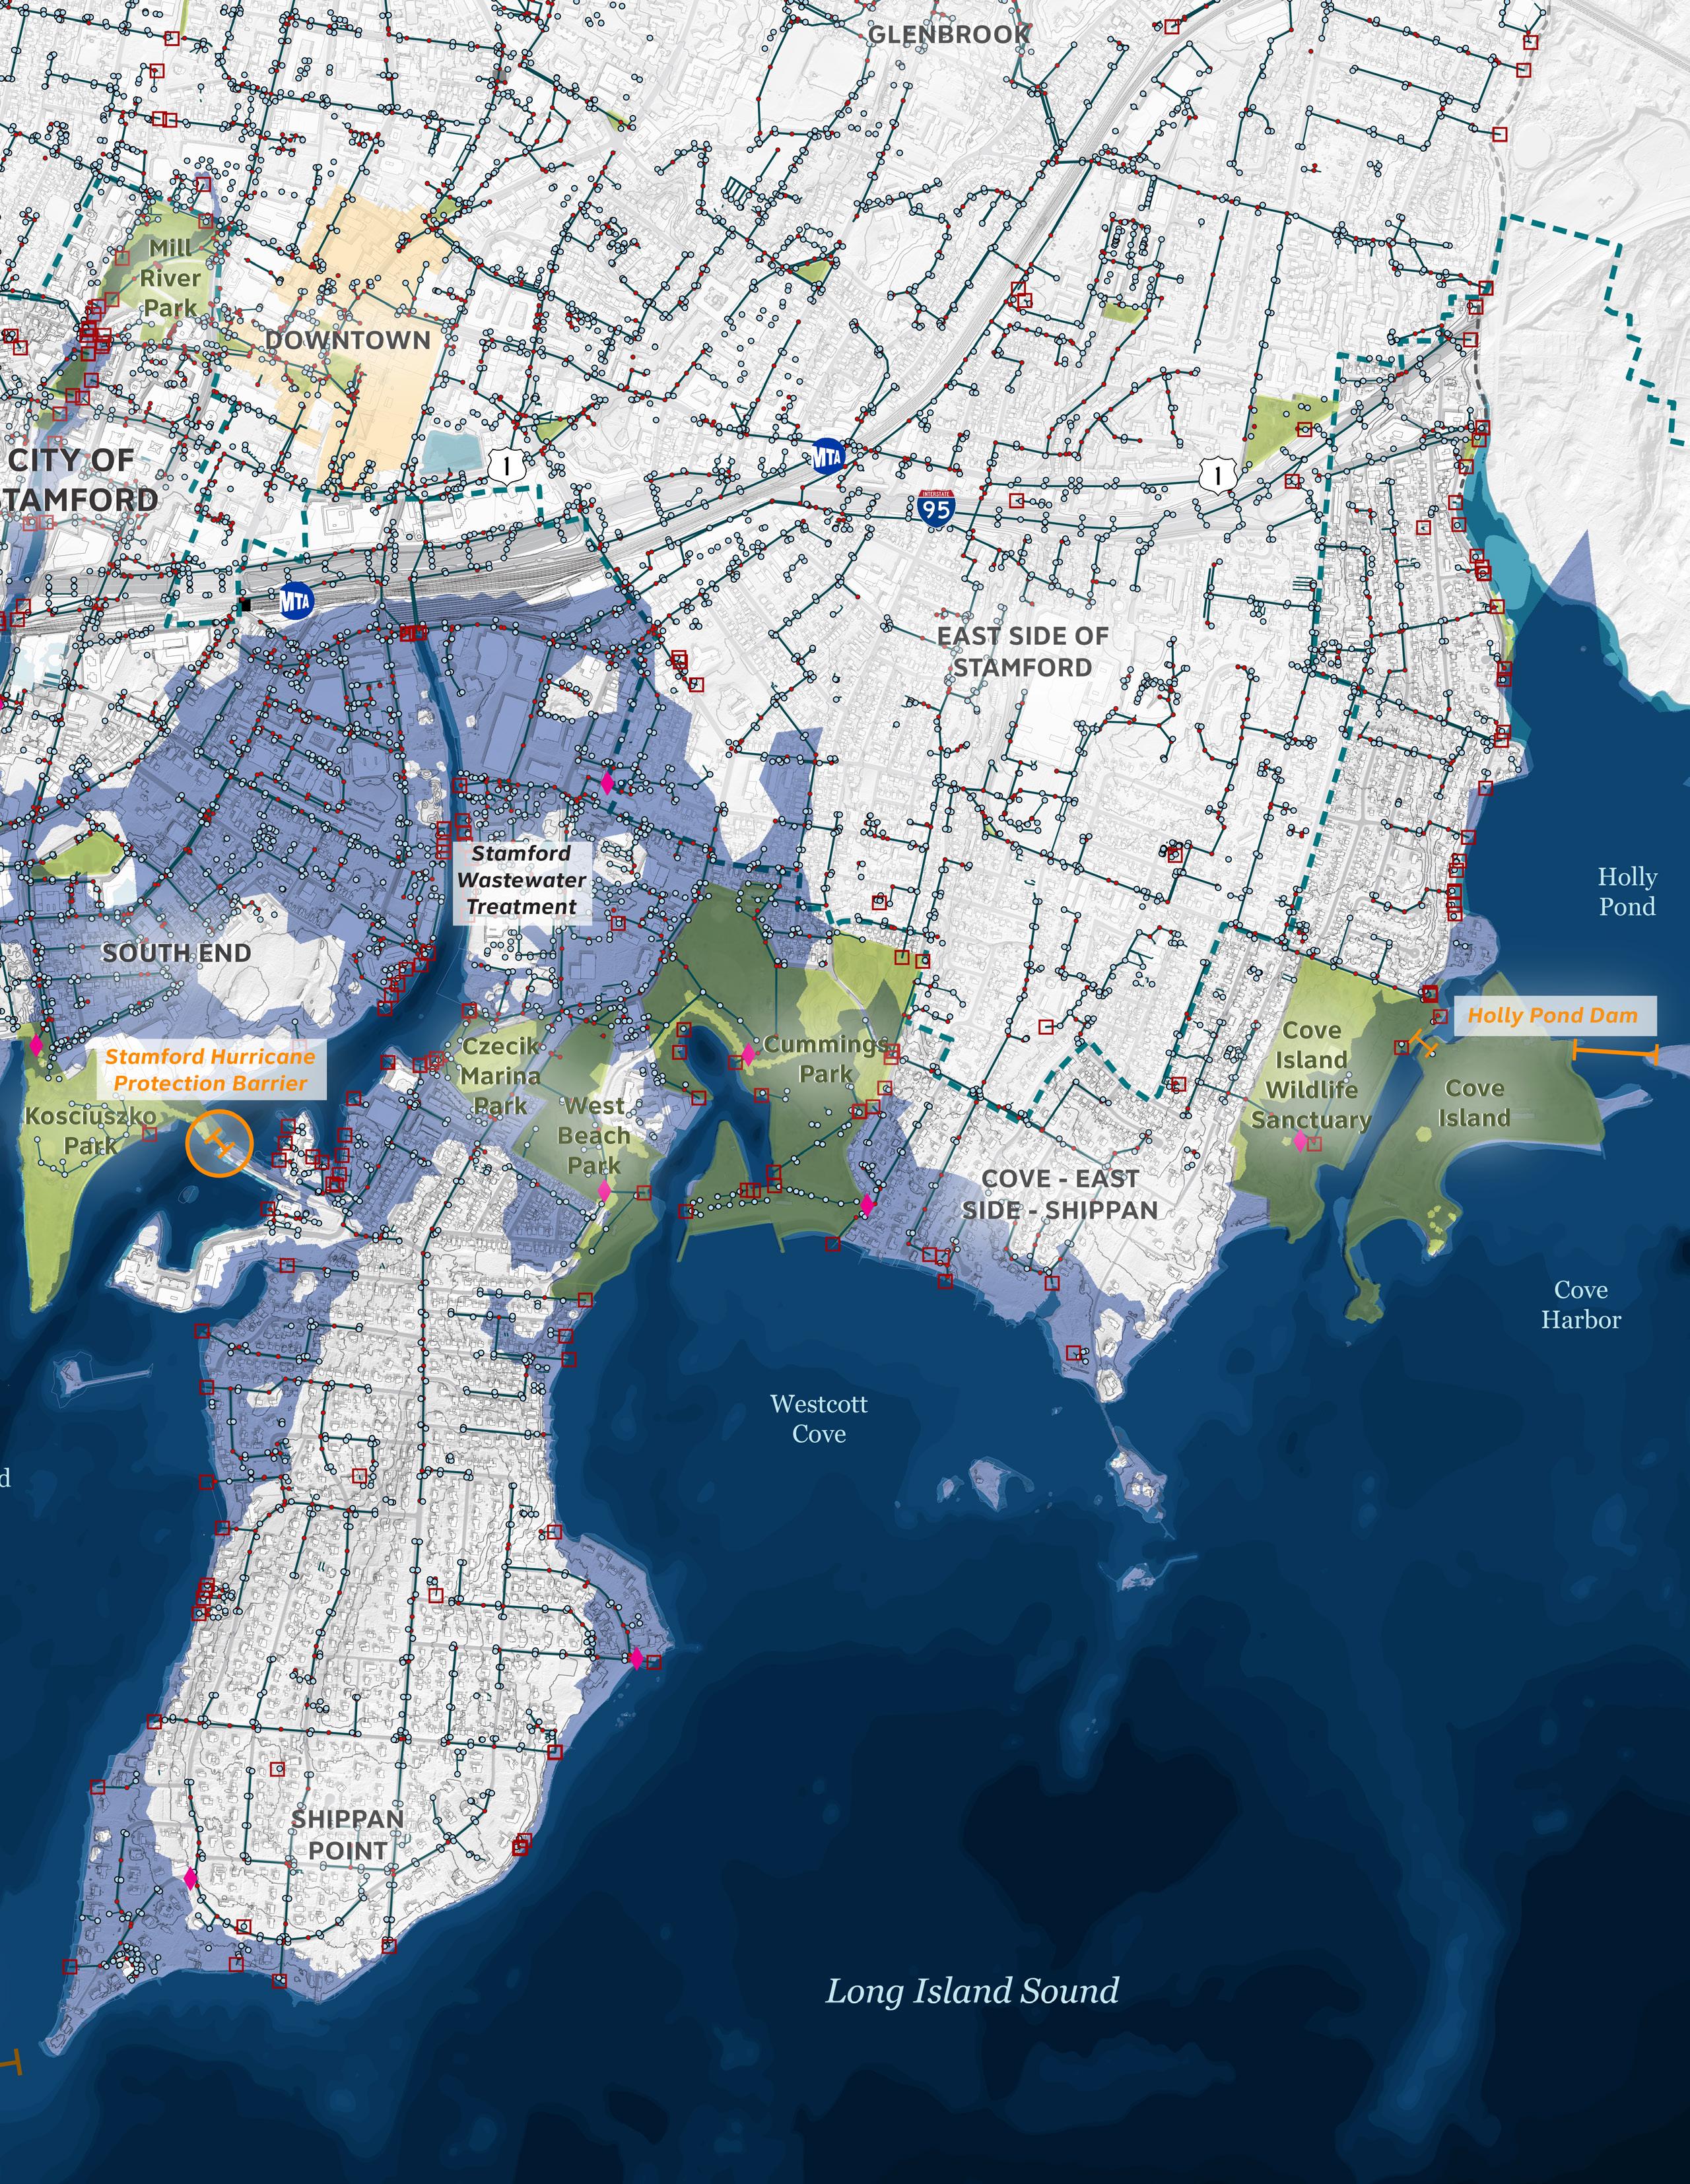
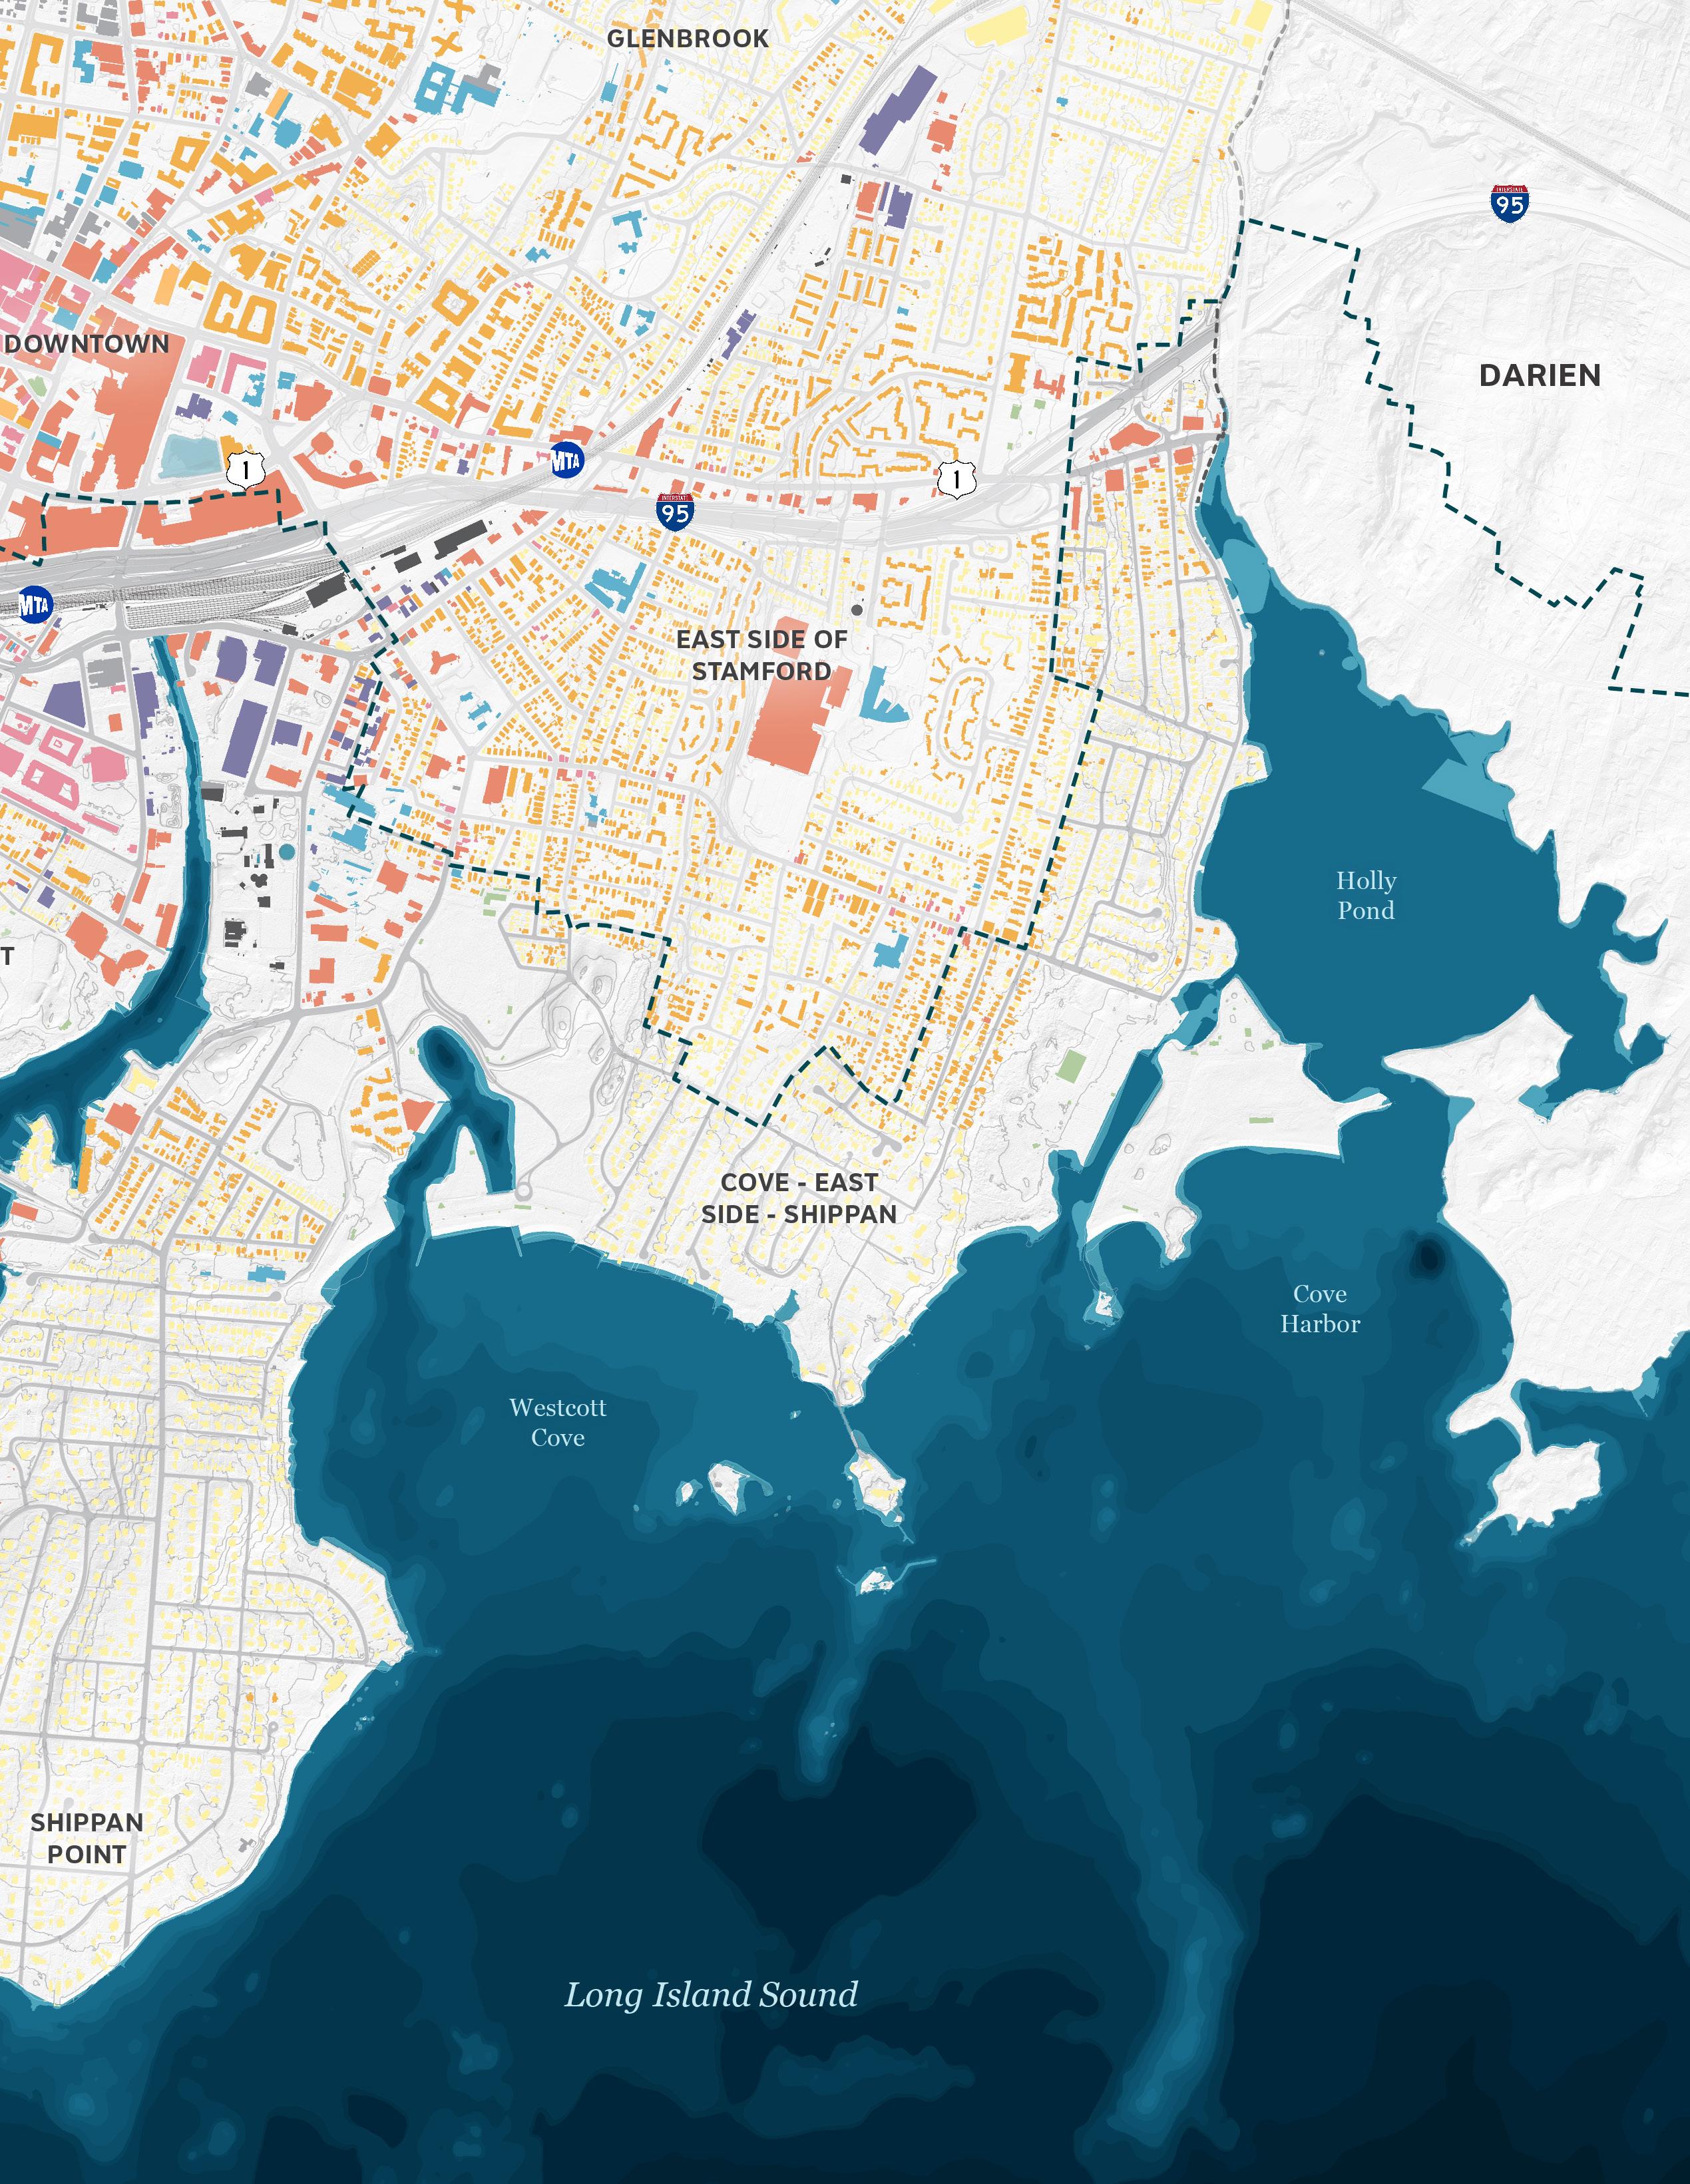
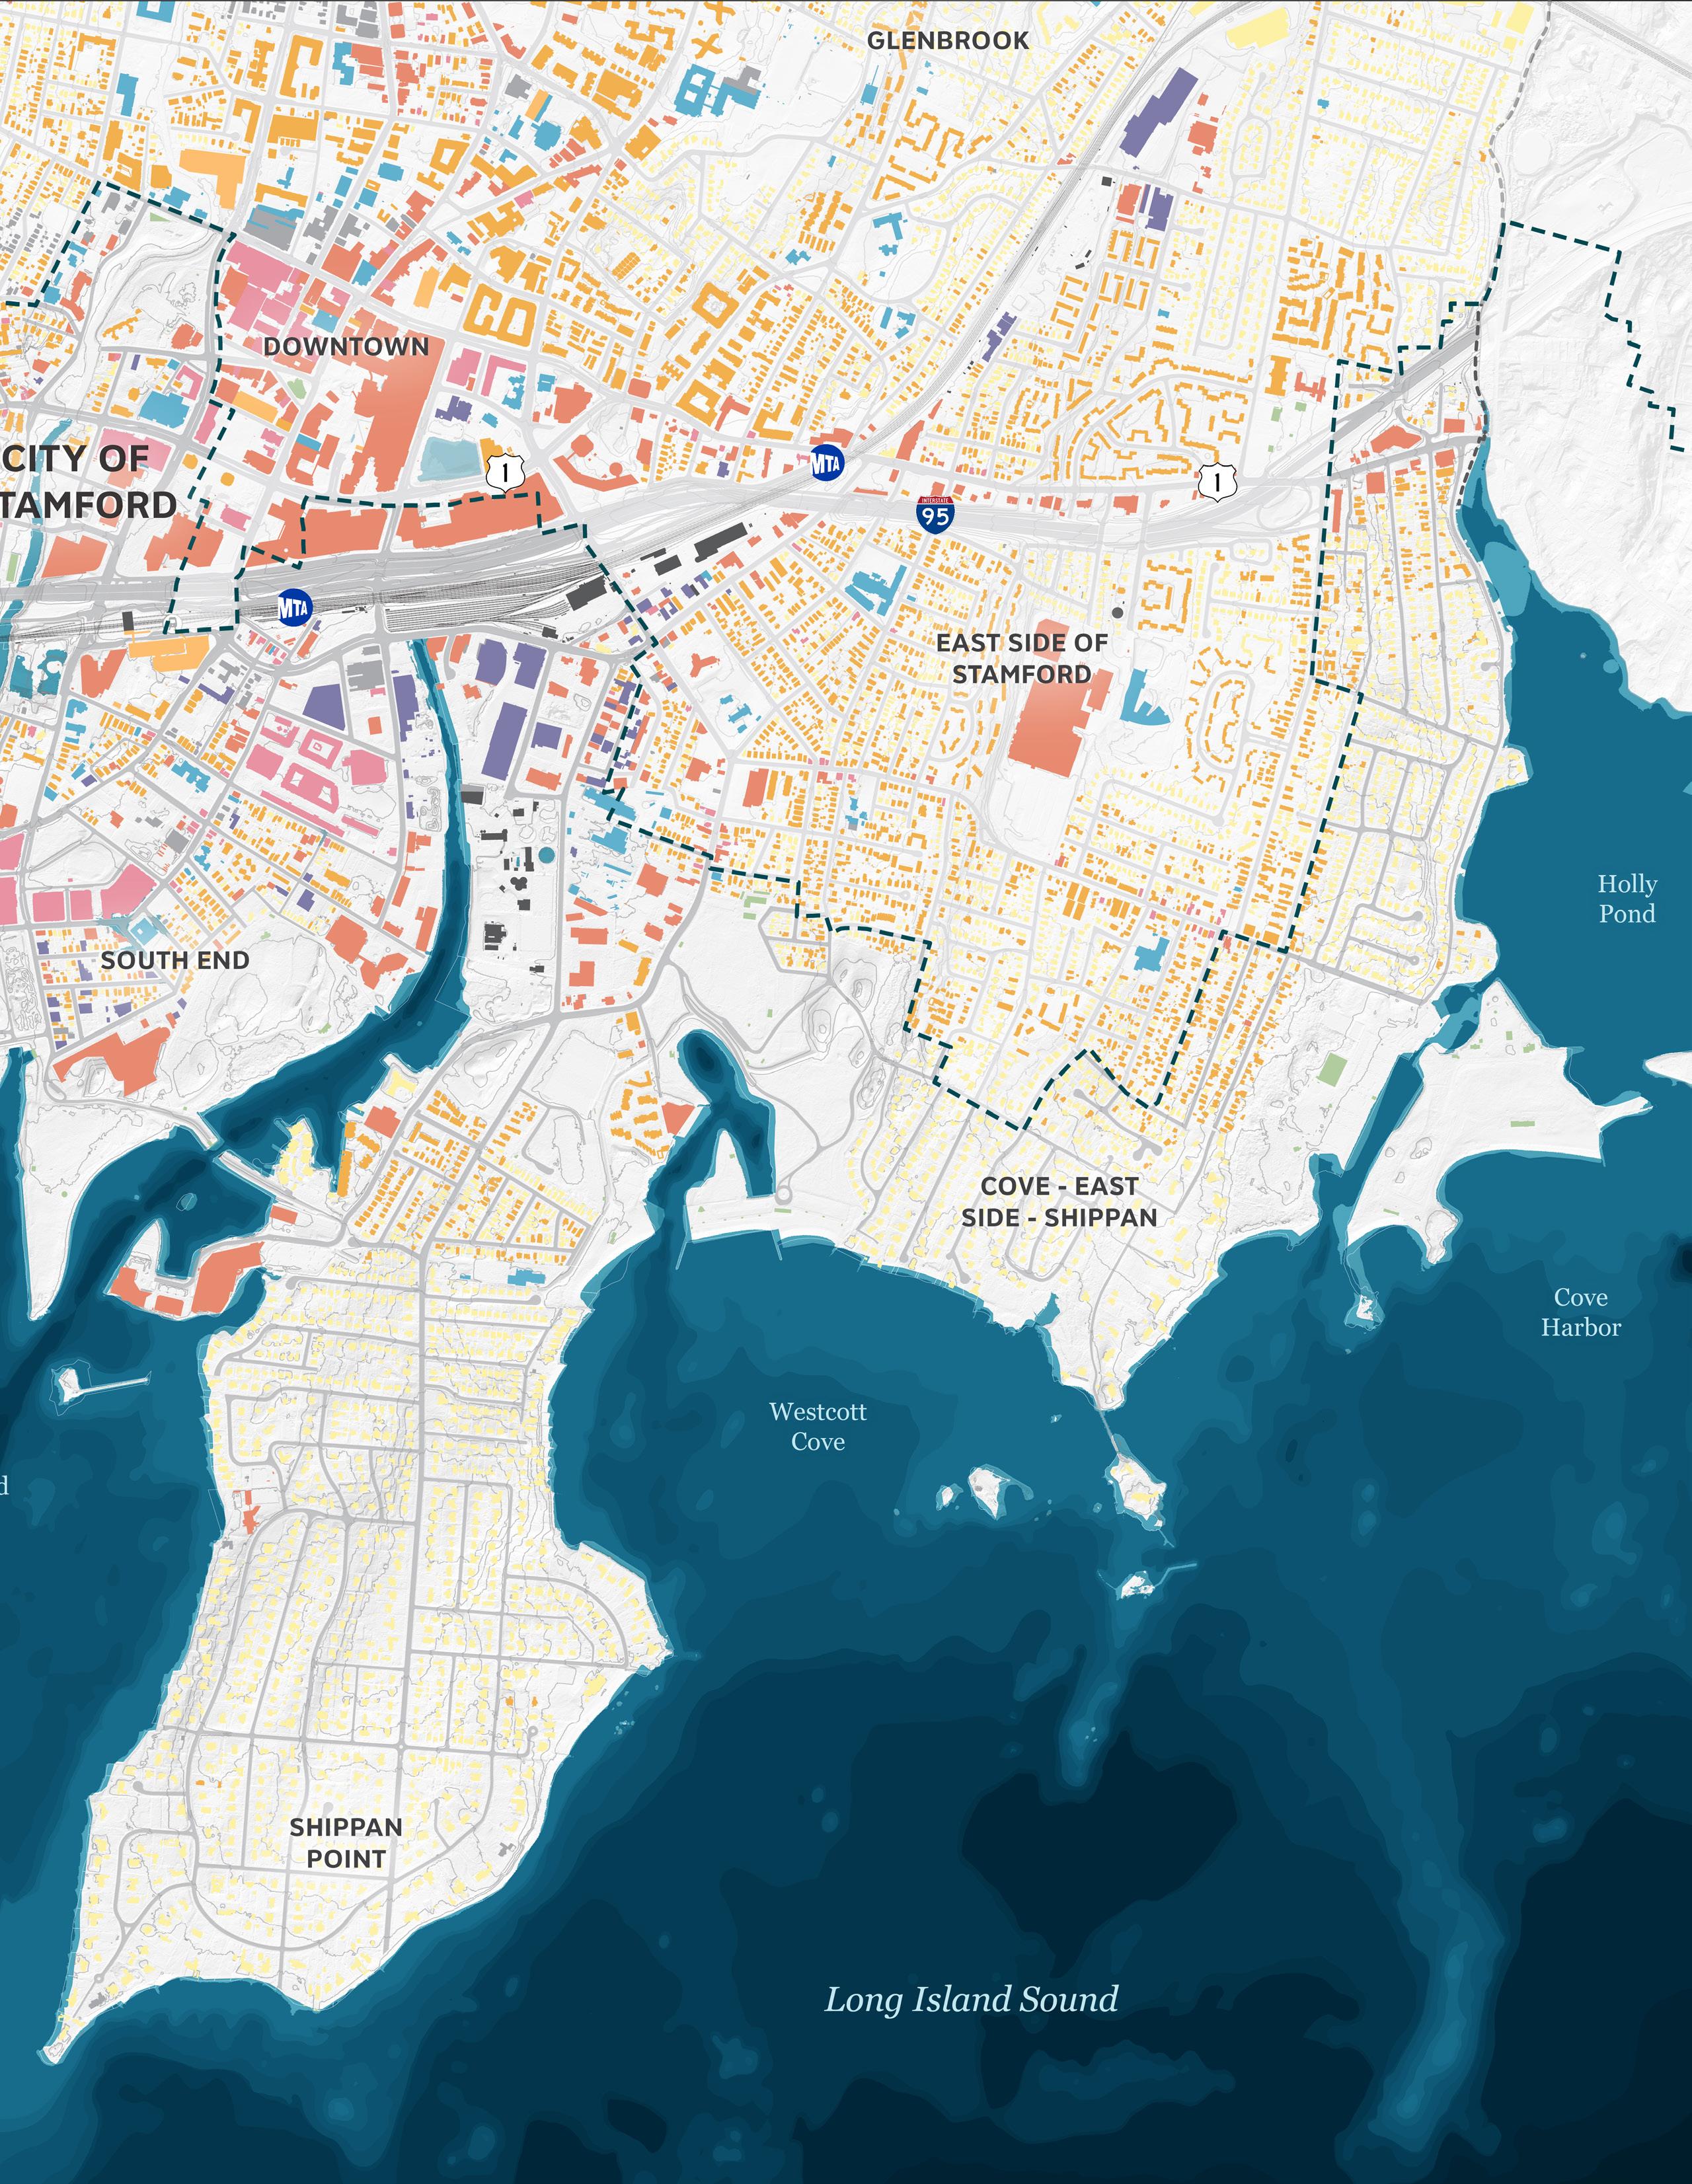
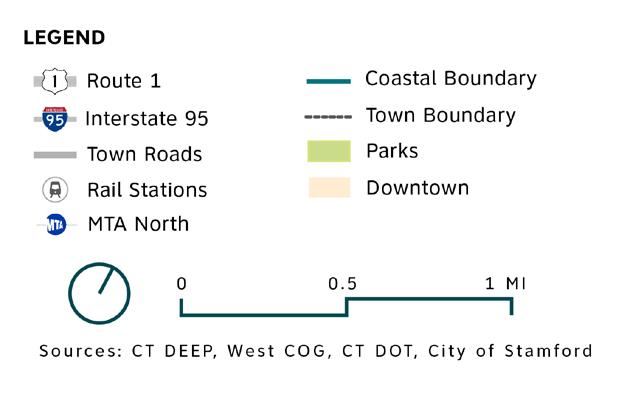
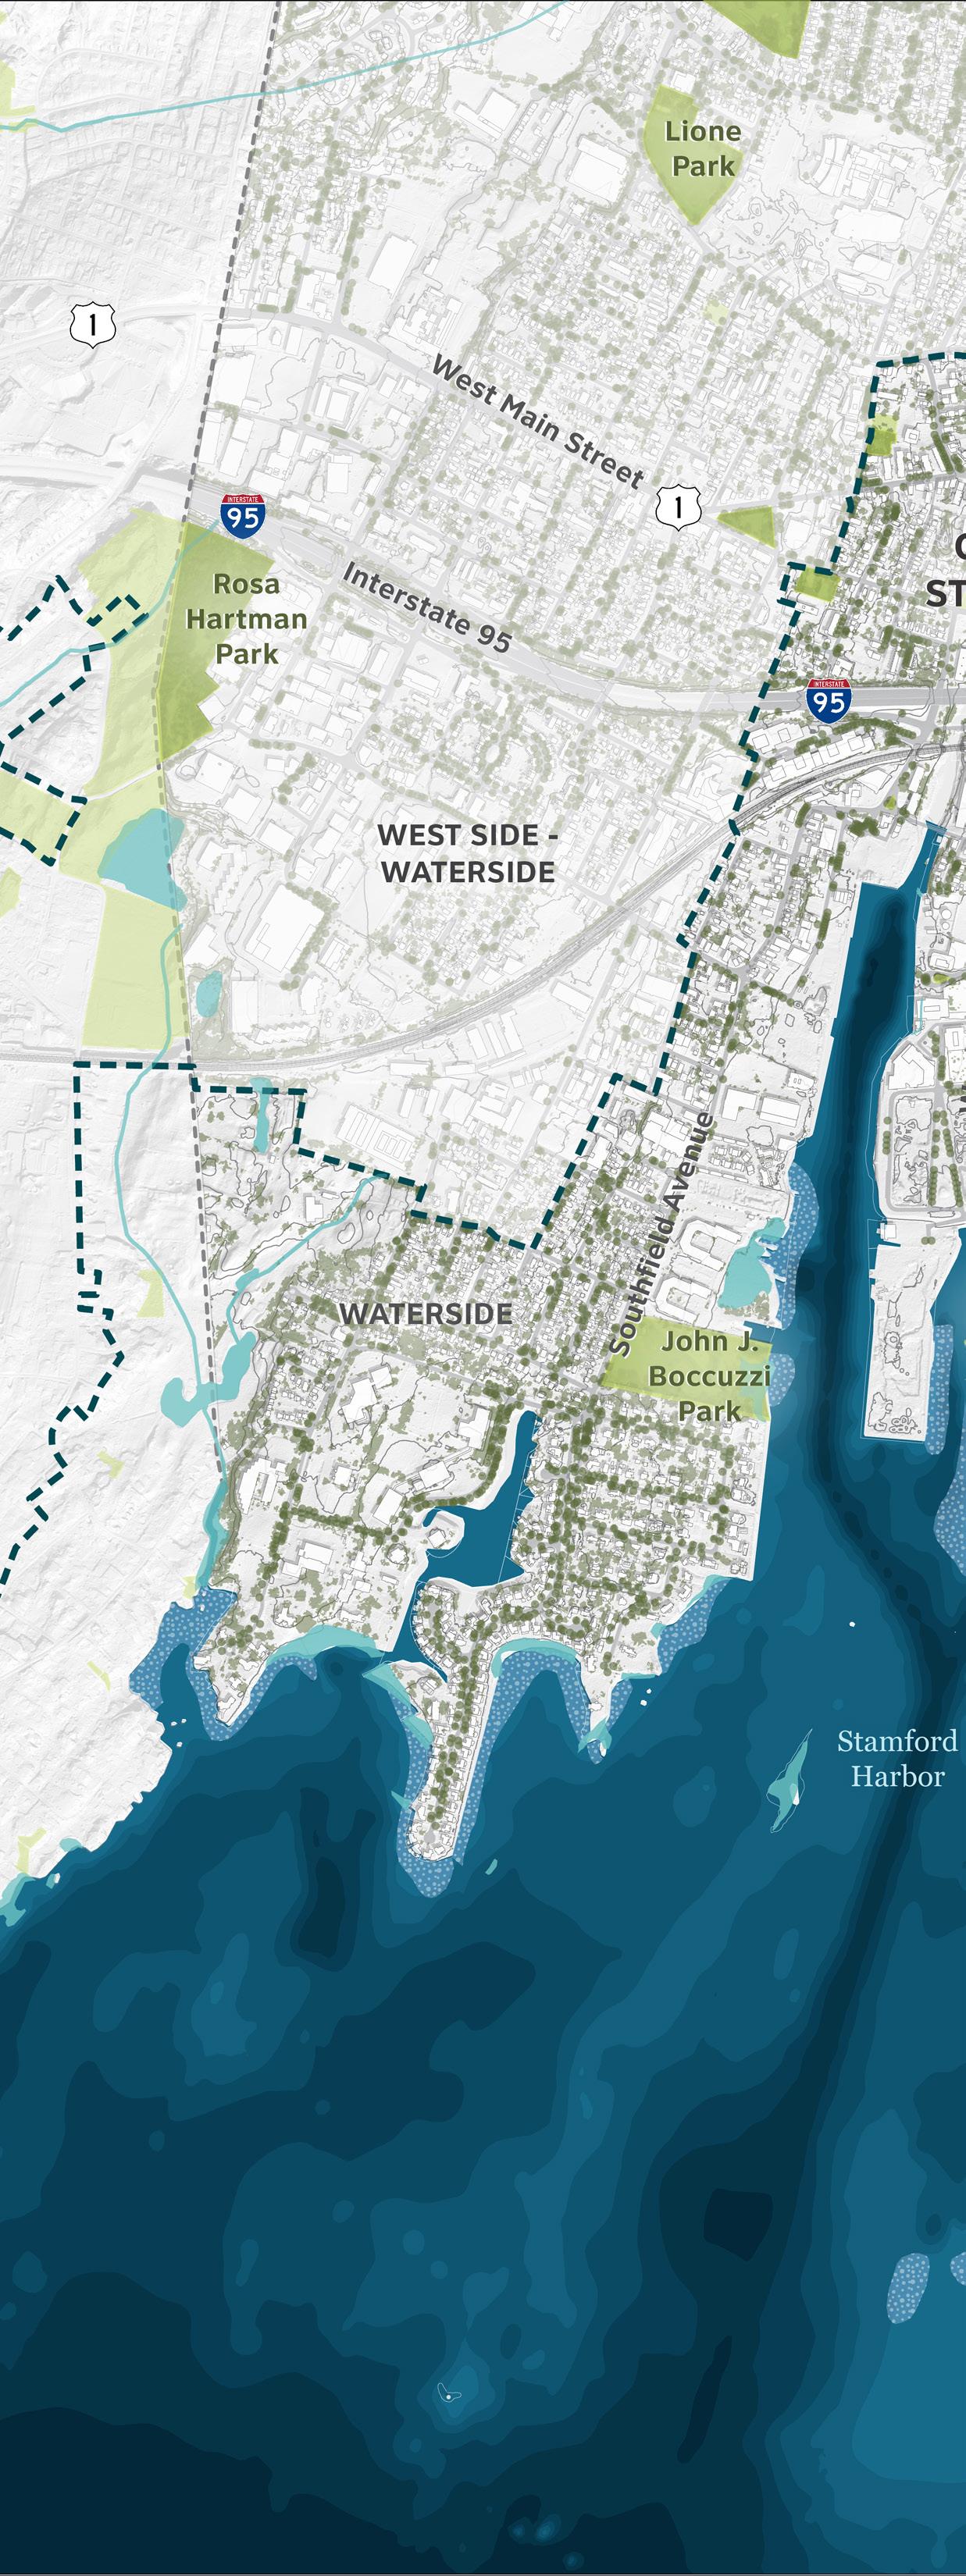
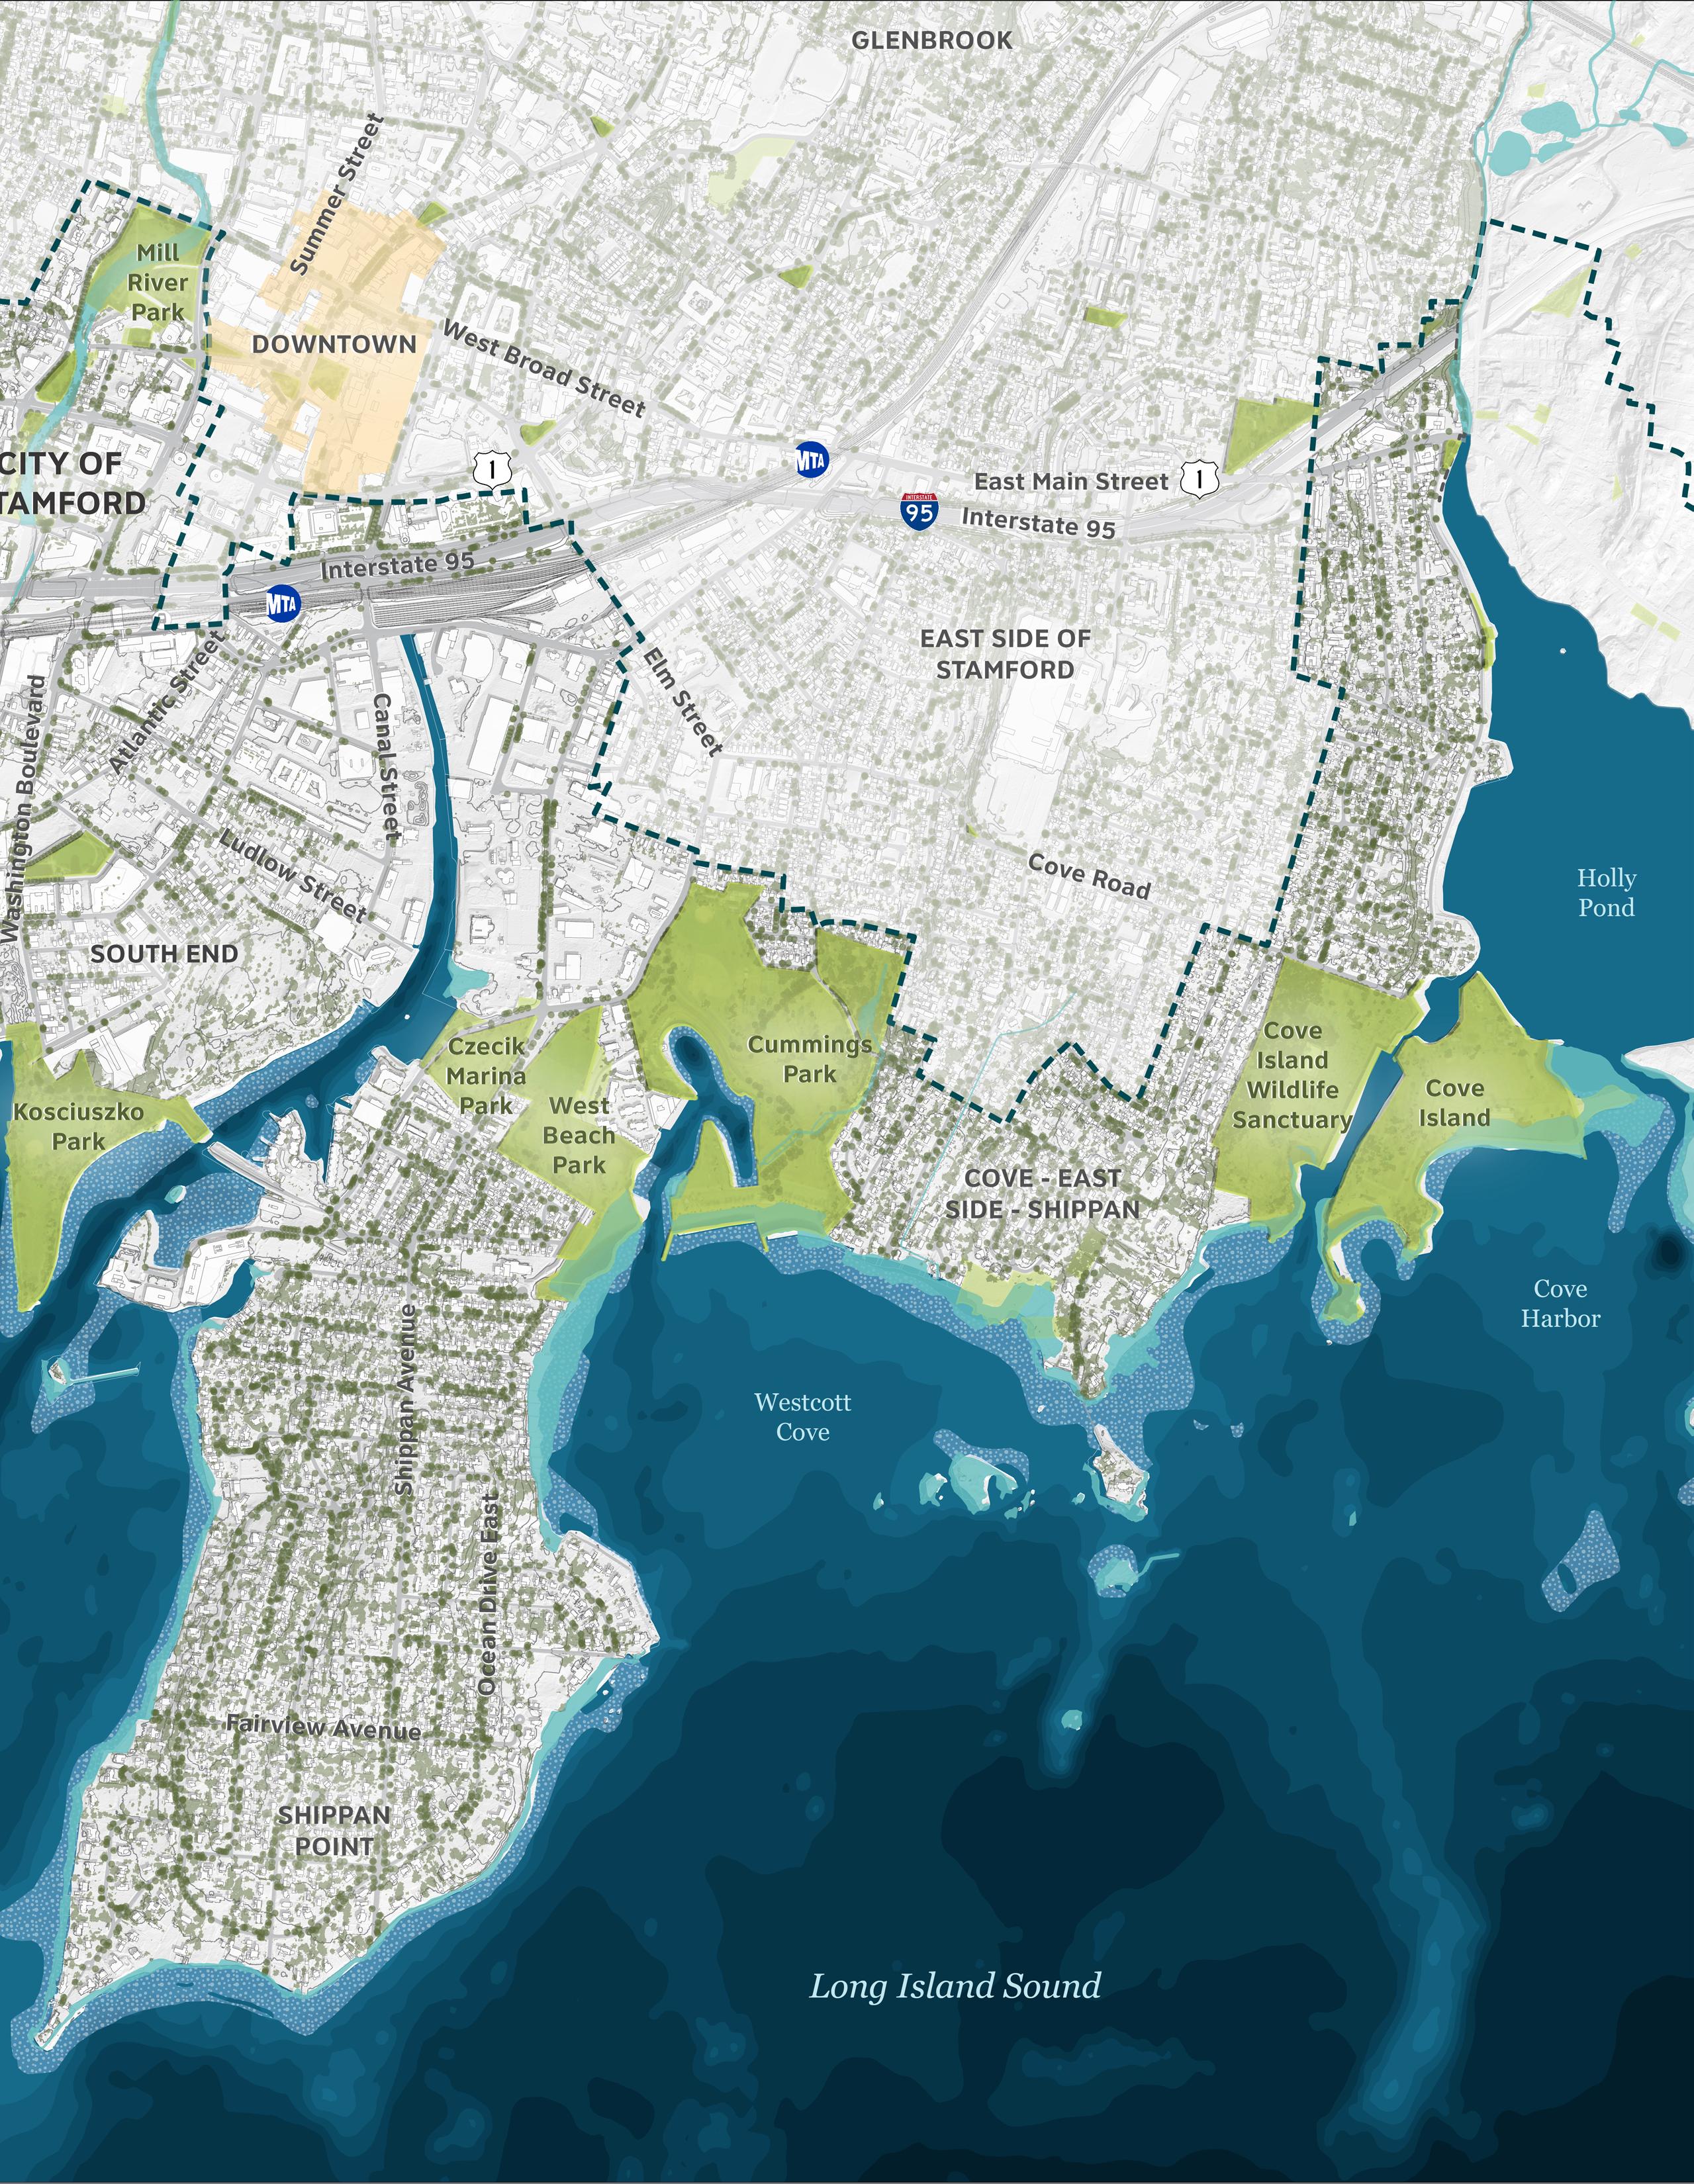
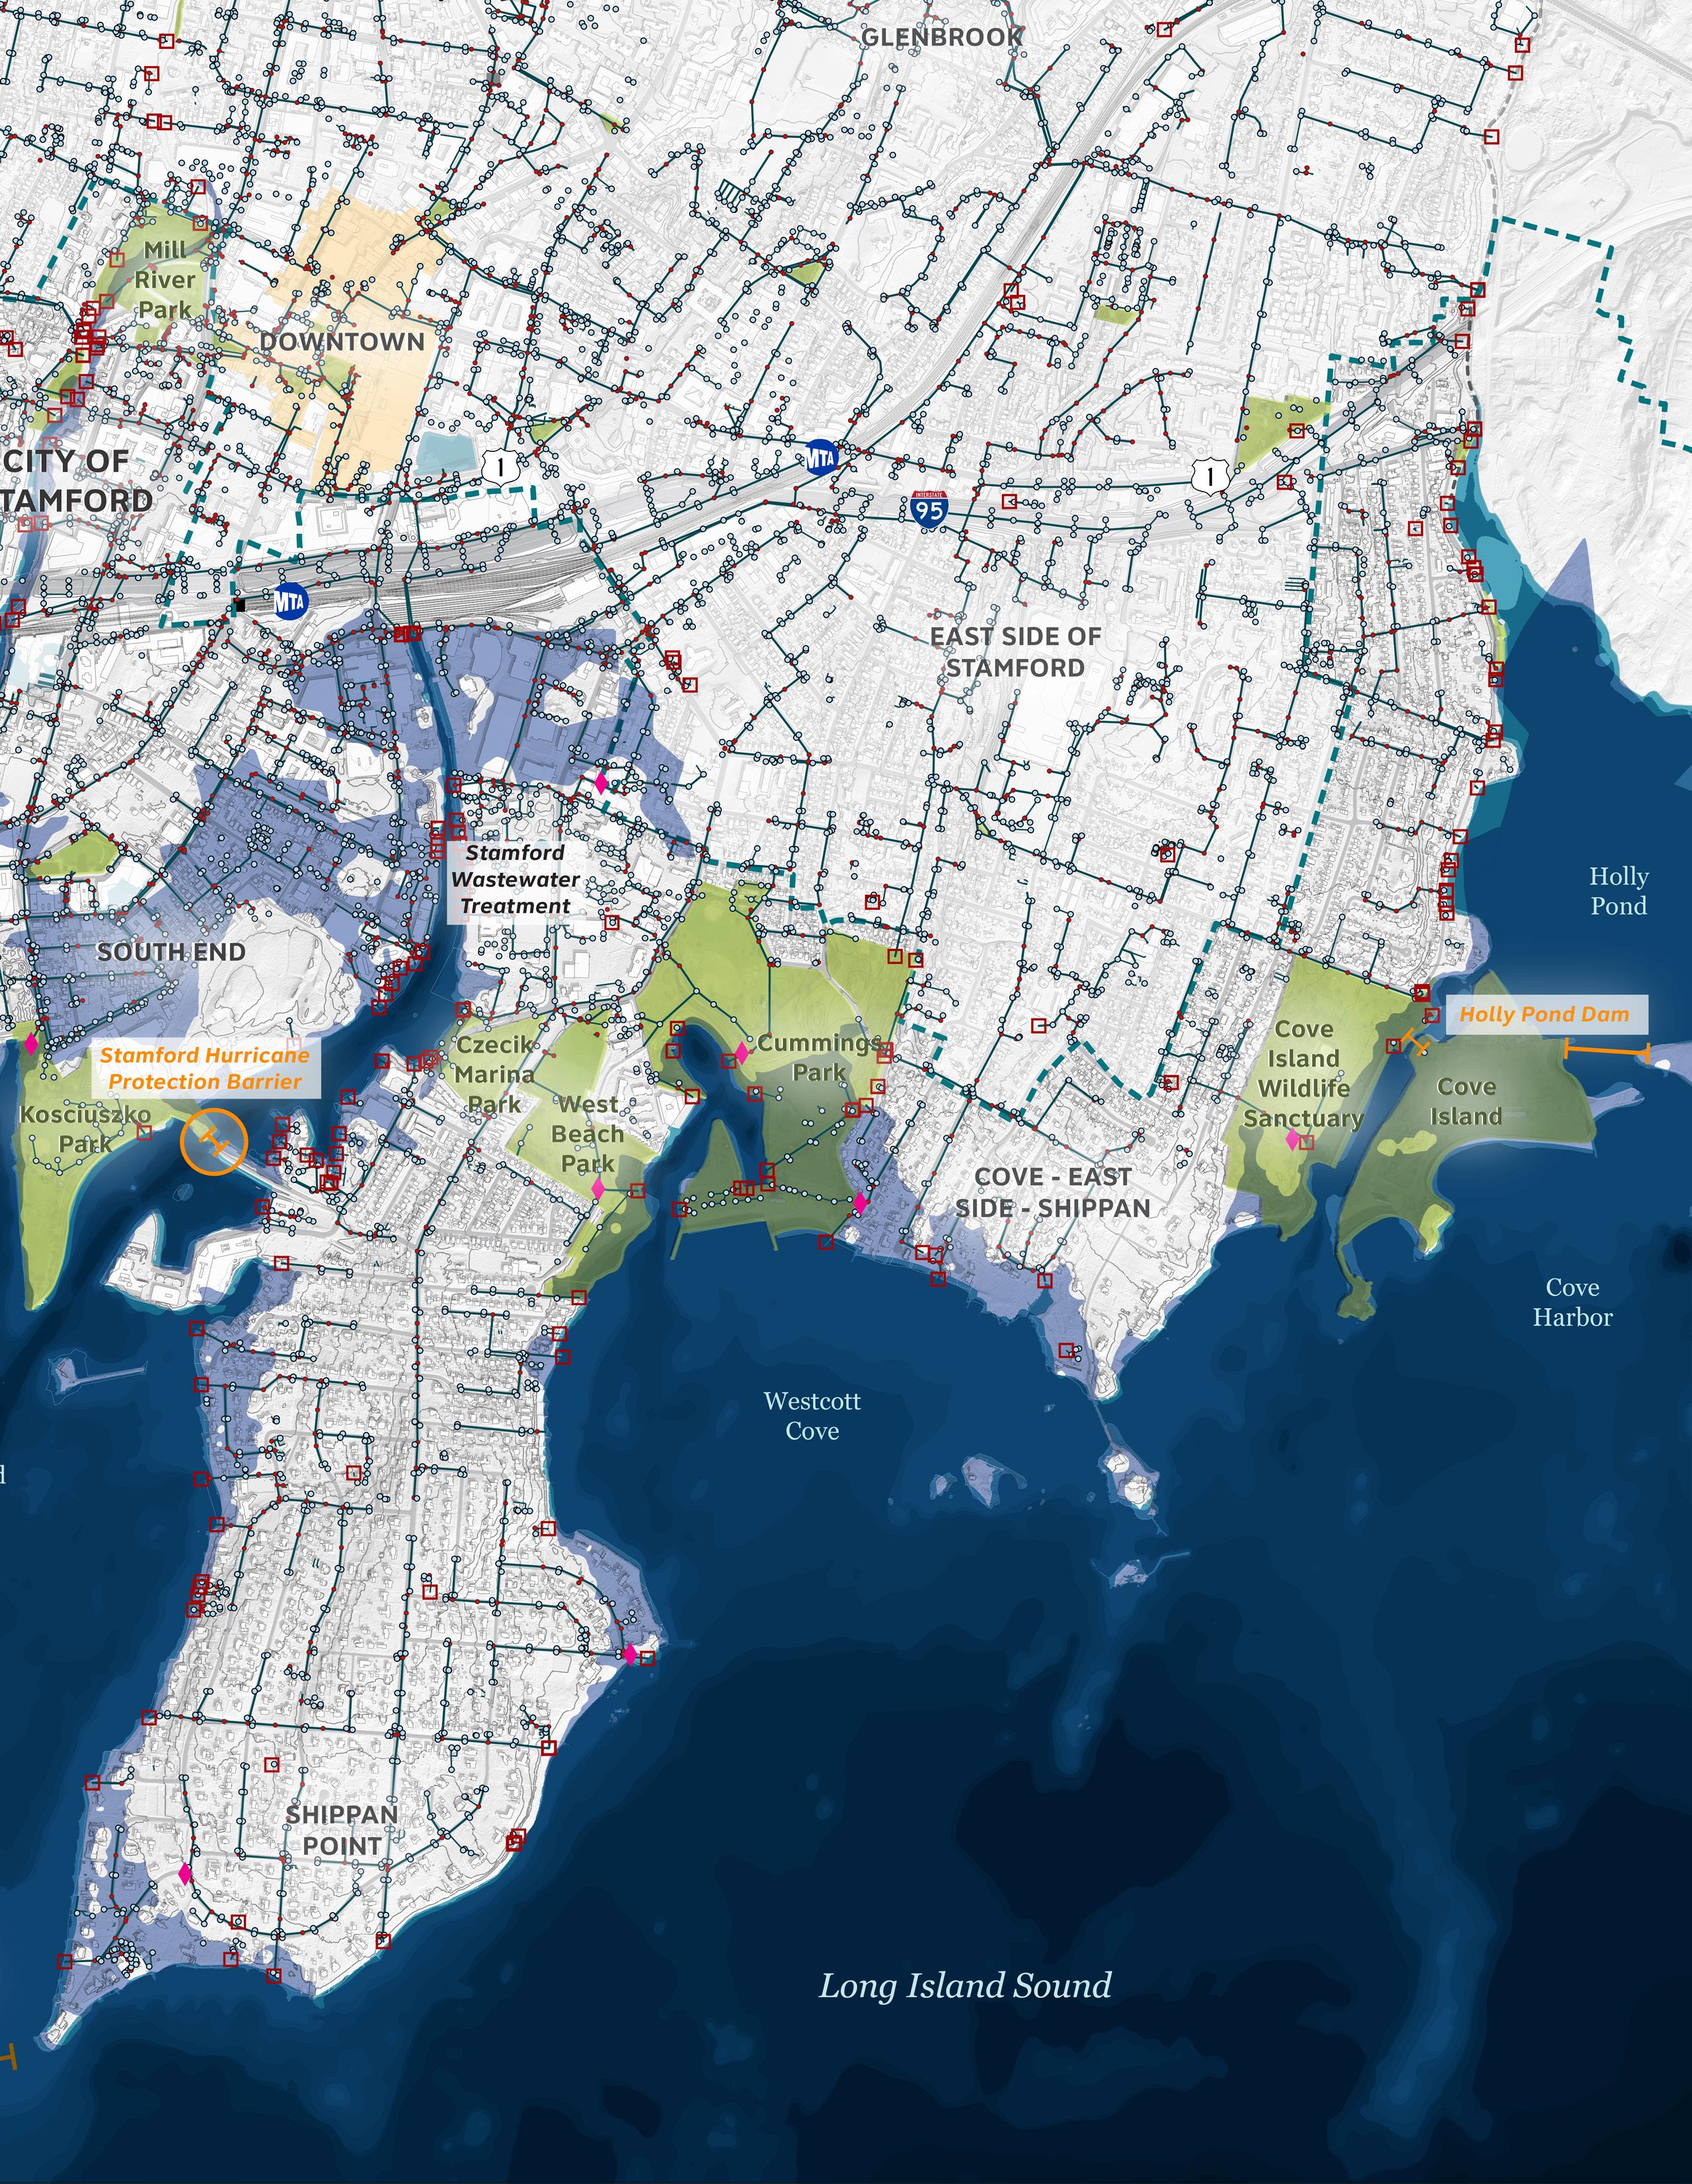
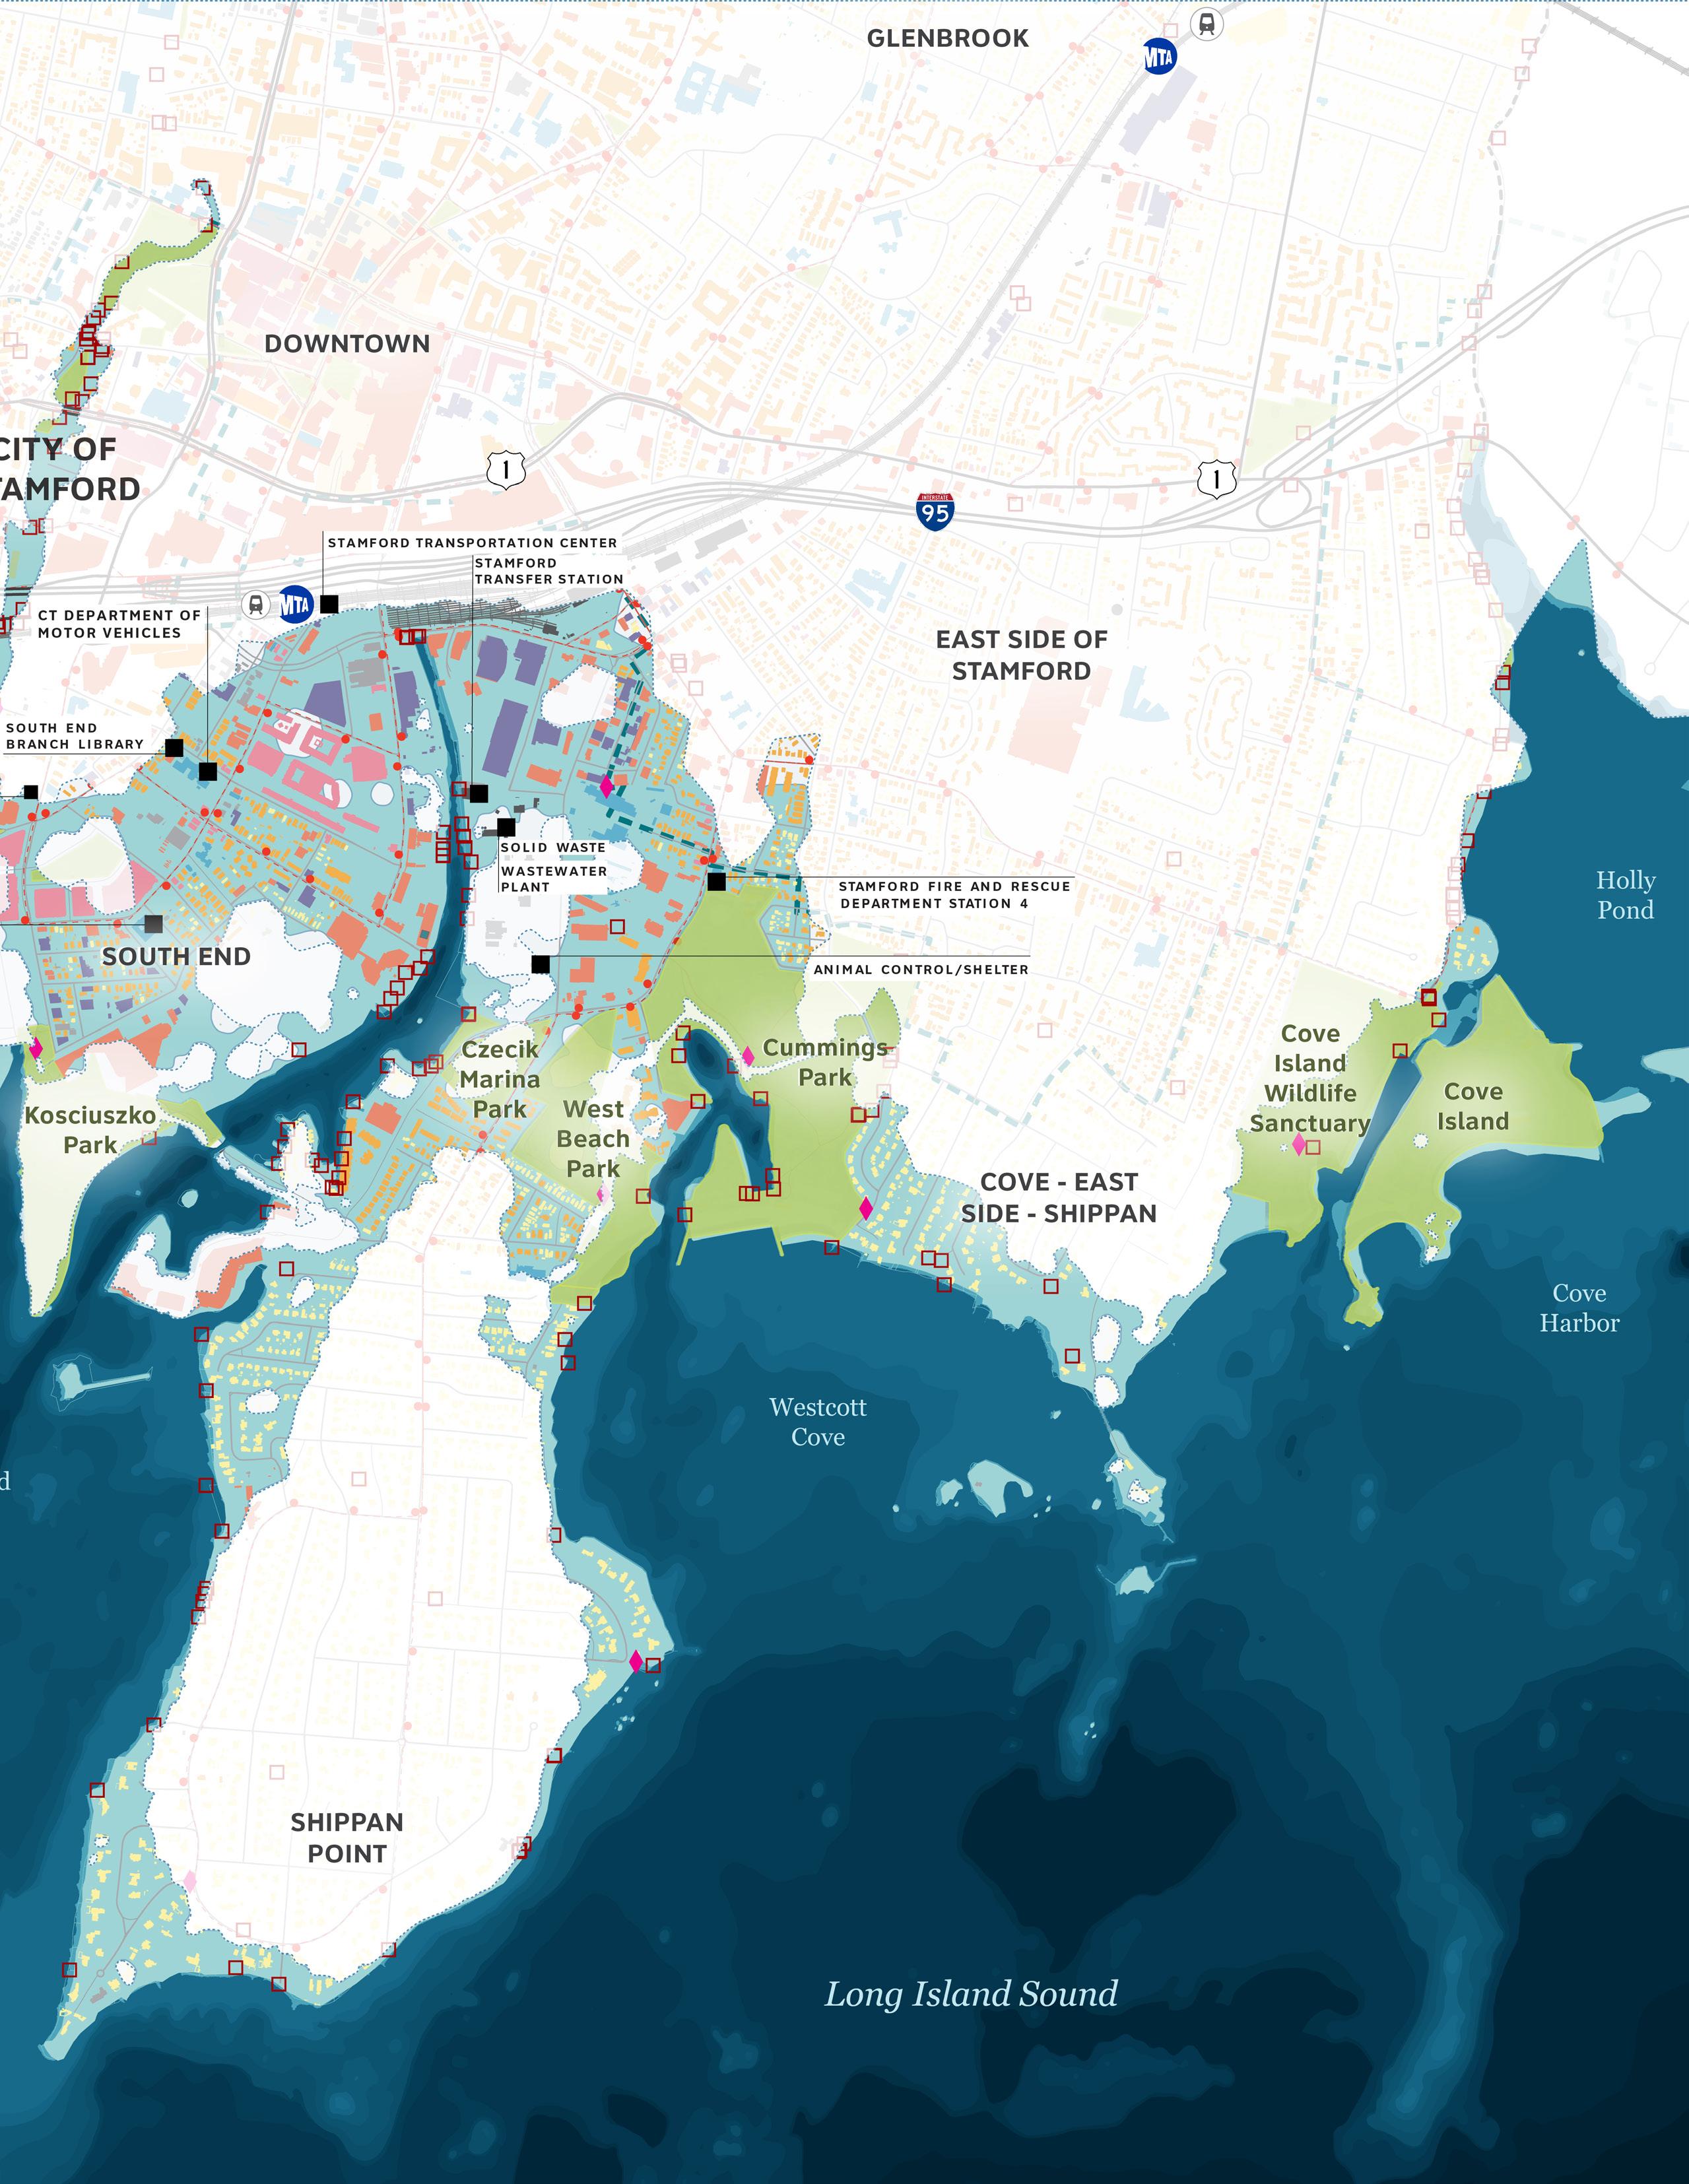
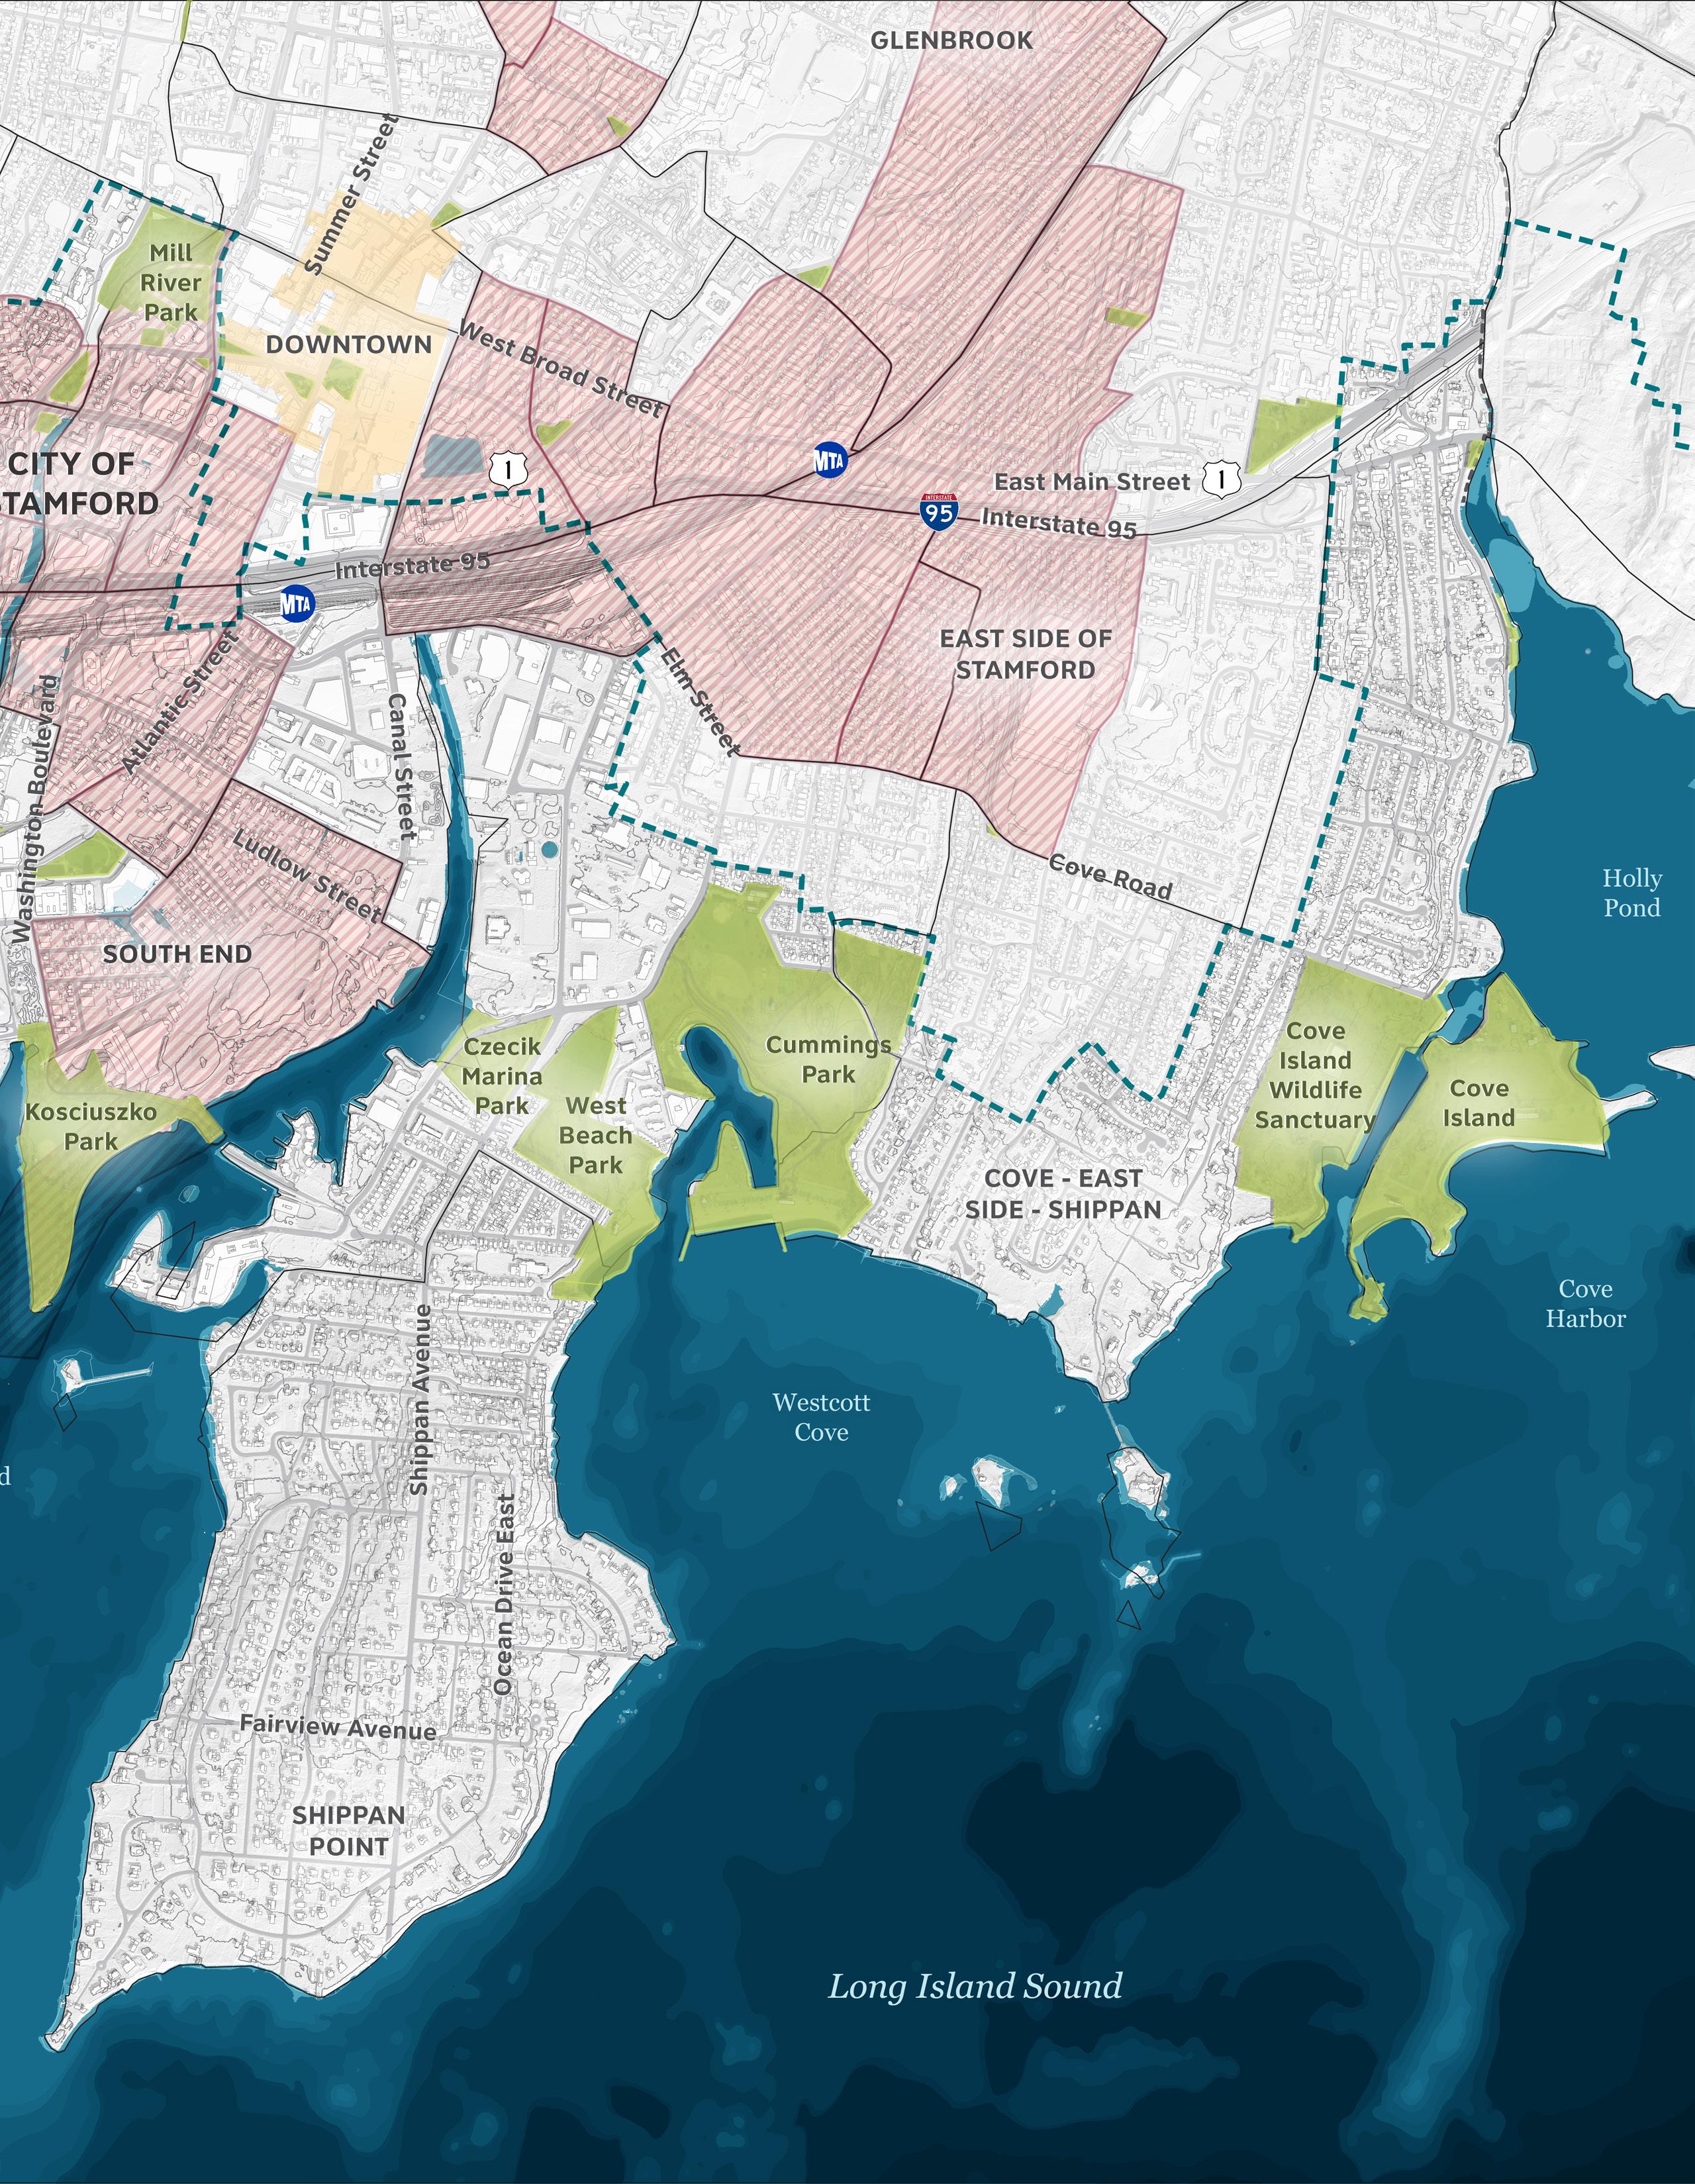
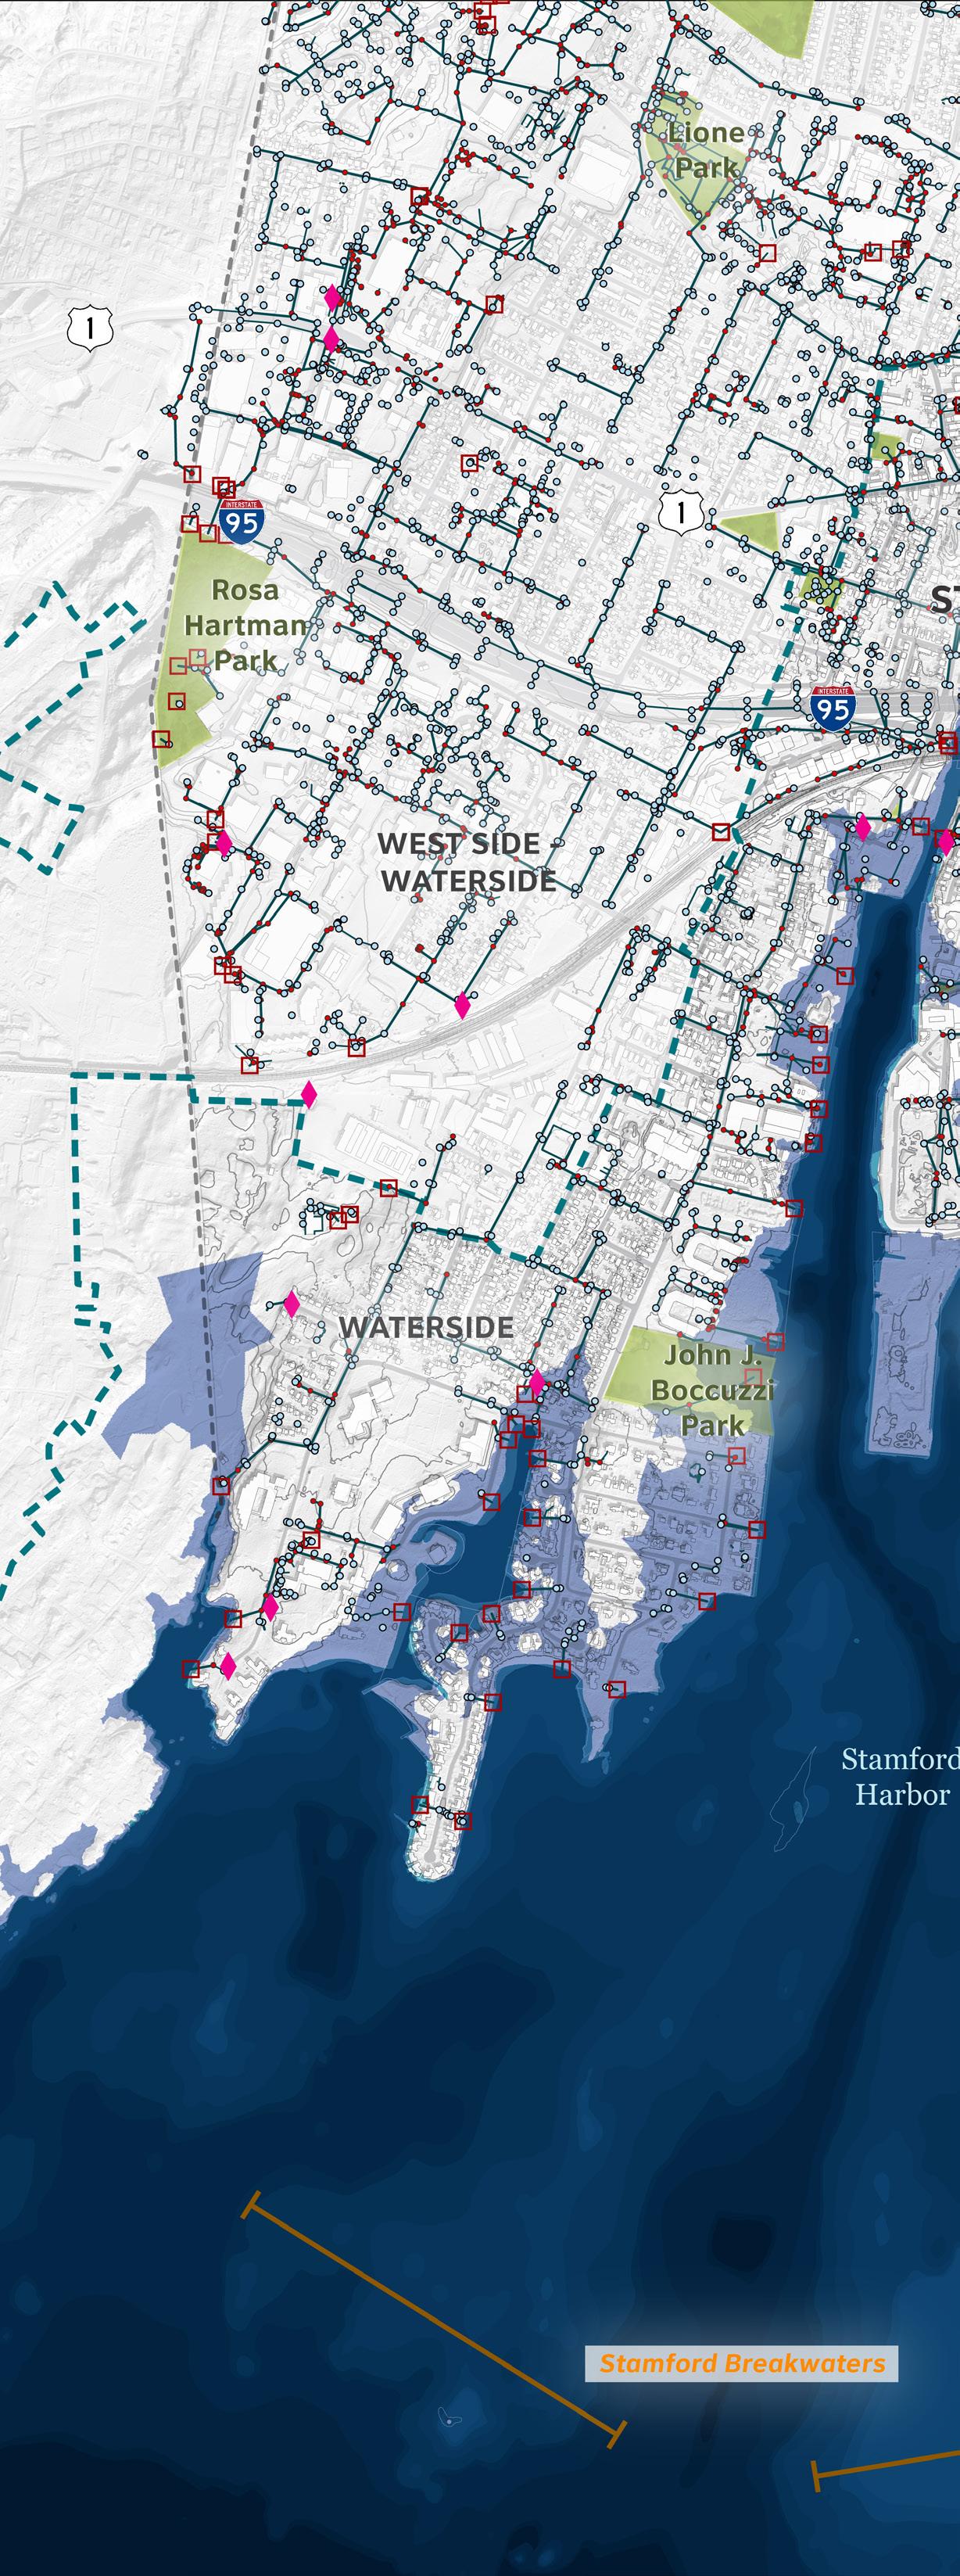
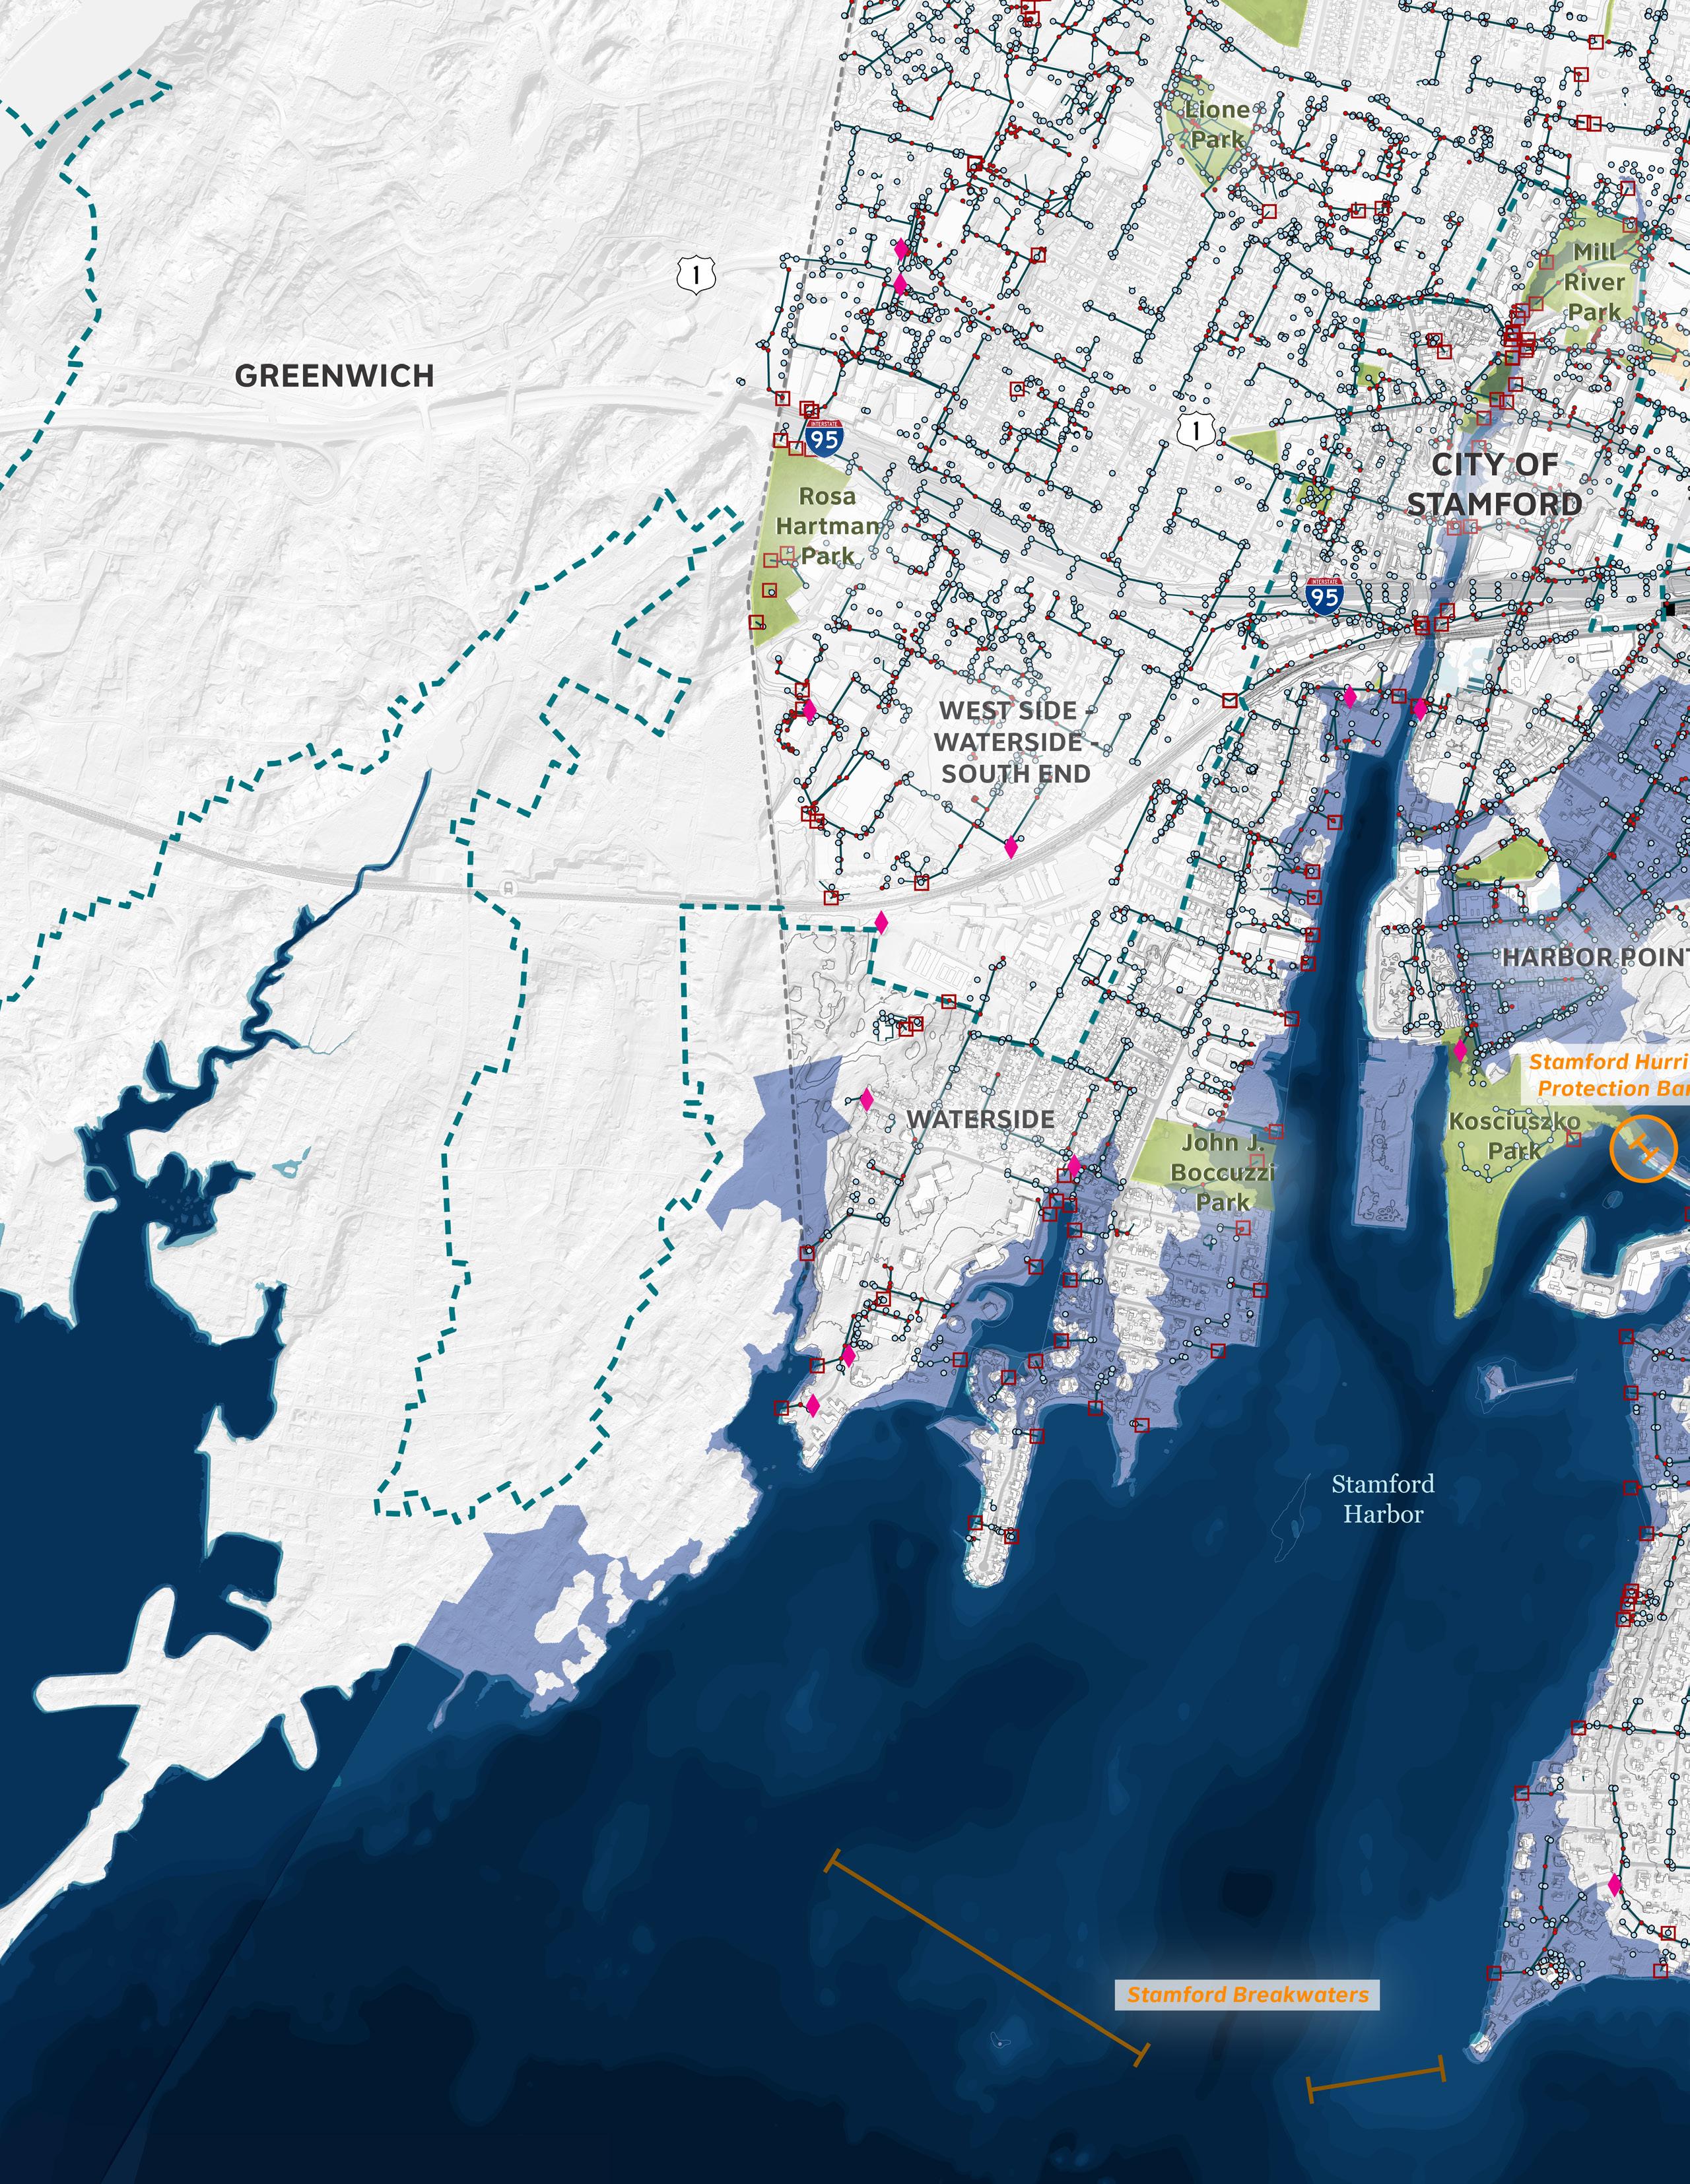
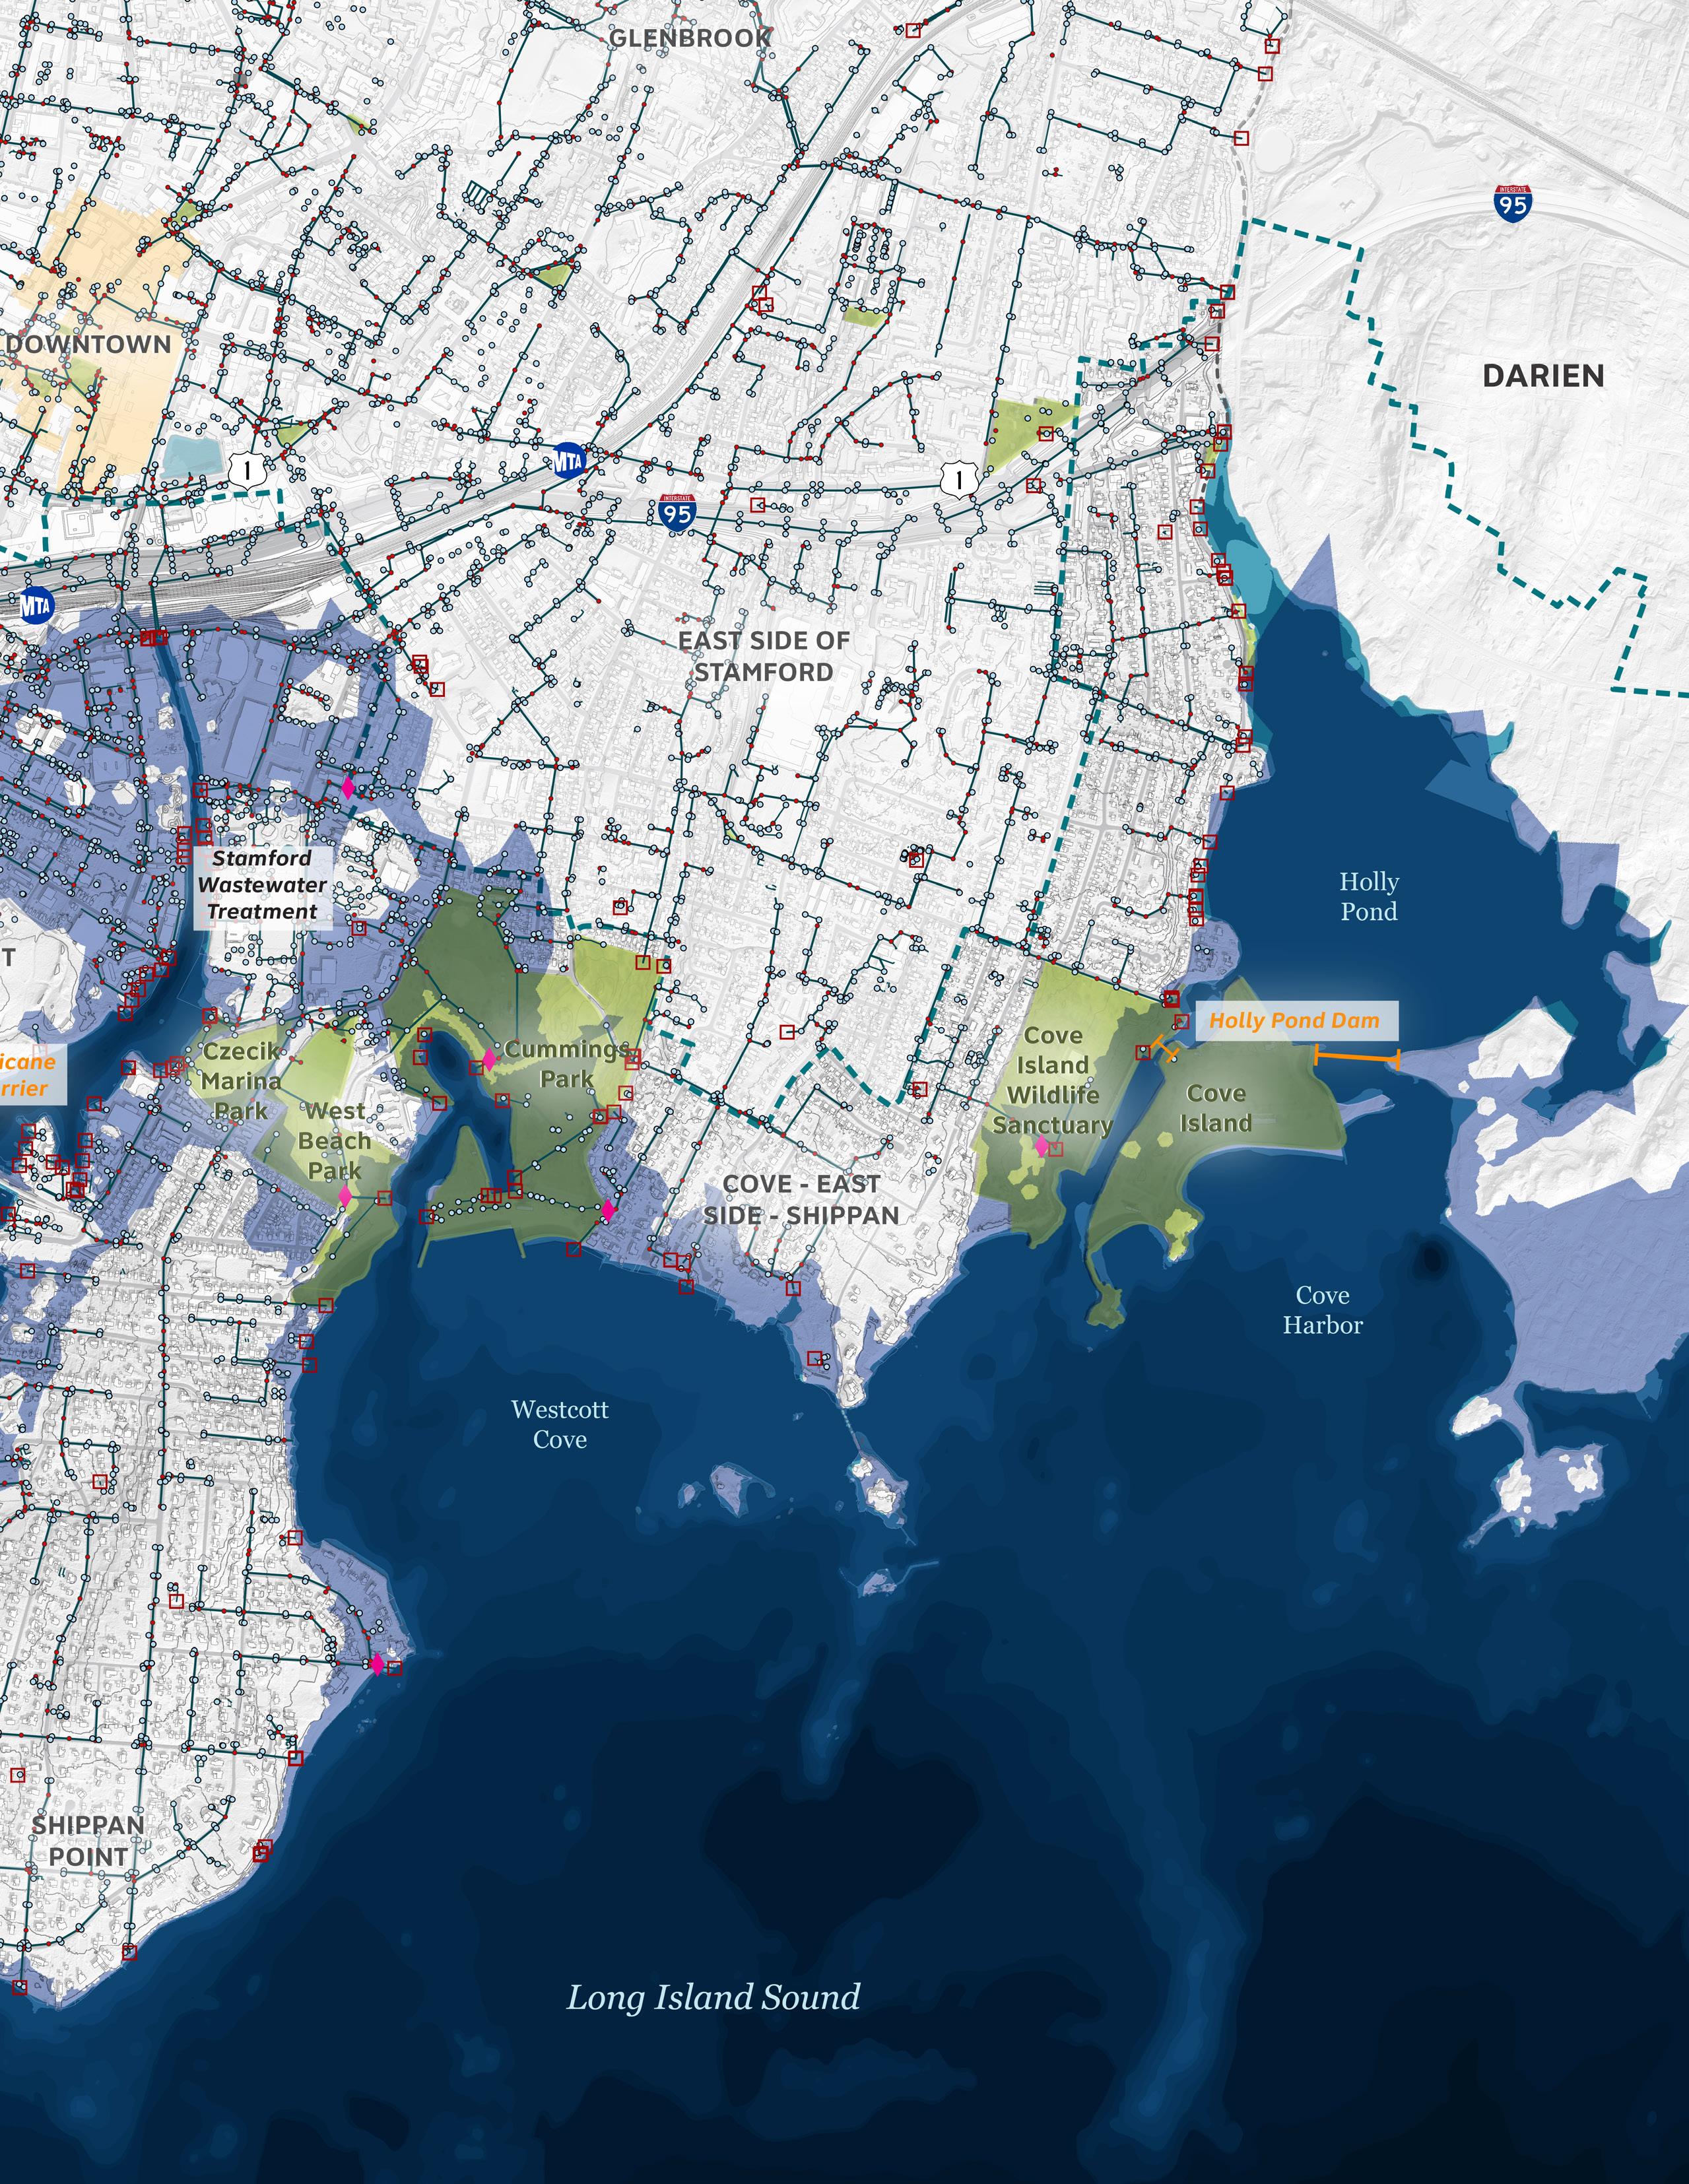
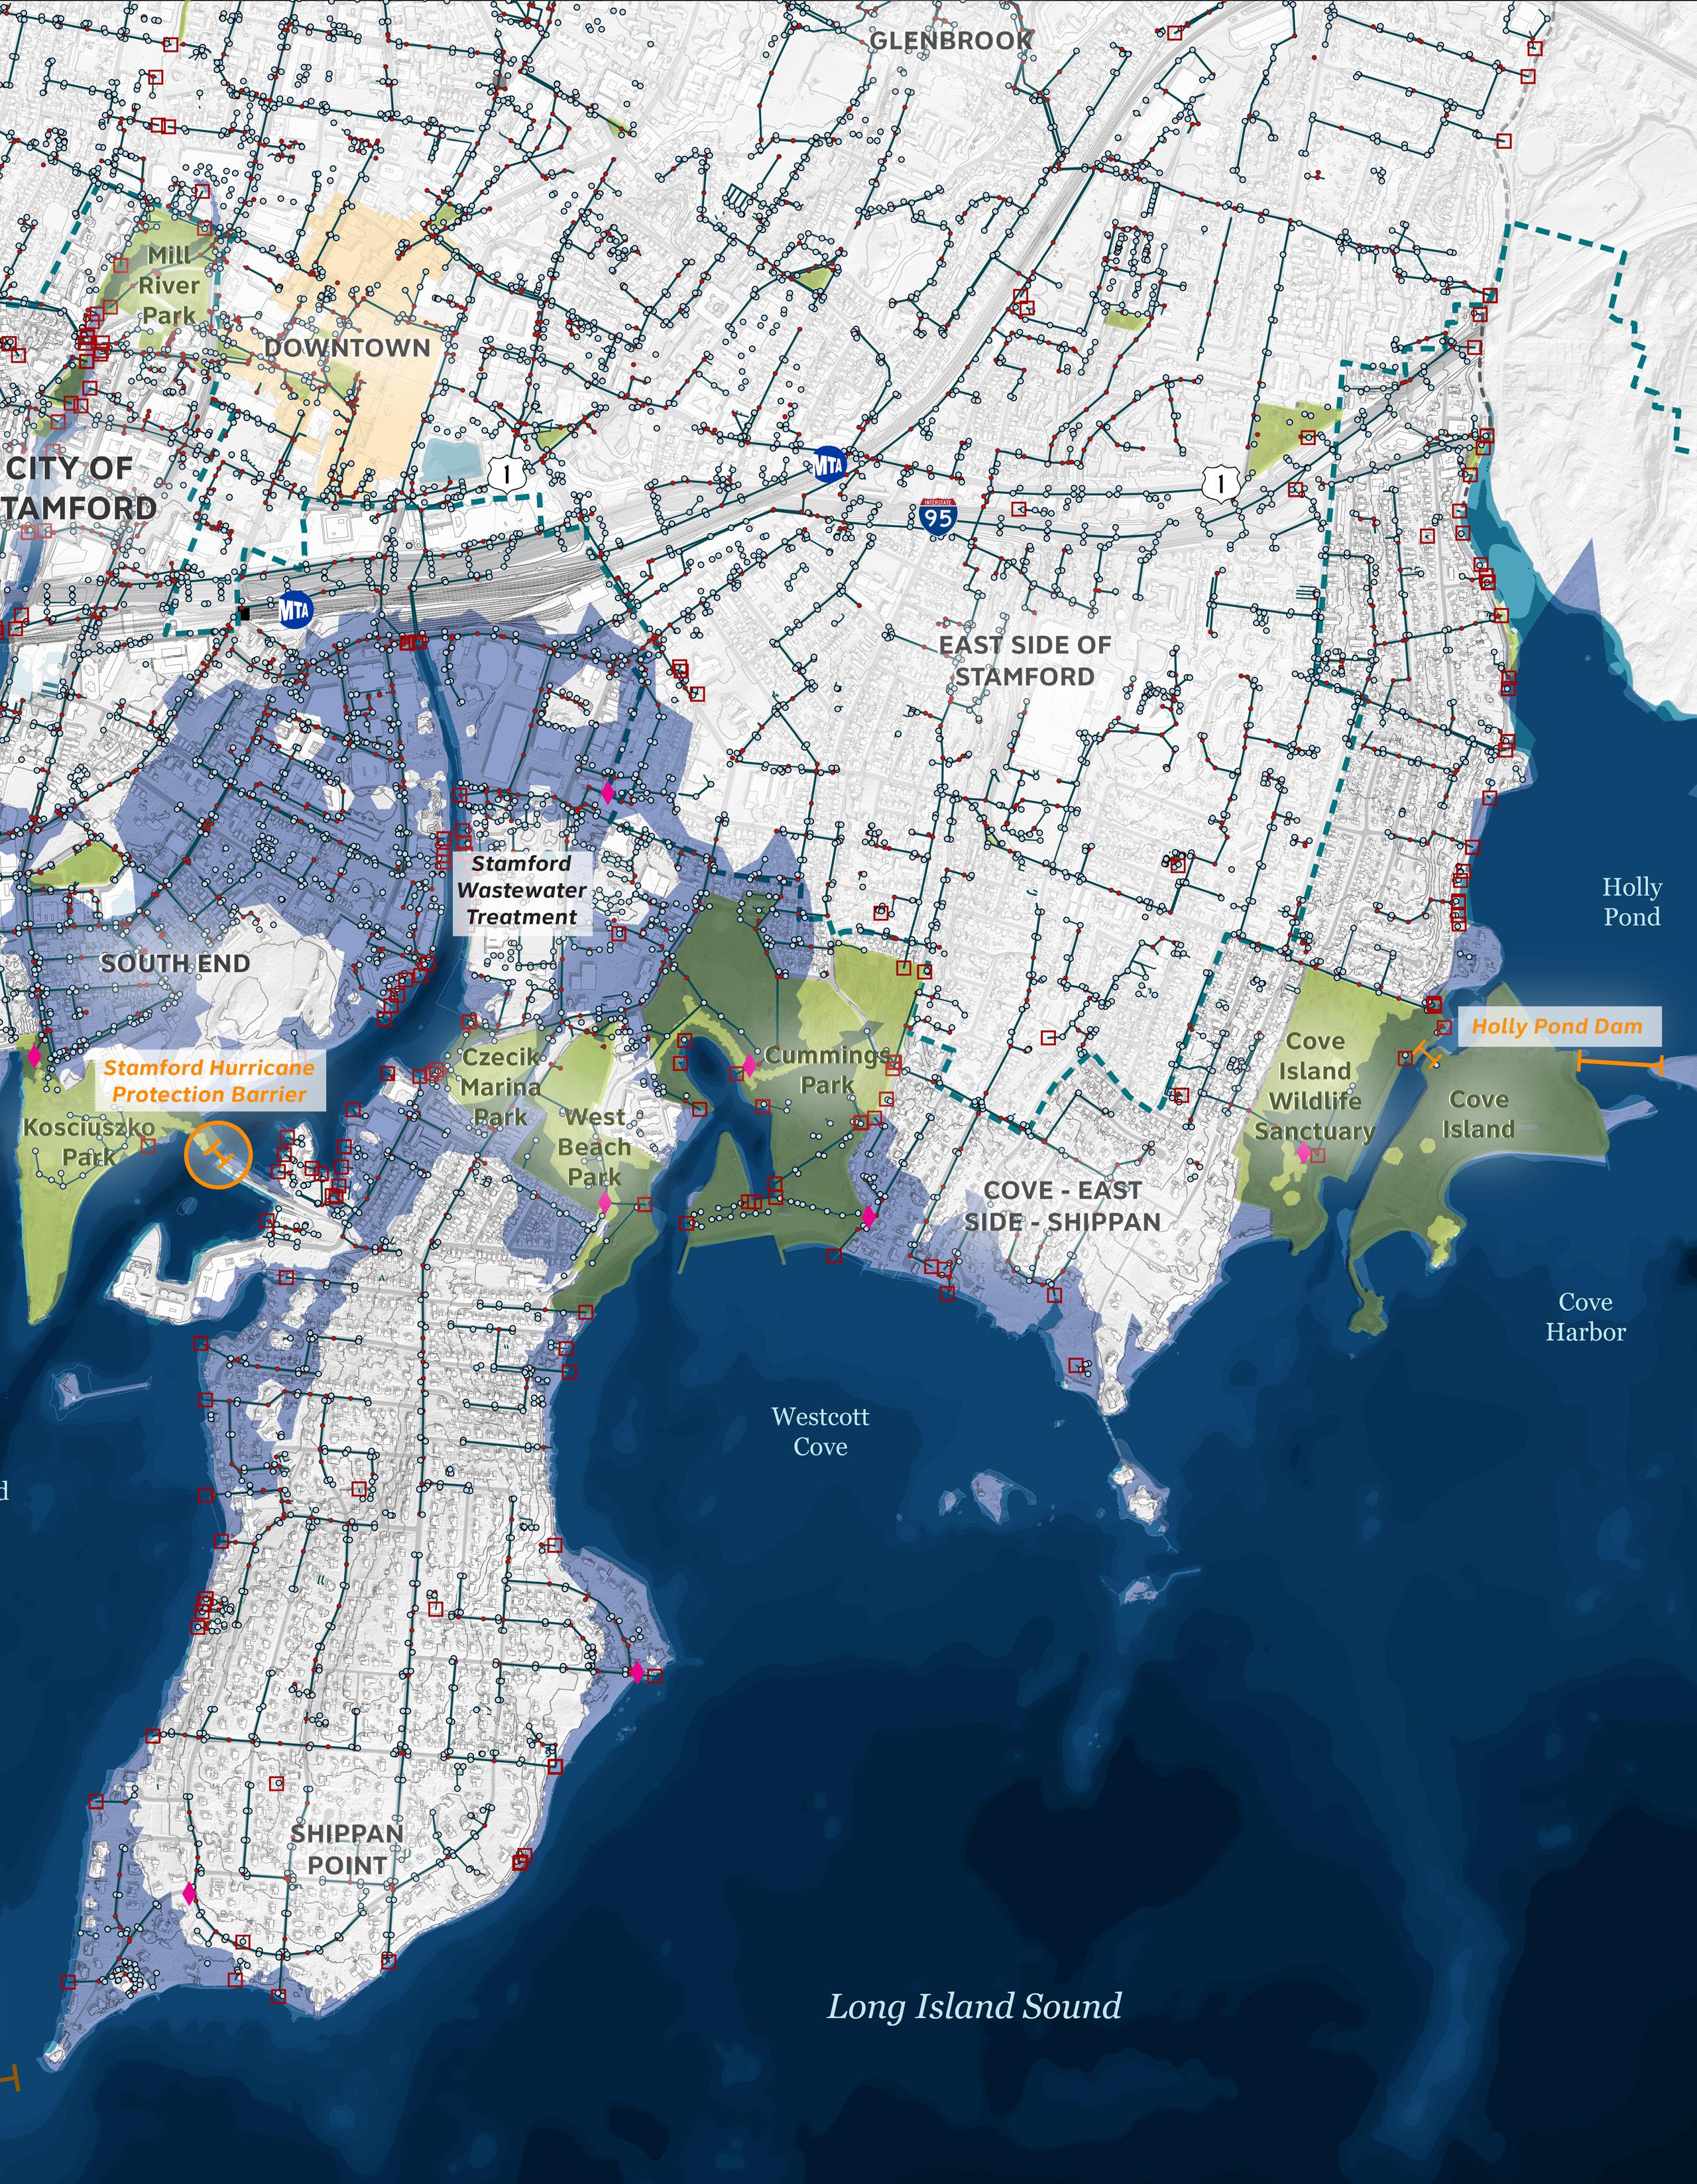
This map shows Stamford’s geography and location in relation to the Long Island Sound and neighboring communities. The blue line that depicts the coastal boundary2 through the City represents the boundary of the project area and the focus of Stamford’s Coastal Resilience Plan.
1 The Centers for Disease Control (CDC) has defined “priority populations” as those who have systematically experienced greater obstacles to health based on their racial or ethnic group; religion; socioeconomic status; gender; age; mental health; cognitive, sensory, or physical disability; sexual orientation or gender identity; geographic location; or other characteristics historically linked to discrimination or exclusion.
2 The “coastal boundary” represents a 1,000-foot setback from the current mean high-water line, inland boundary of state-regulated tidal wetlands, or the “100-year” floodplain, whichever is farthest inland.
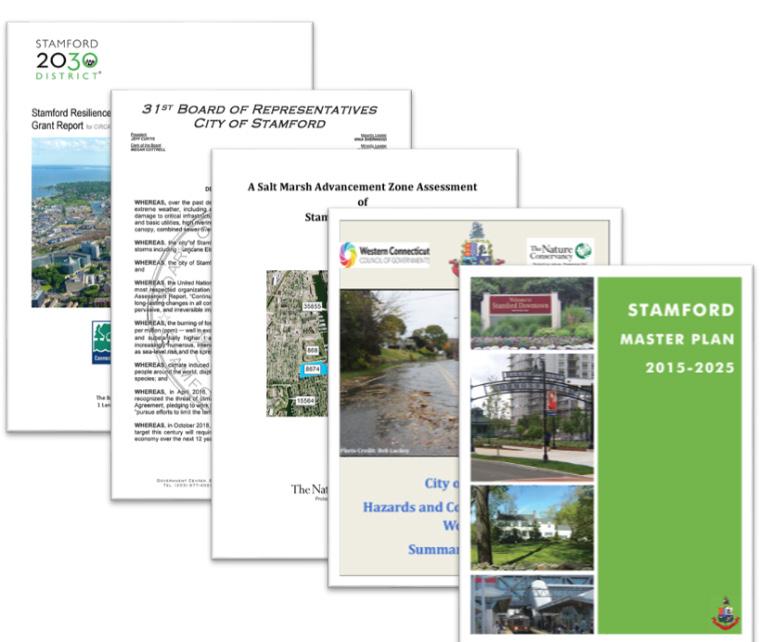
As the first step in the planning process for developing the Stamford Coastal Resilience Plan, the Project Team started by collecting, reviewing, and mapping data and information from past plans and studies on the existing conditions of Stamford’s coast. The plans, studies, and data reviewed as part of this task included:
• Connecticut Institute for Resilience and Climate Adaptation (CIRCA) Report on Coastal Flooding: Stamford, CT (2024)
• Federal Emergency Management Agency (FEMA) flood mapping
• Stamford Resilience Opportunity Assessment Project Grant Report (2018)
• Stamford Hazards and Community Resilience Workshop Summary of Findings (2015)
• Multi-Jurisdictional Hazard Mitigation Plan Update 2021-2026 (adopted August 2021)
• Natural Hazard Mitigation Plan 2016-21 Update for the South Western Region (2016)
• Stamford Master Plan 2015-2025 (adopted December 2014)
• City of Stamford Stormwater Drainage Manual (2020)
• Resolution 4130 – Declaring a Climate Emergency (2022)
• Tree Inventory Summary Report (2022)
• Facilities Master Plan for Cummings Park and West Beach (2015)
• Cummings Pond Restoration Master Plan (2019)
• A Salt Marsh Advancement Zone Assessment of Stamford, Connecticut (2014)
• Resilient Connecticut Phase II (February 2022)
• South End Neighborhood Study (2018)
• West Side Neighborhood Plan (2013)
Additional references were reviewed as needed in consultation with members of the Technical Advisory Committee and City staff.
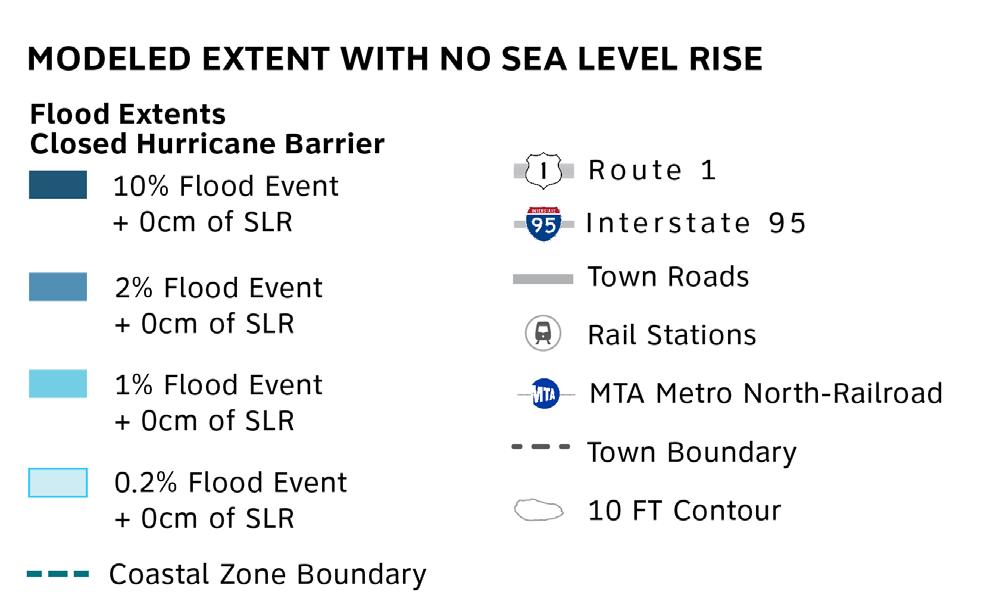
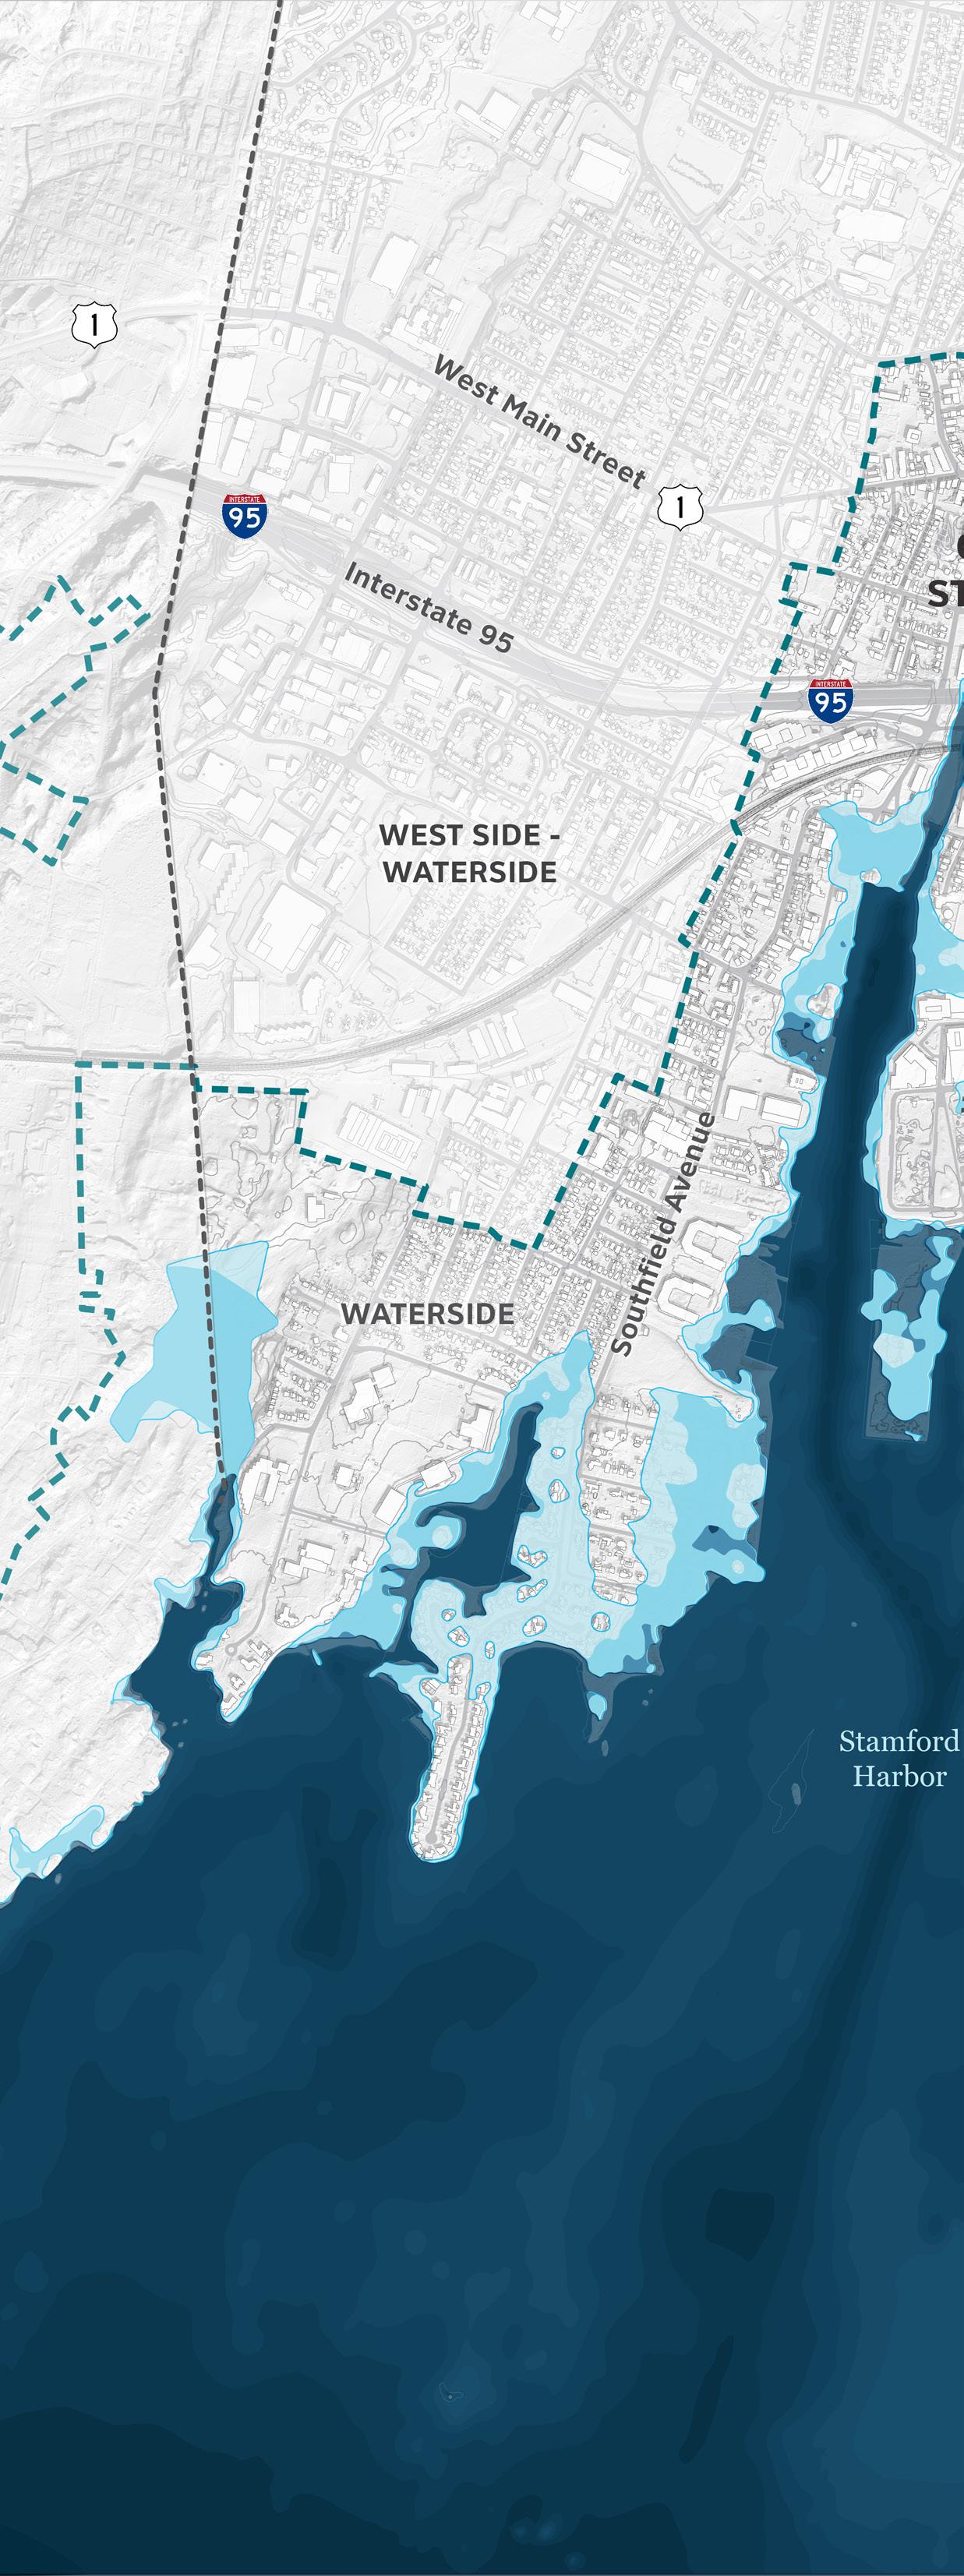
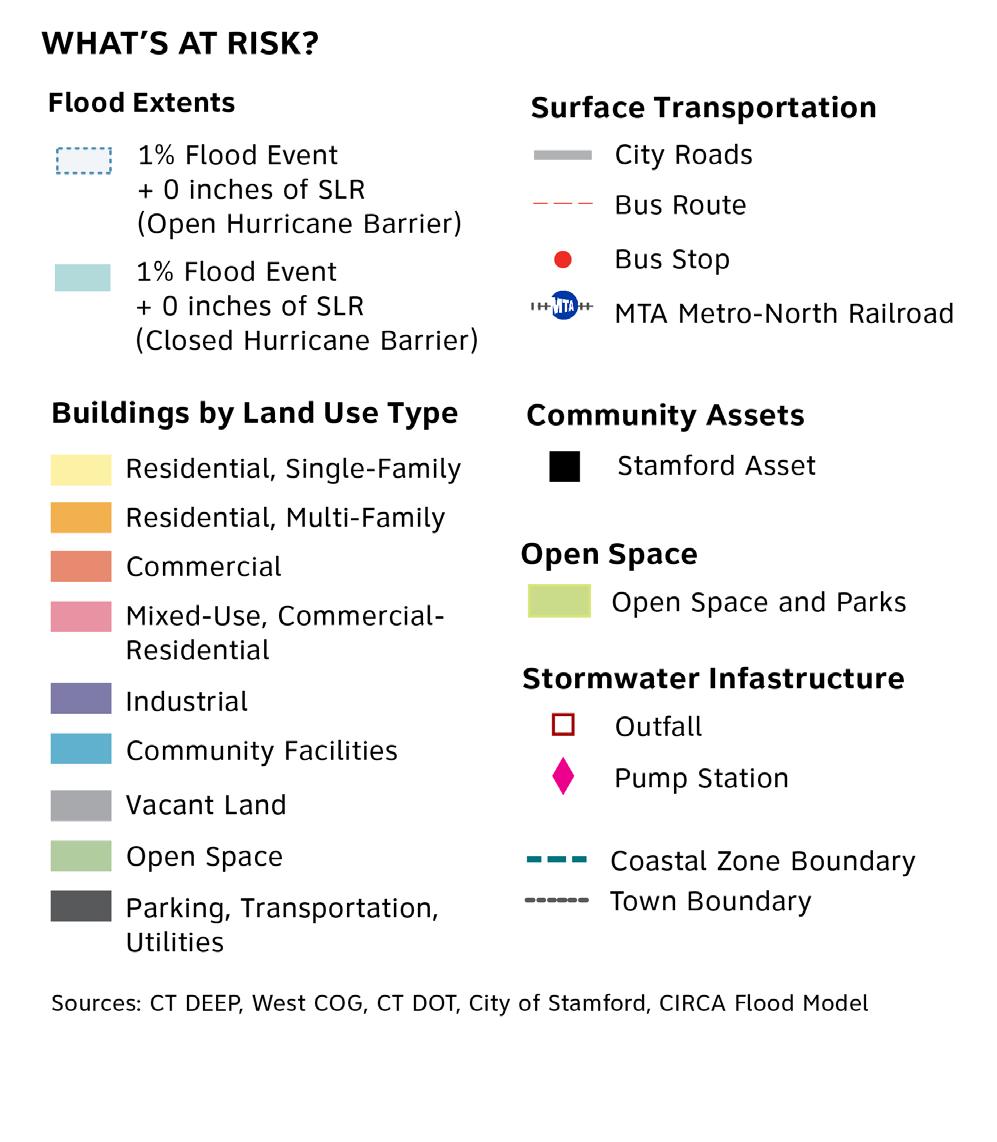
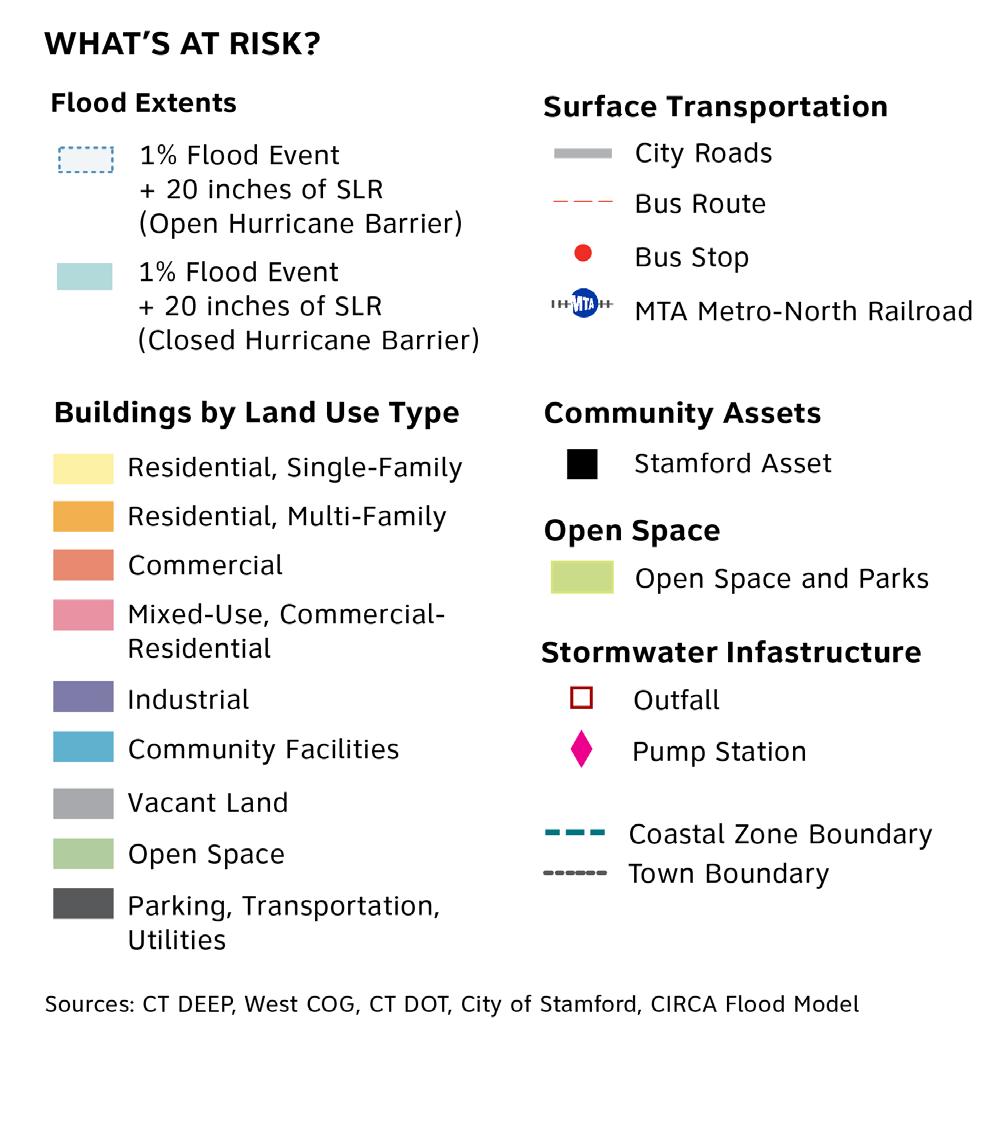
The Project Team consulted with CIRCA to obtain the latest current and future/projected coastal modeling information. These models helped visualize critical assets and communities at risk from different coastal flooding scenarios, including scenarios modeling the opening and closing of the Stamford Hurricane Protection Barrier. Ultimately, the aim is to compare and groundtruth these modeled results with historical observations made by members of the community and Technical Advisory Committee. Maps illustrating the extent of these coastal flood modeling scenarios are shown on the subsequent pages of this summary, emphasizing the closed Hurricane Barrier scenarios; mapped scenarios with the barrier left open can be found in the Appendix.
Coastal flooding occurs when land is inundated by coastal storms and/or tidal floodwaters. As climate change elevates sea levels, more areas of the City are likely to become subject to daily tidal flooding. Concurrently, coastal storms are projected to become more frequent and intense, which can introduce additional wave action and storm surge, further expanding the extent of coastal flooding. It is important to note that runoff and drainage issues can further compound coastal flood vulnerability, although these forces are beyond this scope of this project.
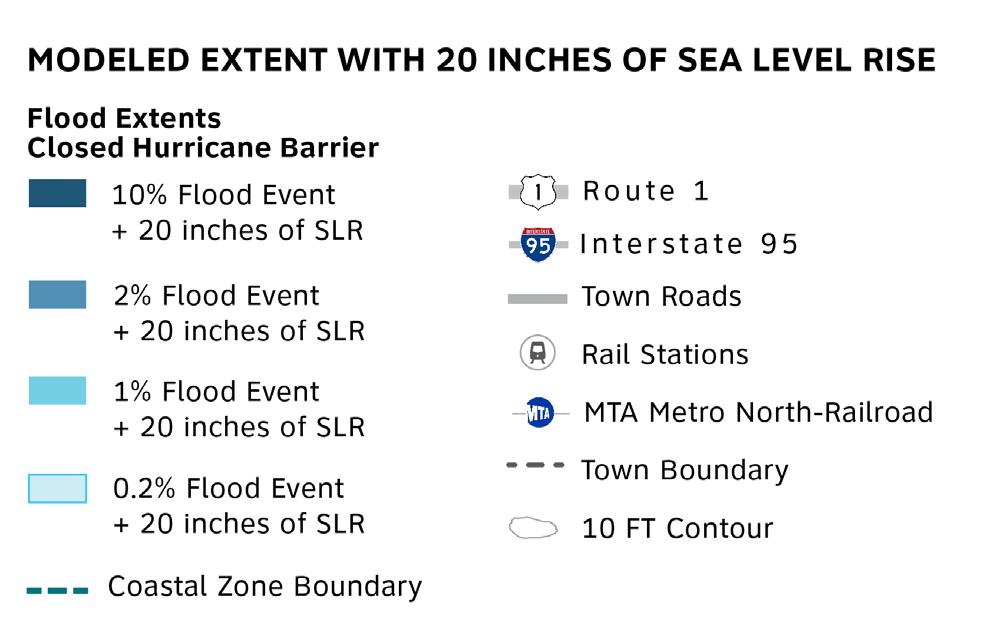
To capture the complex, dynamic processes of tides, storms, and waves, CIRCA generated coastal flood models simulating the extent of coastal flooding under several SLR and storm scenarios for the City of Stamford. The scenarios included the 10%, 2%, 1%, and 0.2% annual exceedance probability (AEP) storm events for present-day and future scenarios with 20 inches and 40 inches (in) of SLR . As mentioned earlier, these scenarios also modeled conditions resulting from the opening and closing
of the Stamford Hurricane Protection Barrier, which was built by the U.S. Army Corps of Engineers (USACE) in the 1960s to reduce the City’s risk from coastal storms. The City of Stamford is responsible for the operation and maintenance of the barrier, with the exception of the navigation gates, which are operated and maintained by USACE.
In addition to SLR, coastal storms—and their corresponding impacts on flood water levels— are another important factor to consider when assessing Stamford’s vulnerability to coastal flooding. Coastal storms produce winds that can push ocean water toward the land, creating a surge in water elevation above the normal high tide. The maximum flood water level reached during a storm event combines this surge with tidal fluctuations, creating what is known as a storm tide. Due to the compounding impacts of SLR, a less powerful storm in the future may produce the same extent of flooding as a more powerful storm today.

Sea level rise (SLR) is one of the most potentially destructive impacts of climate change for coastal communities like Stamford. As mean sea levels rise, more of Stamford’s low-lying coastal areas are likely to become inundated by daily tidal flooding. Daily tidal flooding may also impact the capacity of nearby drainage systems, as uncontrolled tidal waters can push saltwater further inland through vulnerable pipe networks.
Annual exceedance probability (AEP) is the probability that a storm of a particular magnitude will be met or exceeded within a given year. A storm causing coastal flooding with an AEP of 50% has a 1 in 2 chance of occurring at any point within a given year. With the likelihood that storms will become more intense and more frequent over time as a result of climate change, it will become more common for storms to result in higher flood elevations.
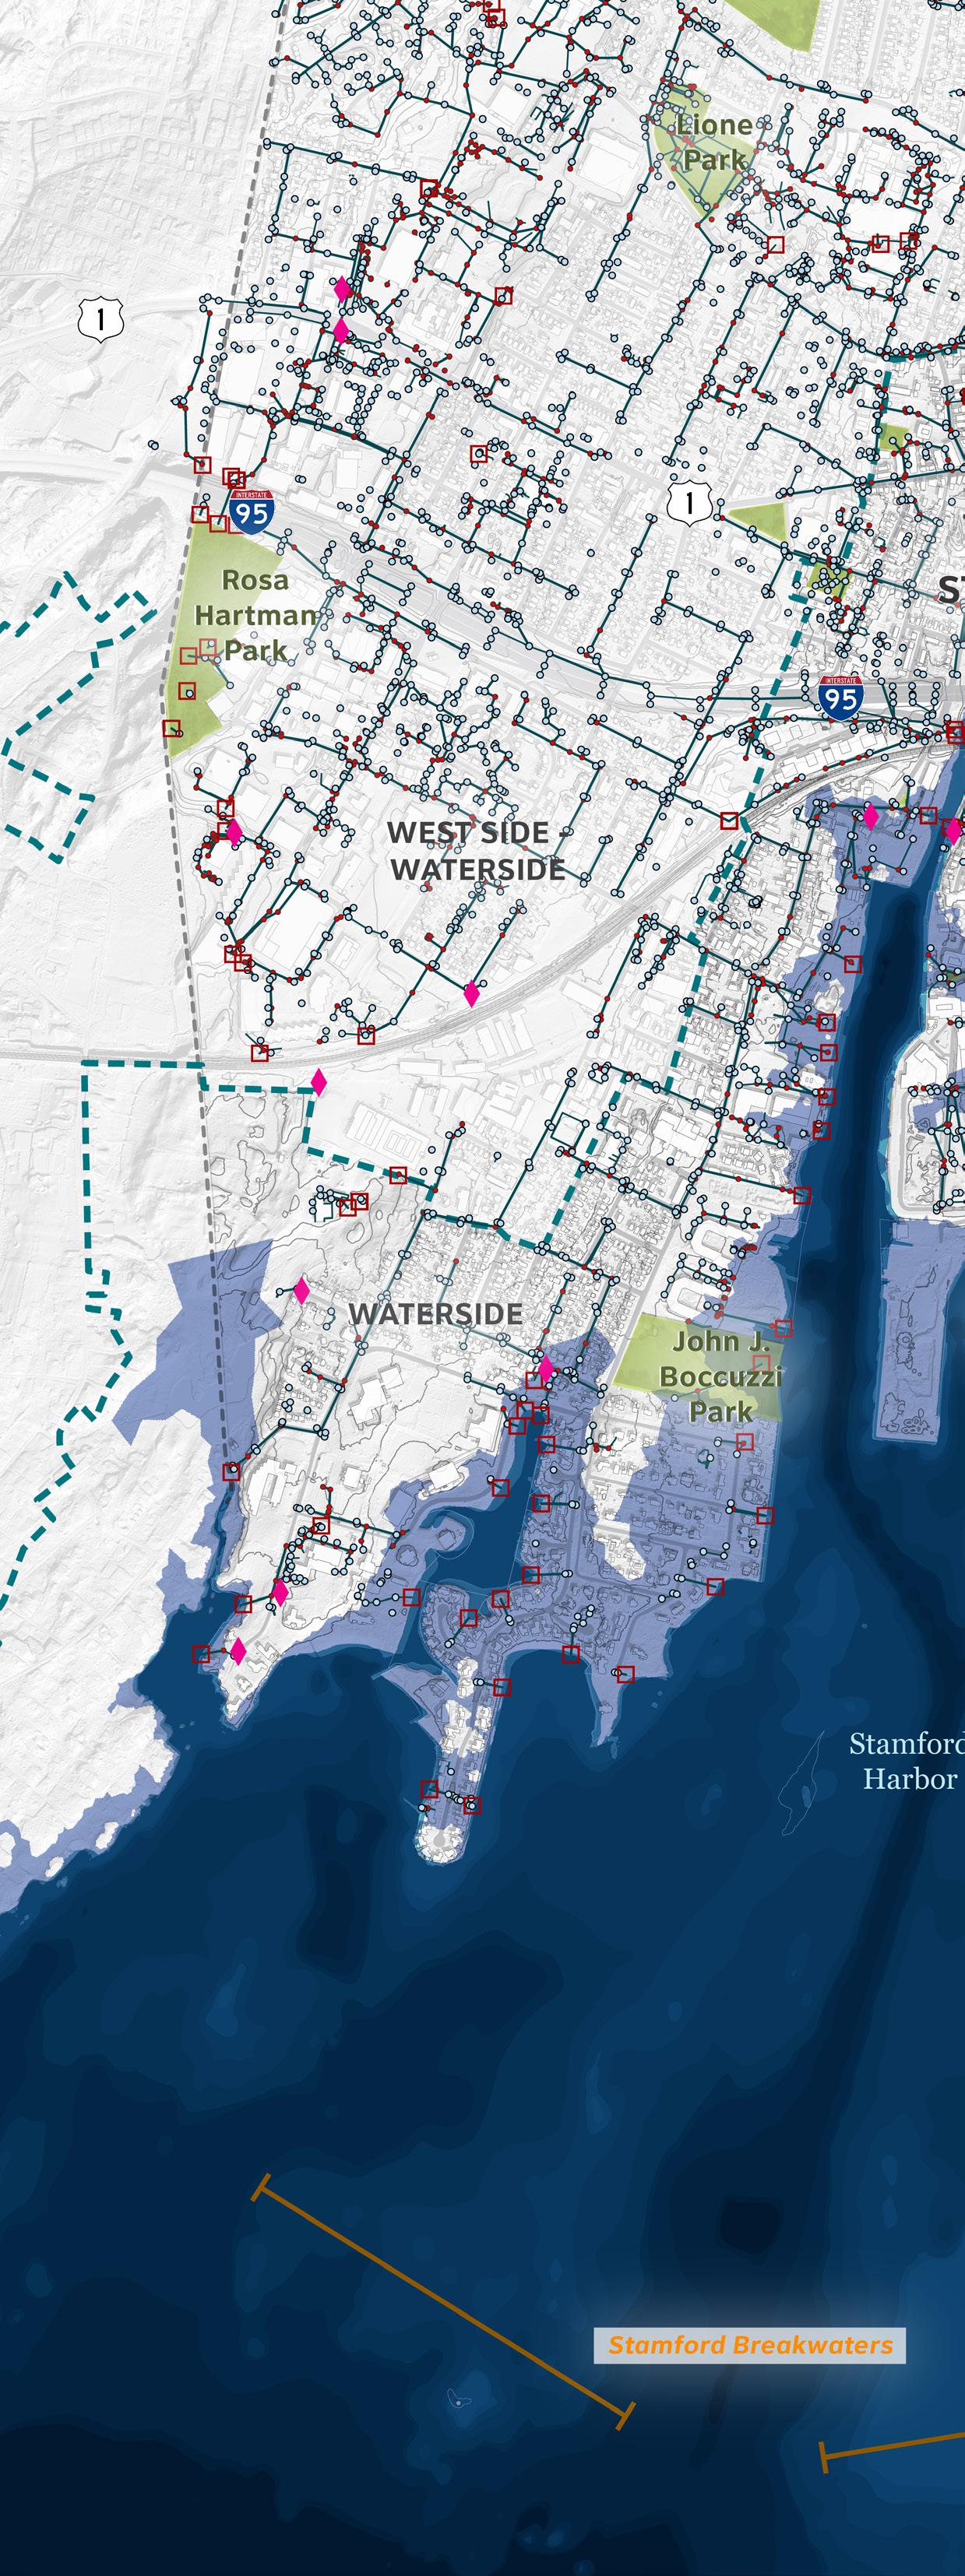
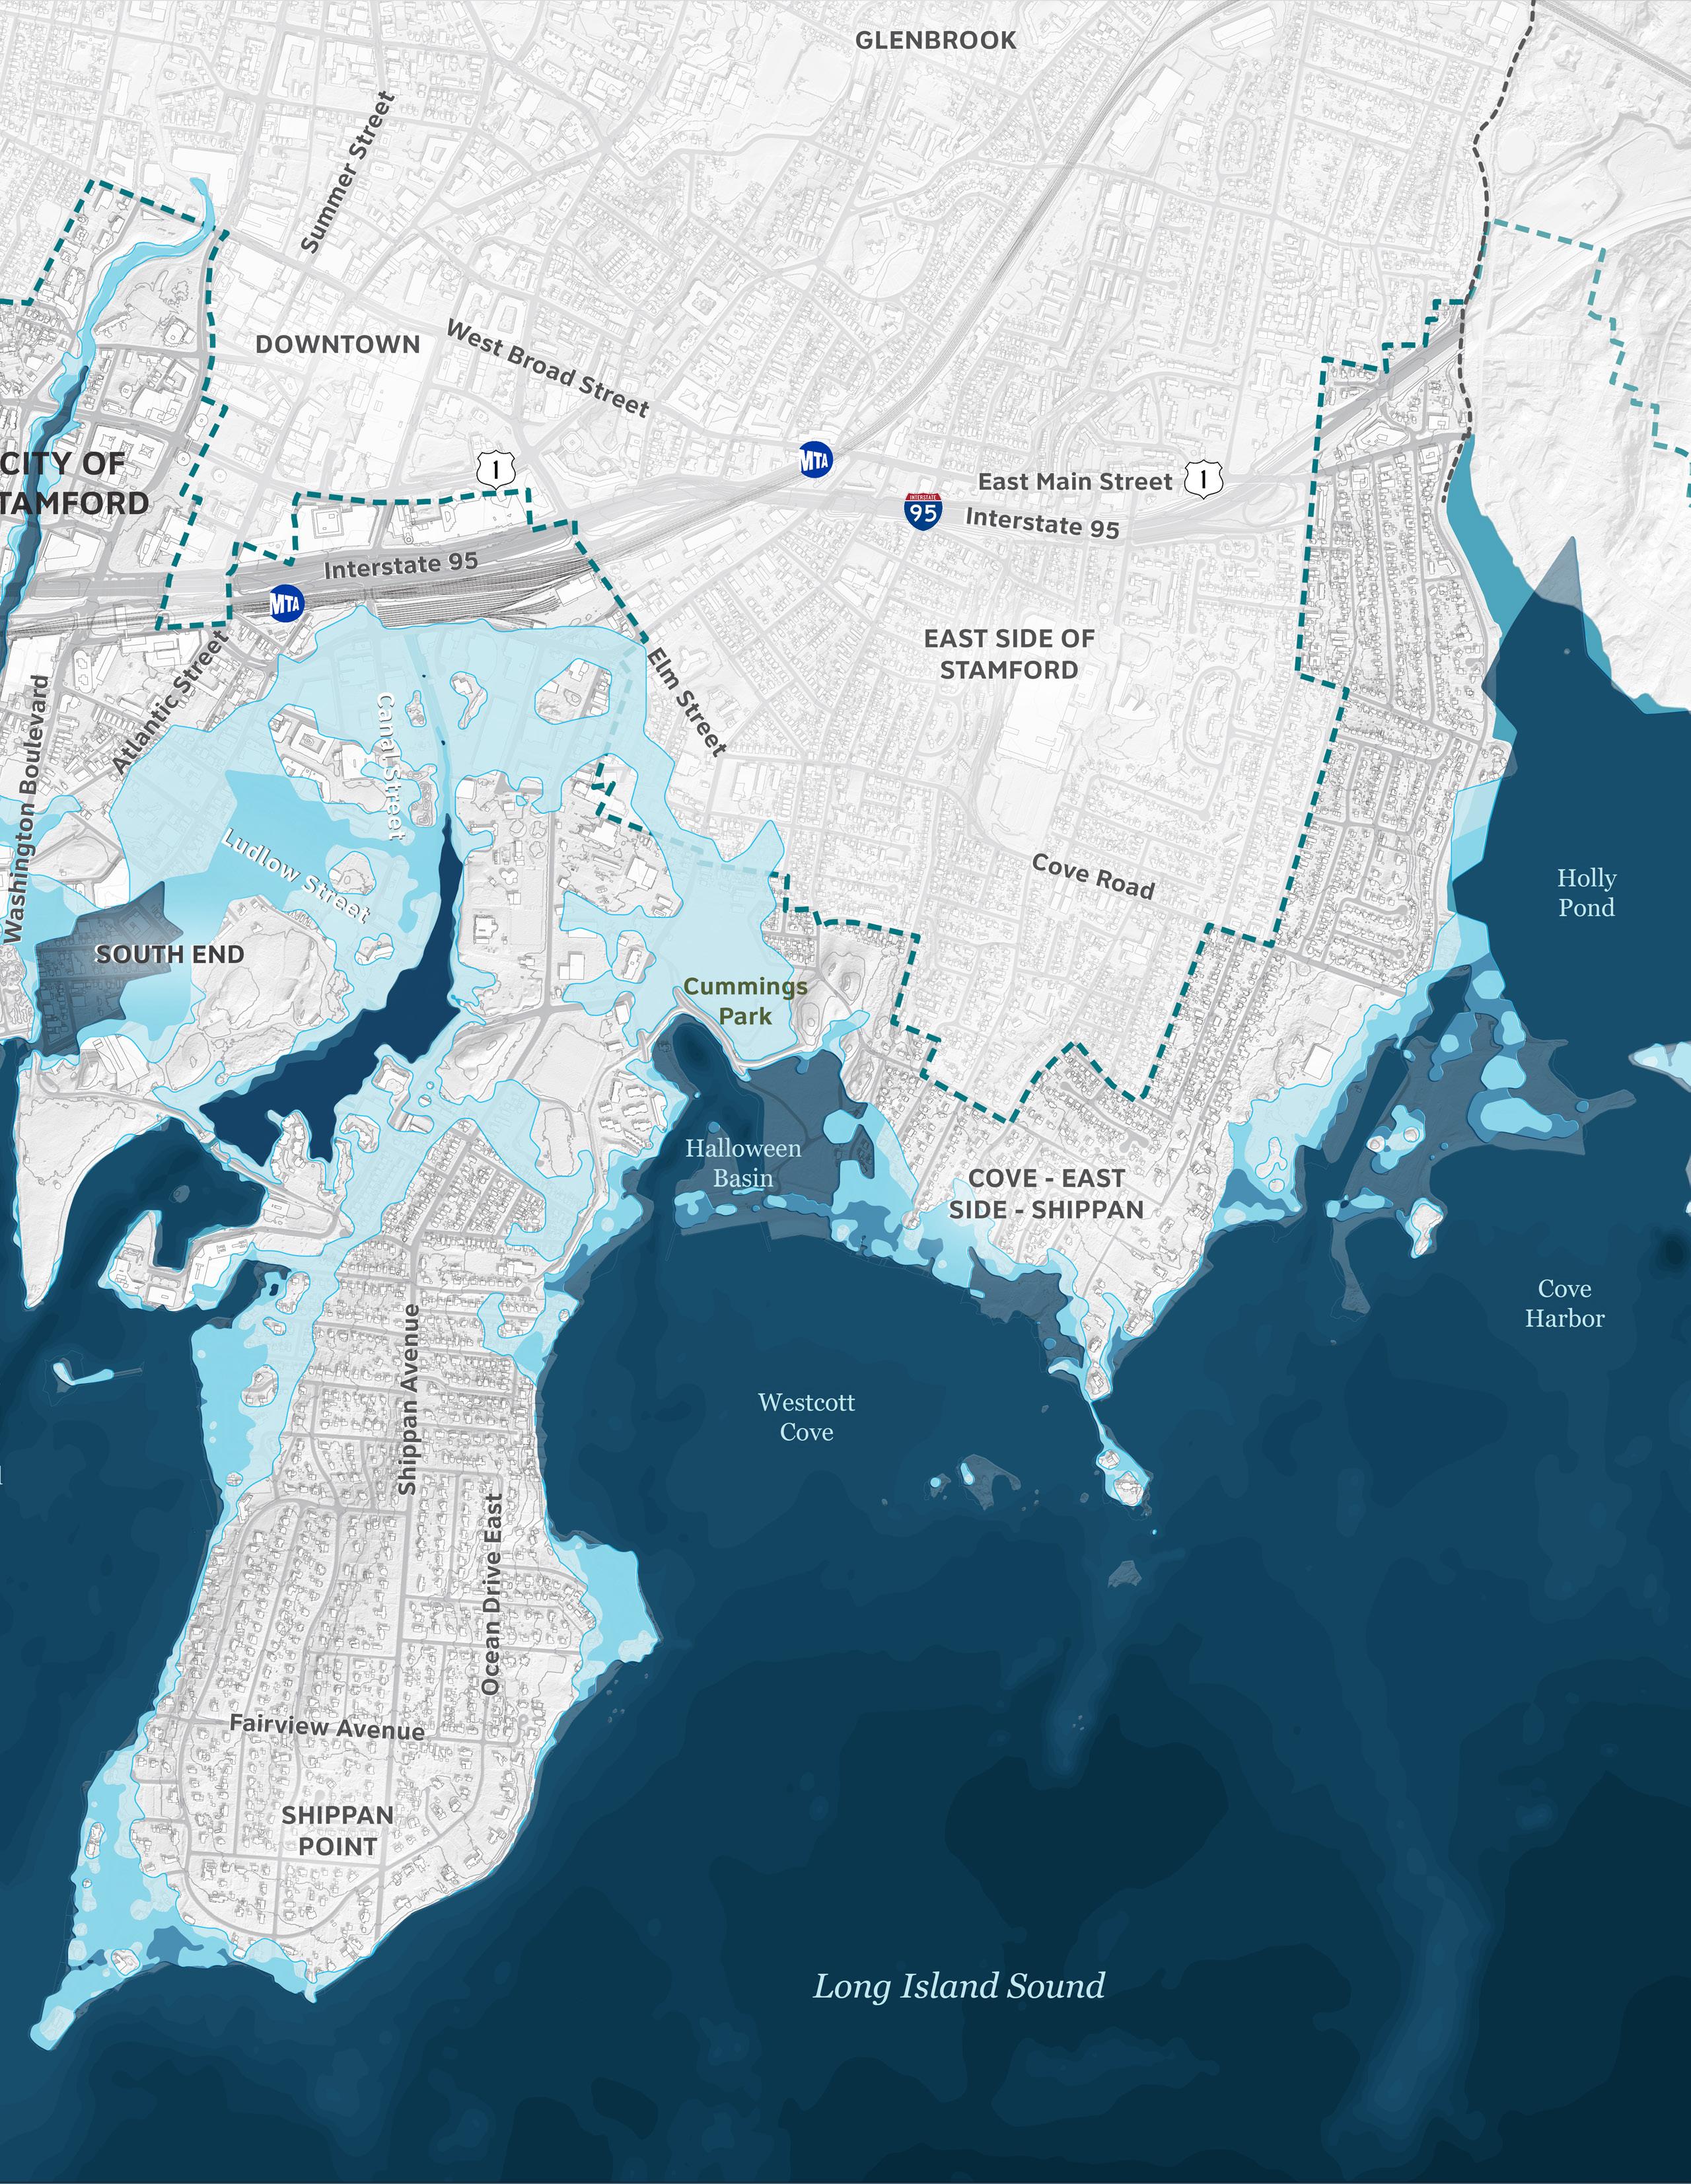
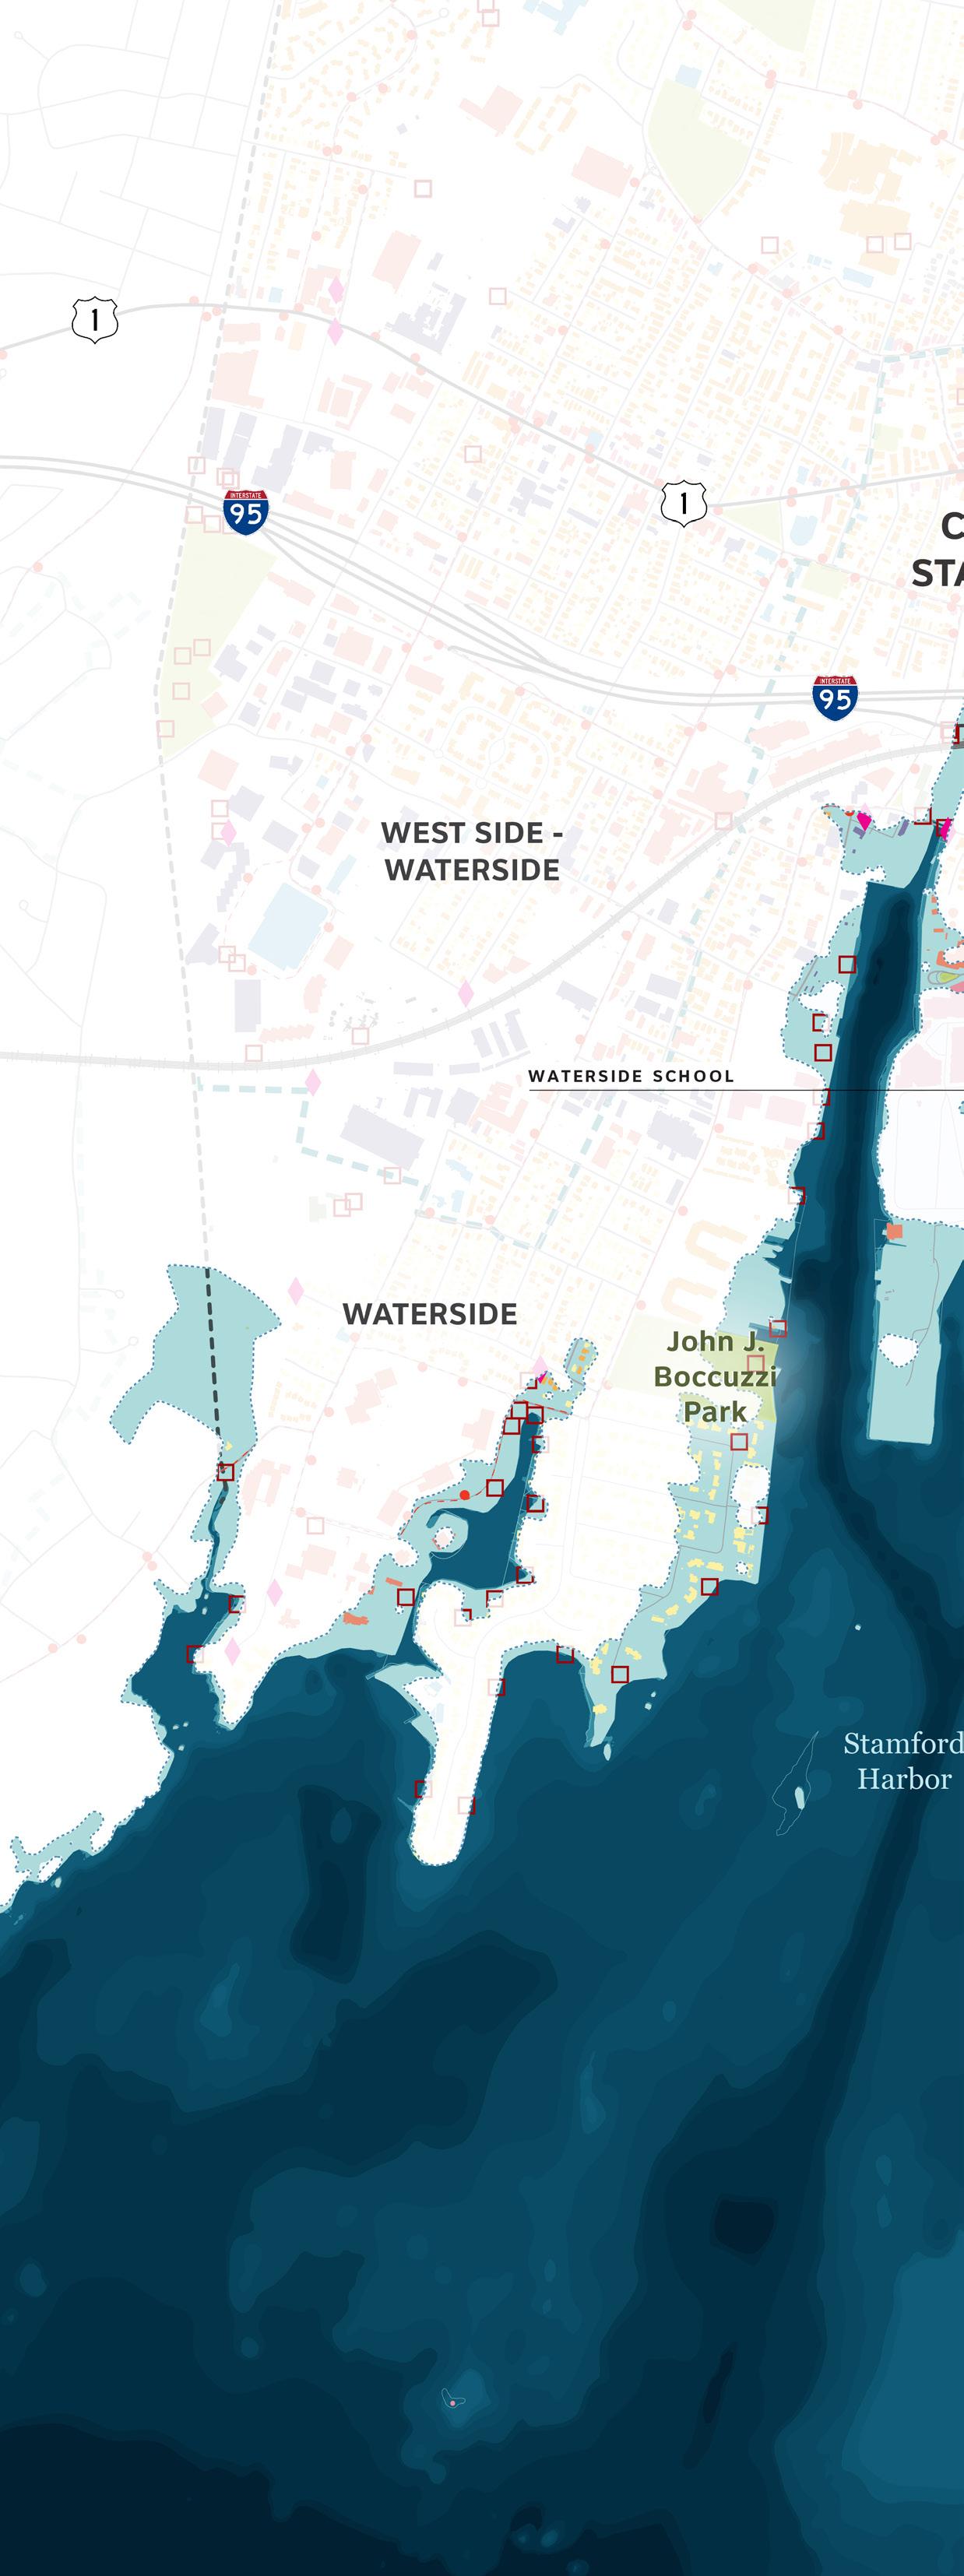
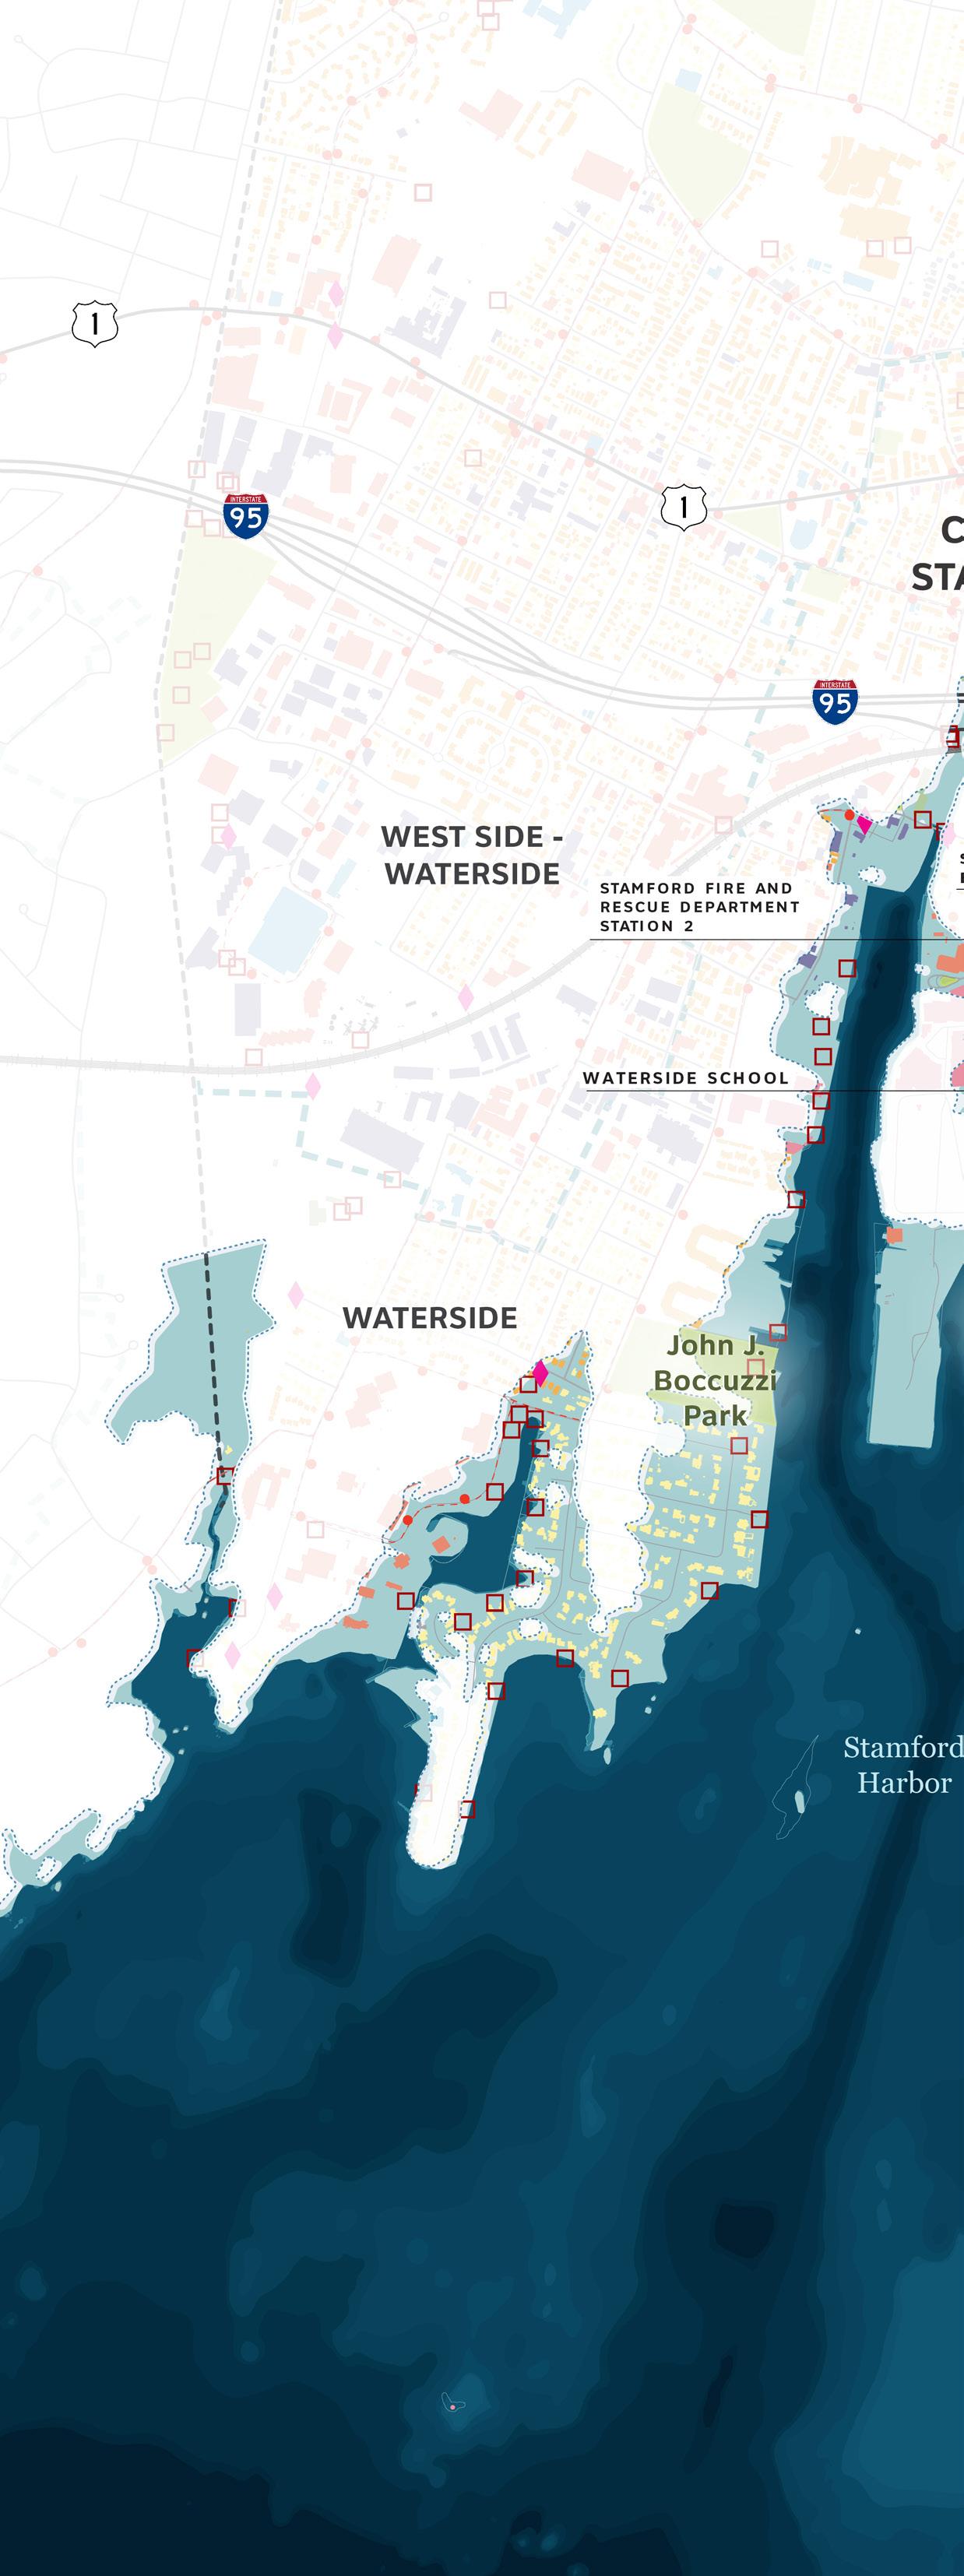
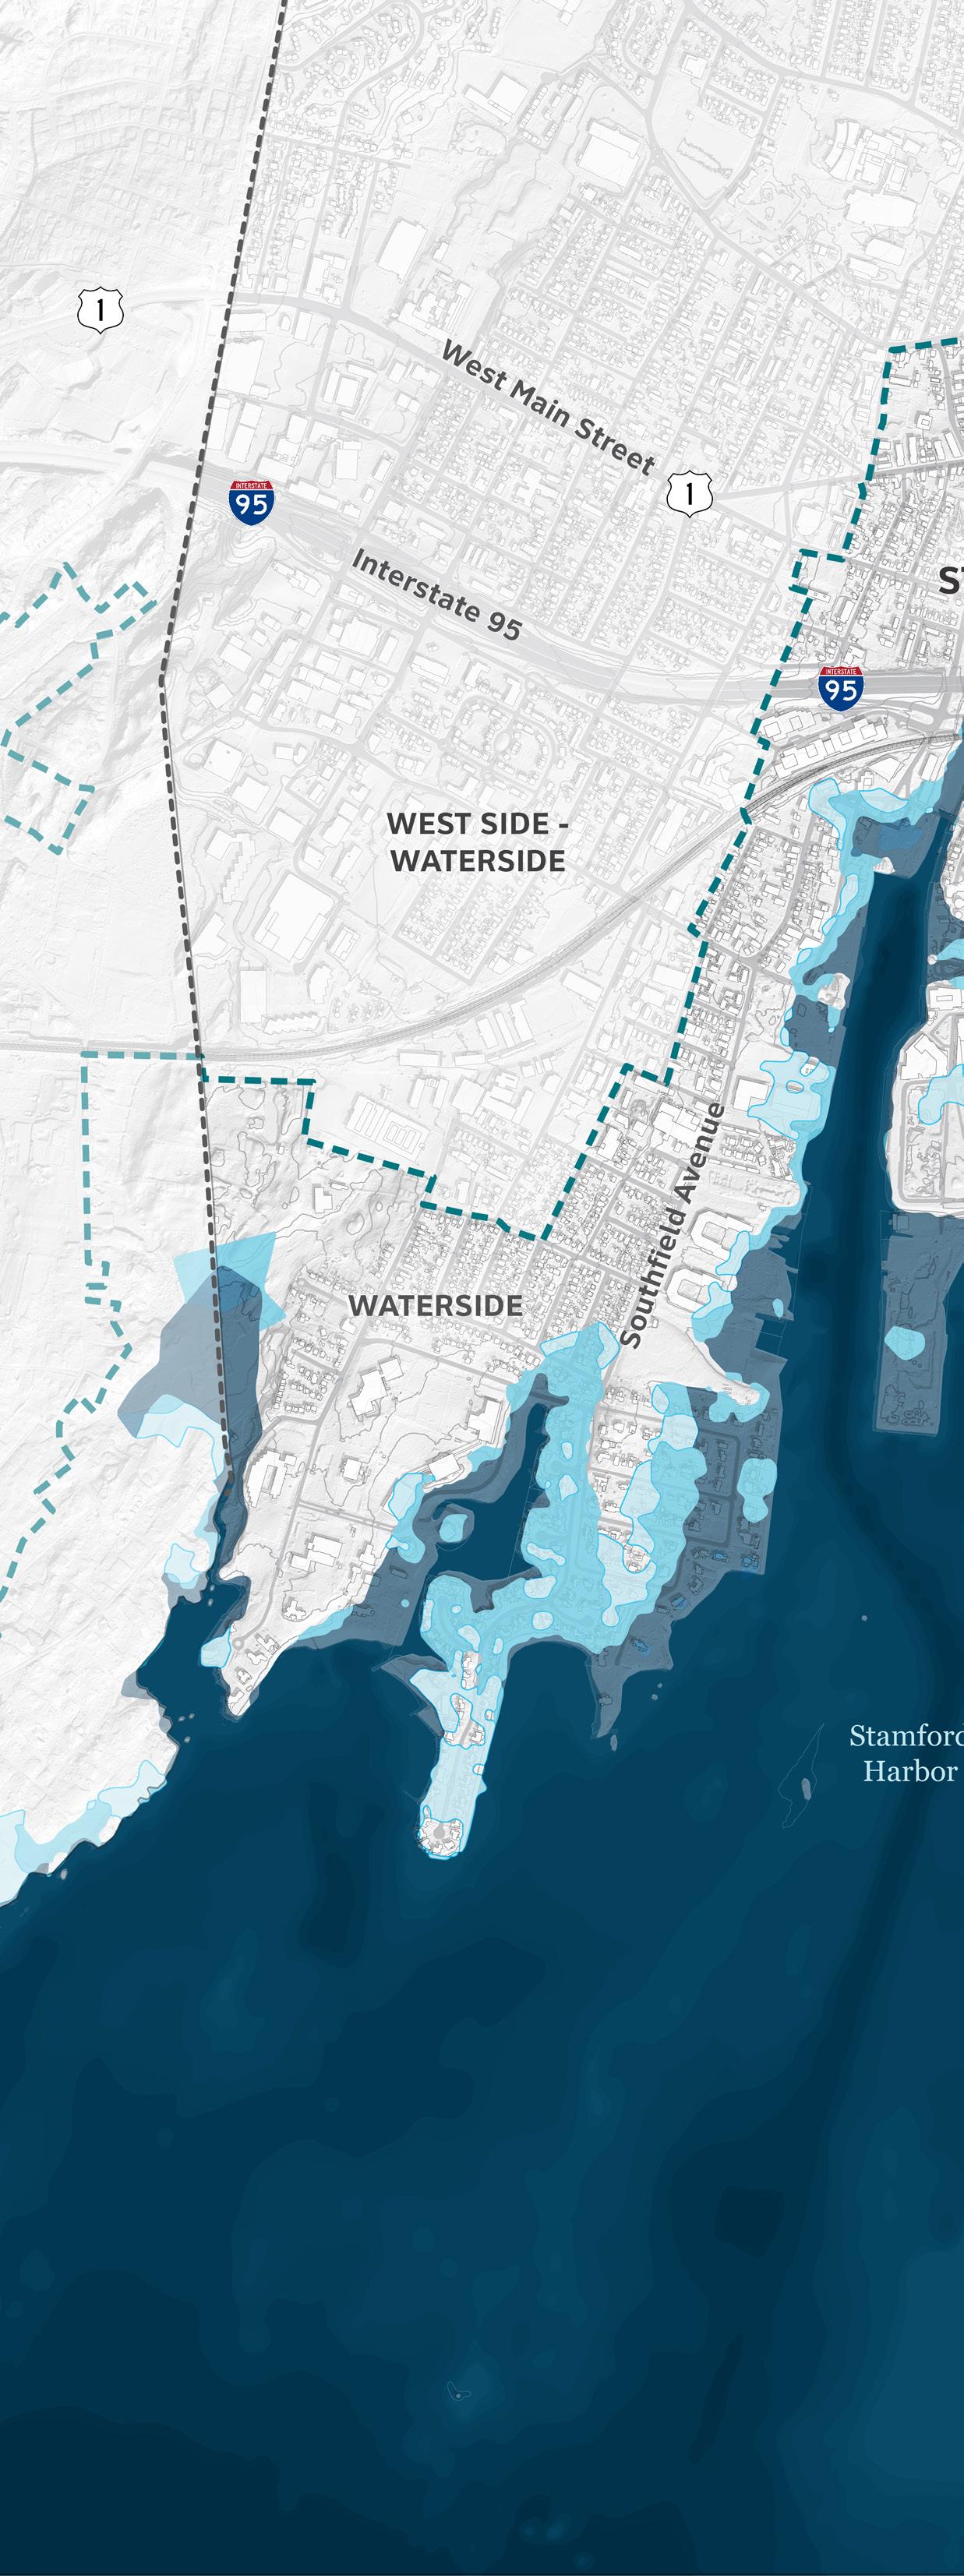
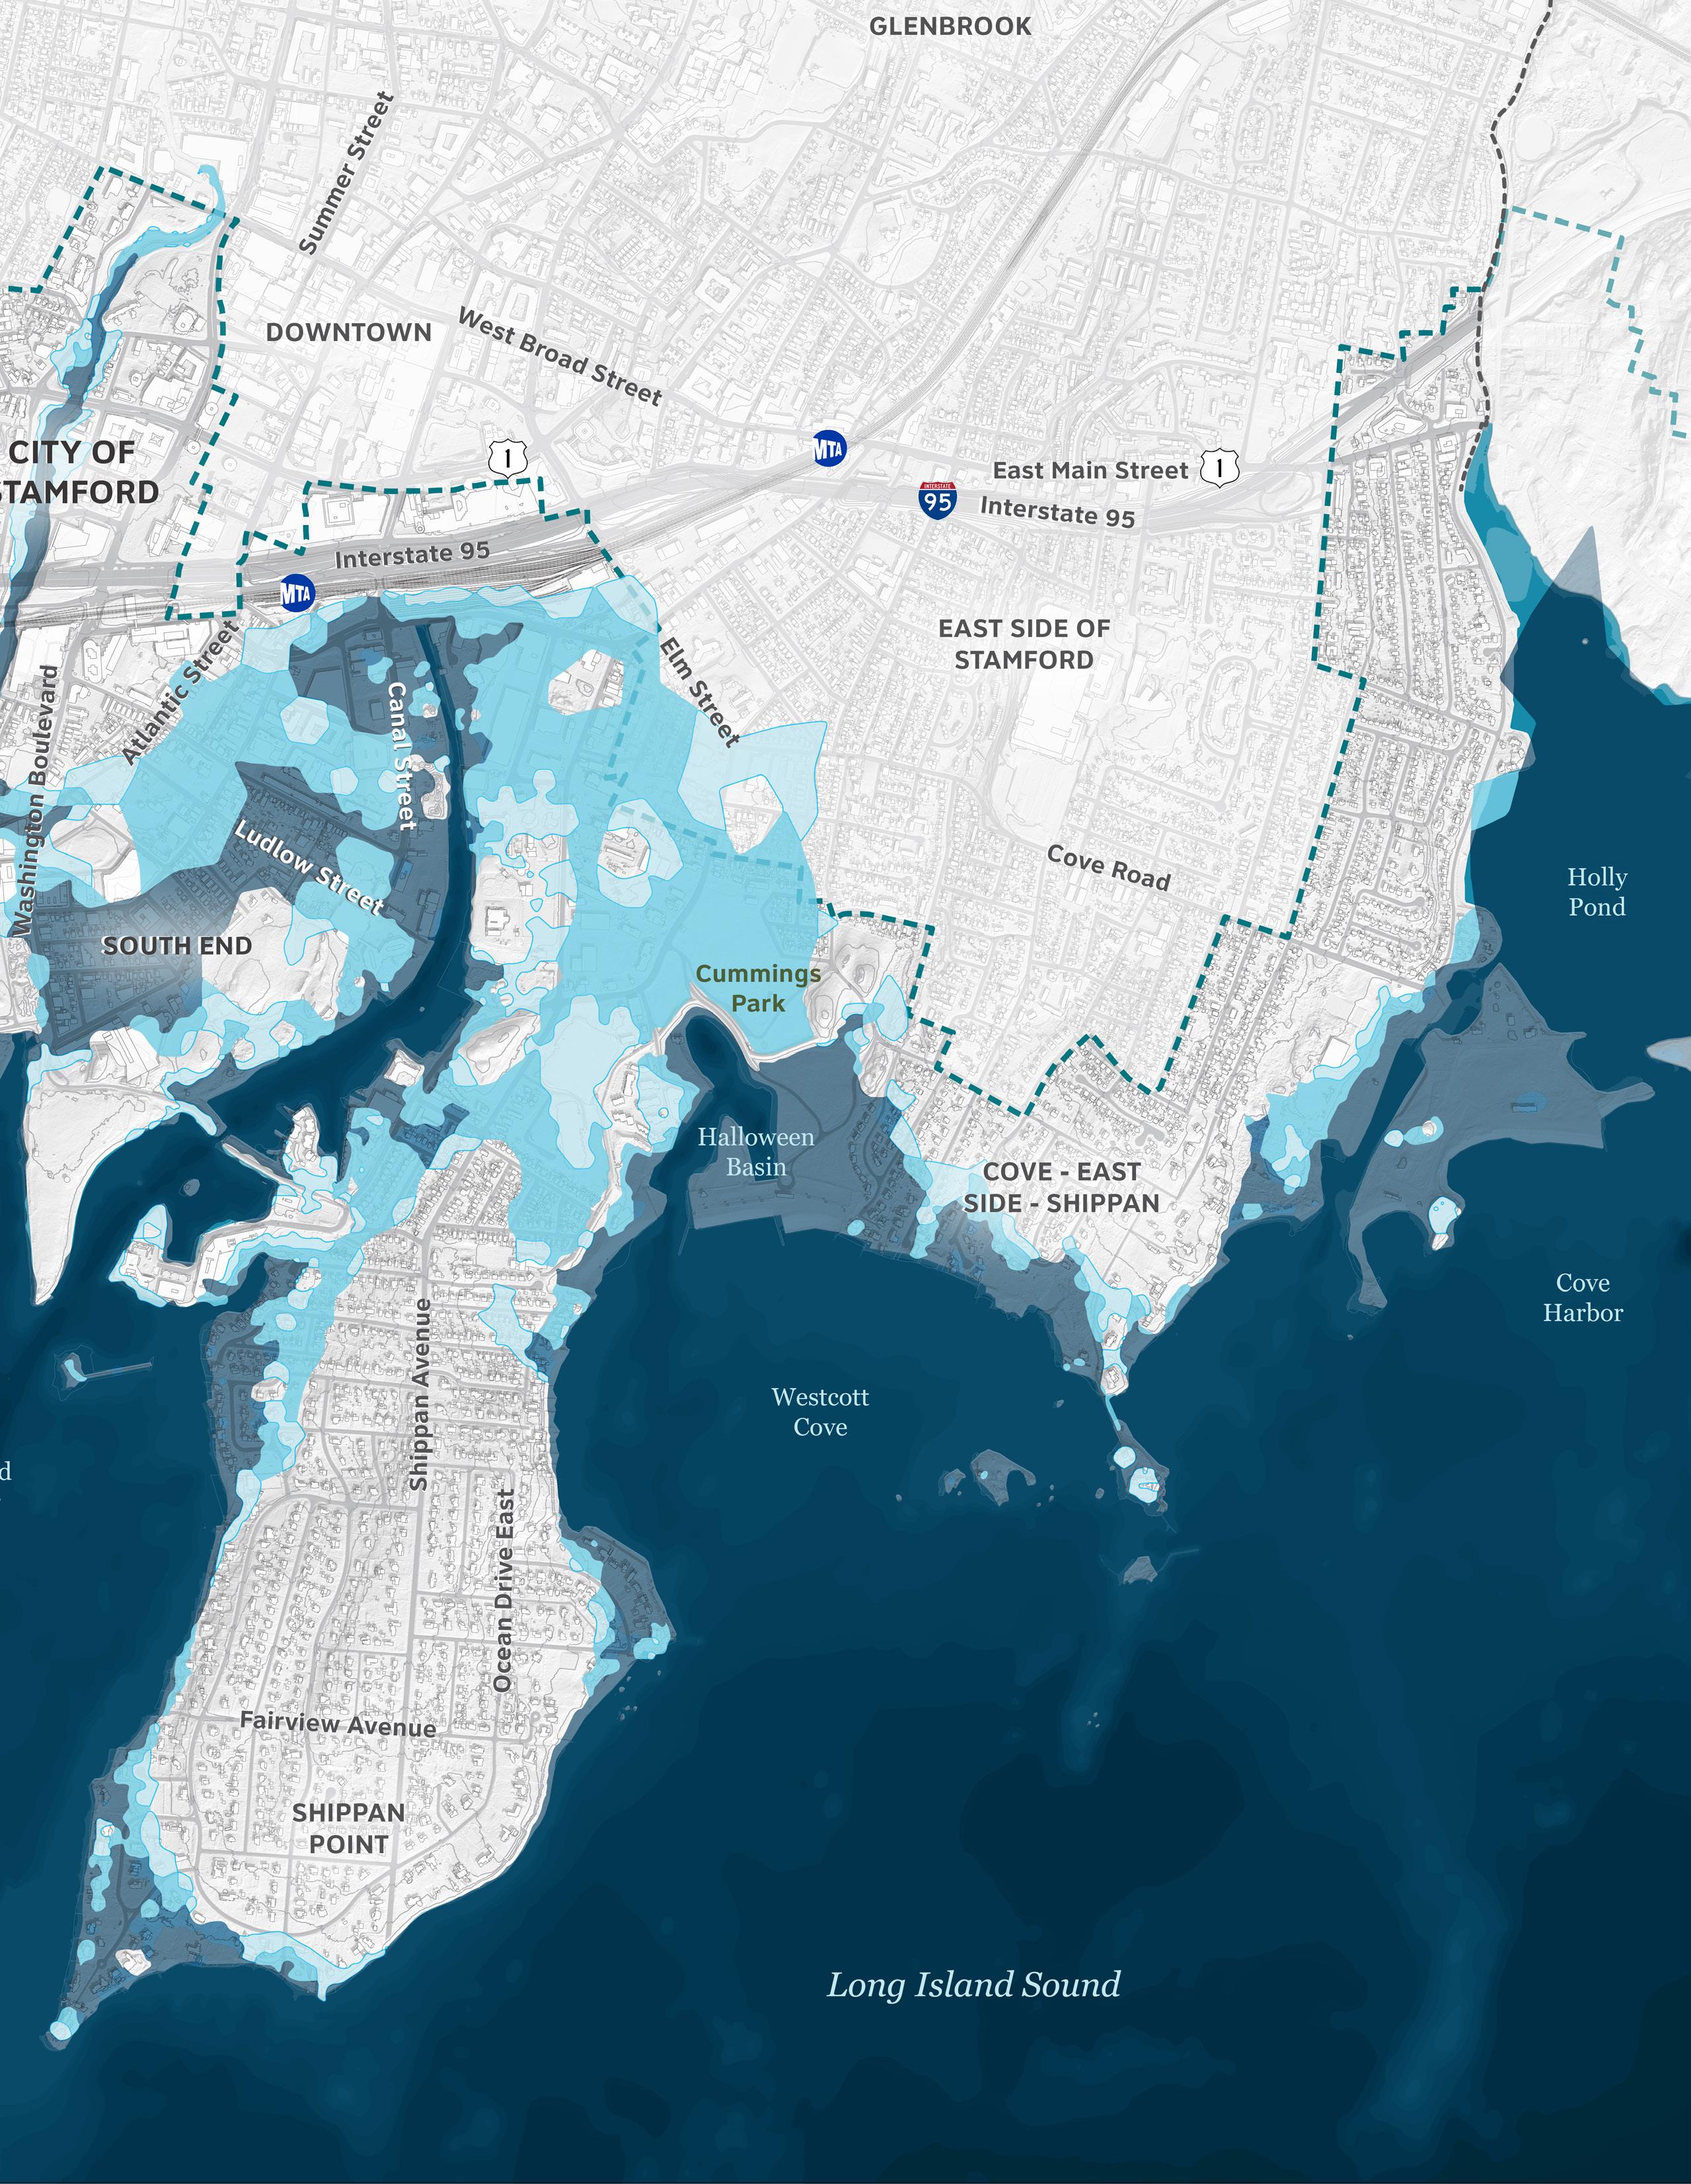
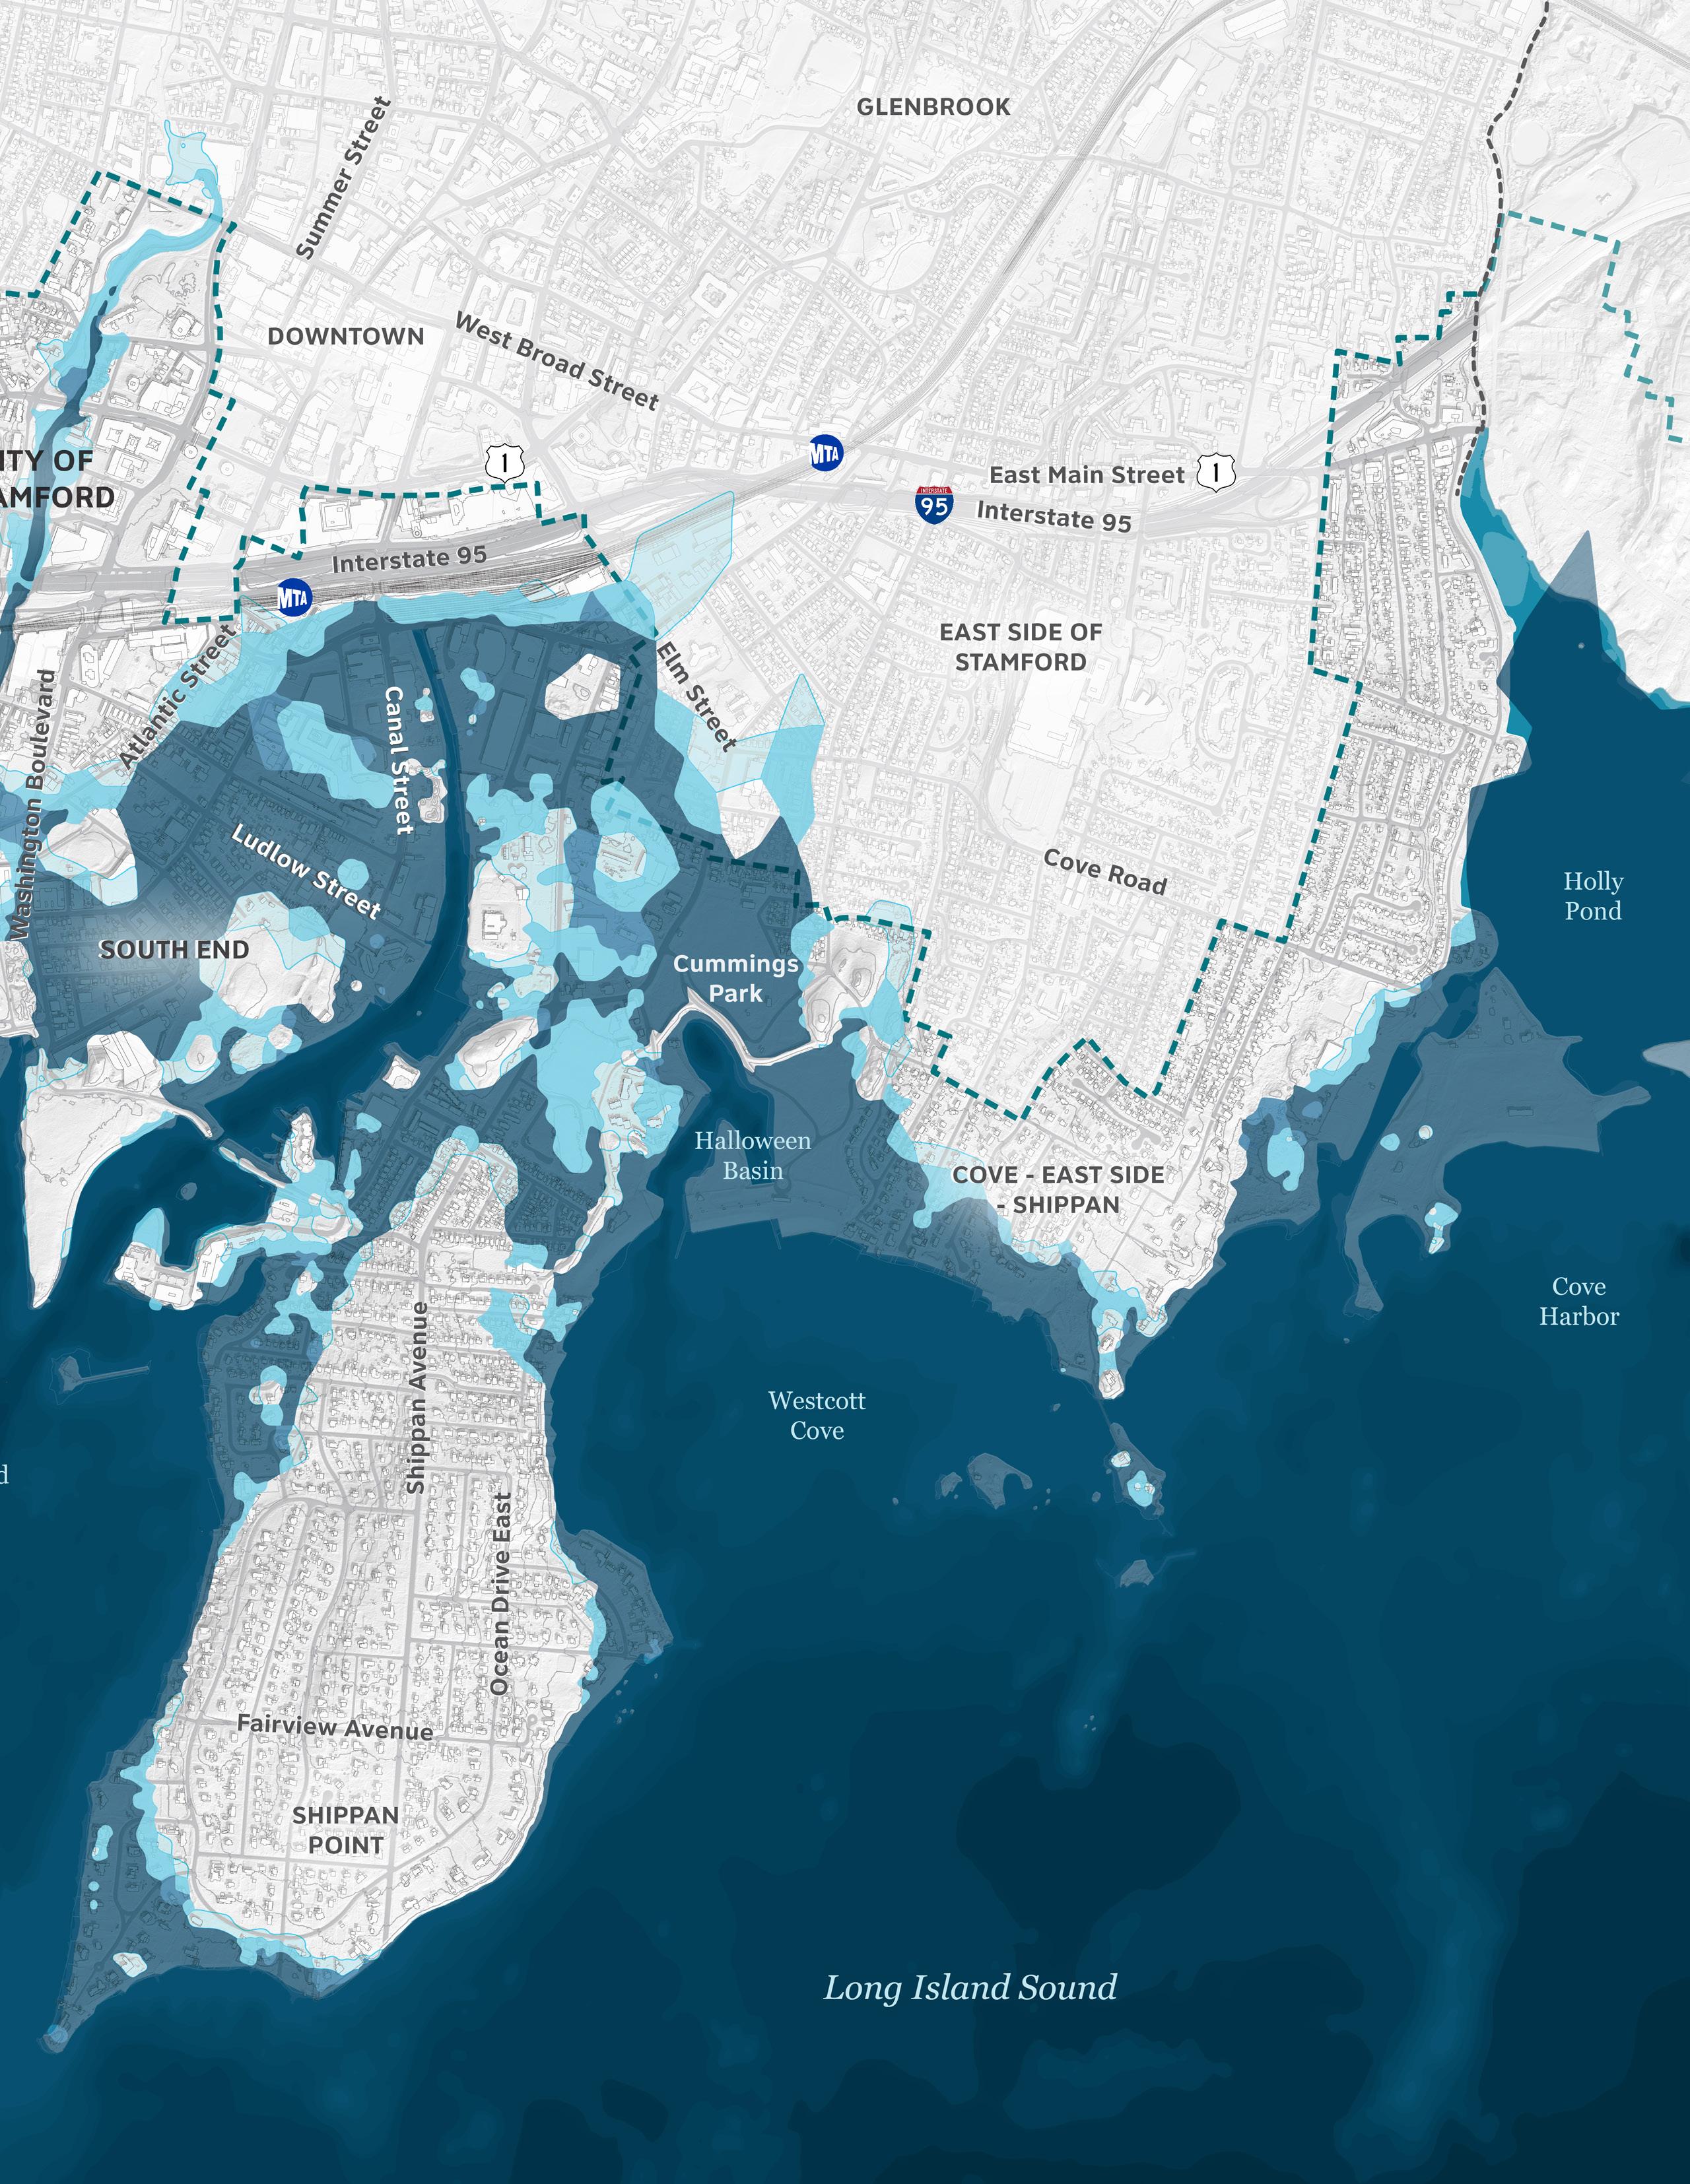
While many of Stamford’s coastal neighborhoods are vulnerable to present-day coastal flooding, the Stamford Hurricane Barrier helps reduce the risks from coastal storm surge across largely residential and open areas along the shoreline. Today, the 10% AEP flood extent is limited to Cove Island and the area surrounding Halloween Basin and Cummings Beach.
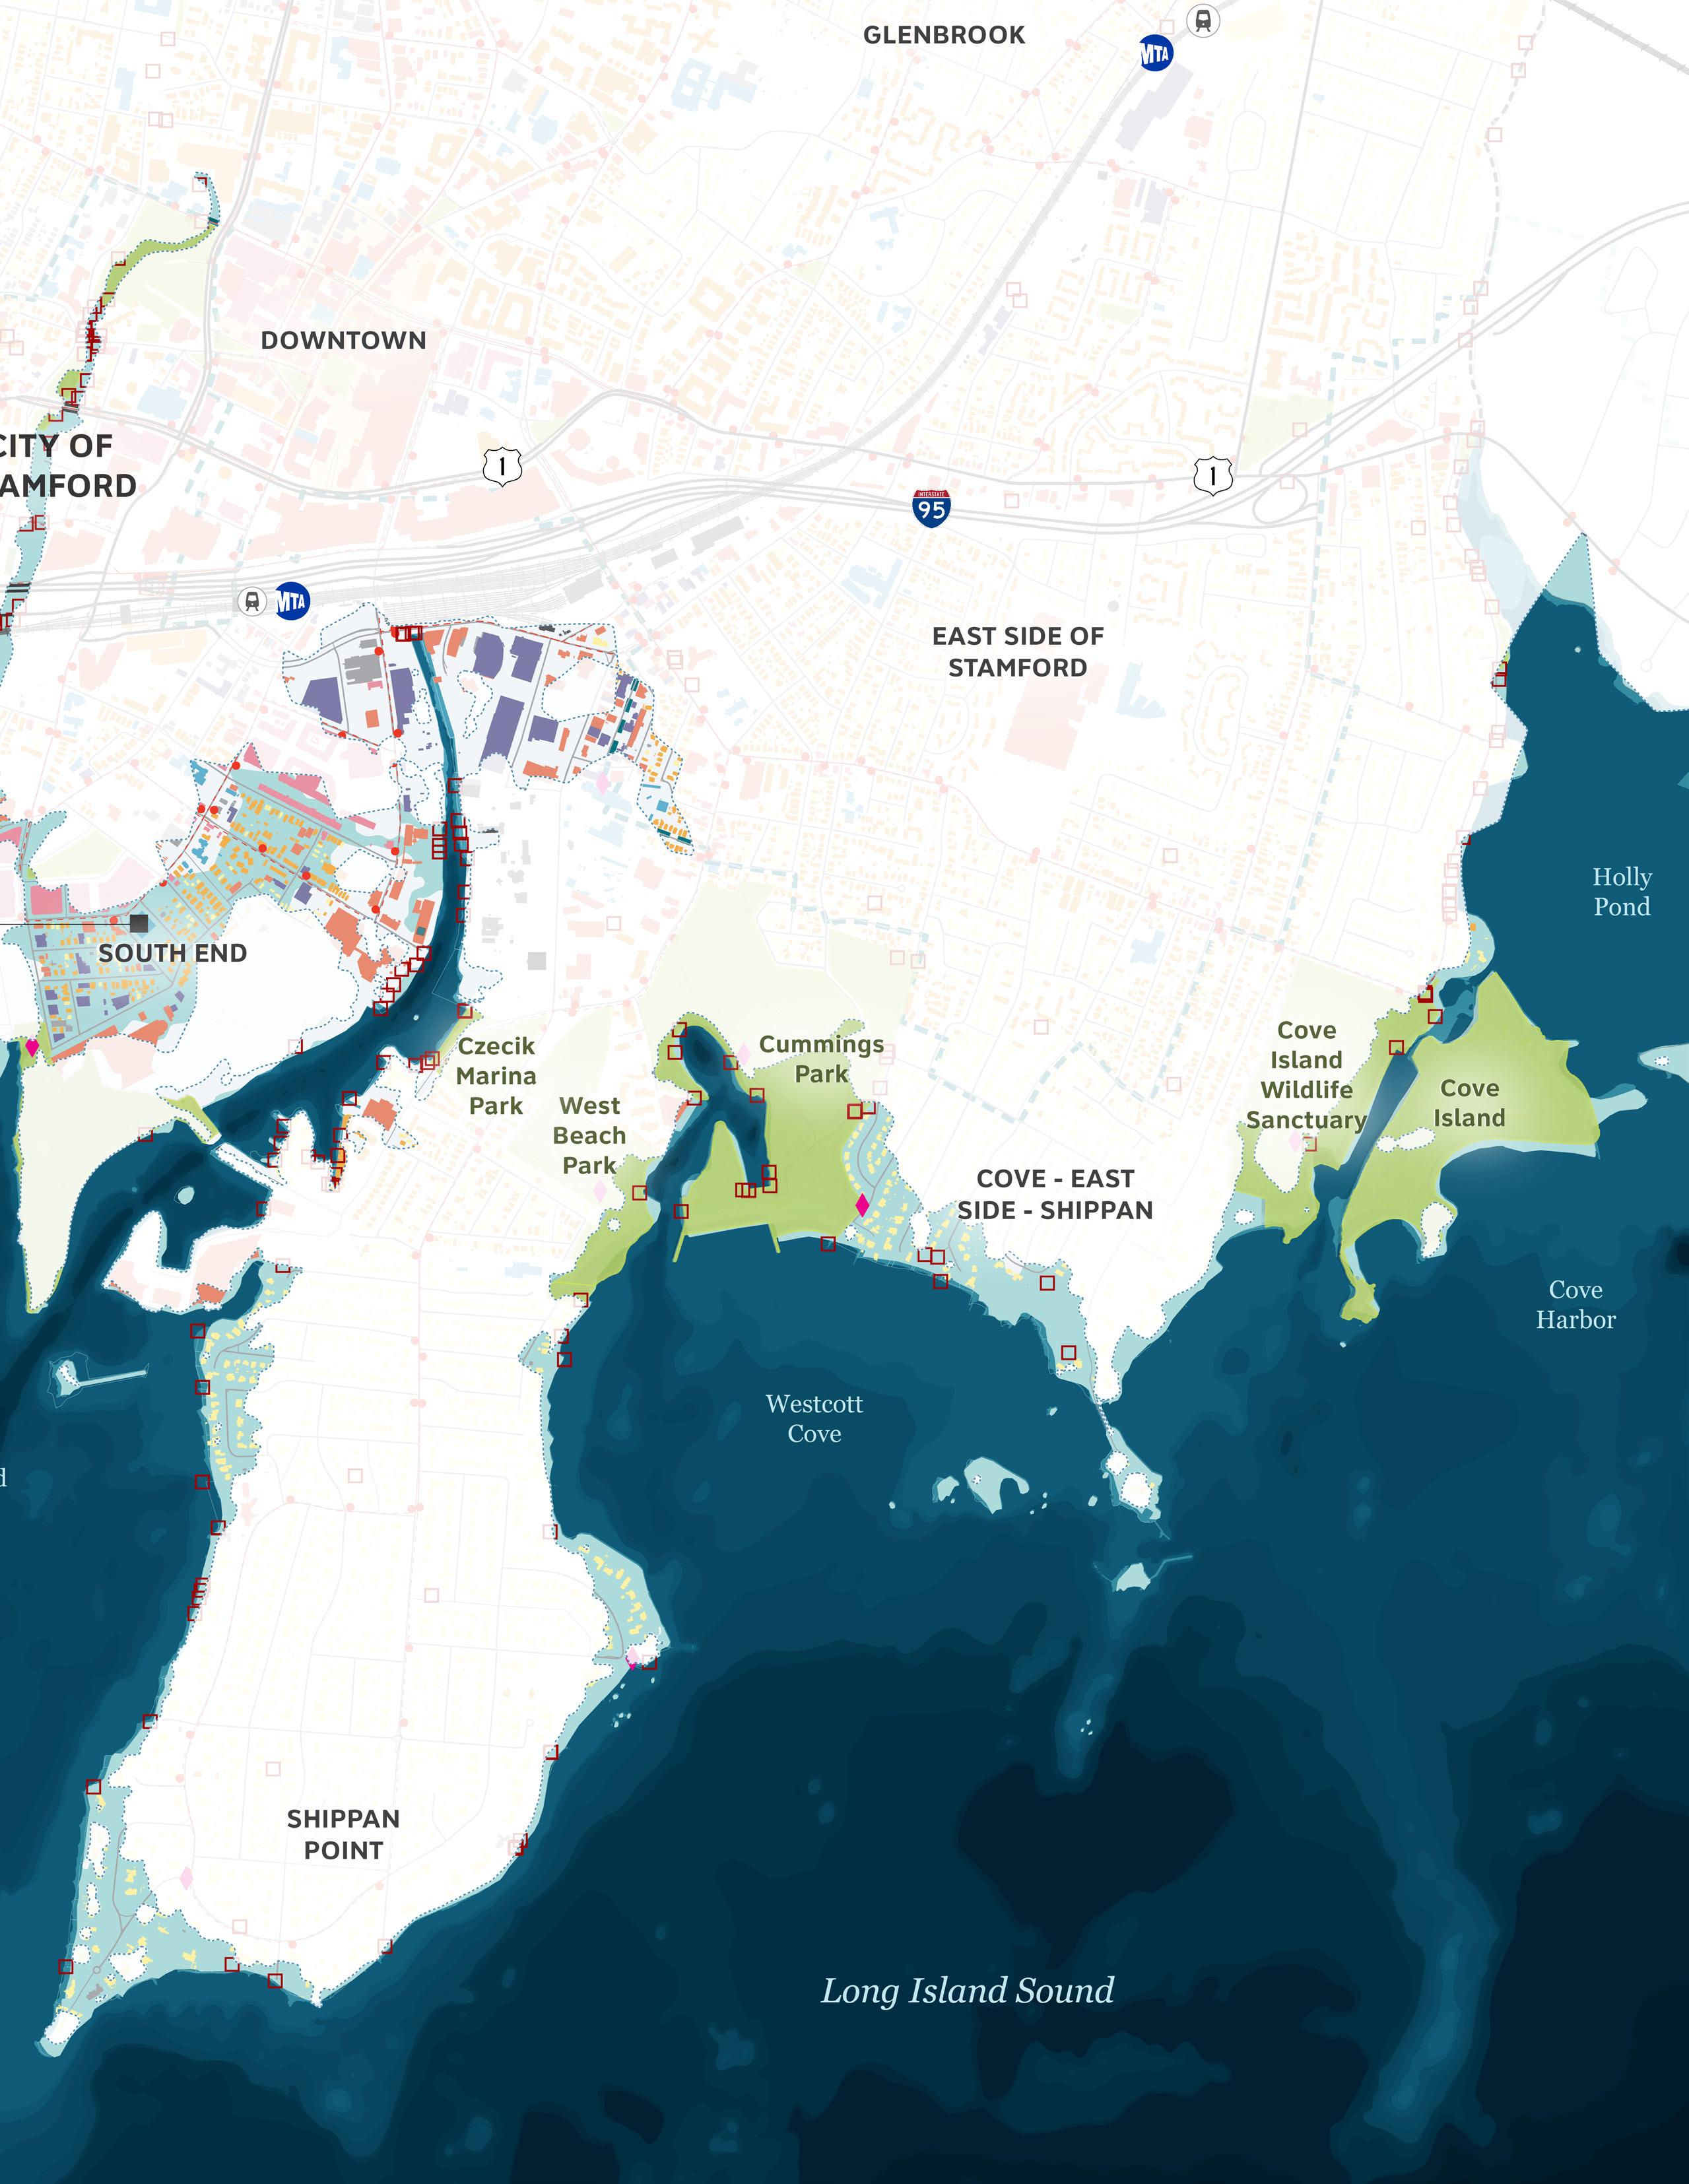
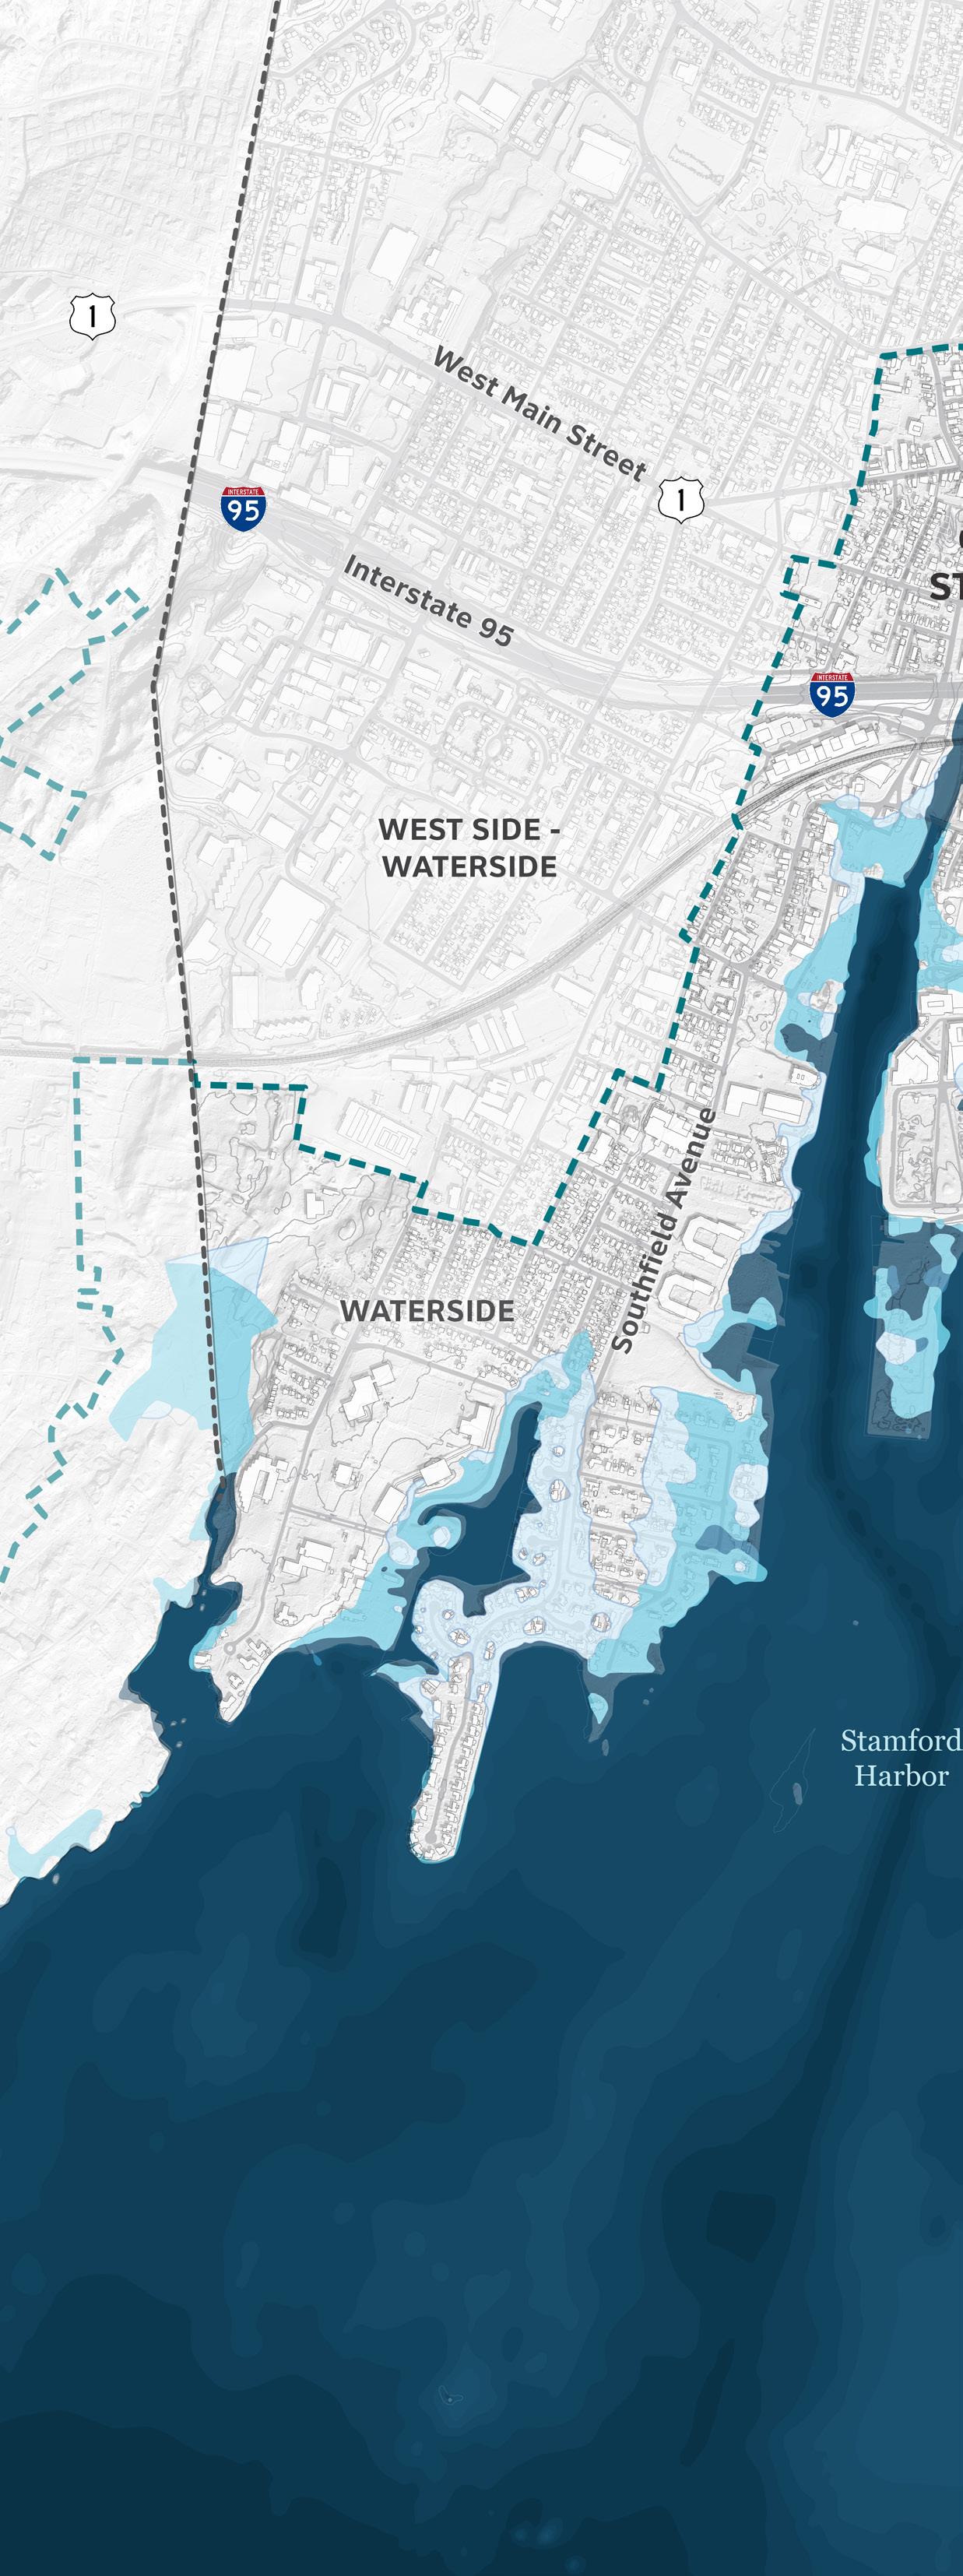
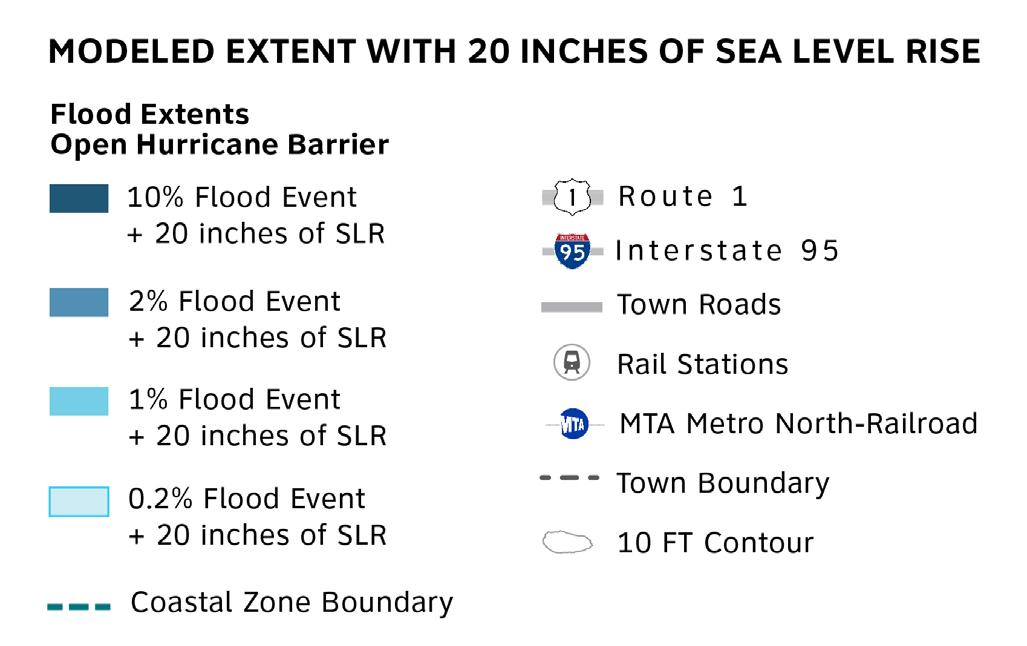
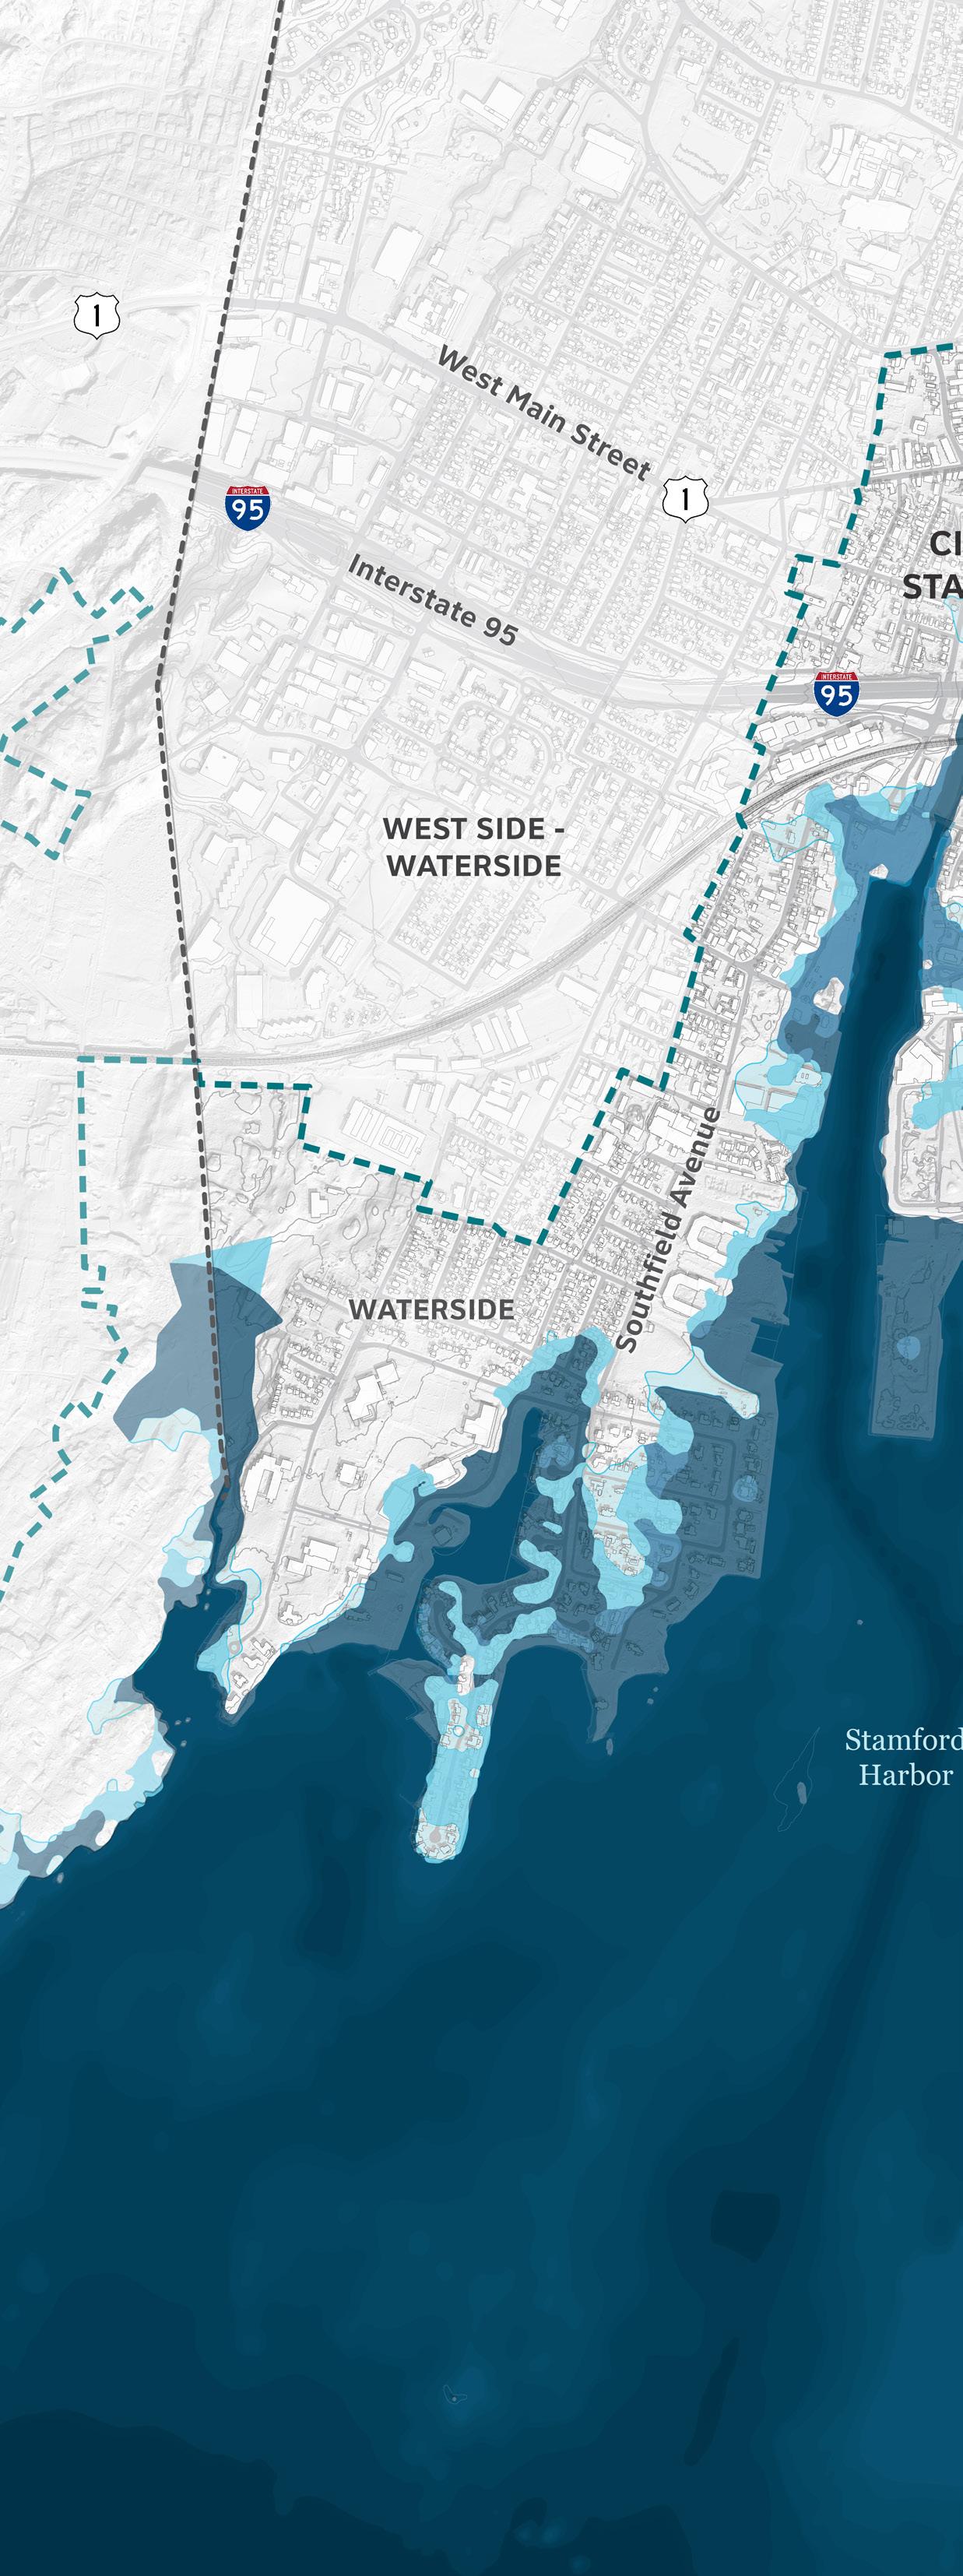
The modeled flood extent expands under the more intense 1% AEP storm condition, where roads, commercial property, and additional residential homes are subject to flooding via a pathway from the mouth of Stamford Harbor’s west branch. This flood pathway extends across both branches of the harbor, pooling at the base of the Interstate 95 flyover before backflooding across Cummings Park to the berm comprising the eastern edge of the Stamford Hurricane Barrier. Coastal fringes of the Waterside neighborhood fall within the extent of the current 1% AEP storm along the west bank of the Rippowam River. This includes several boat moorings, private residential structures, and Boccuzzi Park.
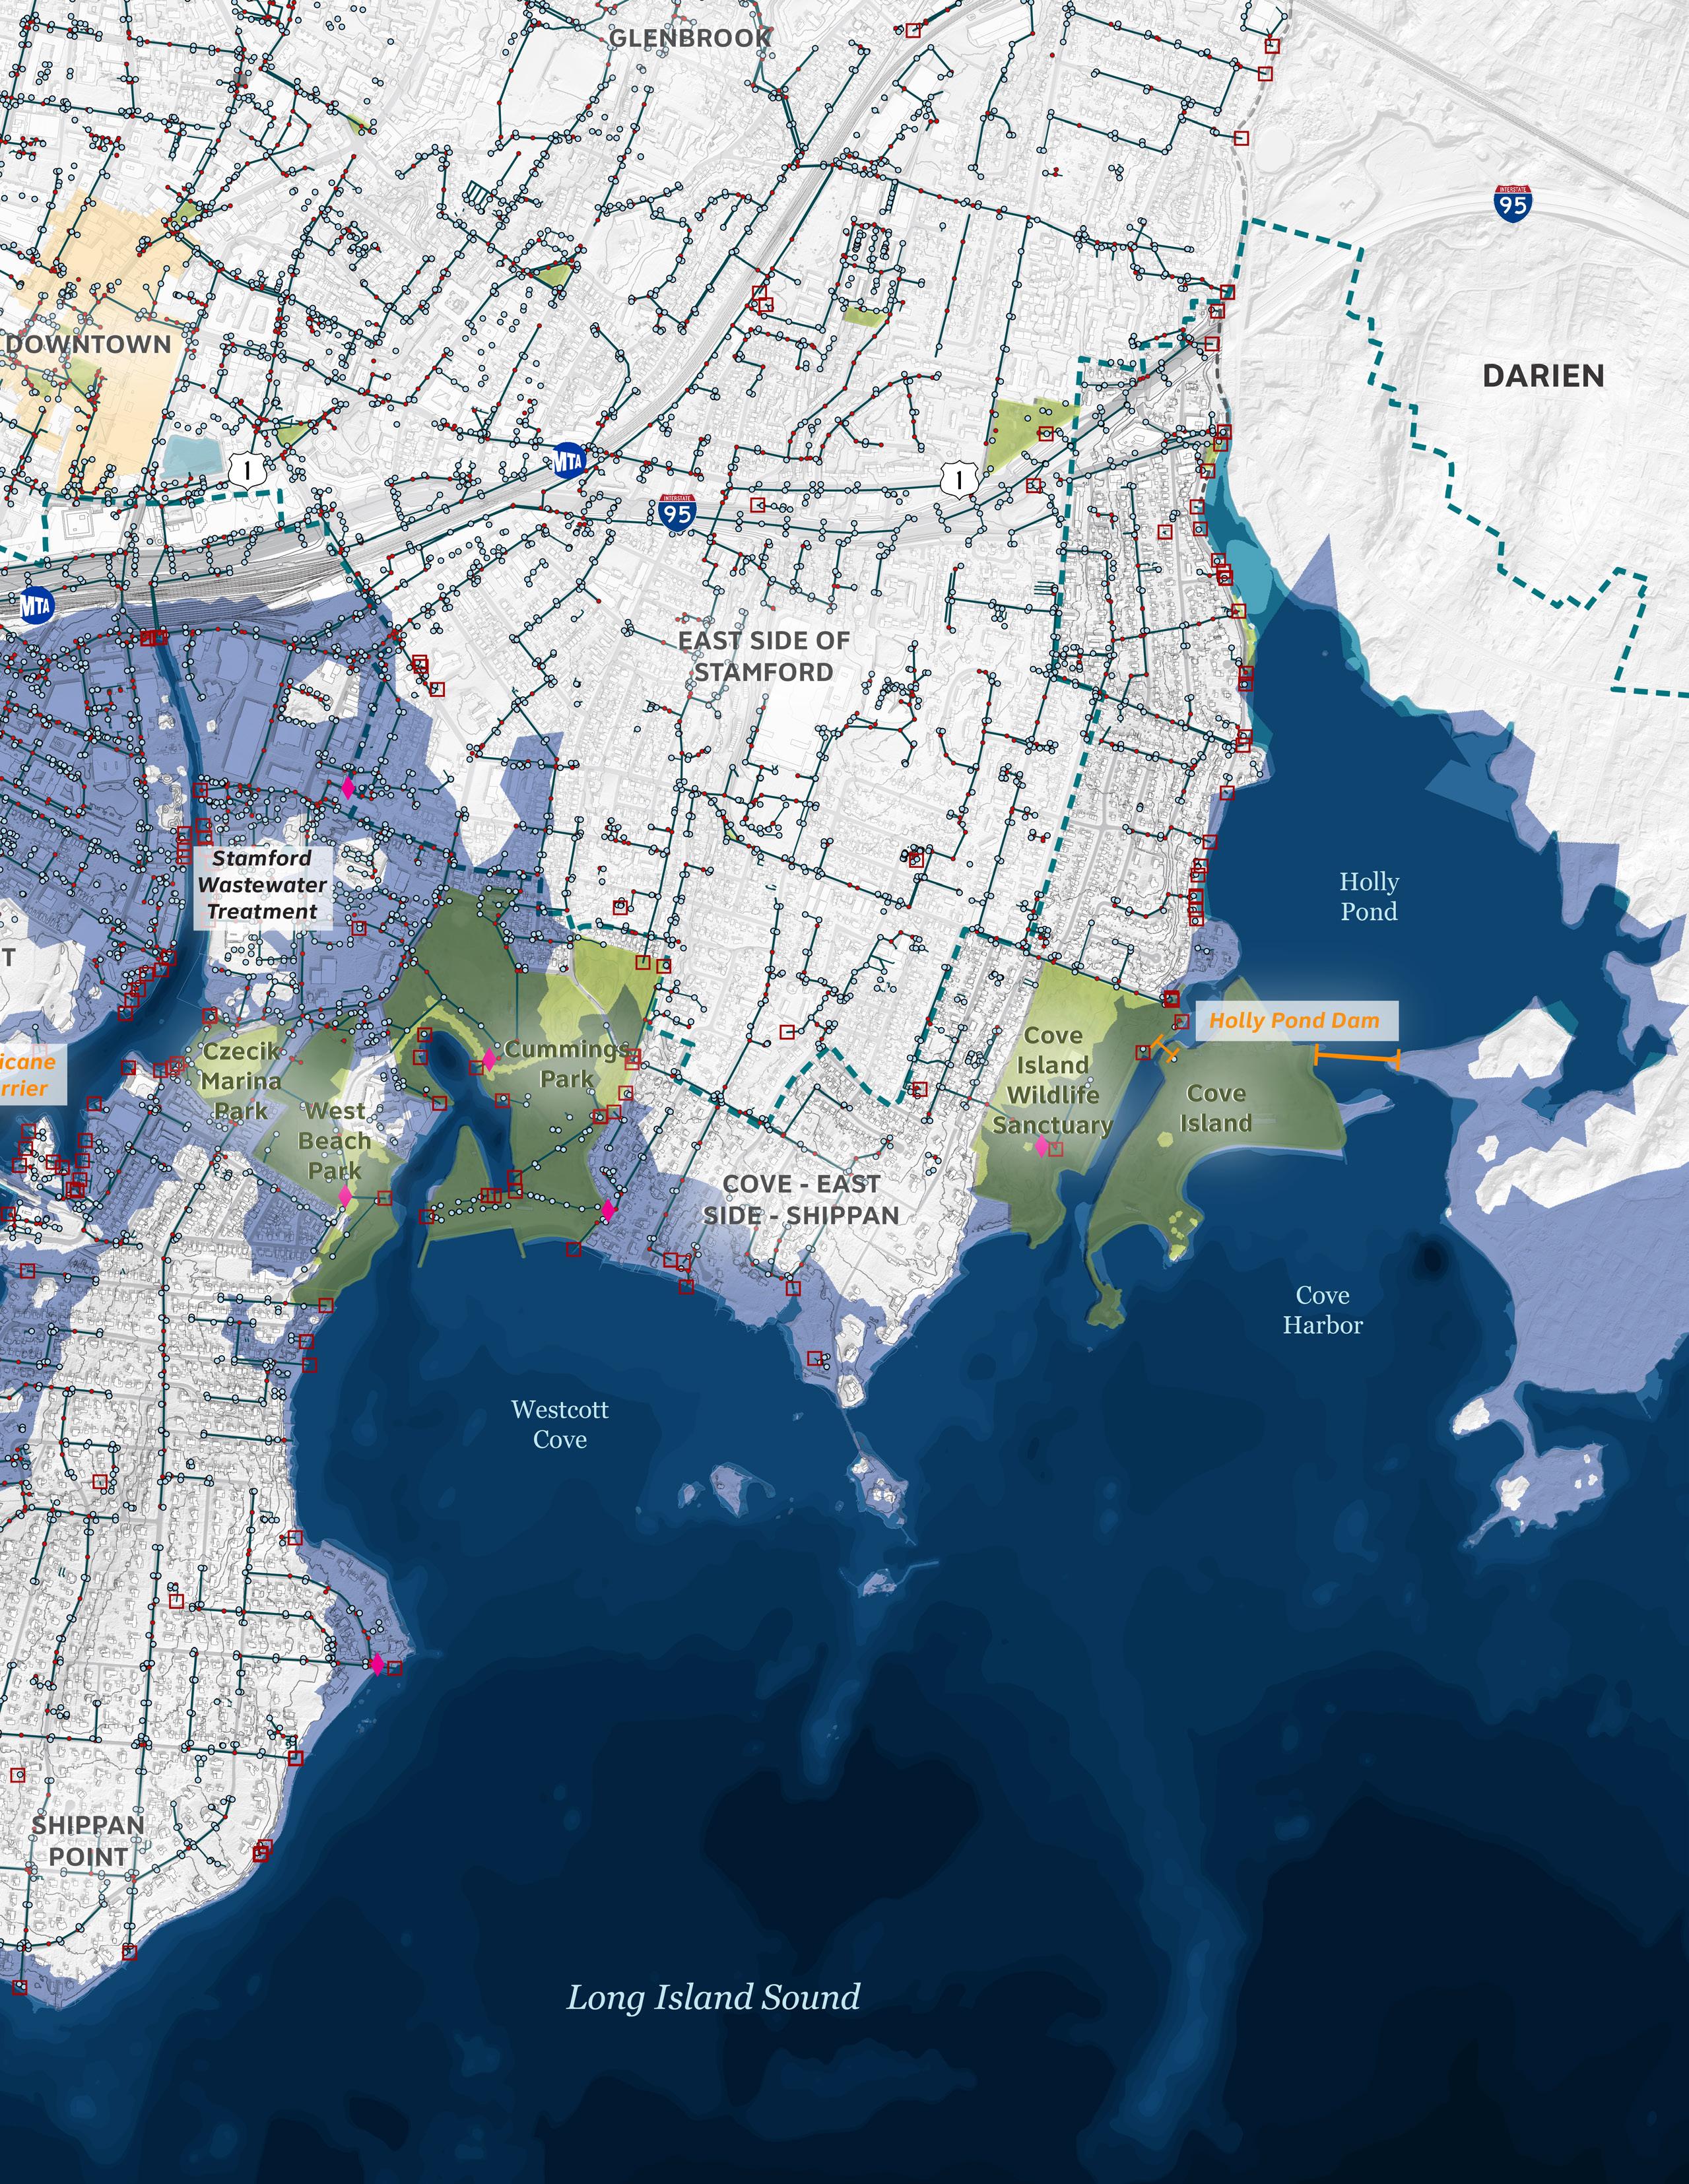
Flood extents and pathways significantly expand under the modeled 0.2% AEP storm conditions, as coastal floodwaters cross the threshold of Shippan Avenue, cutting off the Shippan peninsula from the rest of the city. The flood extent of the 0.2% AEP storm modeled by CIRCA can be compared to the extent of flooding caused by Hurricane Sandy, which exceeded historic maximum water levels in Connecticut despite making landfall at low tide.

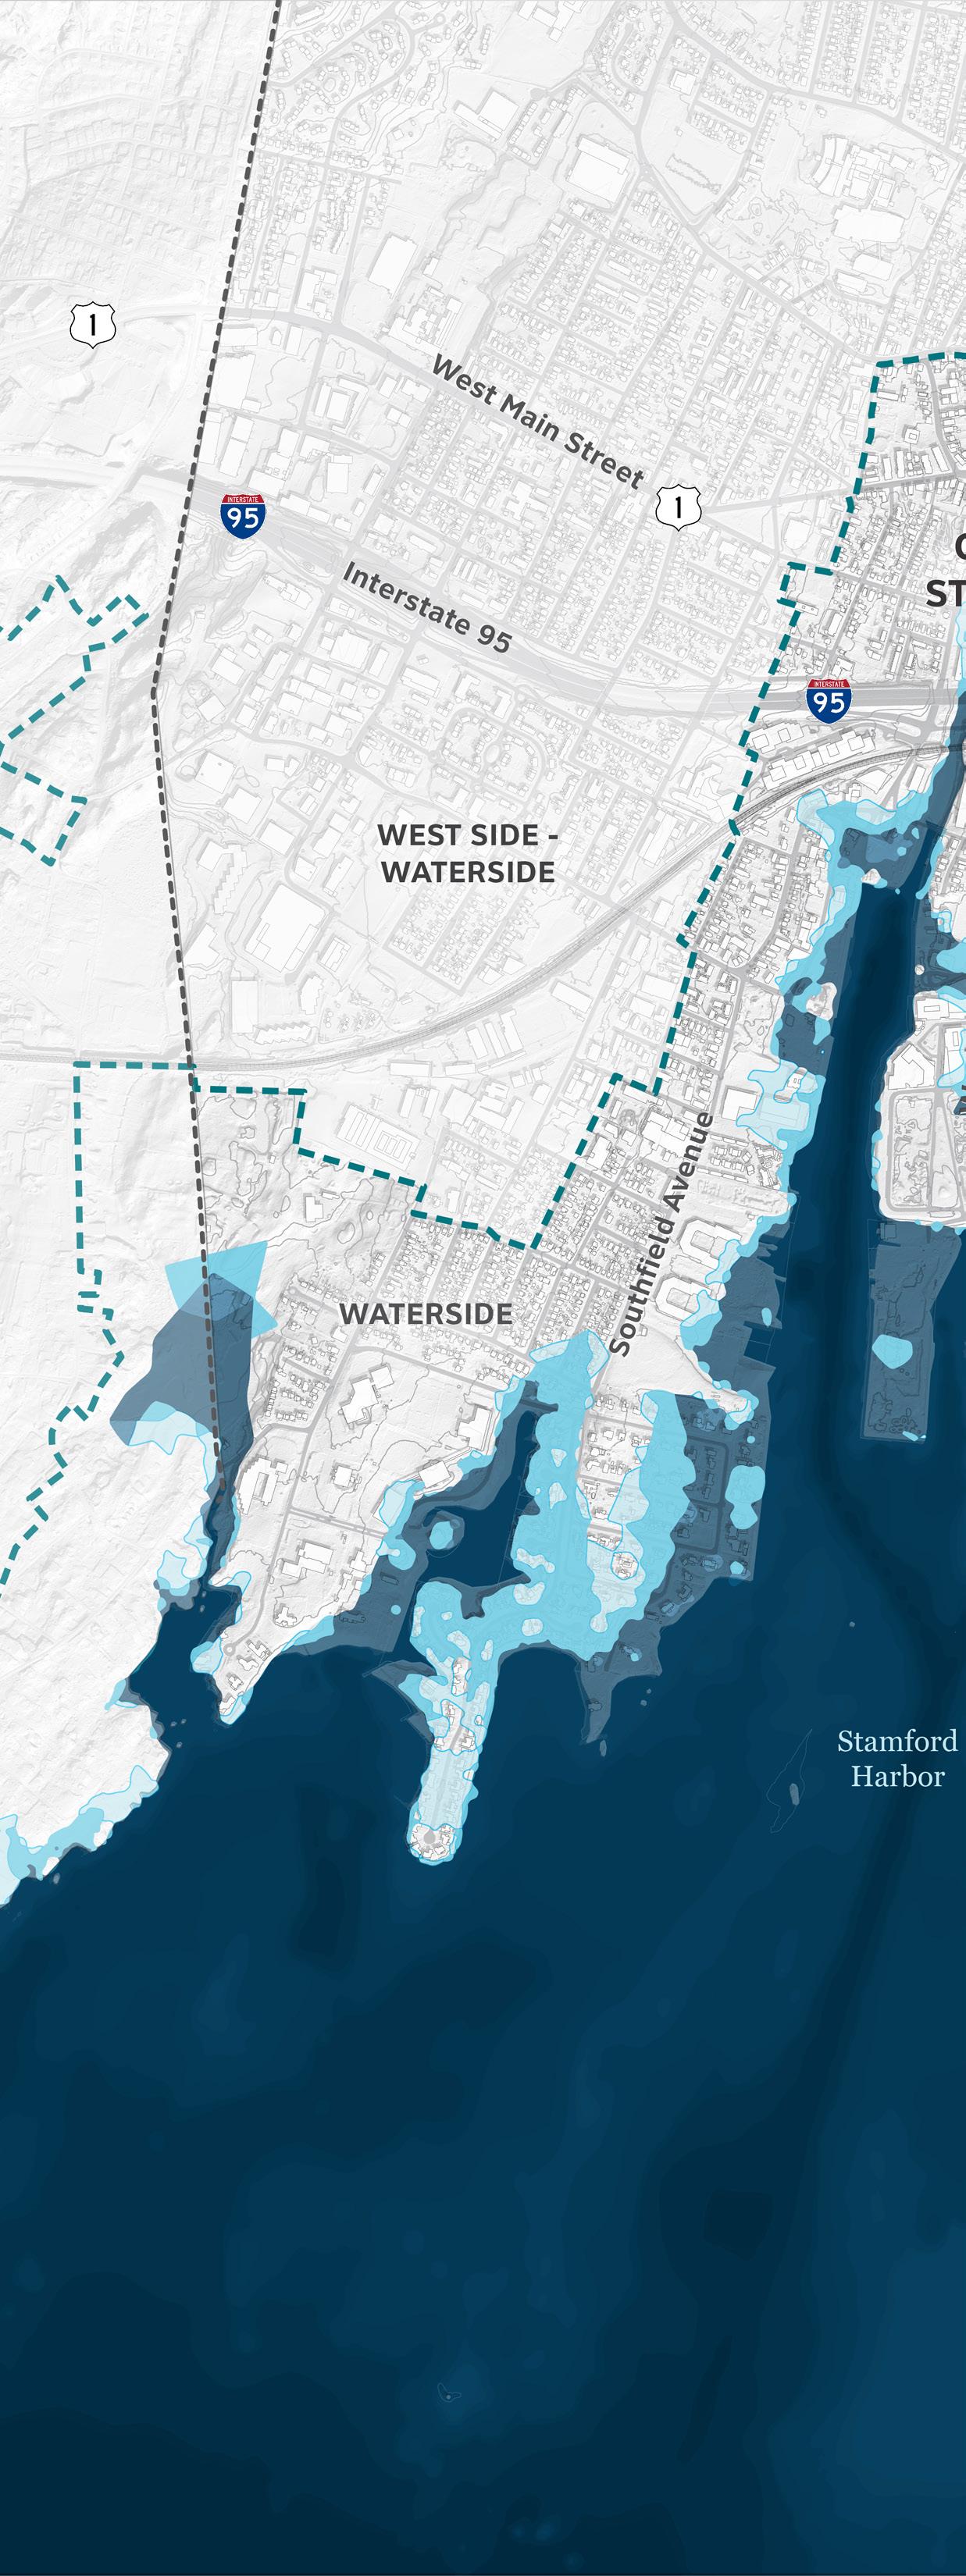
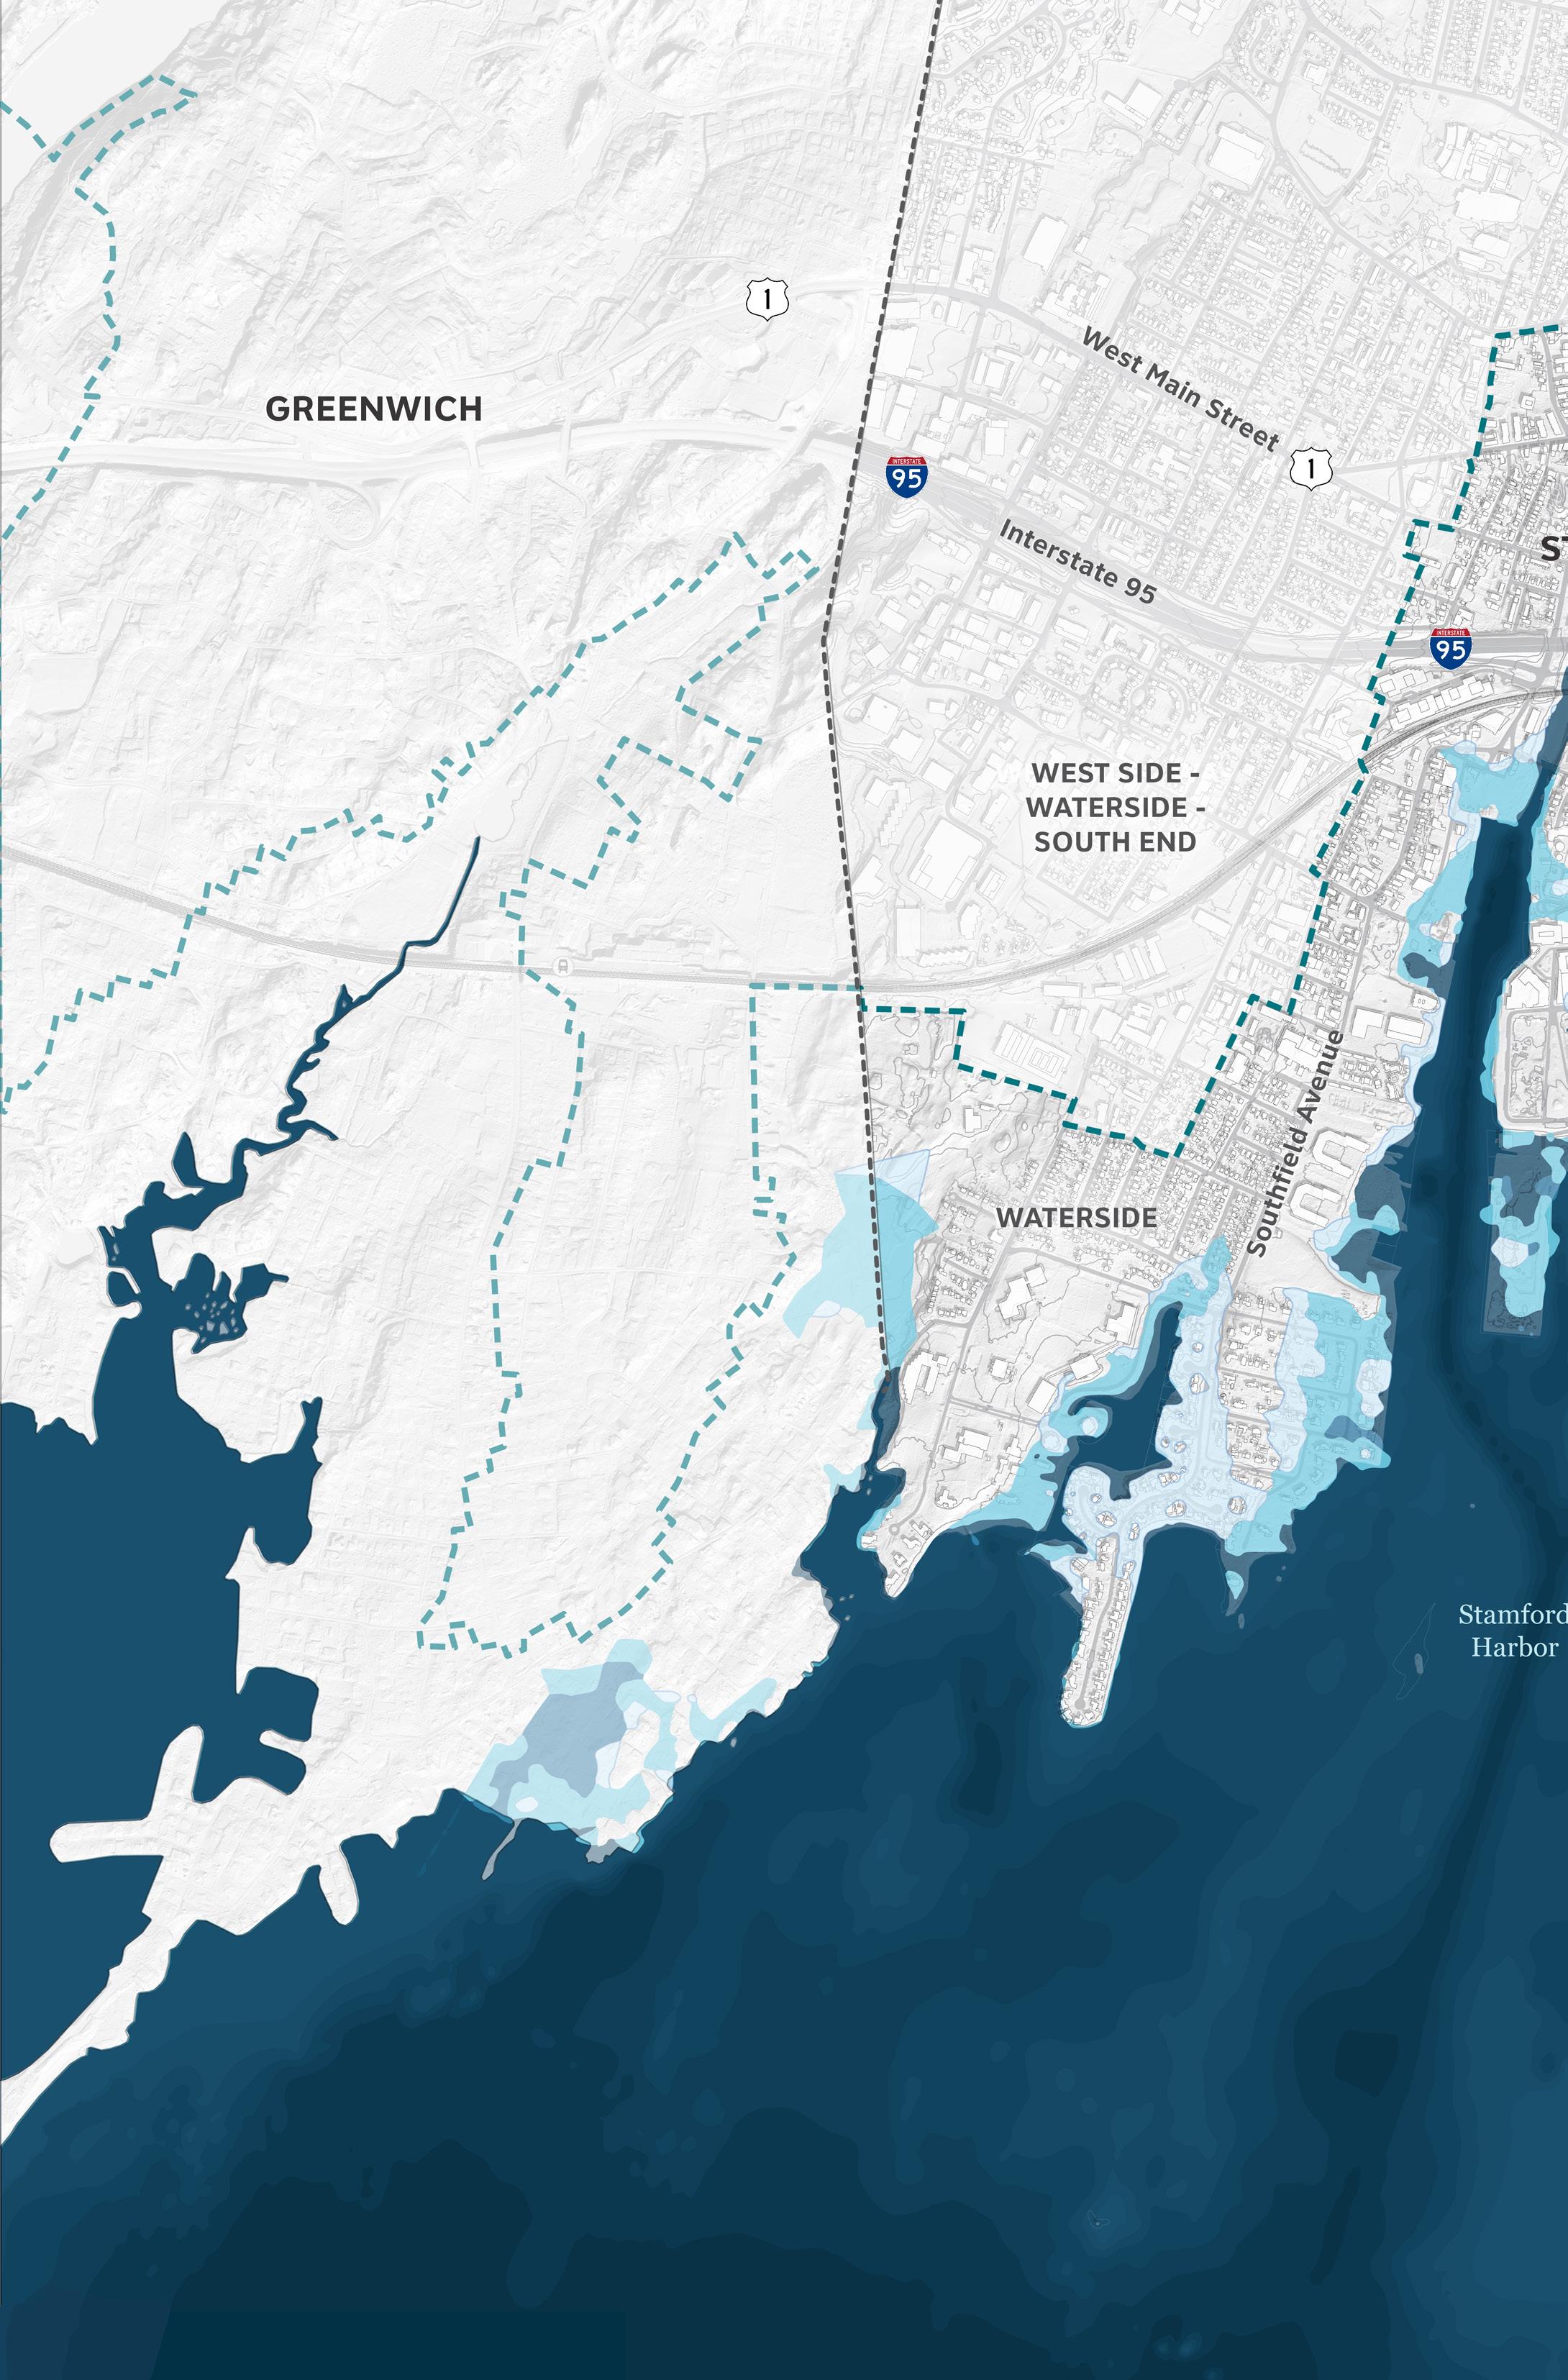
With the hurricane barrier open, the most noticeable changes relative to present-day storm conditions are that already flood-prone areas become susceptible to flooding resulting from less intense coastal storm events. With the addition of 20 in of SLR, a large area between South End’s Washington Boulevard and Canal Street—within the present-day 1% AEP storm flood extent—shows a greater degree of vulnerability to coastal flooding as this area mostly falls within the extent of the future 10% AEP event. Flooding tied to this storm scenario washes over an empty lot on Cook Point before flowing around the riprap berm on Bateman Way representing the western portion of the Stamford Hurricane Barrier. In this area, flooding from the 10% AEP event with 20 in SLR would impact city streets, large multi-family housing complexes, business developments in Harbor Point, and several densely settled residential blocks of the South End. Under these future SLR conditions, roughly two dozen new homes in Halloween Basin would be subjected to the 10% AEP storm.
The flood extents of the future 1% and 0.2% AEP storms + 20 in SLR expand only slightly over presentday conditions, with additional areas of flooding shown along the eastern edge of Shippan’s Point to Cove Island, some southern portions of the Rippowam River, and inland areas of the East Side neighborhood. The June 2024 CIRCA report on coastal flooding and SLR in Stamford attributes this outcome to the continued efficacy of the closed hurricane barrier into the future, even under more severe storm conditions. Maps with the barrier left open can be found in the Appendix to this report.
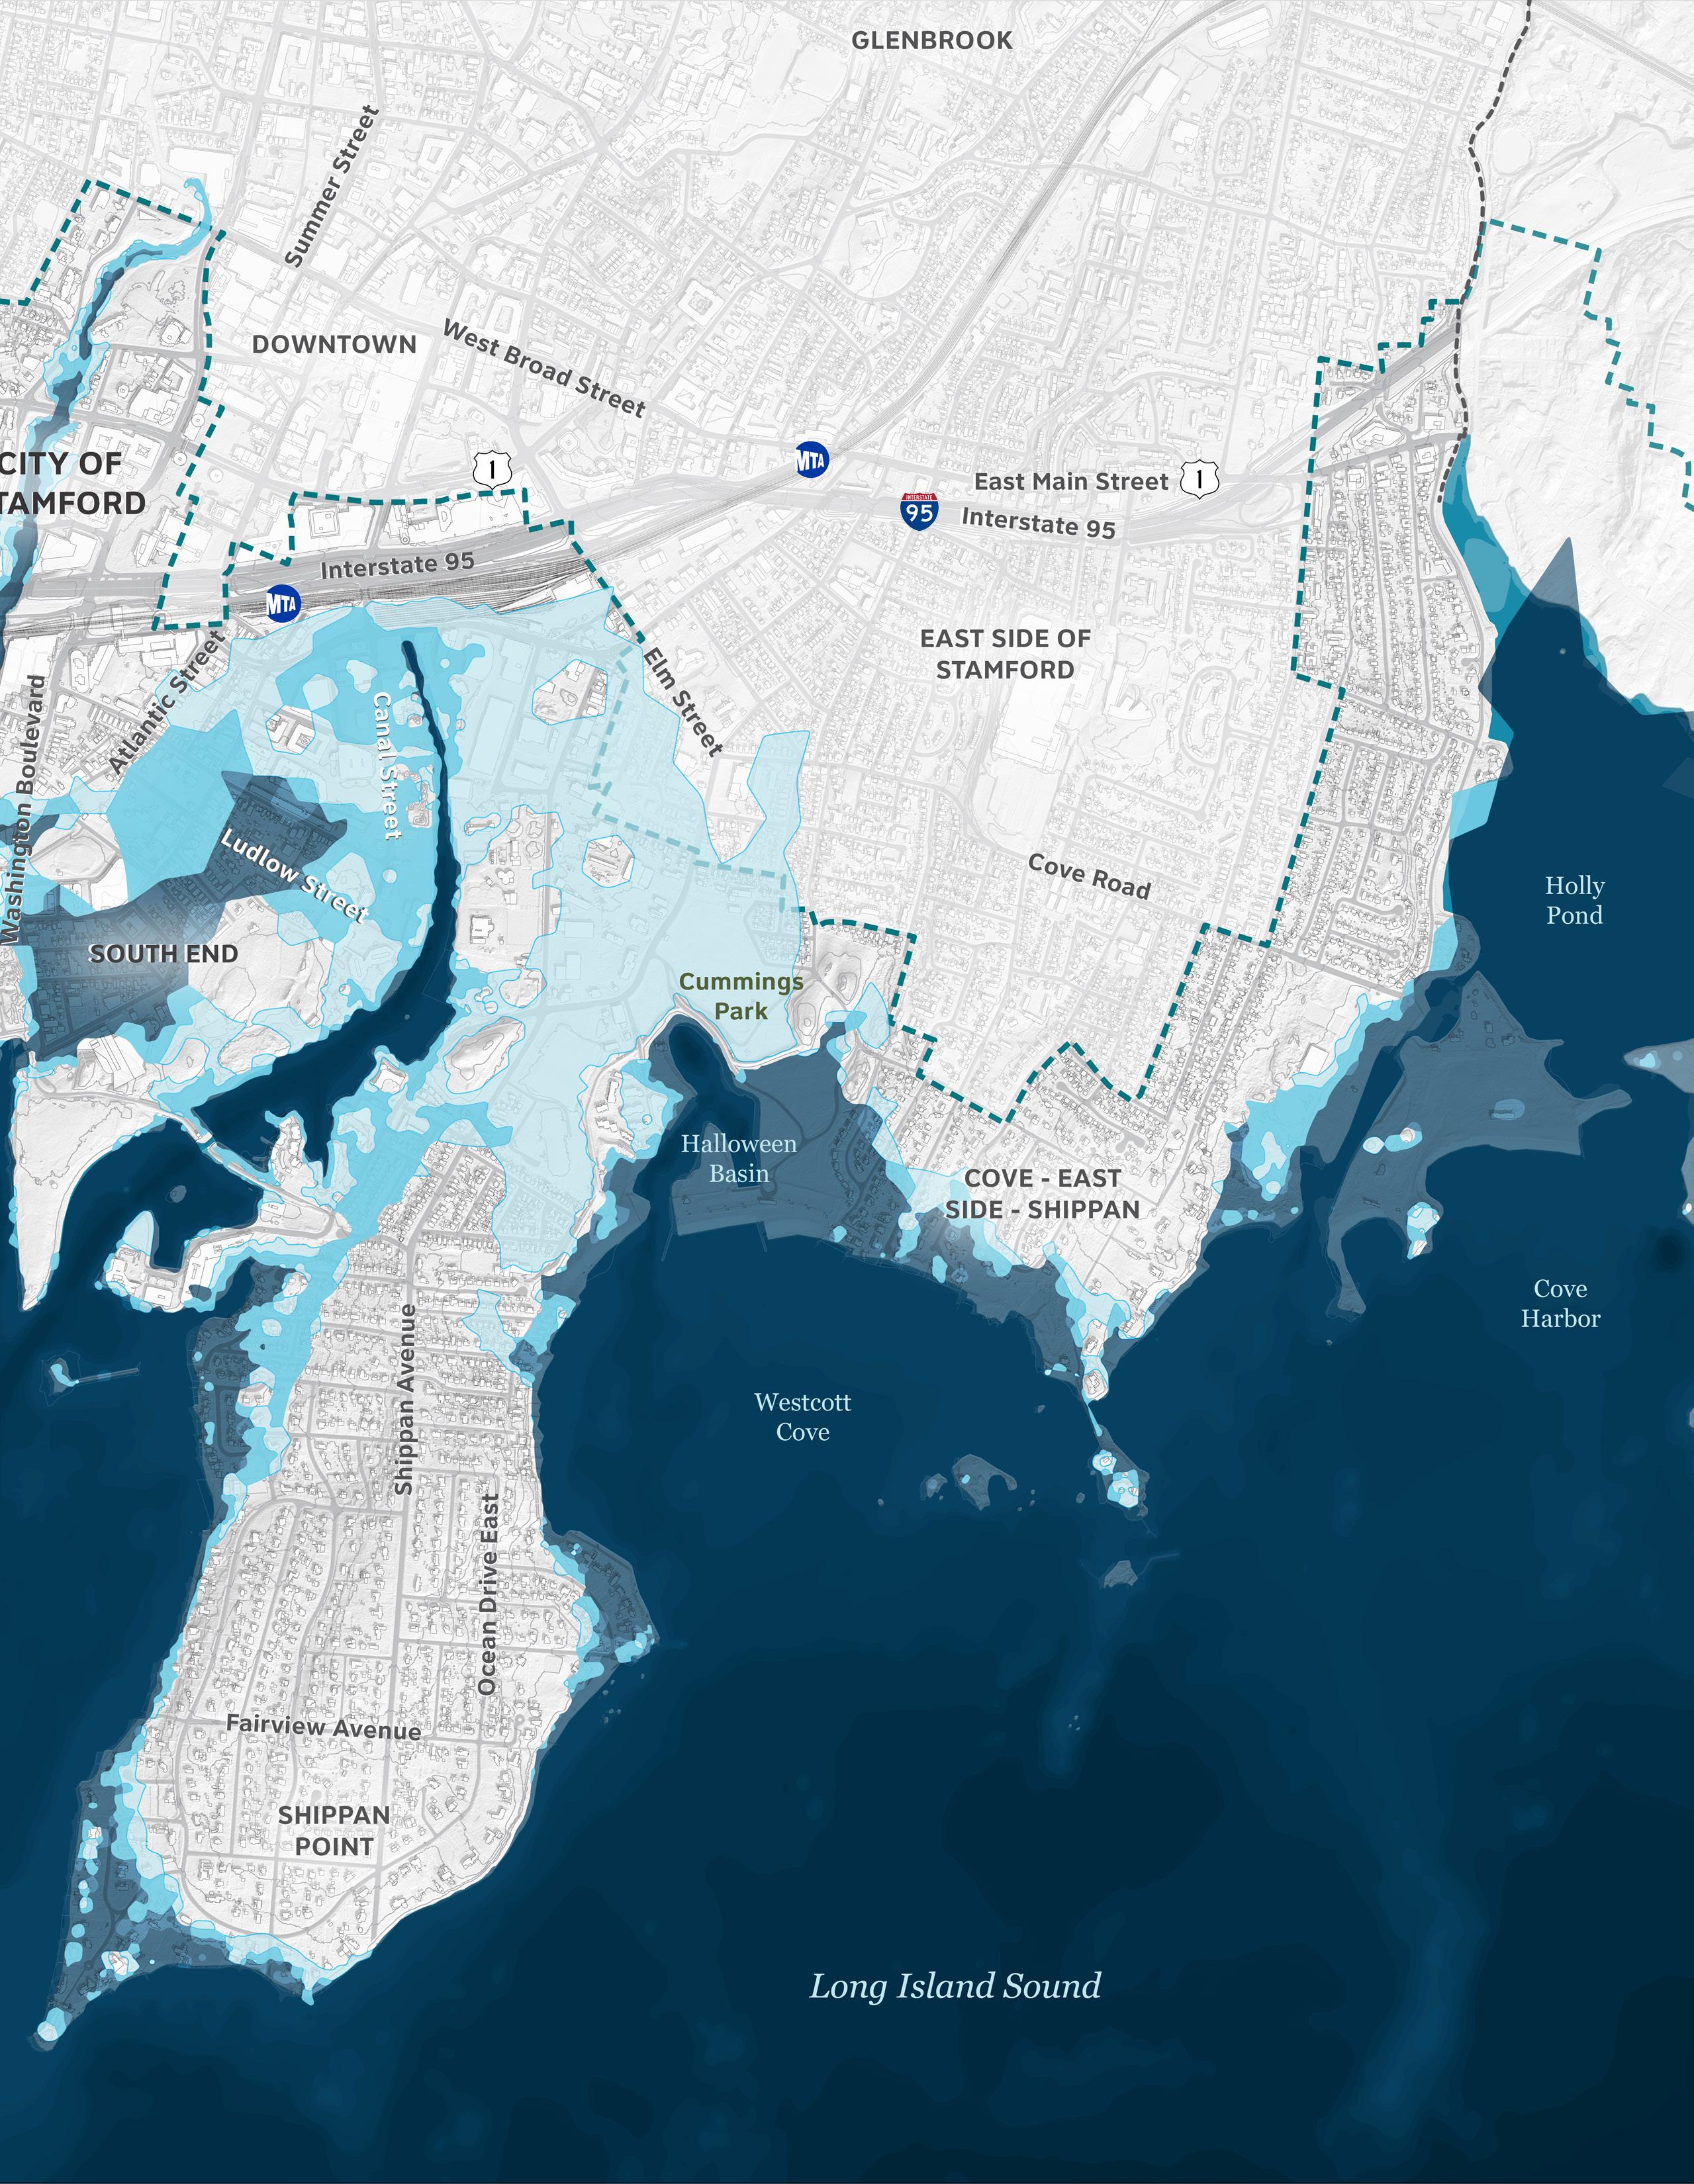
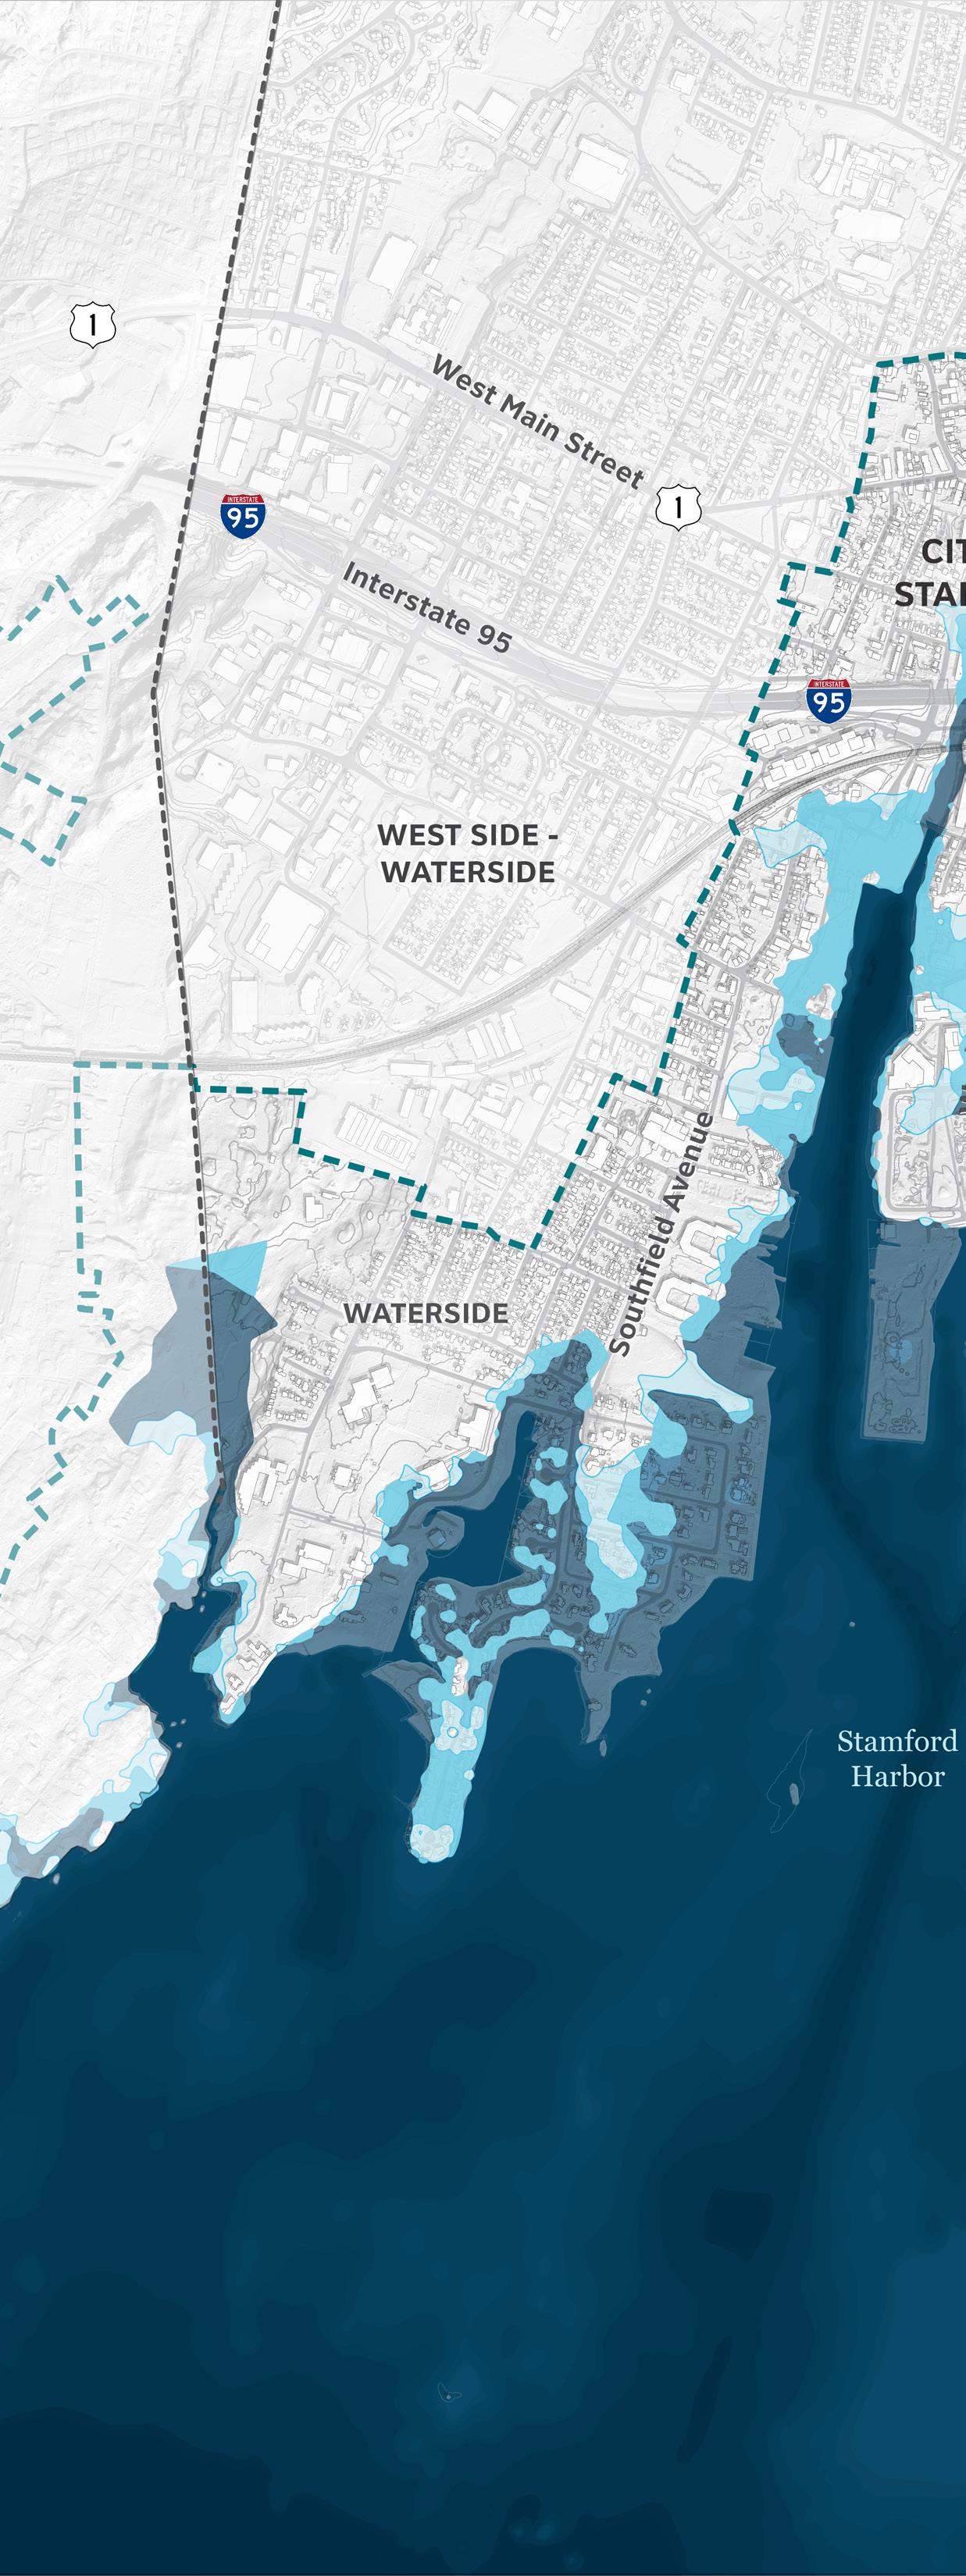
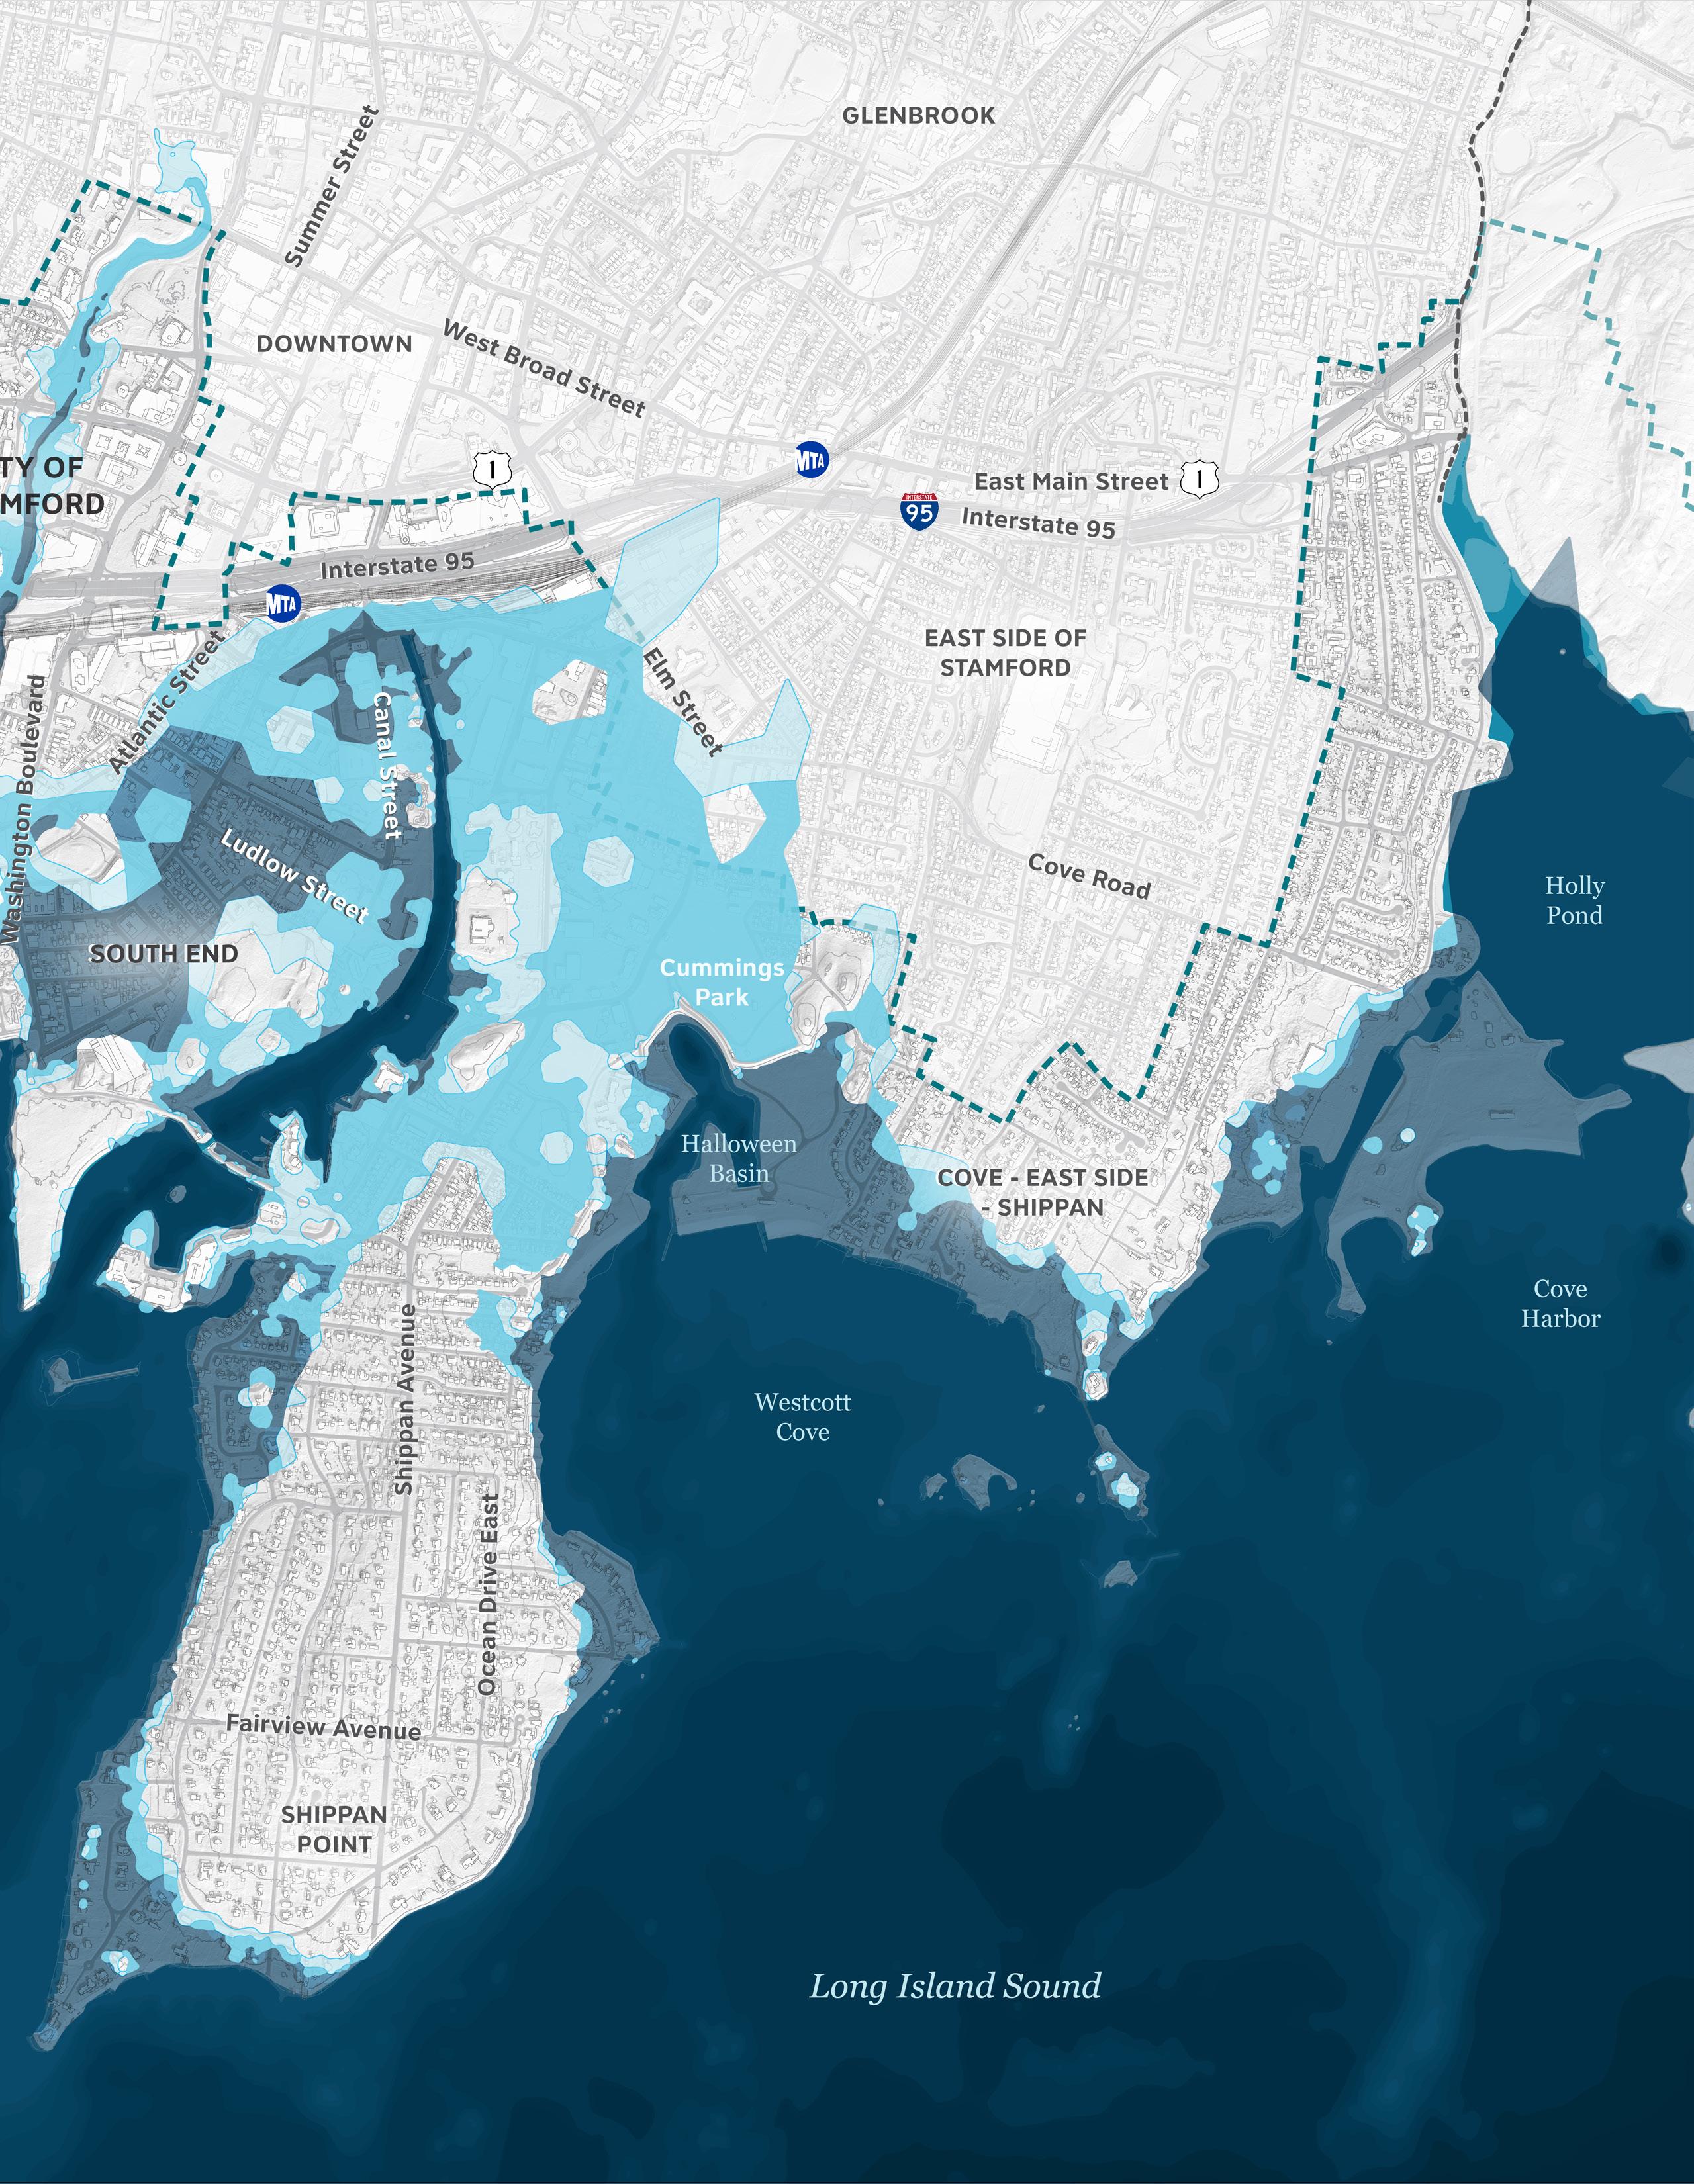
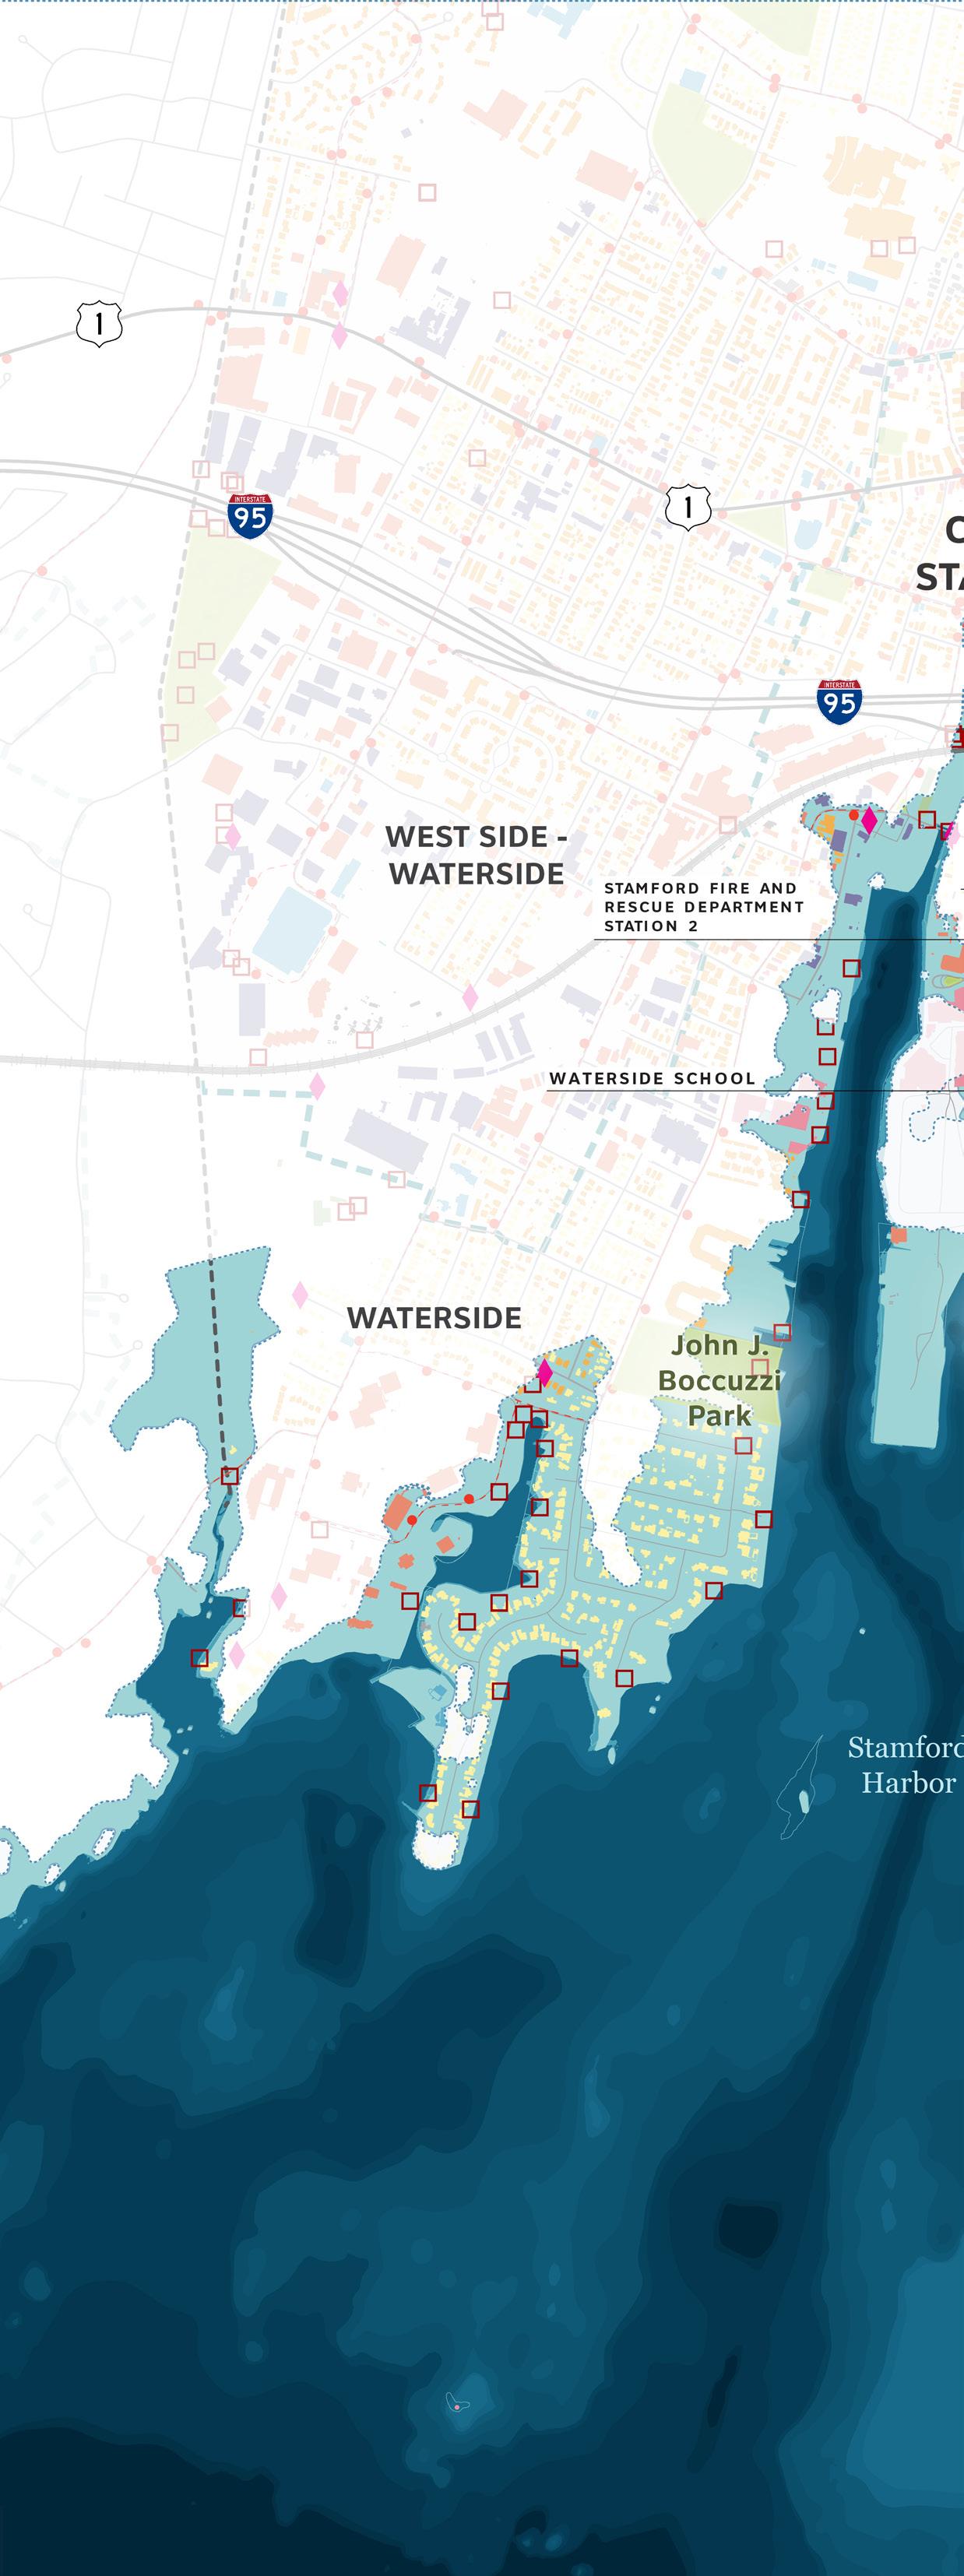
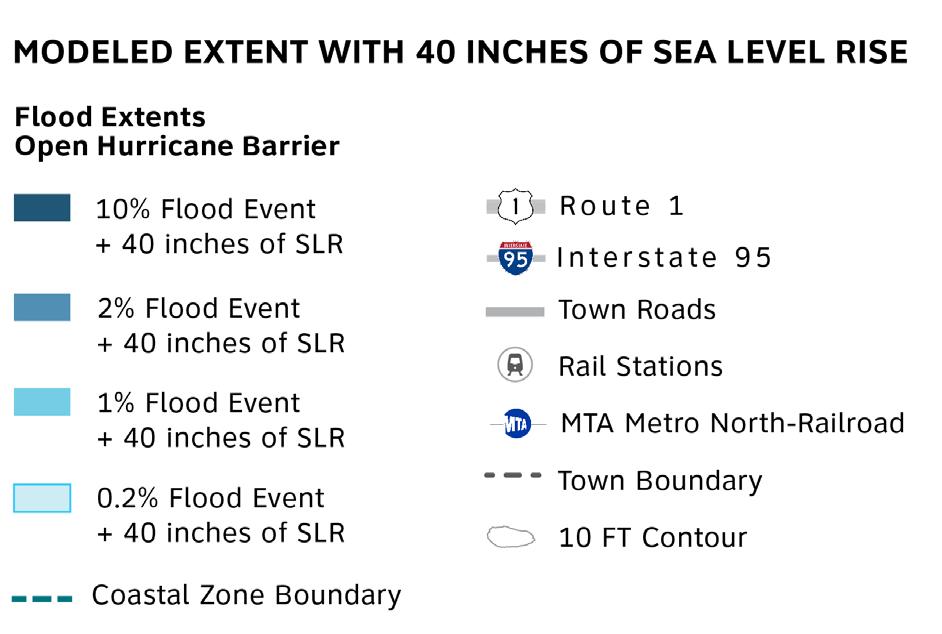
With a modeled increase of 40 in of SLR, the 10% AEP flood is projected to inundate an area comparable to that of the present-day 0.2% AEP event. Under these conditions, the Stamford Hurricane Barrier would no longer provide a significant degree of flood risk reduction even if left permanently closed.
By this point, residential structures on the southern edges of Waterside and Shippan Point will likely face impacts from regular direct wave action resulting from the 10% AEP storm + 40 in SLR, and the 1% AEP storm is expected to inundate much of the South End neighborhood, affecting essential transportation routes and commercial districts along Washington Boulevard, Ludlow Street, and Canal Street.
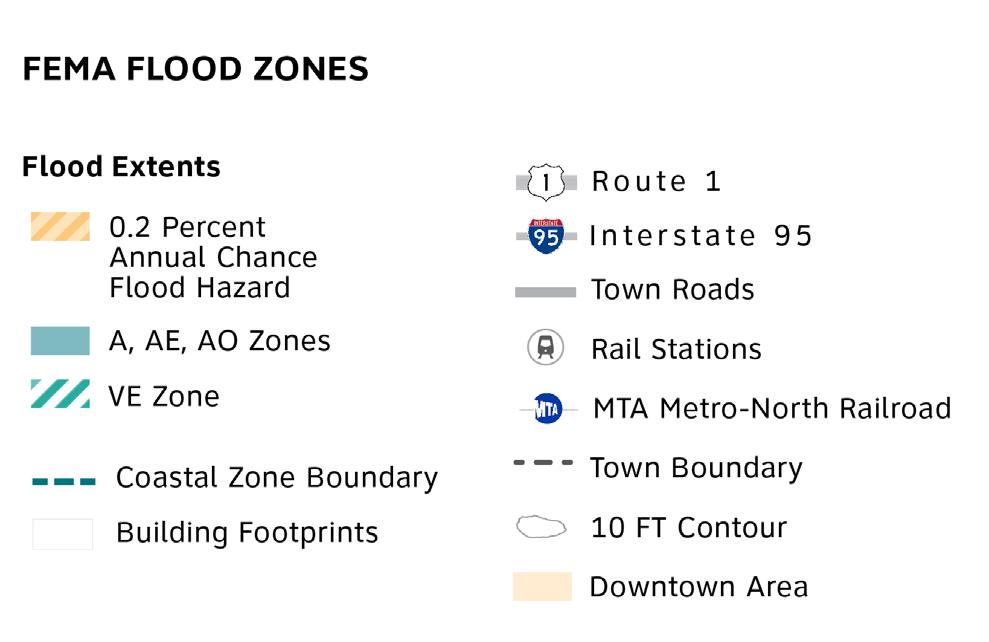
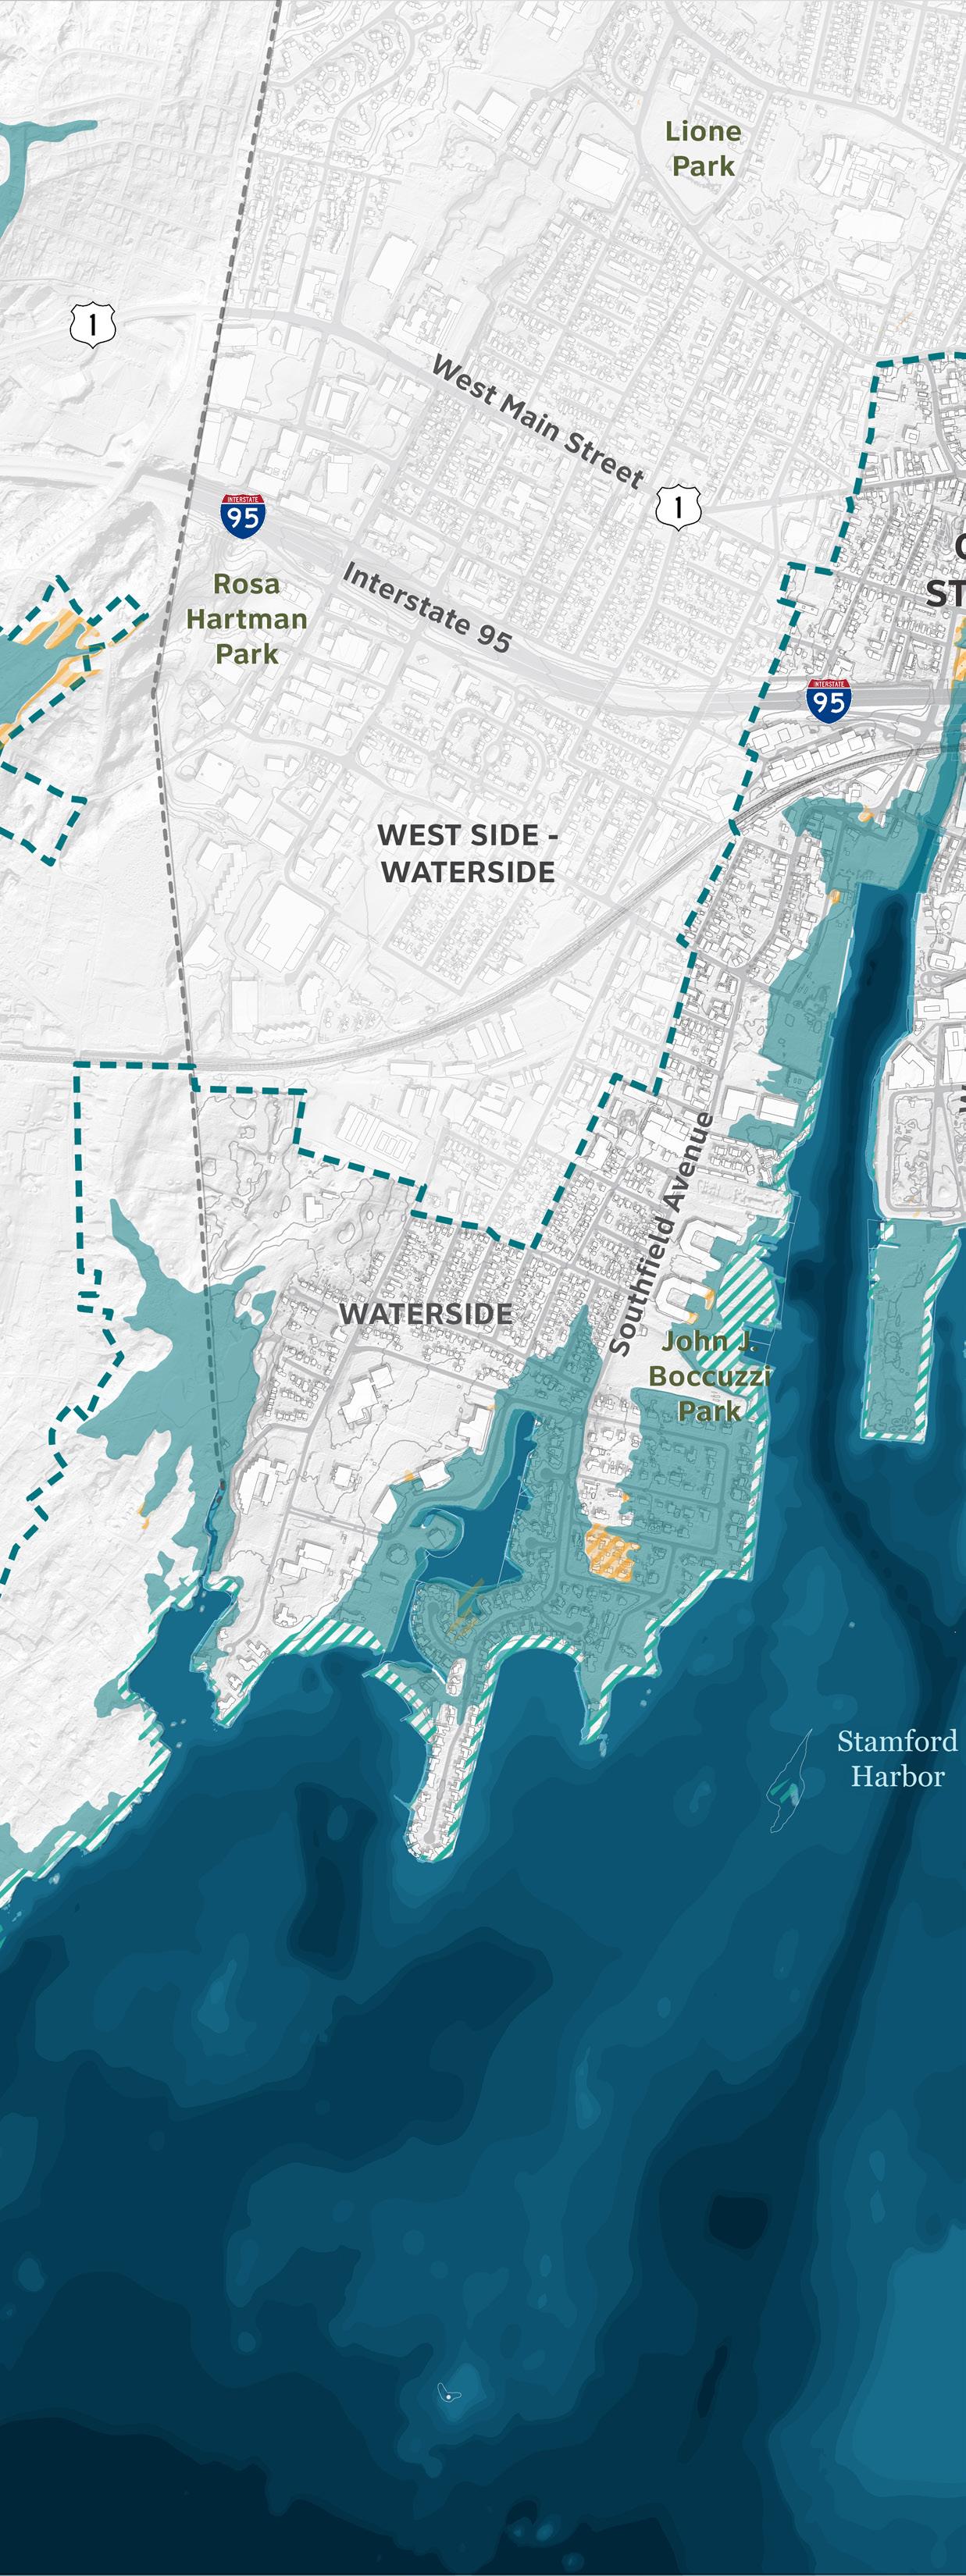
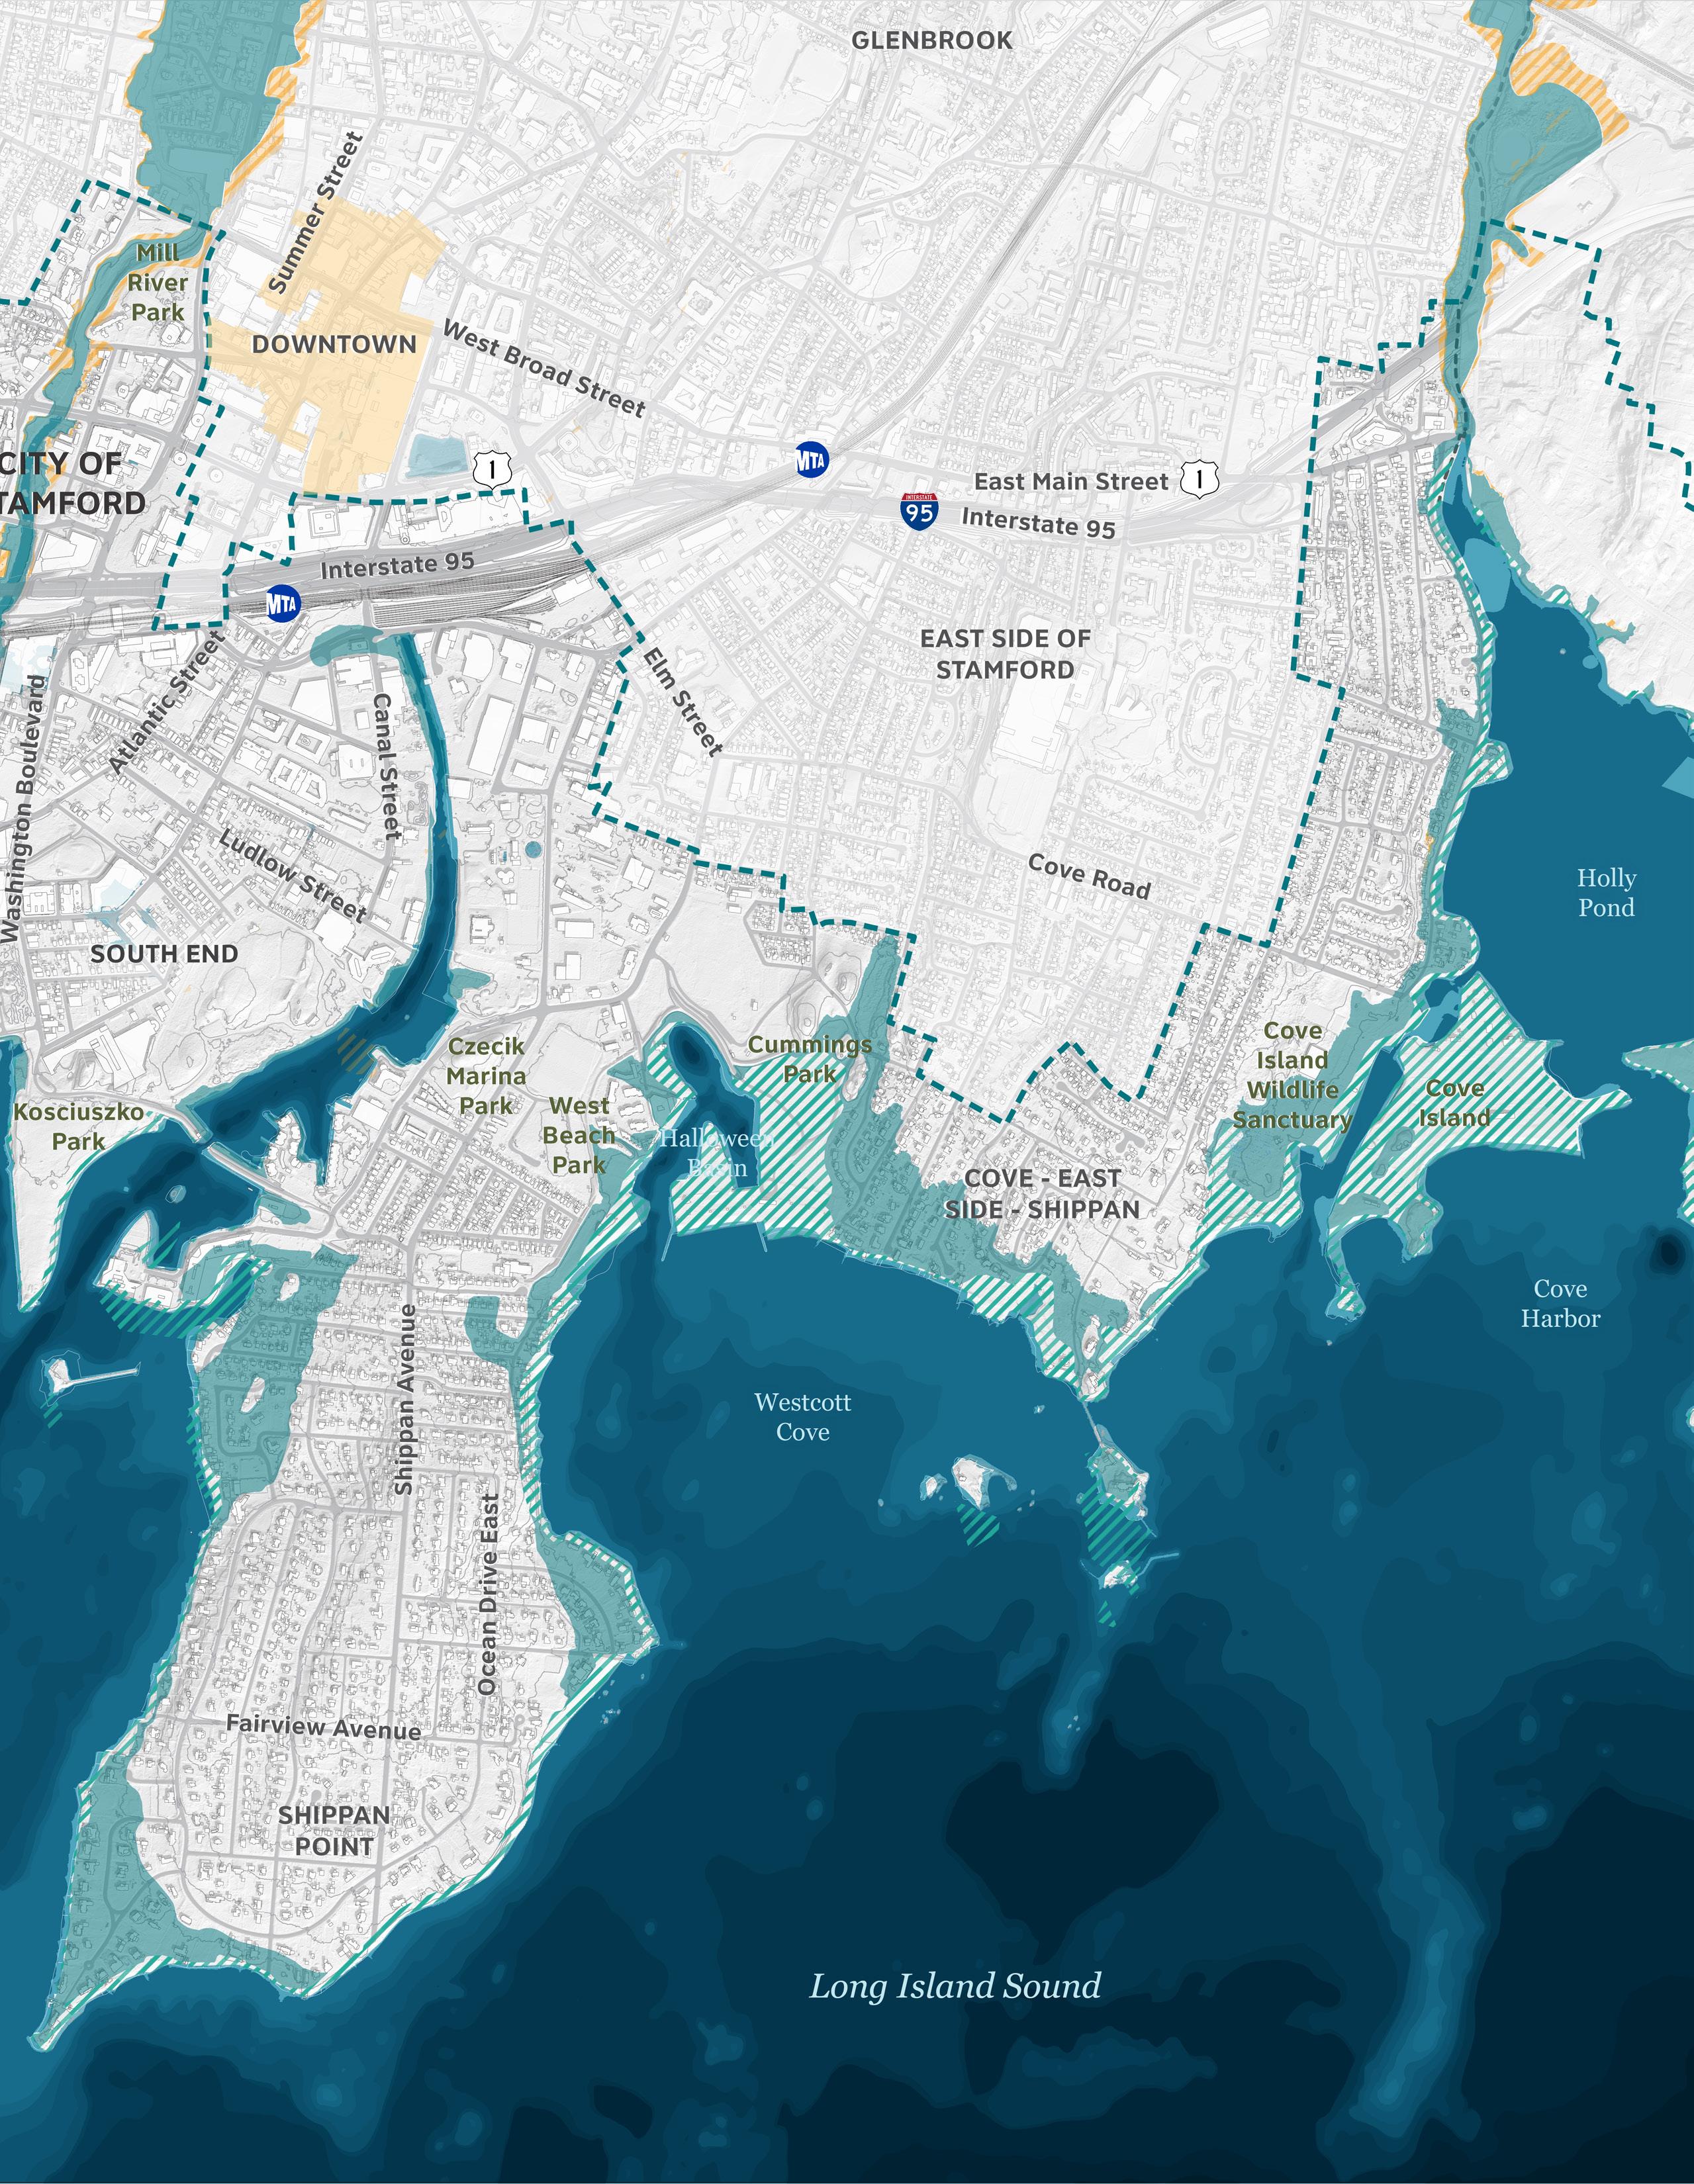
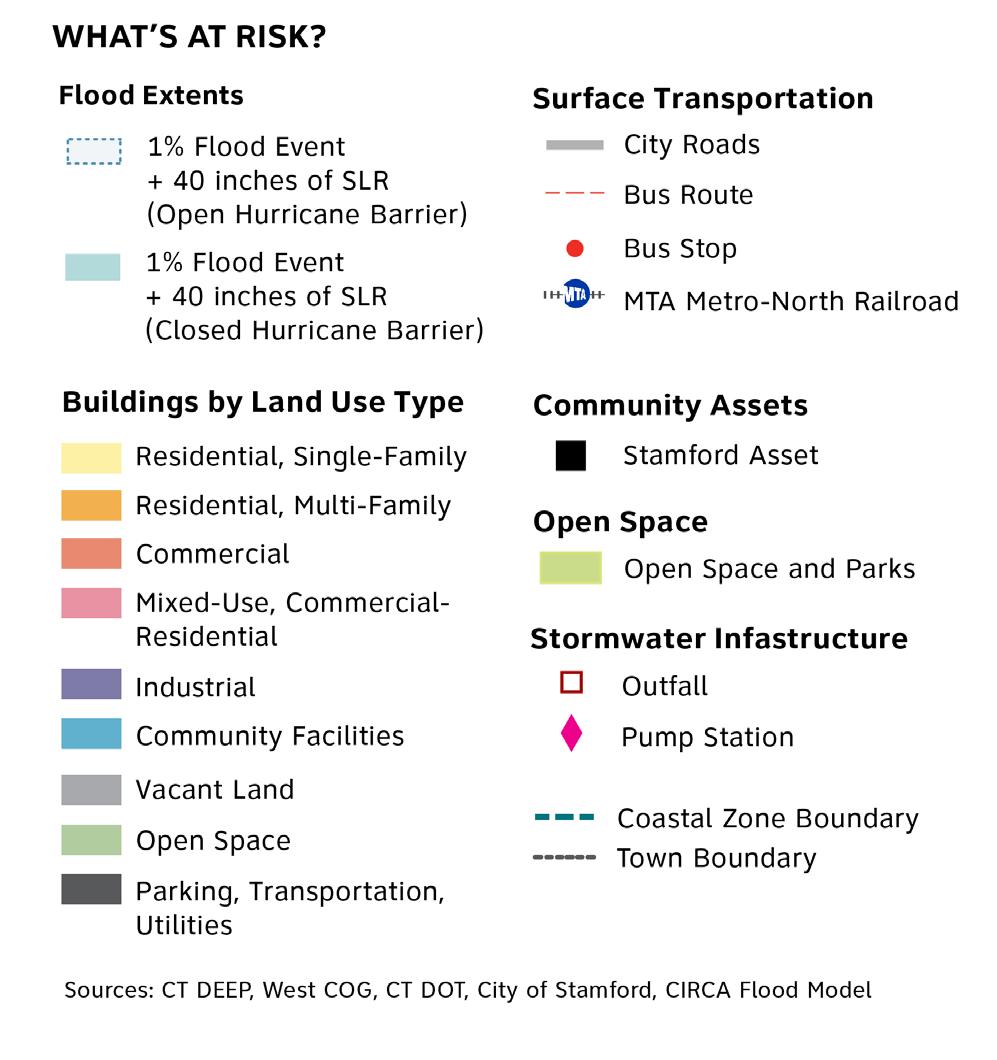
Federal Emergency Management Agency (FEMA) flood zones are marked on Flood Insurance Rate Maps (FIRMs). These data can be used to complement CIRCA coastal modeling to indicate areas of higher historic and present-day risk. According to FEMA FIRMs for Stamford, the entirety of Cove Island and large extents of southern- and eastern-facing shoreline in Waterside, Shippan Point, and the Cove are classified as coastal high hazard VE “Velocity” zones, where flood depths of three feet or more limit the kinds of buildings that can be built. Velocity zones are given this name in reference to the high speeds at which potentially damaging waves move over these areas of land. Other expanses of land fall within the A/ AE/AO zone, which are subject to the 1% AEP flood.
FEMA 1% floodplain designations underscore the fact that many of Stamford’s most popular parks—along with the residential neighborhoods that surround them—are particularly exposed to heavy coastal flooding.
Flood extents provided by FEMA FIRMs differ from CIRCA data in that they define large flood zones in the upper reaches of the Mill River past the coastal zone, as well as where the Holly Pond Inlet spills northward across the I-95 overpass. By contrast, little of the South End/Harbor Point or East Side neighborhoods fall within a designated FEMA Special Flood Hazard Area. As sea levels rise and the storms expected to hit Stamford increase in magnitude, FIRM floodplains may correlate poorly with the areas that are actually subjected to inundation.
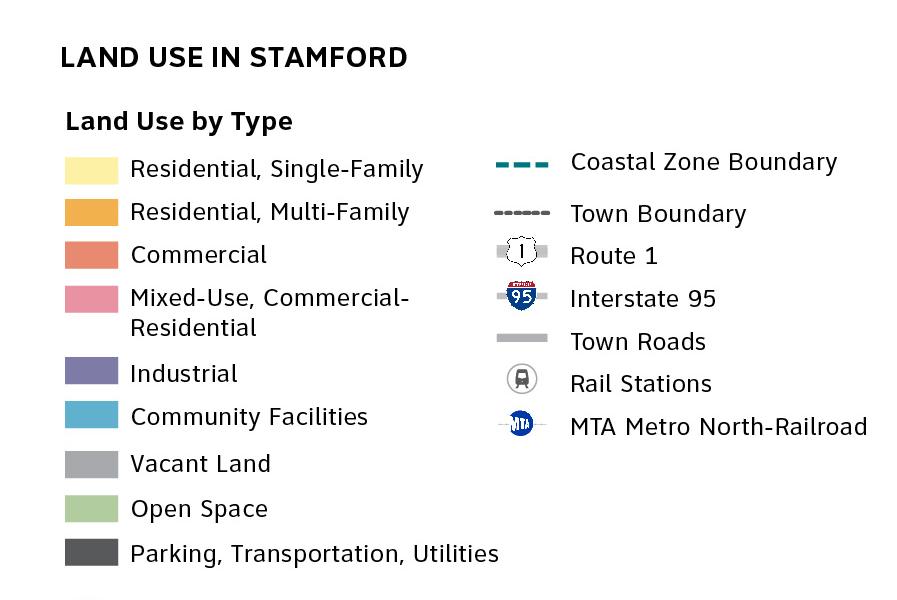
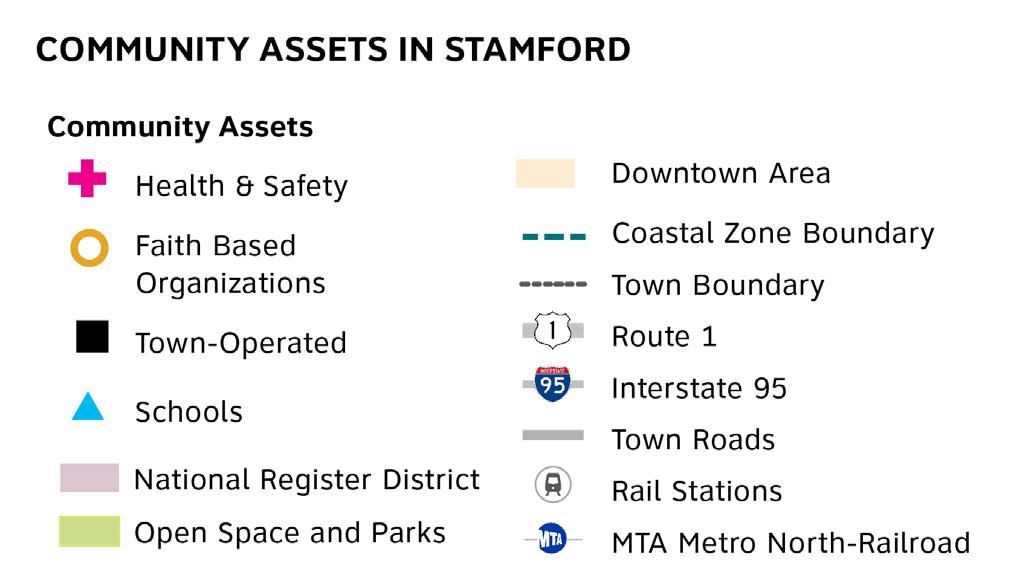
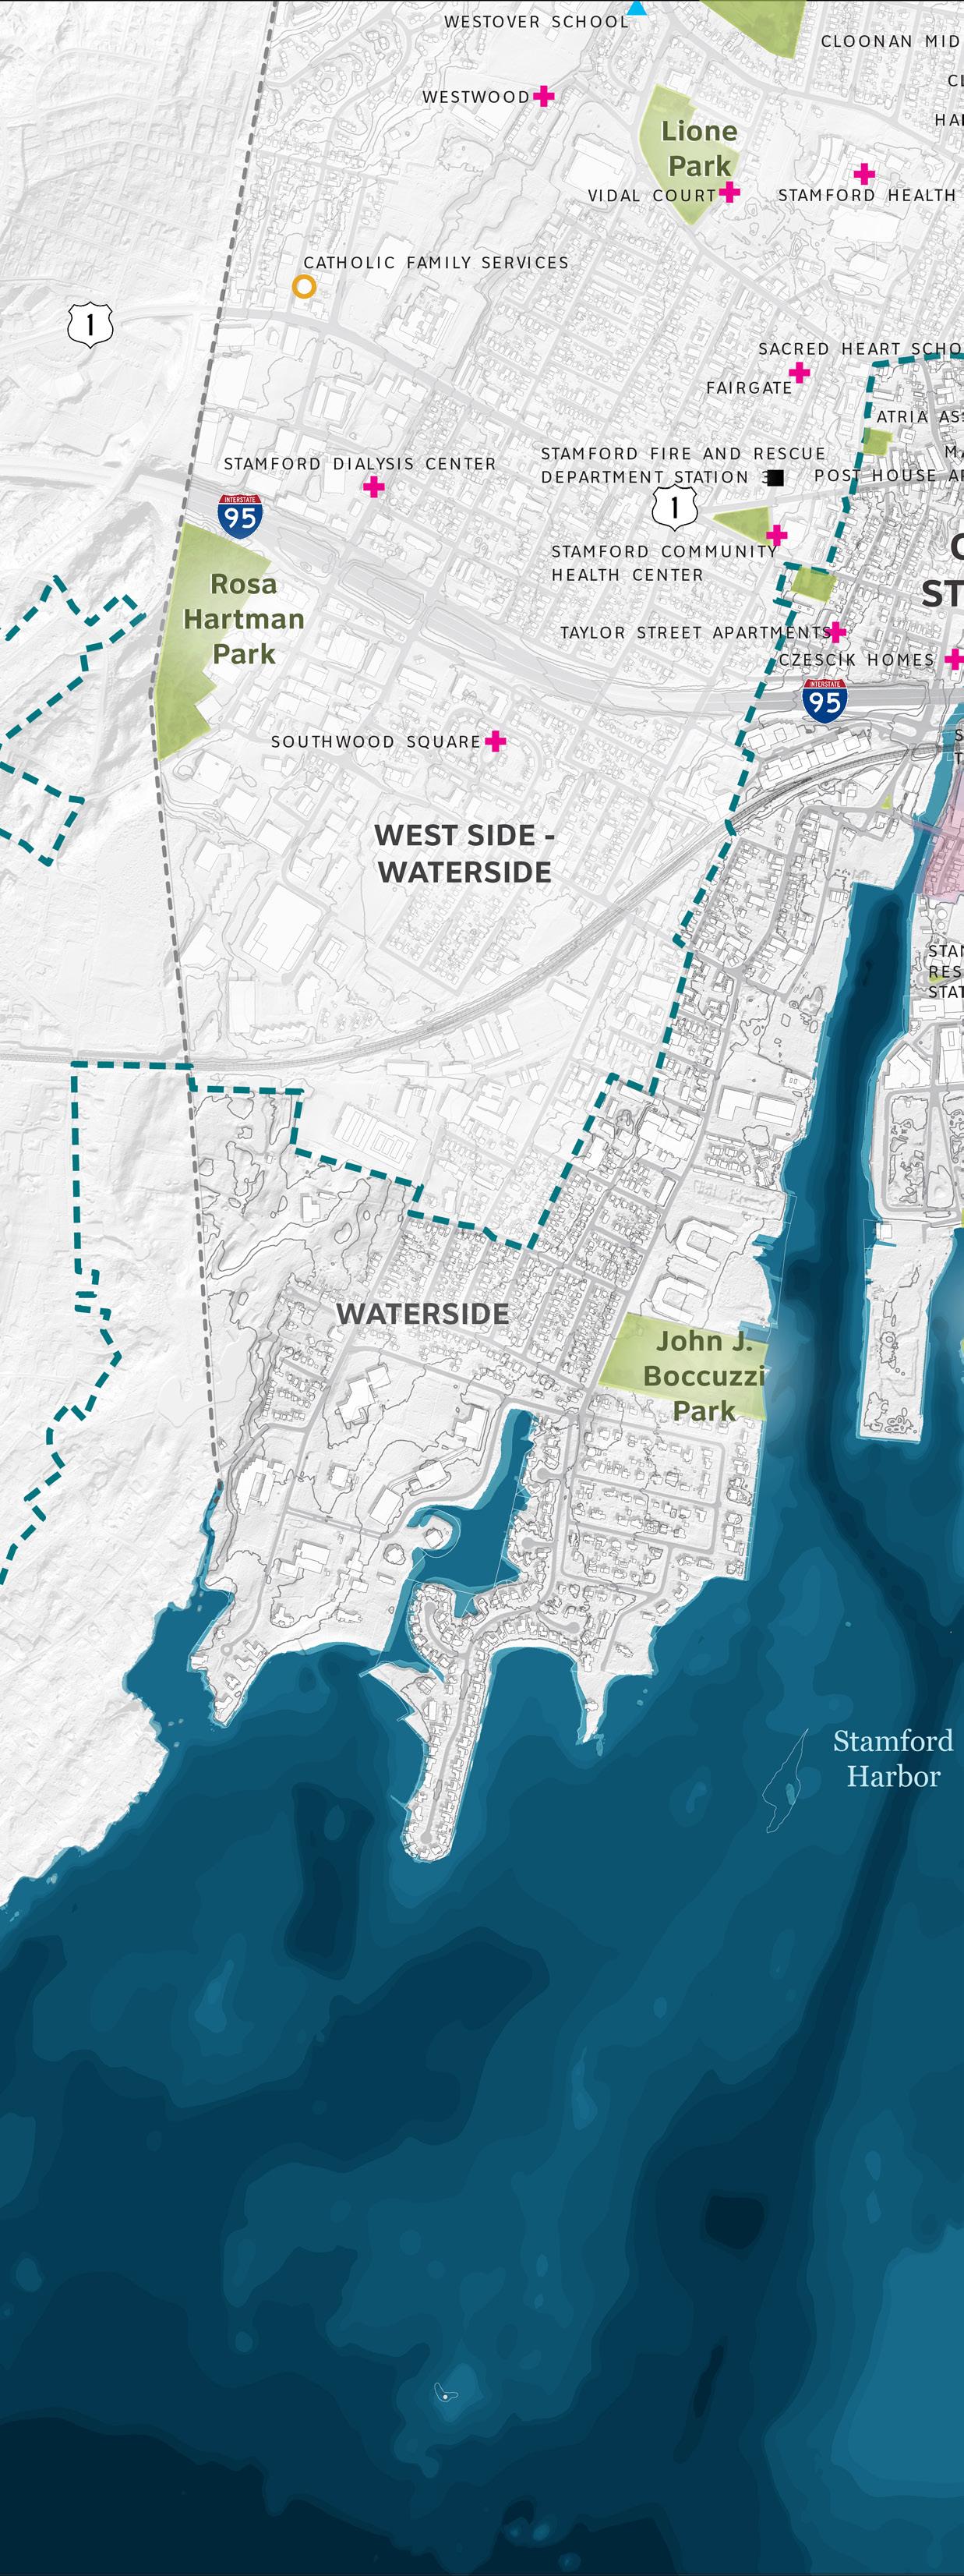
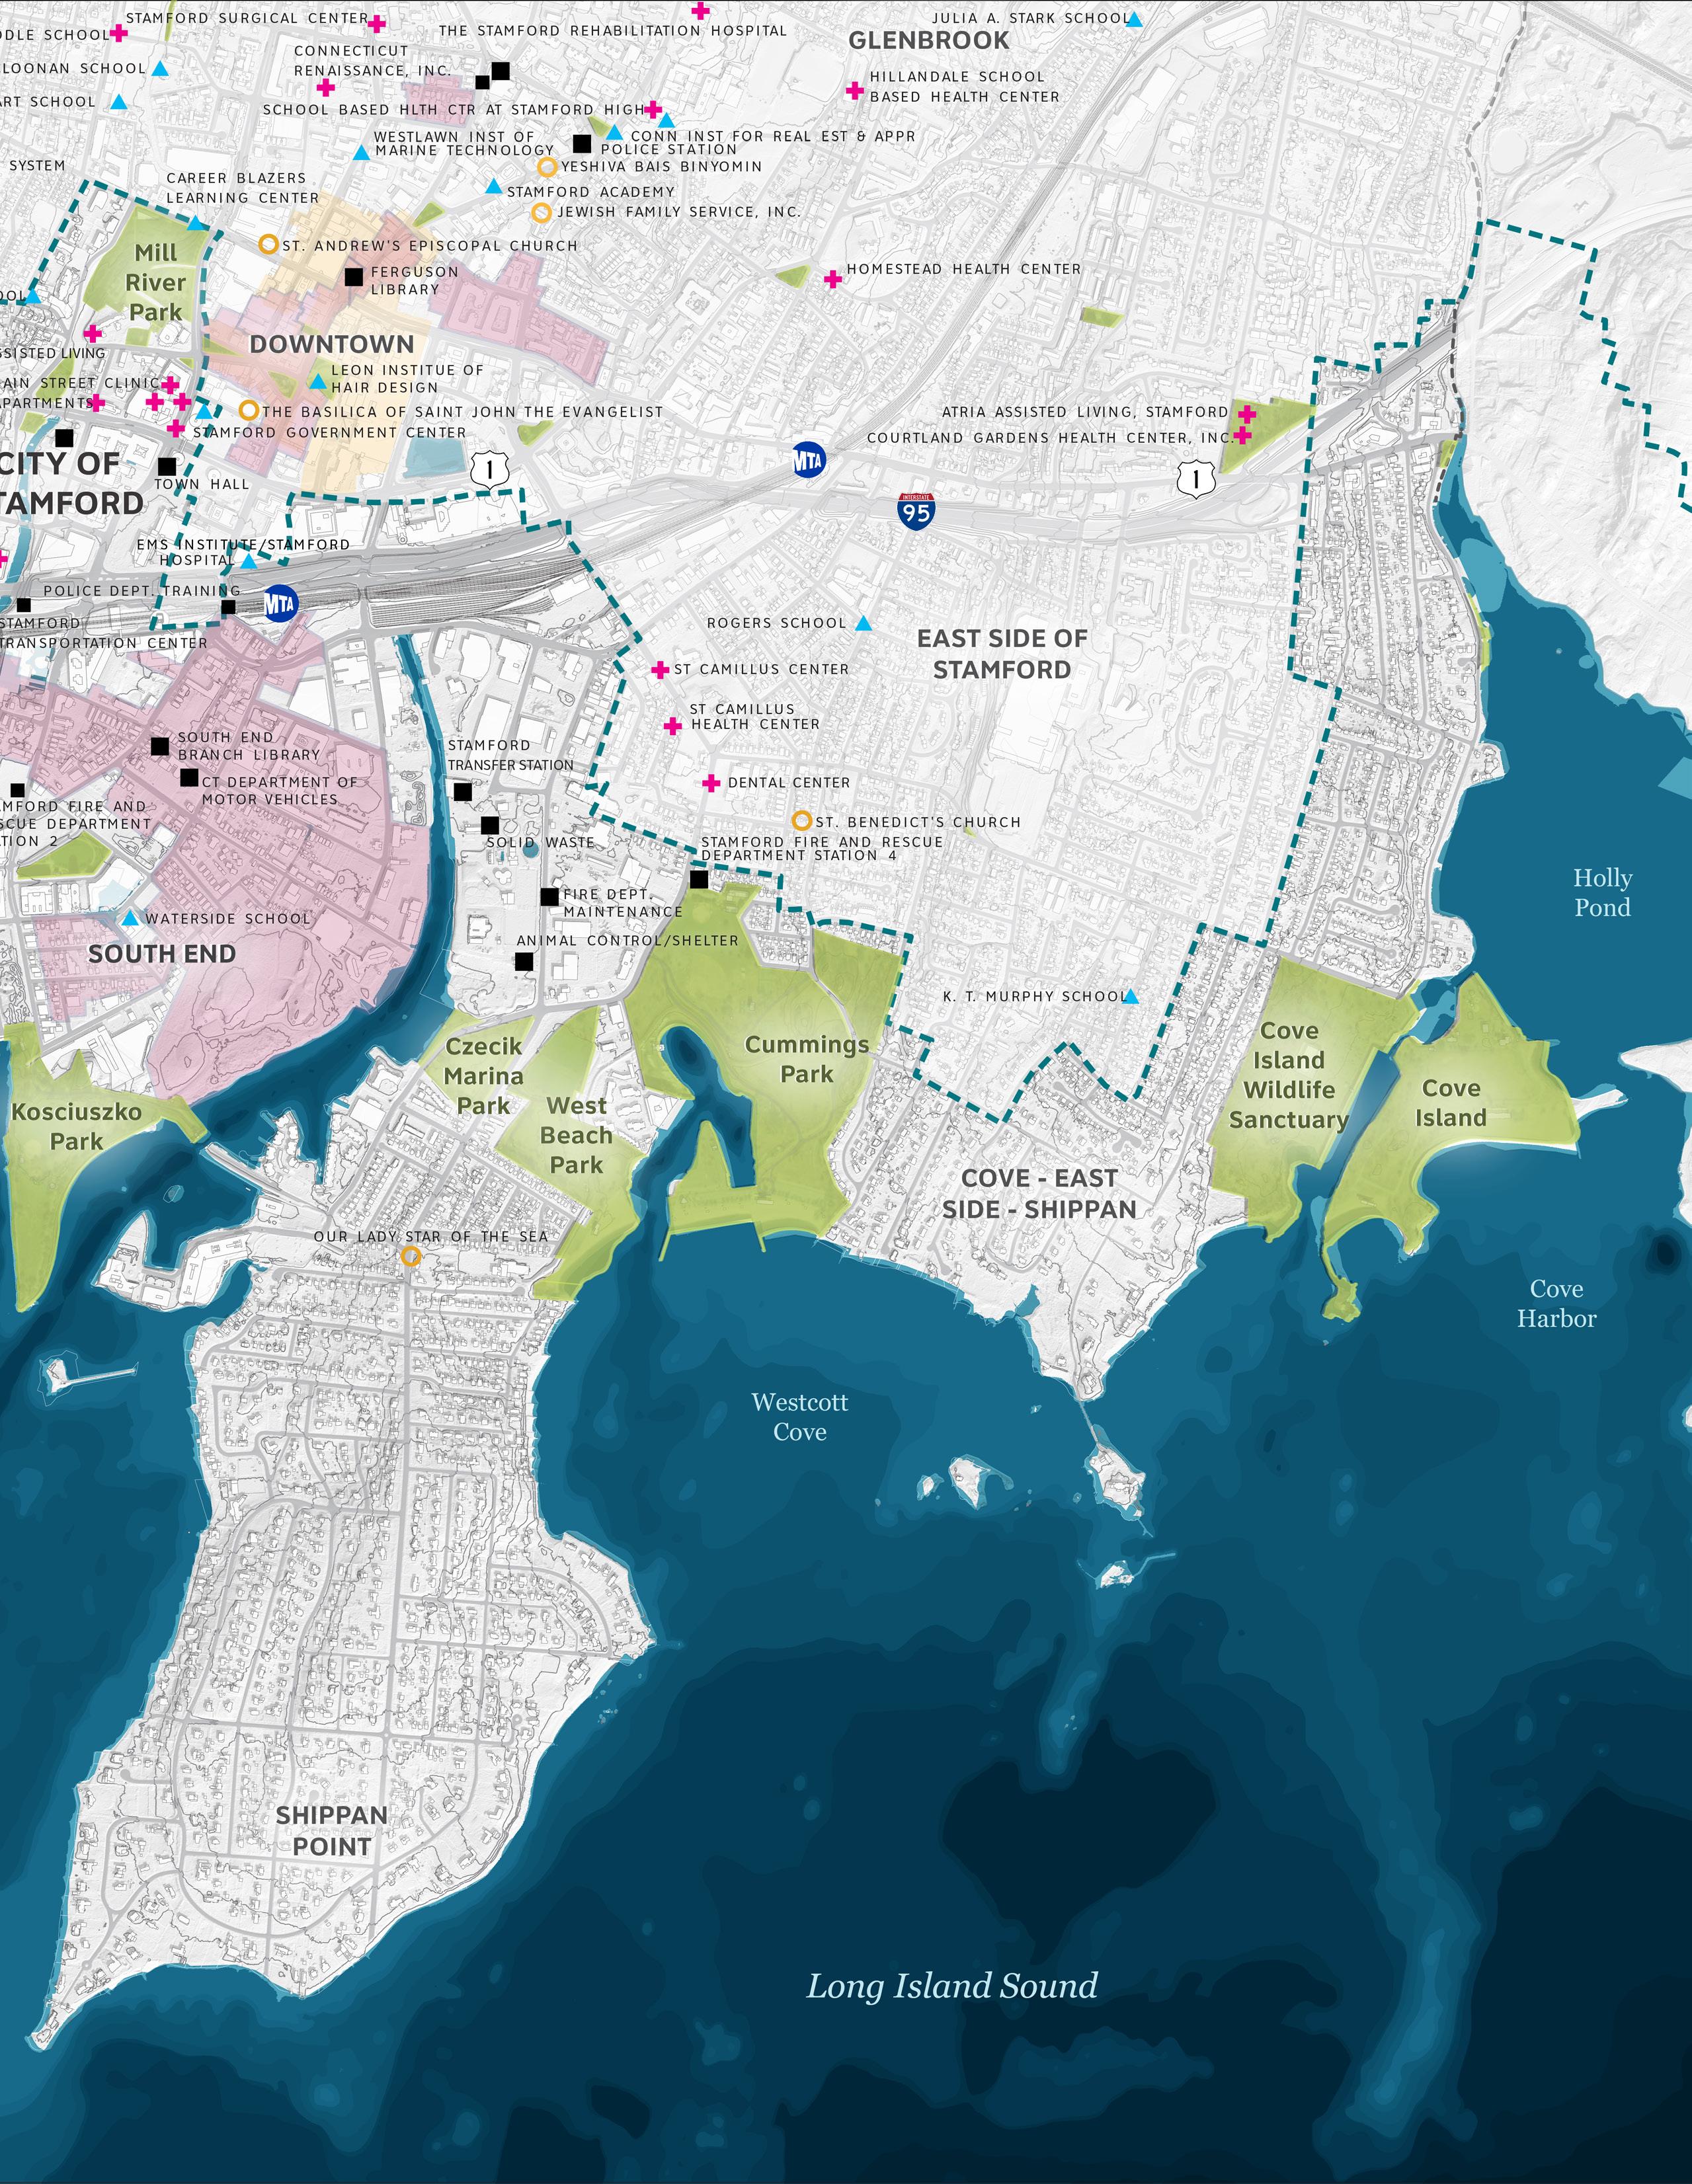
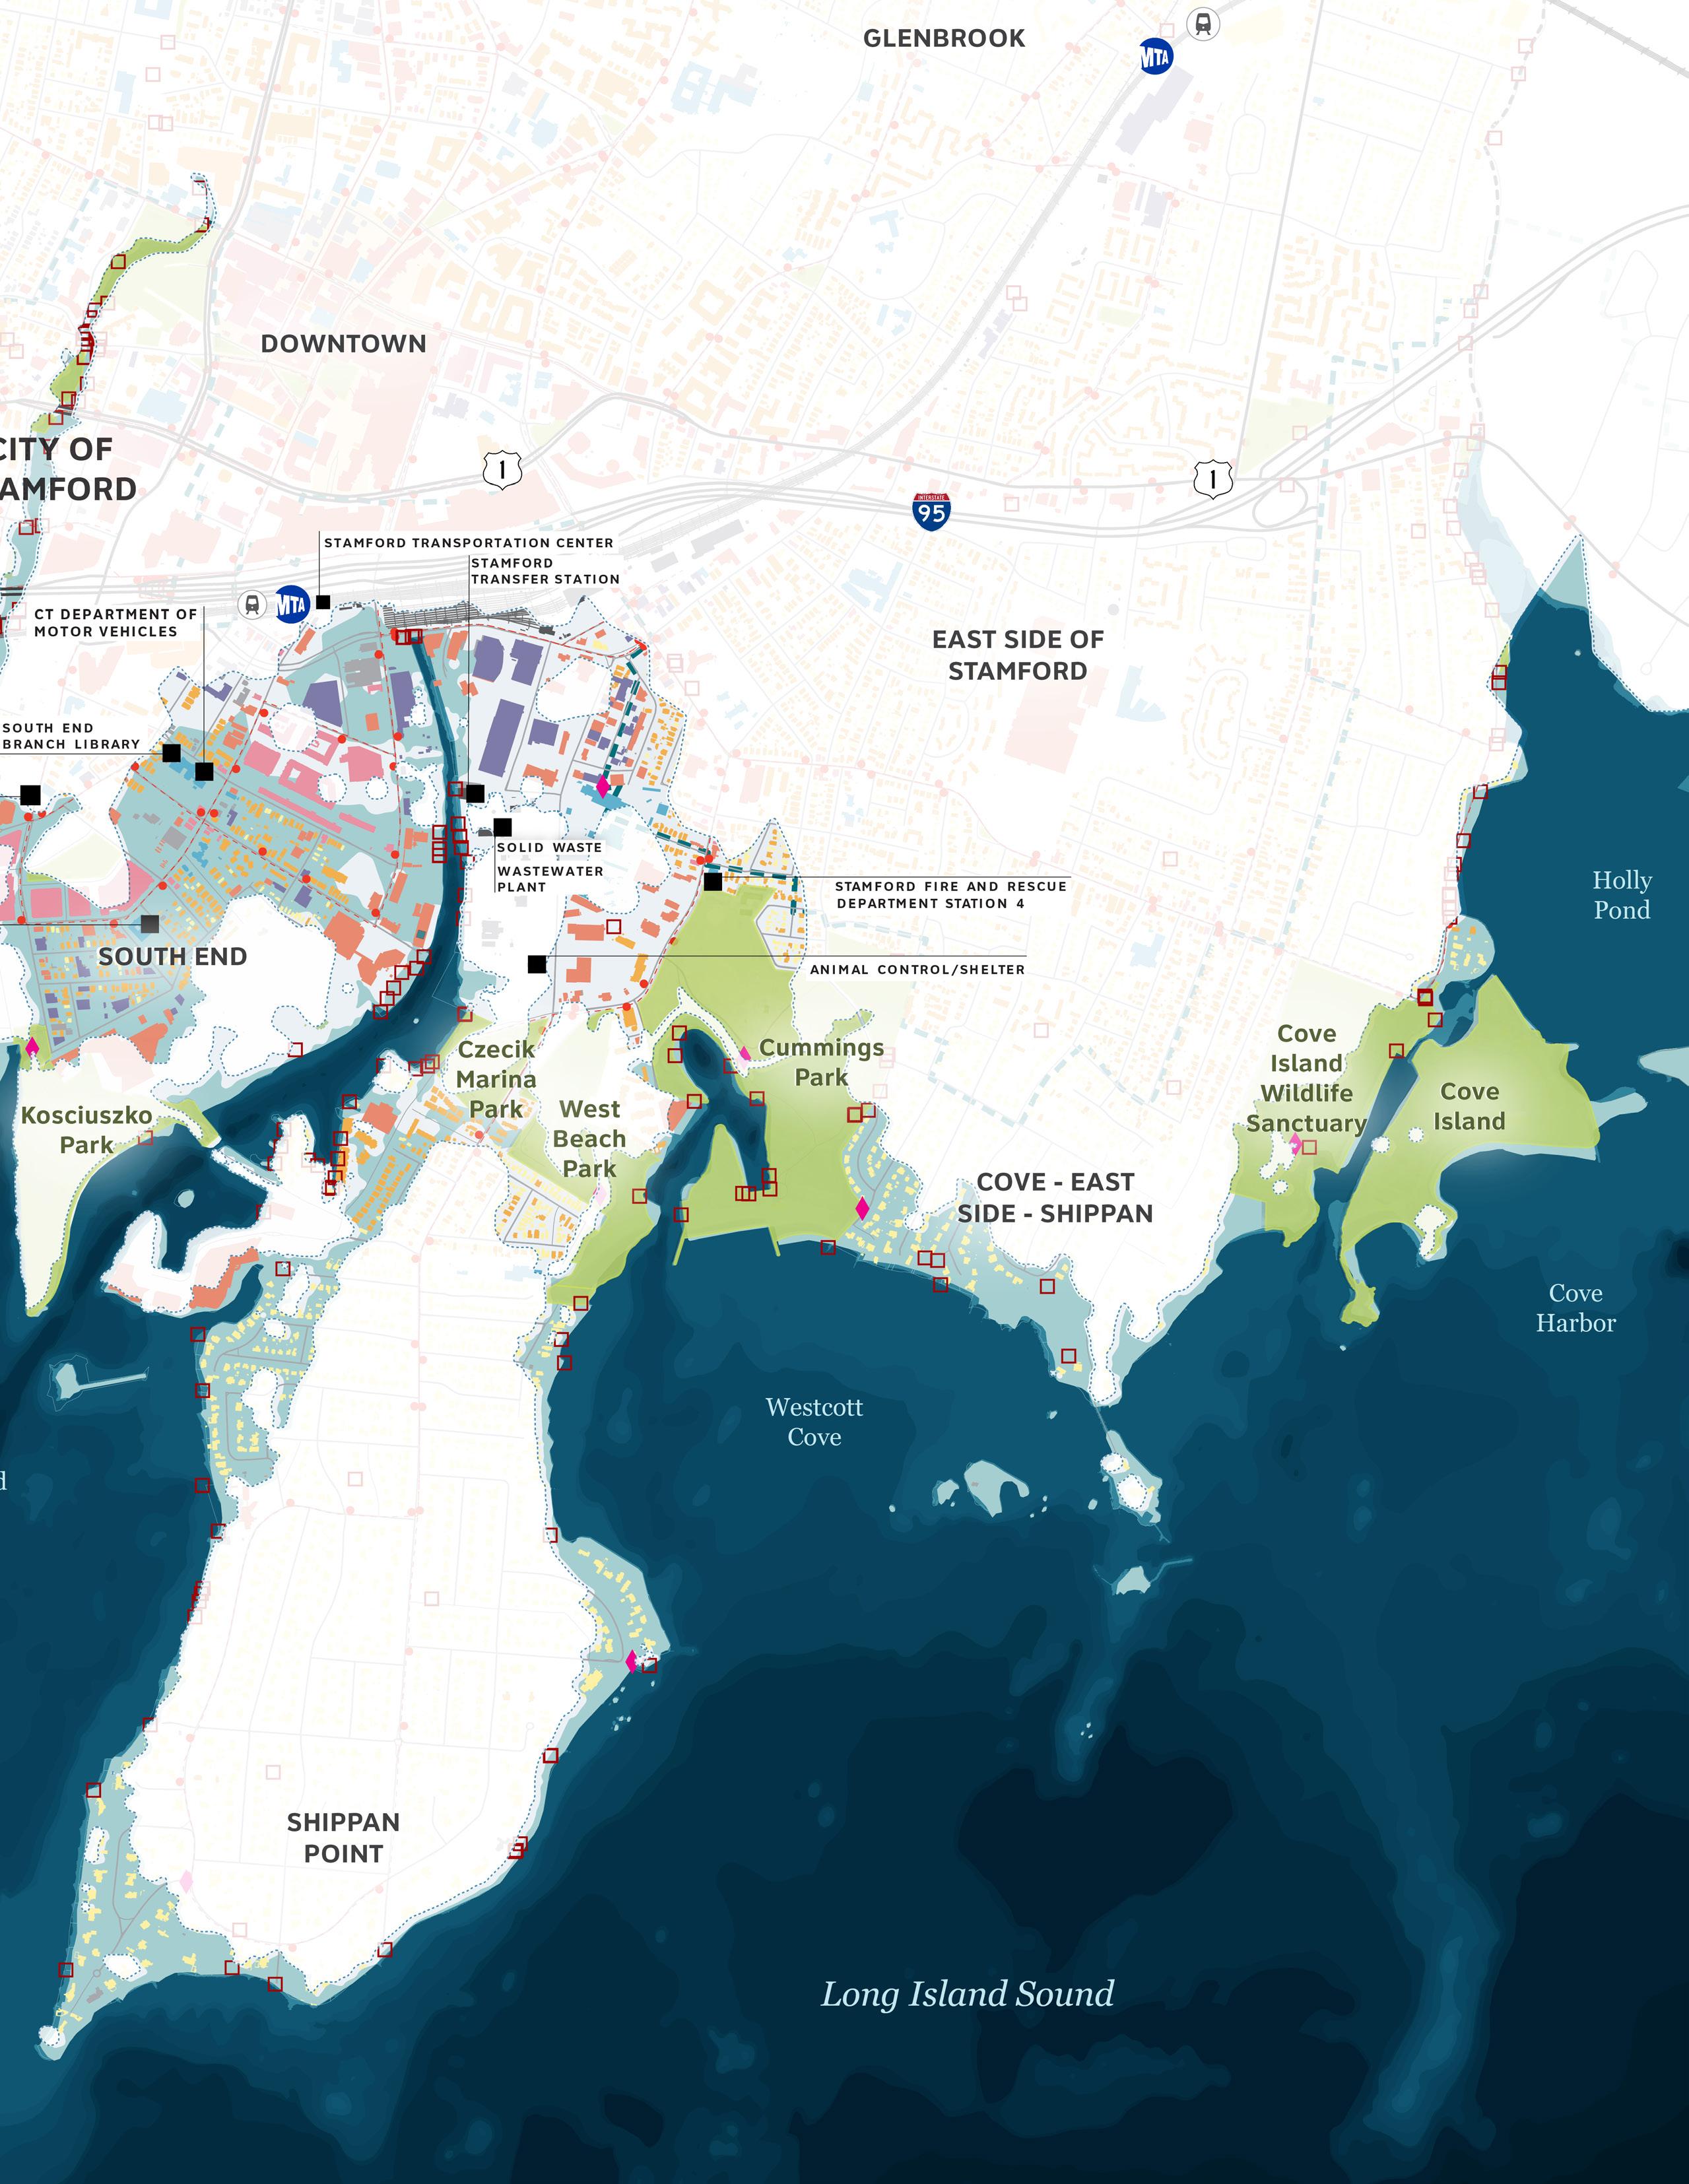
As part of the New York City metropolitan area and Connecticut’s second most populous city, Stamford is home to a number of social, cultural, and infrastructural assets critical to the region at large. These include one of the largest financial districts in the nation, as well as historic resources and regional transportation hubs. The next series of maps highlight what is at risk in terms of key municipal infrastructure, parks and open space, and social and cultural assets.
Community assets refer to public resources that can be used to benefit the health and well-being of the broader public. These include health and emergency response facilities, childcare and elder care centers, and markers of civic heritage.
The 2023 Citywide Parks Strategic Plan affirms the importance of Stamford’s coastal open space, many of which are extremely vulnerable to current and future storms, including Cove Island (which contains a beach and wildlife sanctuary) and Cummings Park (which contains a marina and public beach). Among the municipally-controlled critical facilities, the Stamford Transfer Station and several fire stations are expected to be impacted by the 1% AEP storm with 20 in of SLR. At two feet of flooding, large vehicles—including emergency vehicles—may have difficulty traversing flooded roadways and accessing emergencies, leading to potential safety hazards.
Many historic buildings populate the South End Historic District , where they are expected to be exposed to future storm flooding flooding starting from the present-day 10% event. Historic sites require special care in flood-vulnerable areas due to requirements governing historically appropriate construction and maintenance practices.
After centuries of development, few of Stamford’s original wetlands remain, with much of the shoreline occupied by hardened bulkheads and erosion protection measures such as jetties. This has limited the extent to which Stamford’s coastal natural resources can help mitigate flood risks. In some locations, such as the Cummings Pond at Cummings Park, what was formerly tidal open water has degraded into a sediment-clogged wetland overrun with invasive species.
The City’s Parks Strategic Plan indicated that the most flood-prone coastal parks are Cove Island, Cummings Park, Czecik Marina Park, and Harbor Point Commons, with tidal flooding already beginning to impact parking lots at Cummings Park and Cove Island. As coastal flooding in these areas continues to increase over time, the projected depth and duration of inundation are likely to increase, which will not only impact parking lots and other forms of hard infrastructure in parks and open spaces but may also outpace the rate at which remaining natural resources (e.g., coastal wetlands) in these areas can adapt.
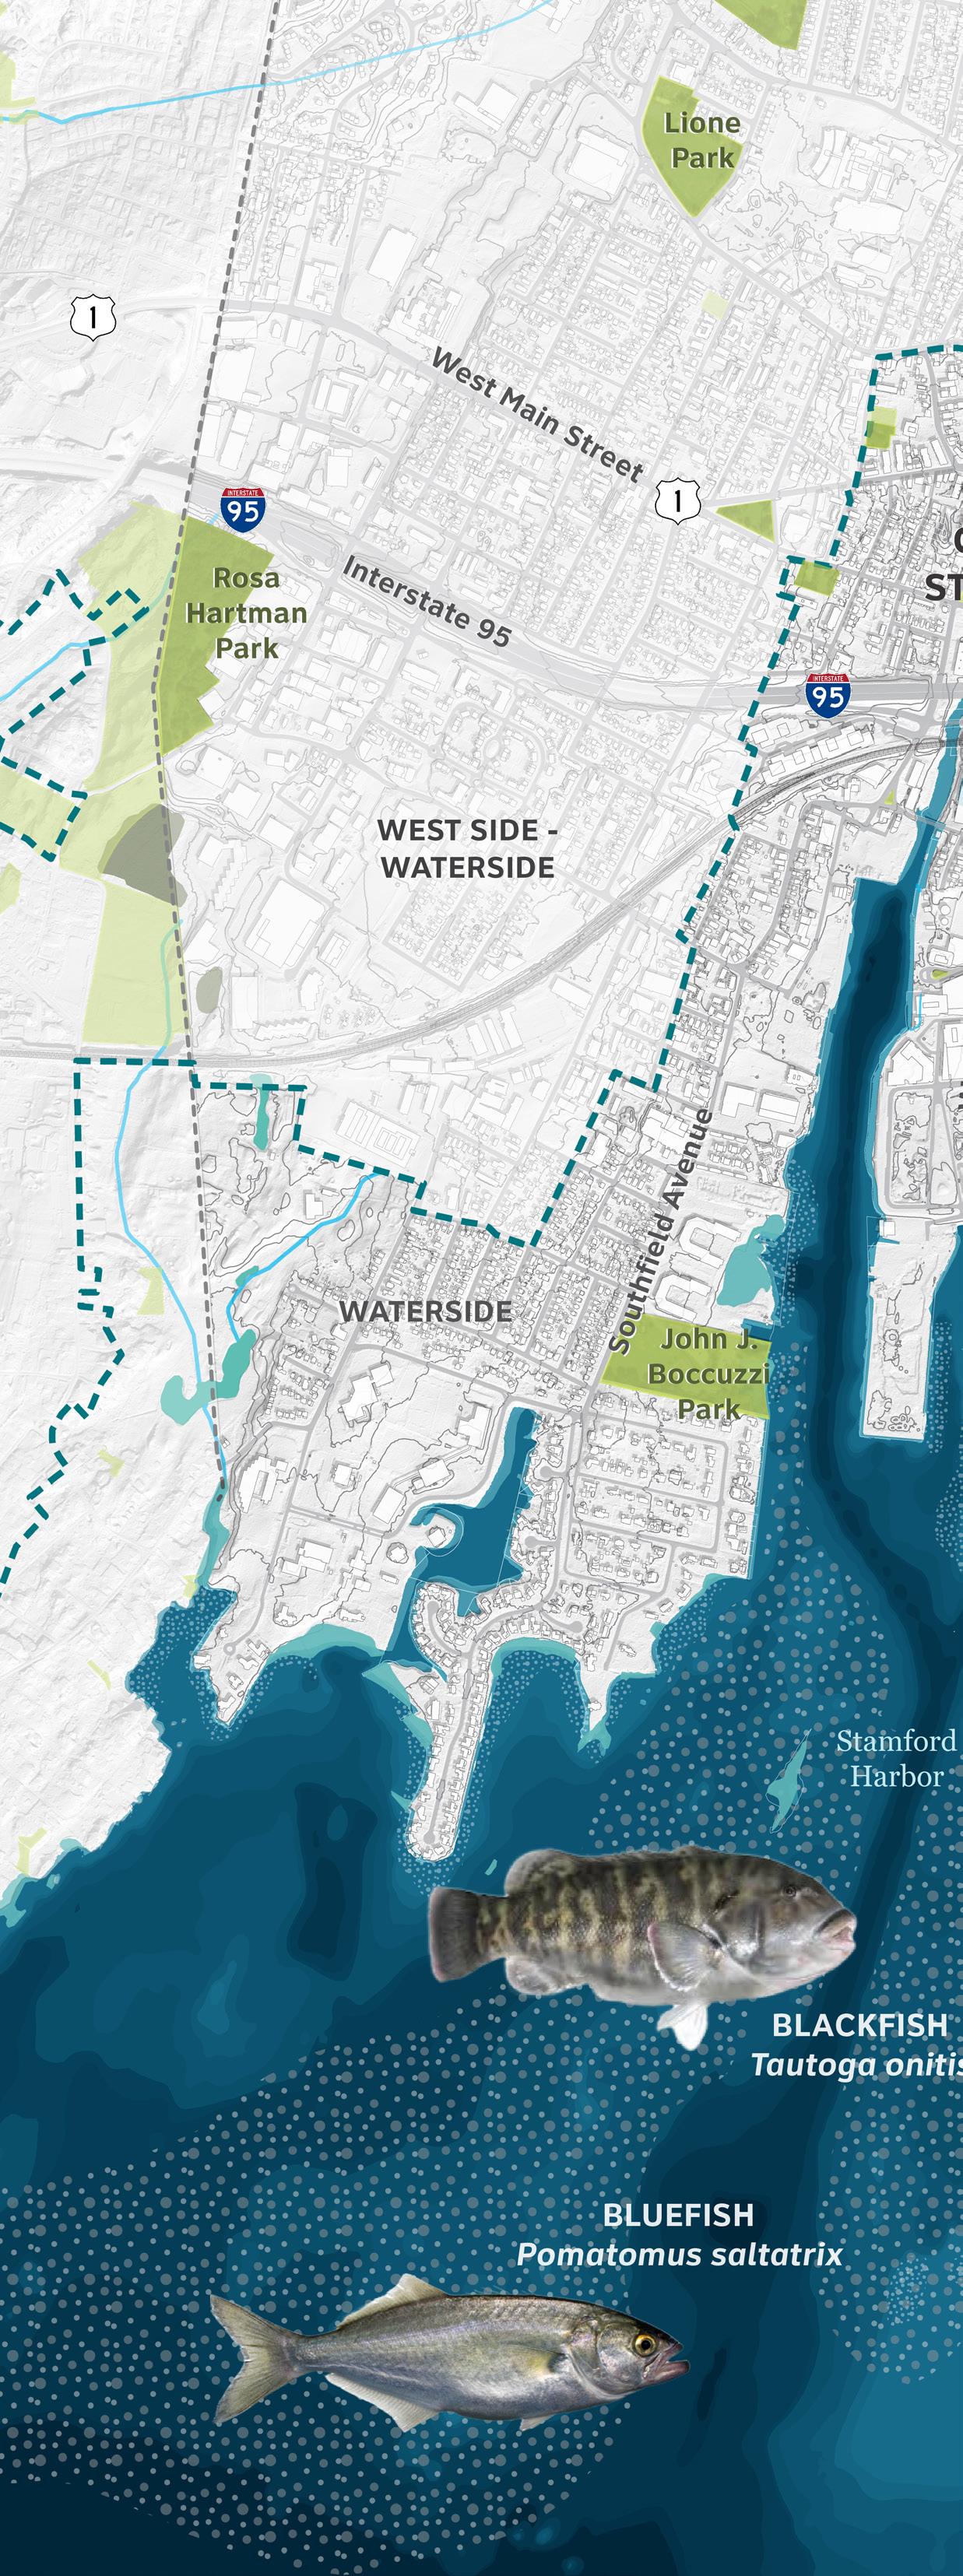
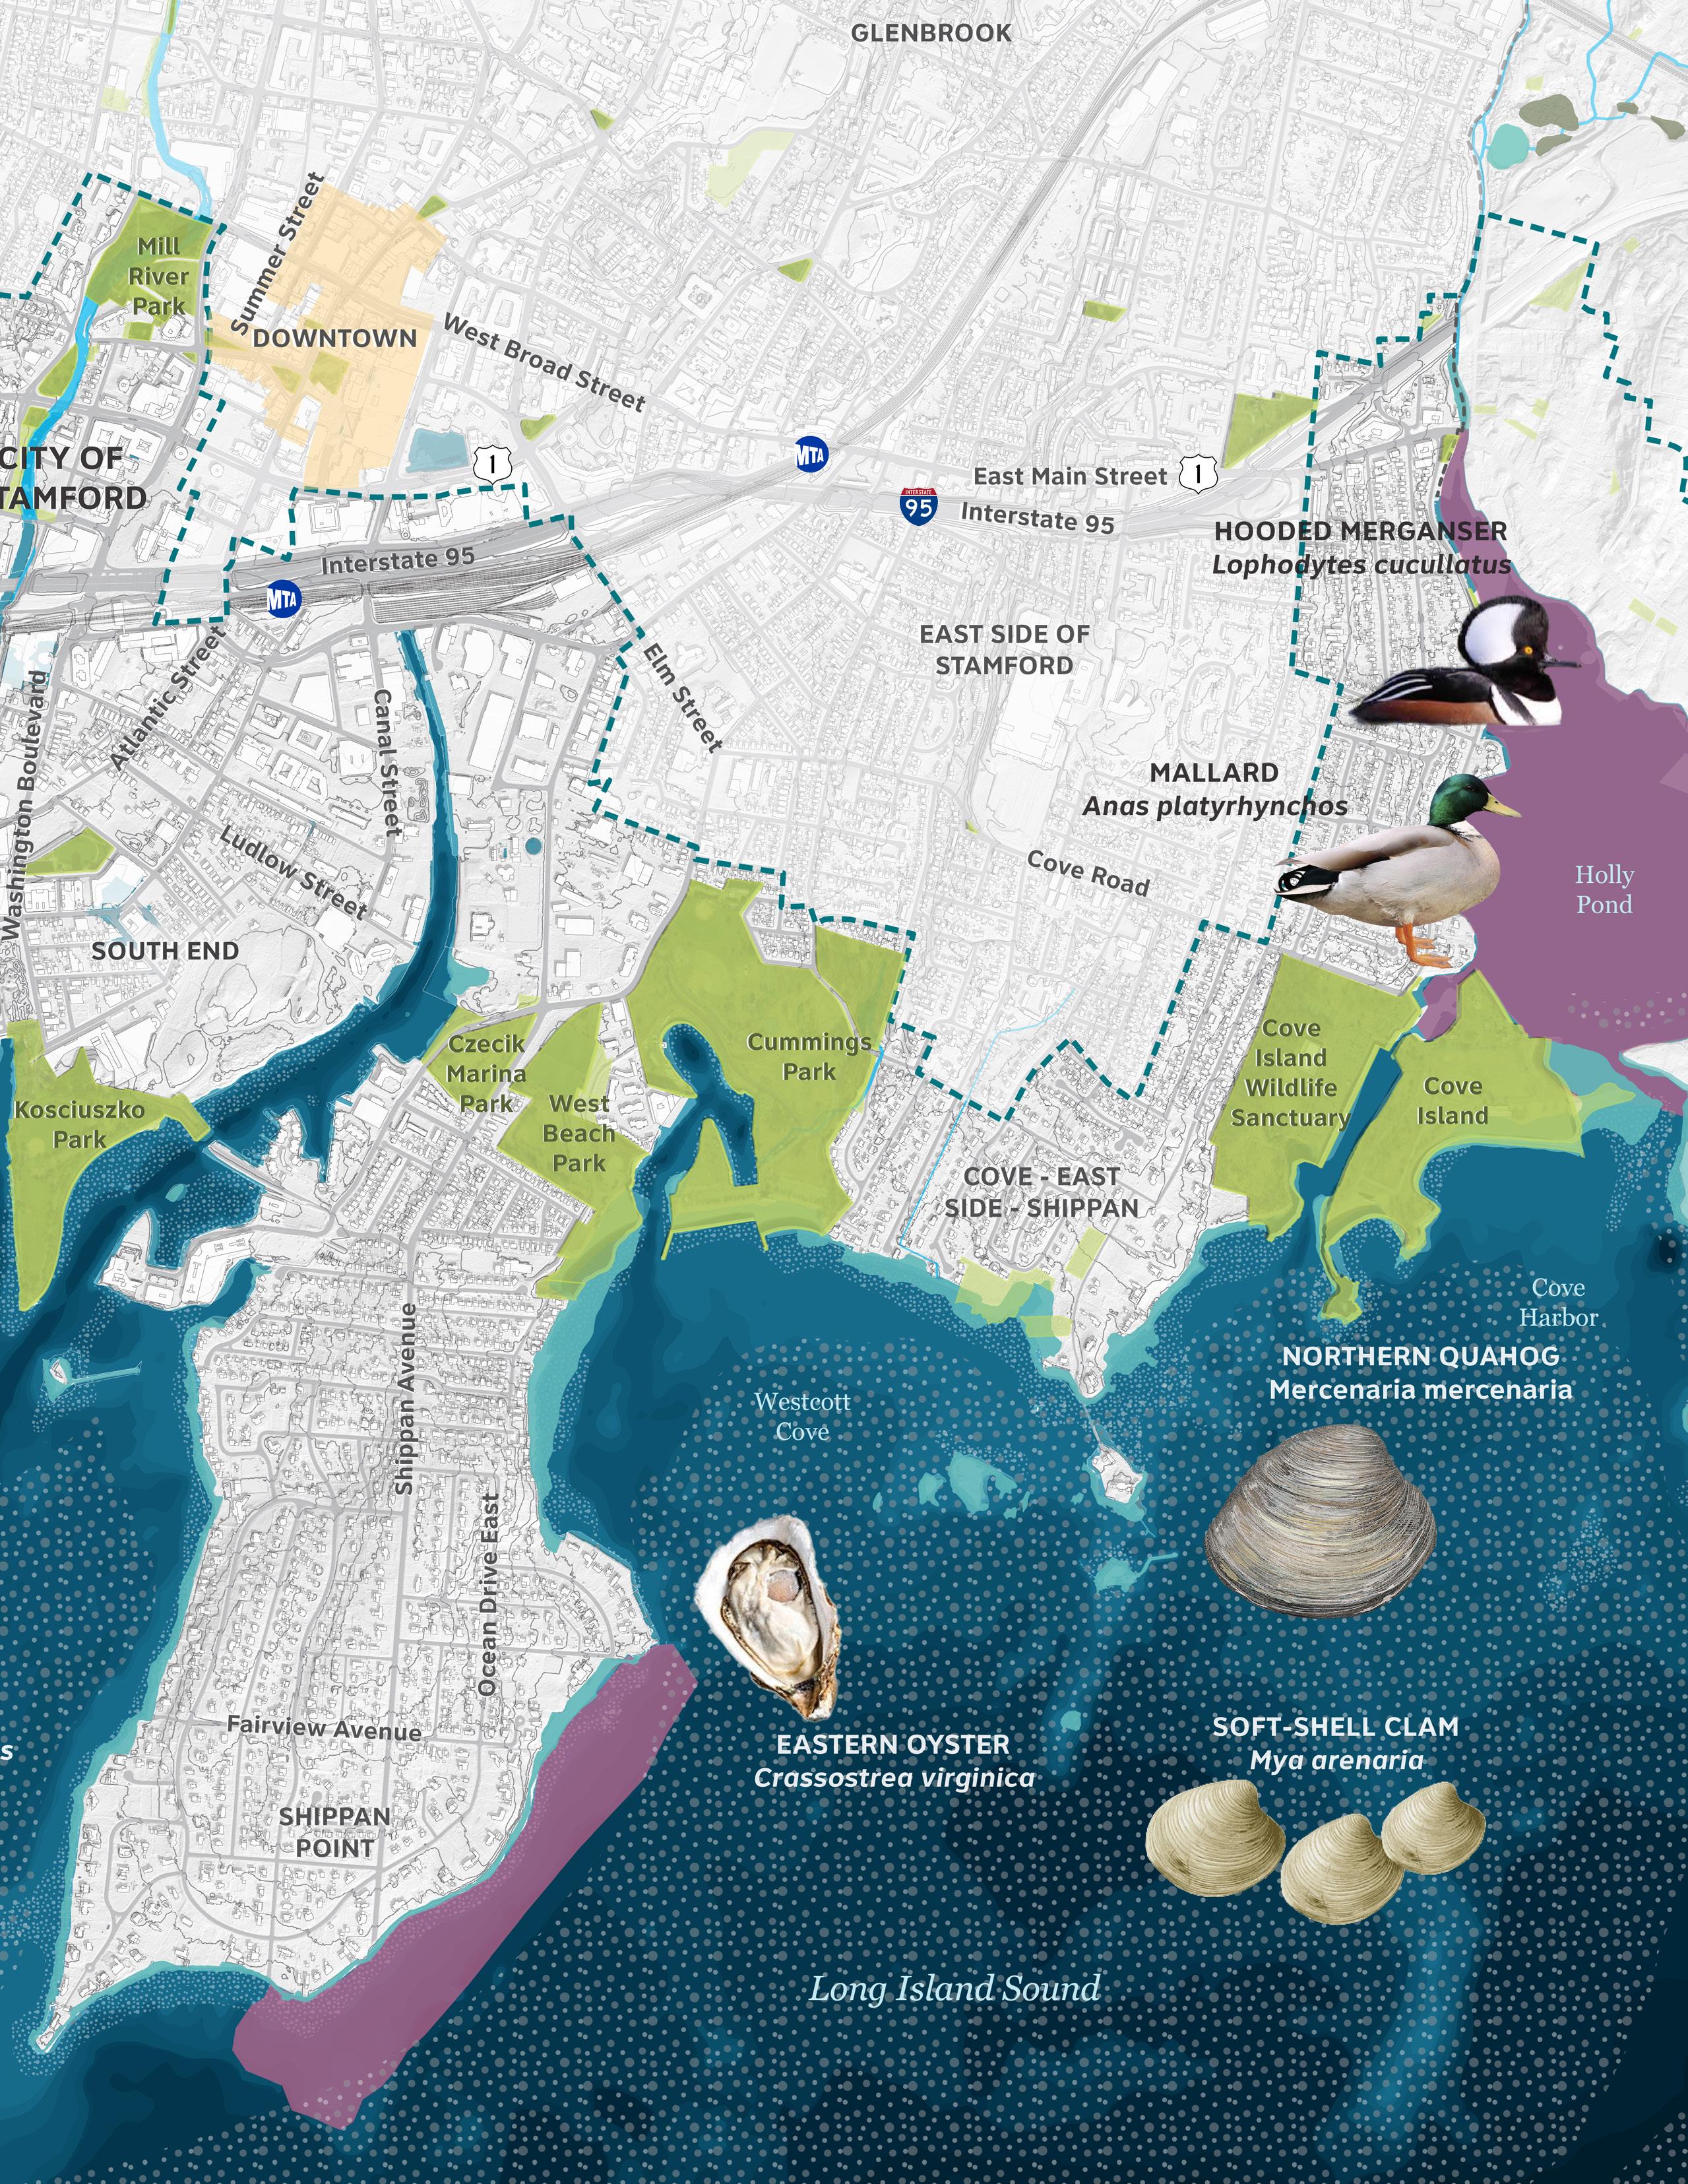
From the open water of Stamford Harbor to public beaches and intertidal habitat, Stamford houses a variety of valuable ecosystems. These critical ecological assets host animal and plant life, sustain valuable industries, and maintain water and air quality in this region of Long Island Sound. These include private and public shellfish beds, which house mollusk populations that clean purify water, provide fish habitat, provide fish habitat, and feed fish colonies. Intertidal mud flats act as nutrient reservoirs for marine organisms as well as a sink for pollutants and toxins.
Although many of Stamford’s coastal wetlands were lost to development over the past two centuries, the remaining wetlands play numerous vital ecological purposes by sequestering carbon, absorbing waves, and reducing erosion runoff. Migratory birds also use estuaries and salt marshes to forage, nest, and seek refuge, feeding on unique vegetation, invertebrates, and fish that can be found where fresh and saltwater conditions meet. Riverine nutrients are carried downstream, collecting in coastal embayments and marshland before being washed out to sea to sustain marine organisms. Where possible, this project aims to incorporate strategies to preserve and enhance these ecologies so they can continue to benefit the surrounding area.
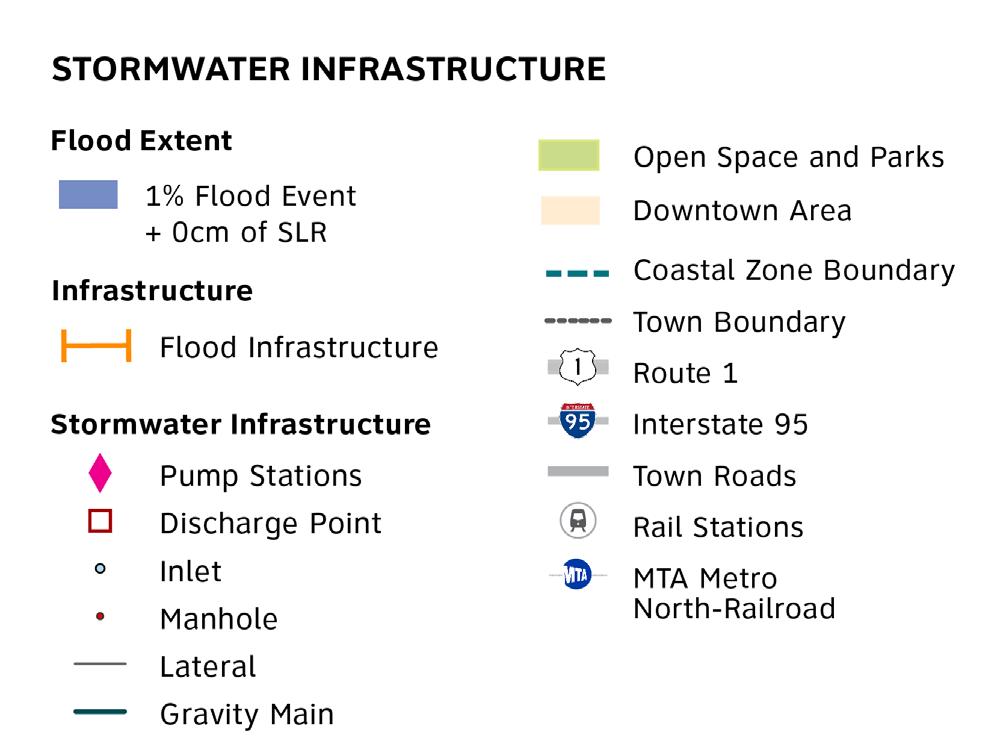
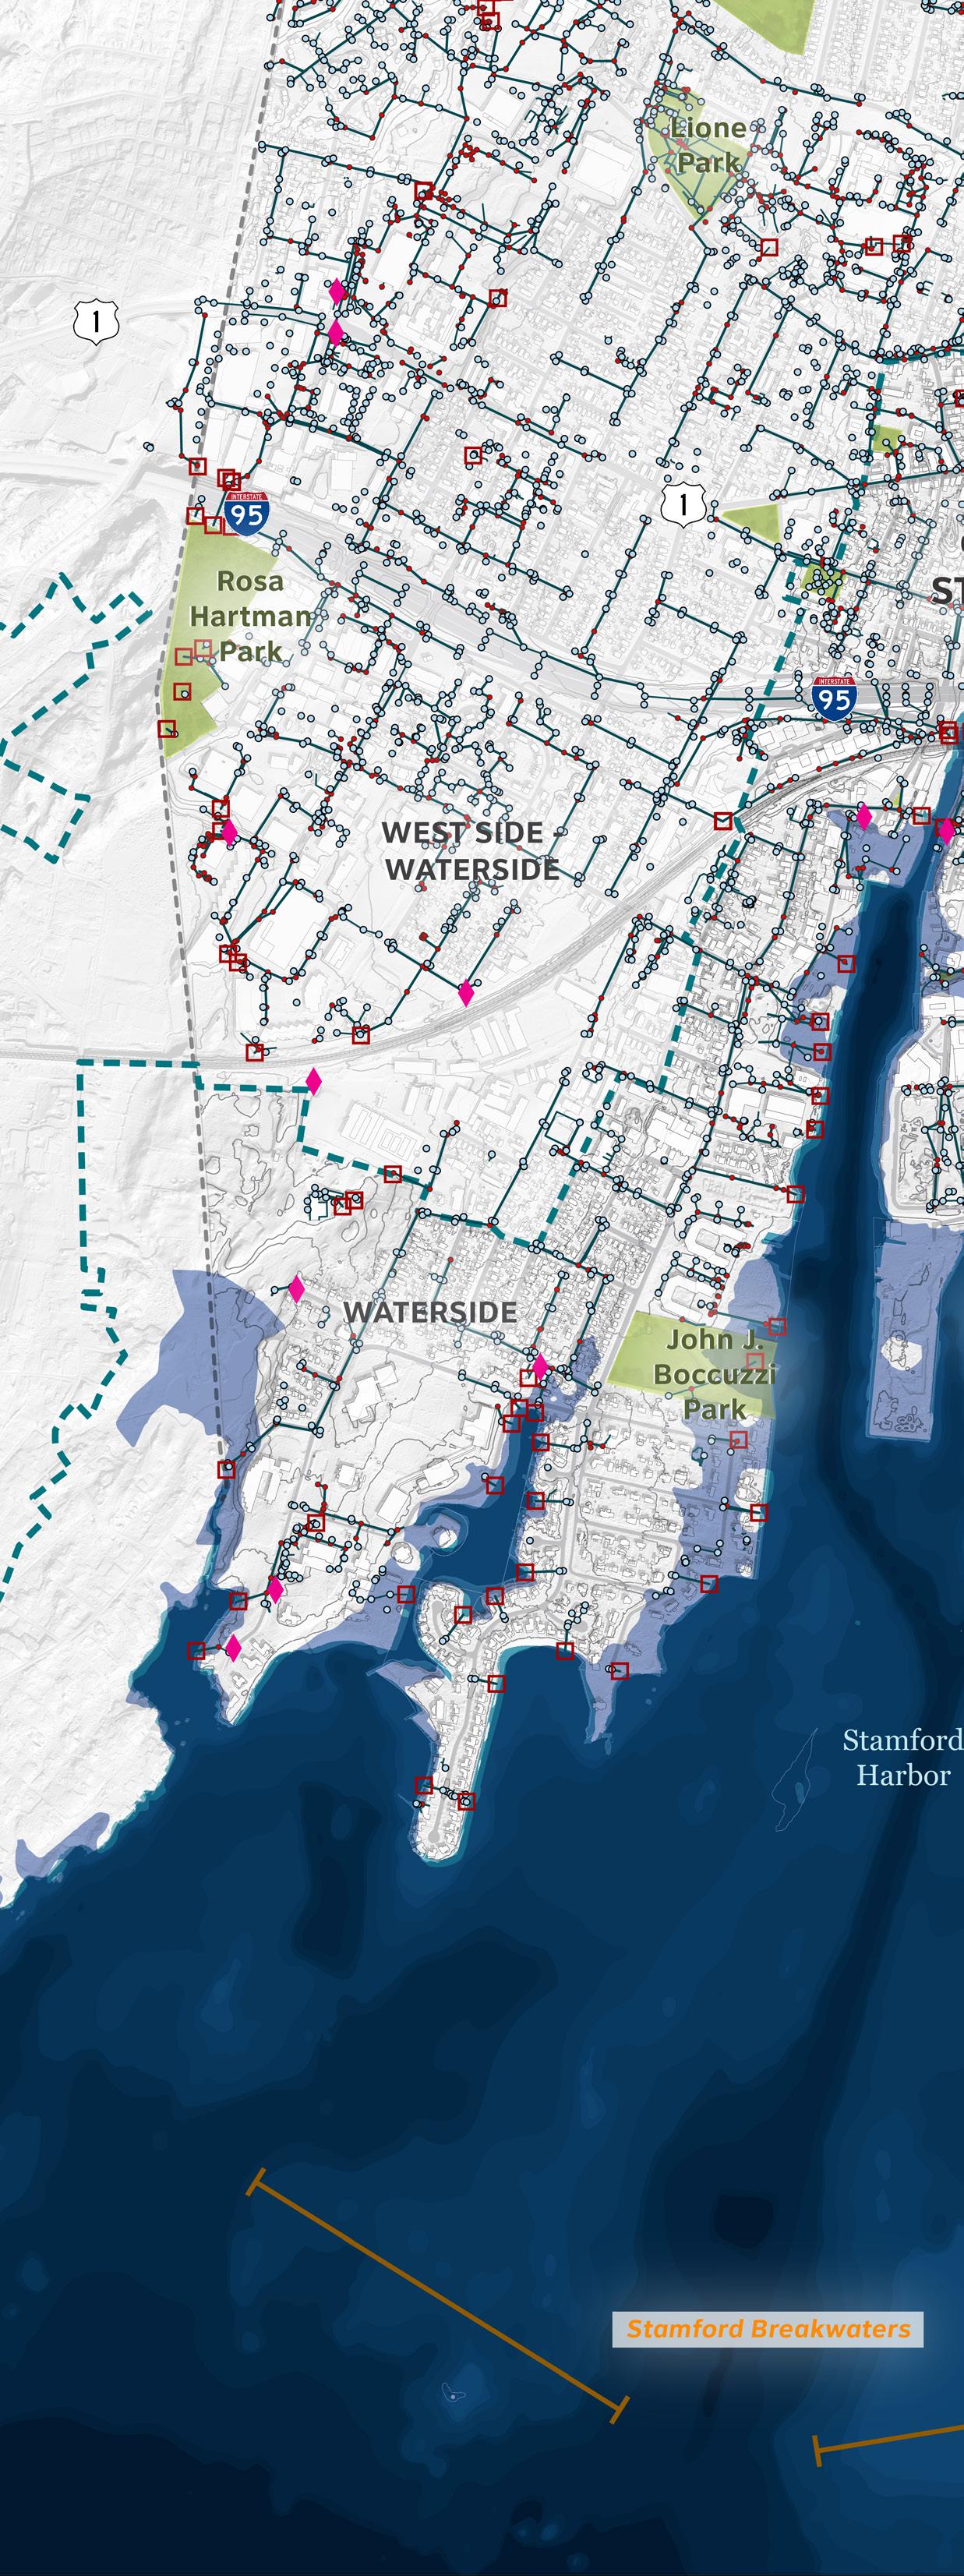
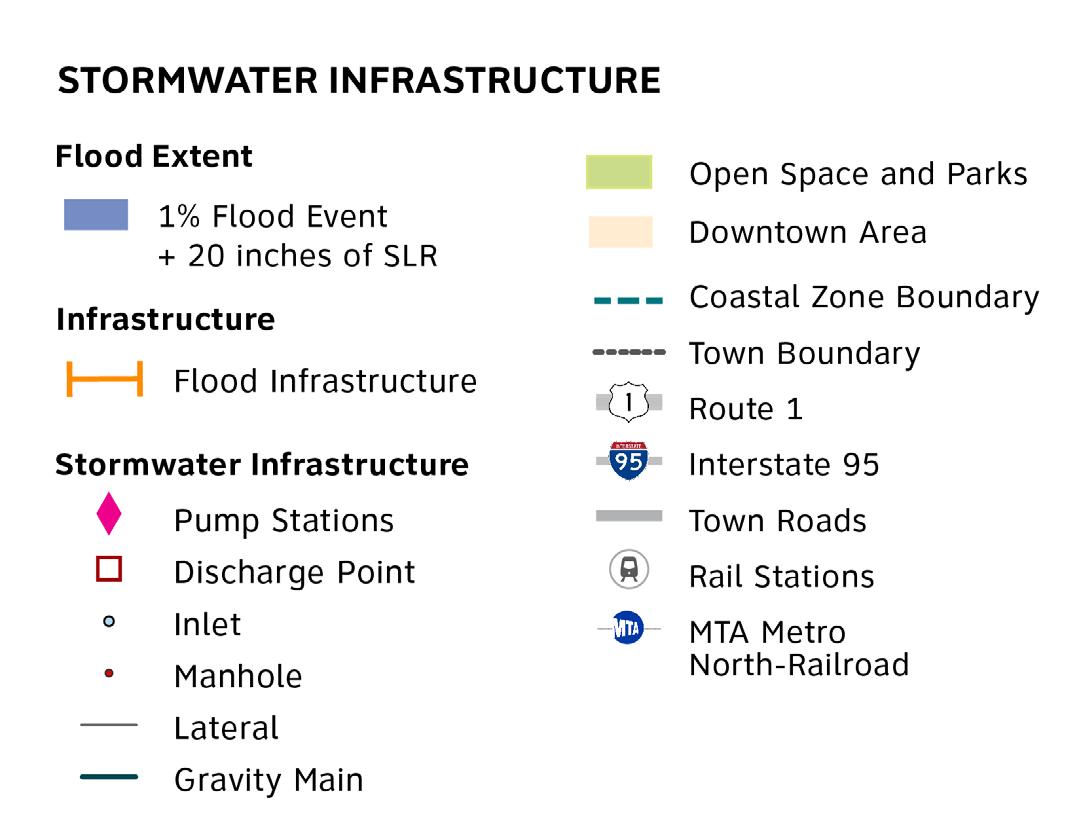
Stamford’s Water Pollution Control Authority operates and maintains four hurricane stormwater pump stations, approximately 25 miles of public sanitary sewer lines, and 23 sanitary sewer pump stations where it is not possible for sewage to be conveyed by gravity. During storms, the pump stations associated with the Hurricane Storm Surge Barrier allow the barrier to pump water from Harbor Point and the South End to the Long Island Sound. Many of these aging pump stations are vulnerable due to their condition and placement in areas expected to flood.
Within the project area, the Wastewater Treatment Plant is especially vulnerability to coastal flooding. This facility is designed to treat an average of 24 million gallons of Stamford’s and Darien’s wastewater before discharging clean water into the East Branch of Stamford Harbor. The Stamford Hurricane Barrier effectively reduces flood risks to this facility at present and in near-term future SLR scenarios, but the extent of the projected 1% AEP storm with 40 in SLR is expected to bring flood waters to the front and sides of this facility along Pumping Station Road. Impacts to this plant or the adjacent Transfer Station could lead to additional public health risks to the surrounding region.
Stormwater outfalls line both sides of the Mill River and Stamford Harbor. During storms, these discharge points can backflood unless they are adapted with backflow prevention devices (e.g., check valves). Similarly, coastal flooding can reduce the conveyance capacity of storm drainage systems and combined sewers, and SLR can raise the groundwater table, further reducing the drainage system capacity.
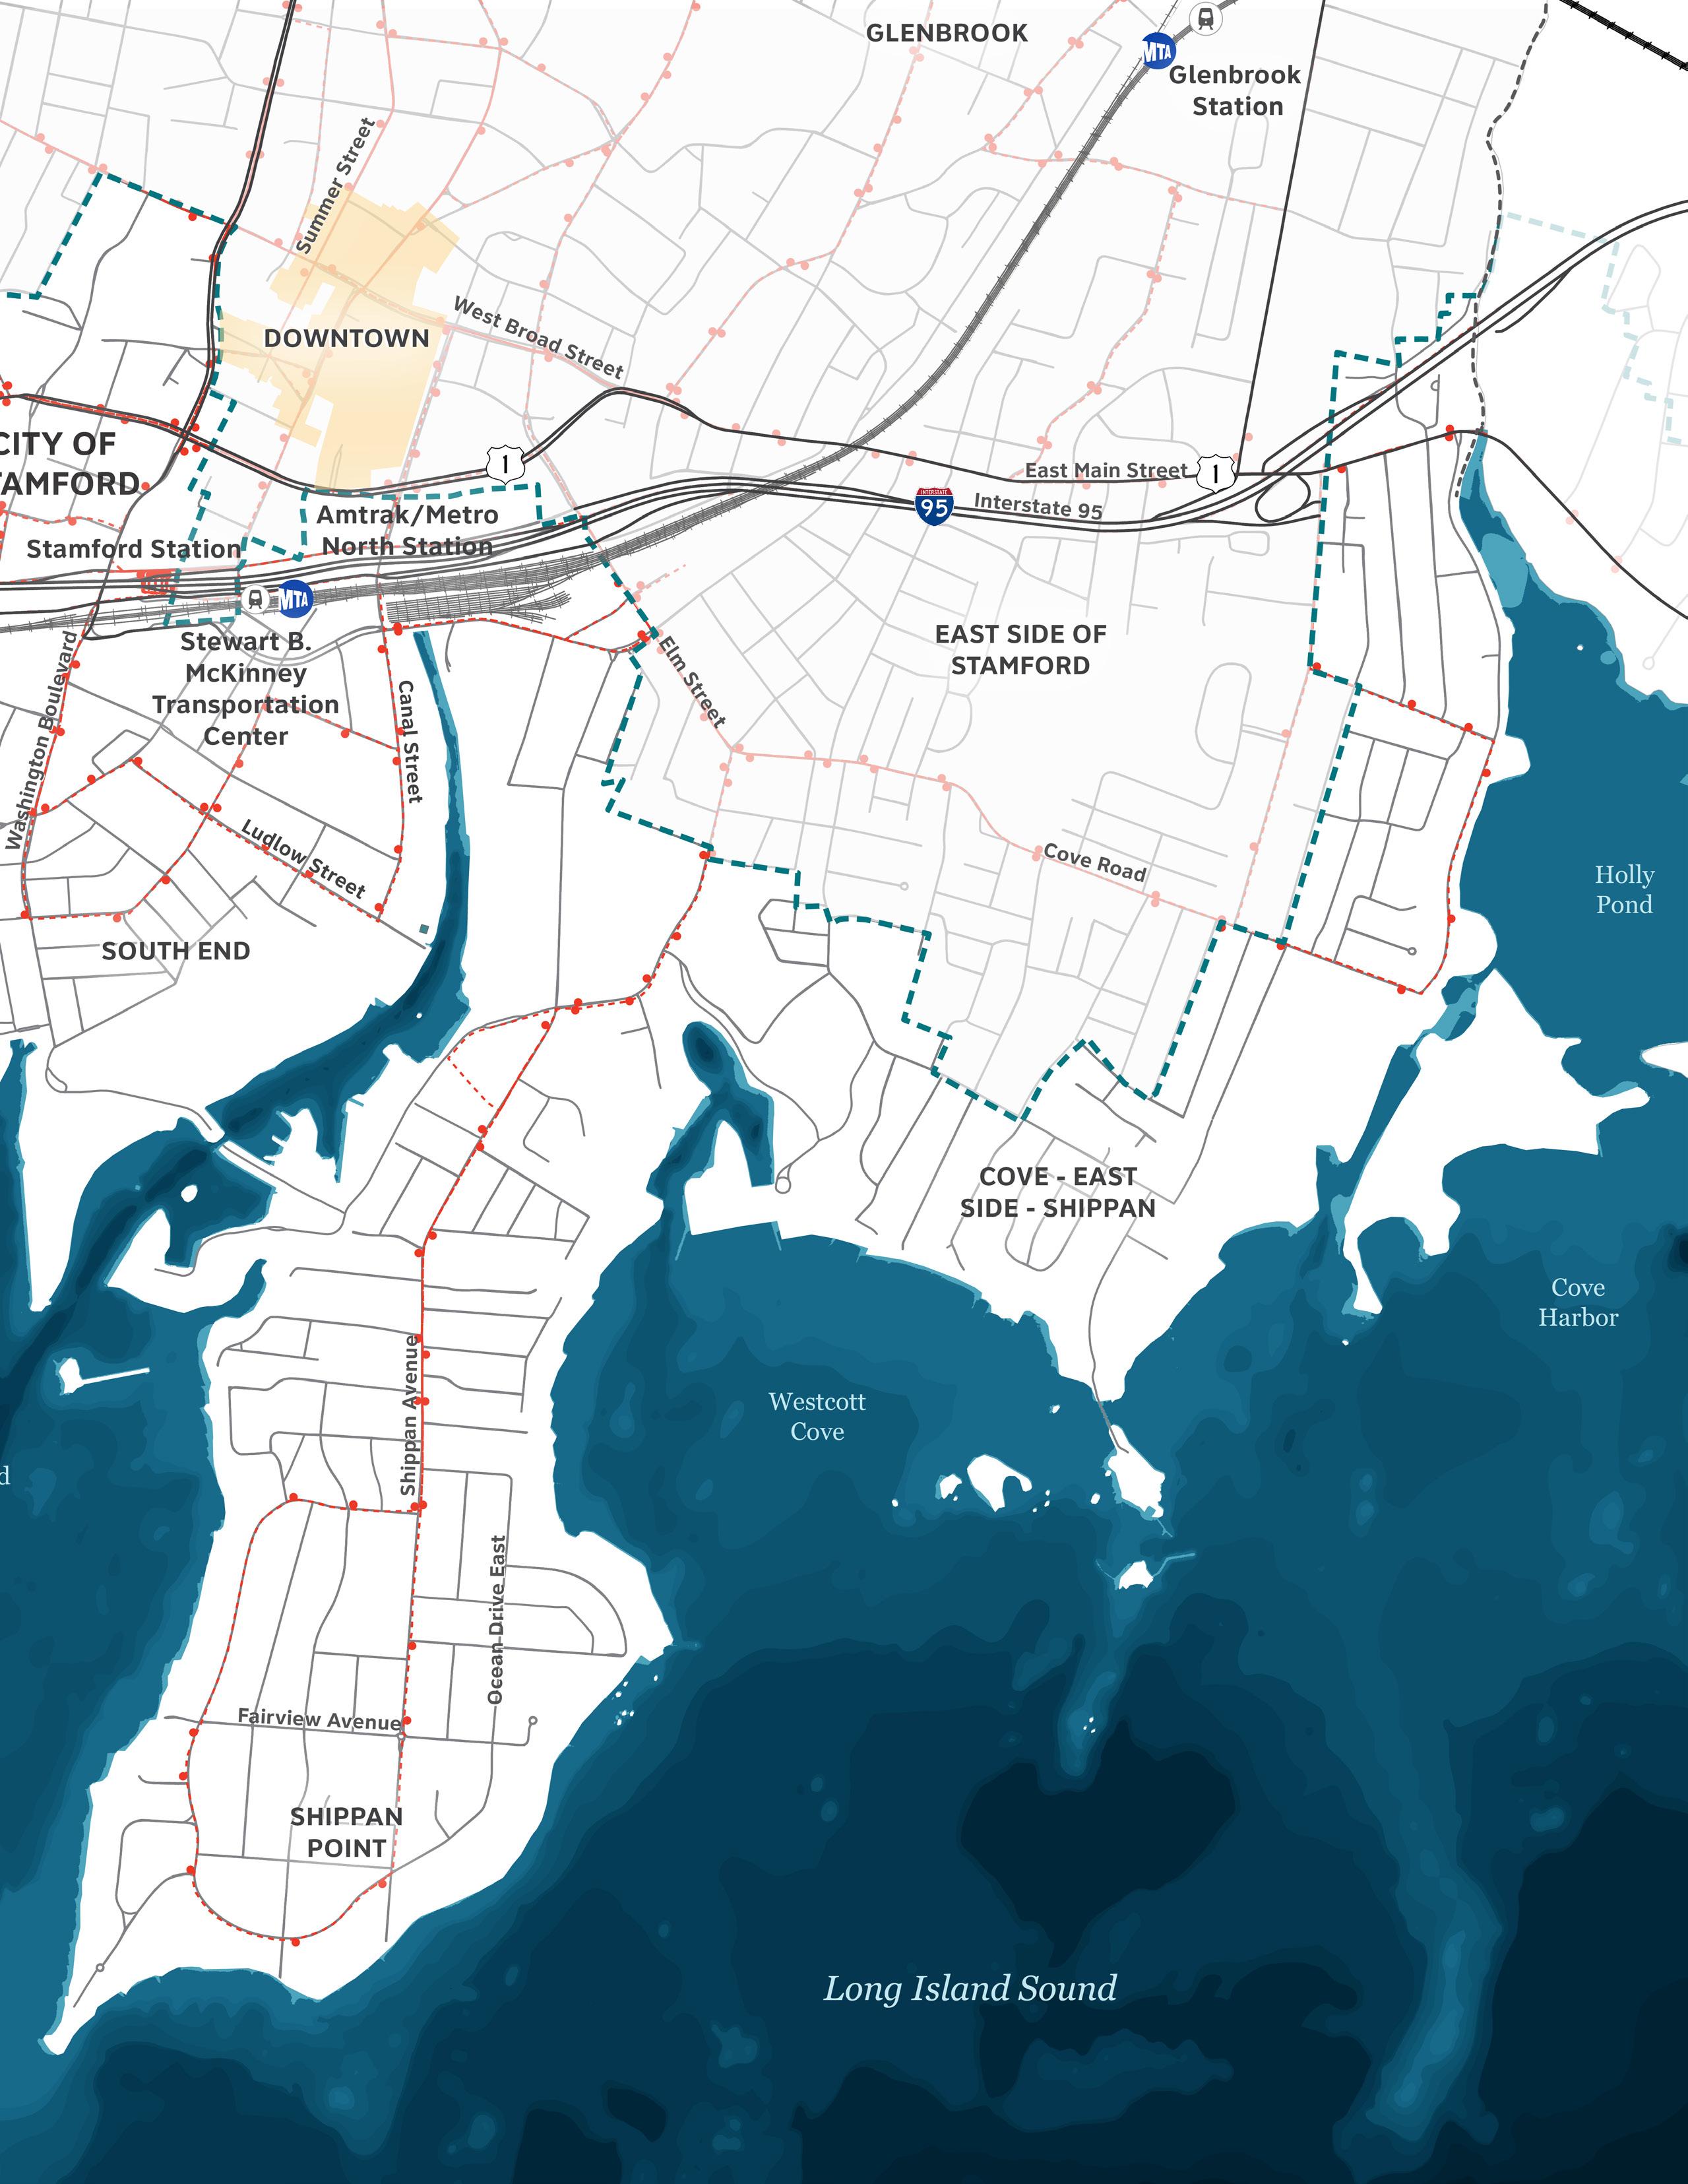
Stamford is Southwest Connecticut’s largest transportation hub, with numerous transportation modes meeting downtown. The Metropolitan Transit Authority (MTA), Amtrak, CT Rail, and CT Transit offer transit services that meet at the Stamford Station and adjacent McKinney Transportation Center, just south of I-95.
Stamford is the second-busiest station on the MTA Metro North commuter railroad and serves as a major transfer point for local trains. The flood extents of the 1% AEP storm + 20 in SLR are projected to come close to the MTA Stamford station and inundate the train yard/layover facility to its east. In addition to cutting off MTA and Amtrak regional travel routes, this flooding may affect rail maintenance equipment and/ or release pollutants housed on the ground floor or below grade at the rail yard.
The 1% AEP + 20 in SLR flood is expected to affect major local roads such as Ludlow Street and Shippan Avenue to the point where bus transit service to Shippan’s Point and throughout the South End will become impossible during storms of this magnitude.
Past public engagement sessions have identified local road networks as a vulnerability of high concern to residents , with a particular emphasis on roads used to access coastal properties, low-lying underpasses, and streets in commercial districts.
Interstate 95 (I-95) is not directly affected by coastal storms under any of the modeled storm scenarios, with the highway flyover elevating the road over potential sources of coastal flooding within the vicinity of Stamford Harbor.
During the present-day 1% AEP storm, flooding primarily affects local roads, parking lots, and structures falling within residential, commercial, and industrial zones. Of these, the majority are situated in the South End and East Side neighborhoods to the west and north of Stamford Harbor’s east branch. Some low-lying road segments in the Cove and Waterside are also affected, hampering bus transit service and local access. Few community assets, including critical municipal infrastructure, are directly inundated in an event of this magnitude.
As the flood extent associated with a 1% storm increases, the variety of assets at risk broadens. Under a 1% AEP storm with 20 inches of SLR, numerous municipal critical infrastructure locations would be at risk of property damage or operational loss, such as the Stamford Solid Wastewater treatment plant and the Stamford Transfer Station. Mixed-use and commercial development throughout the South End peninsula, surrounded by Stamford Harbor, may have their operations affected by this flood scenario. While the MTA Transportation facility falls outside of the 1% AEP + 20 in SLR flood extent, its associated right-of-way is vulnerable to flooding.
CIRCA modeling indicates that the Stamford Hurricane Barrier fails to significantly reduce flooding at the 1% AEP level with 40 inches of sea level rise. As a result, travel to/from the South End and Harbor Point, or from Shippan’s Point to the rest of the city, becomes impossible. New community facilities and multi-family residential structures are now subject to flooding in the South End, East Side, and in the area just northeast of the hurricane barrier gates. With access to I-95 and MTA services impaired, evacuation routes and other regional transportation opportunities become impractical options for residents.
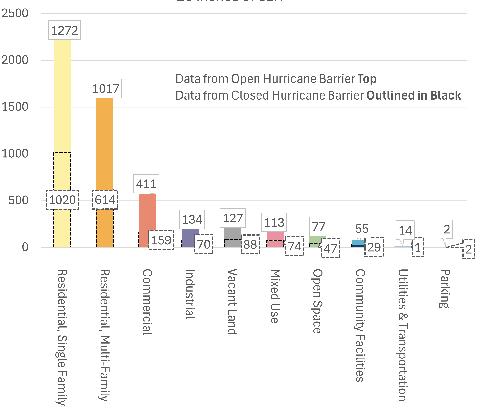
The effects of sea level rise become especially apparent in a comparison of assets affected by the 1% storm extent at different time horizons. As these data demonstrate, residential and commercial buildings are especially sensitive to SLR, with large increases in both relative and absolute terms of structures inundated by future storms of this magnitude.
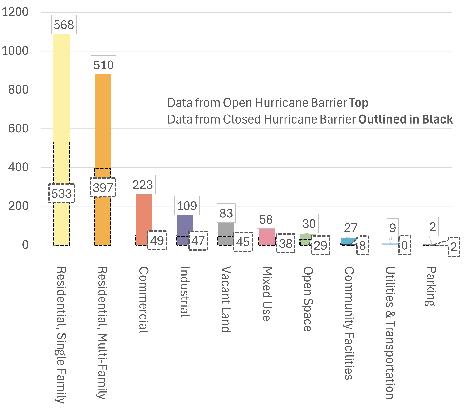
Buildings (by Land Use) at Risk from 1% AEP Flood + 20 Inches of SLR
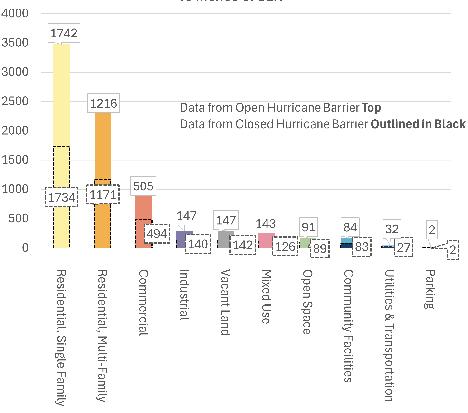
Buildings (by Land Use) at Risk from 1% AEP Flood + 40 Inches of SLR
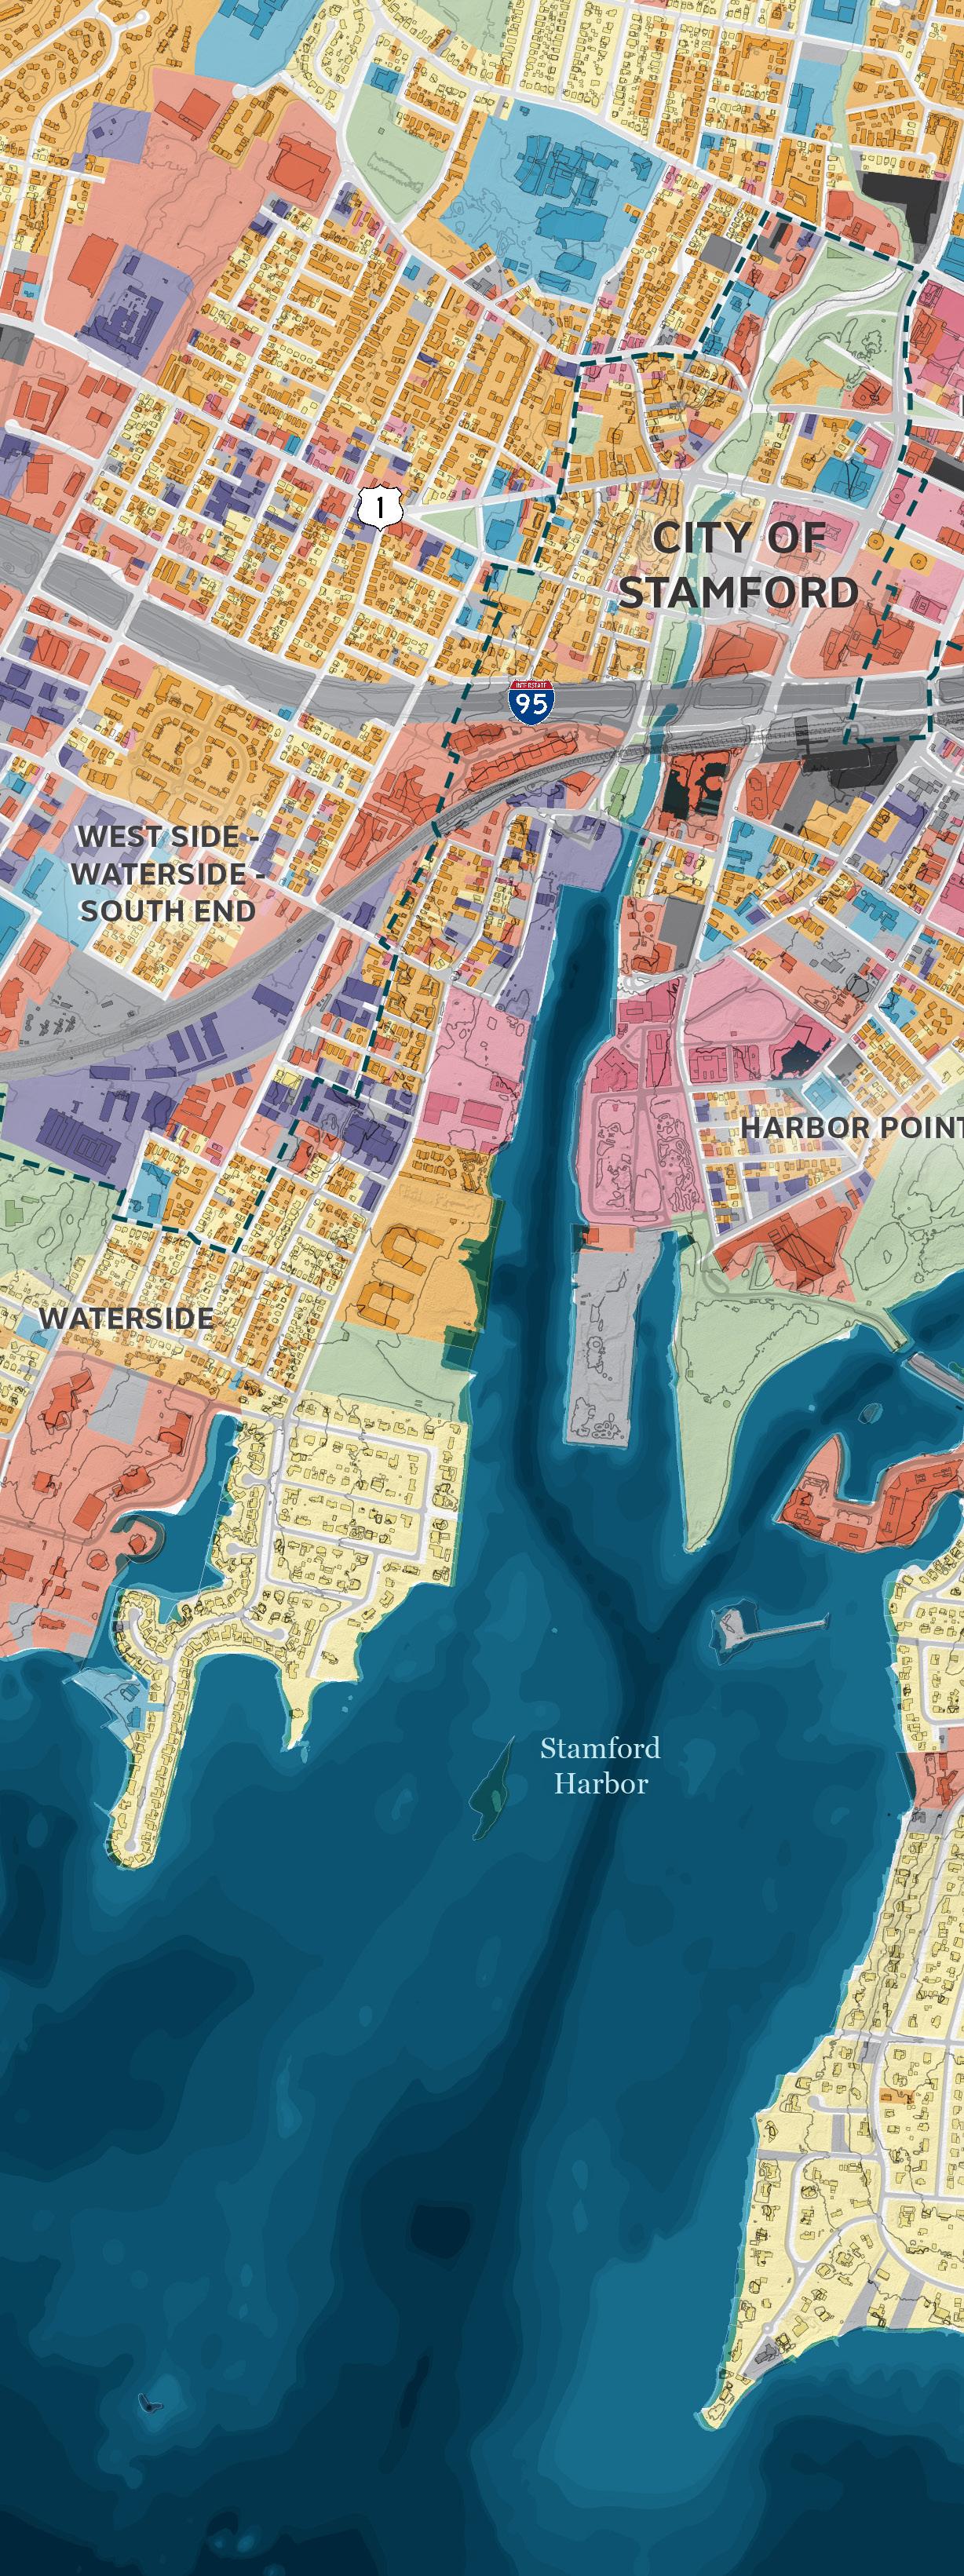
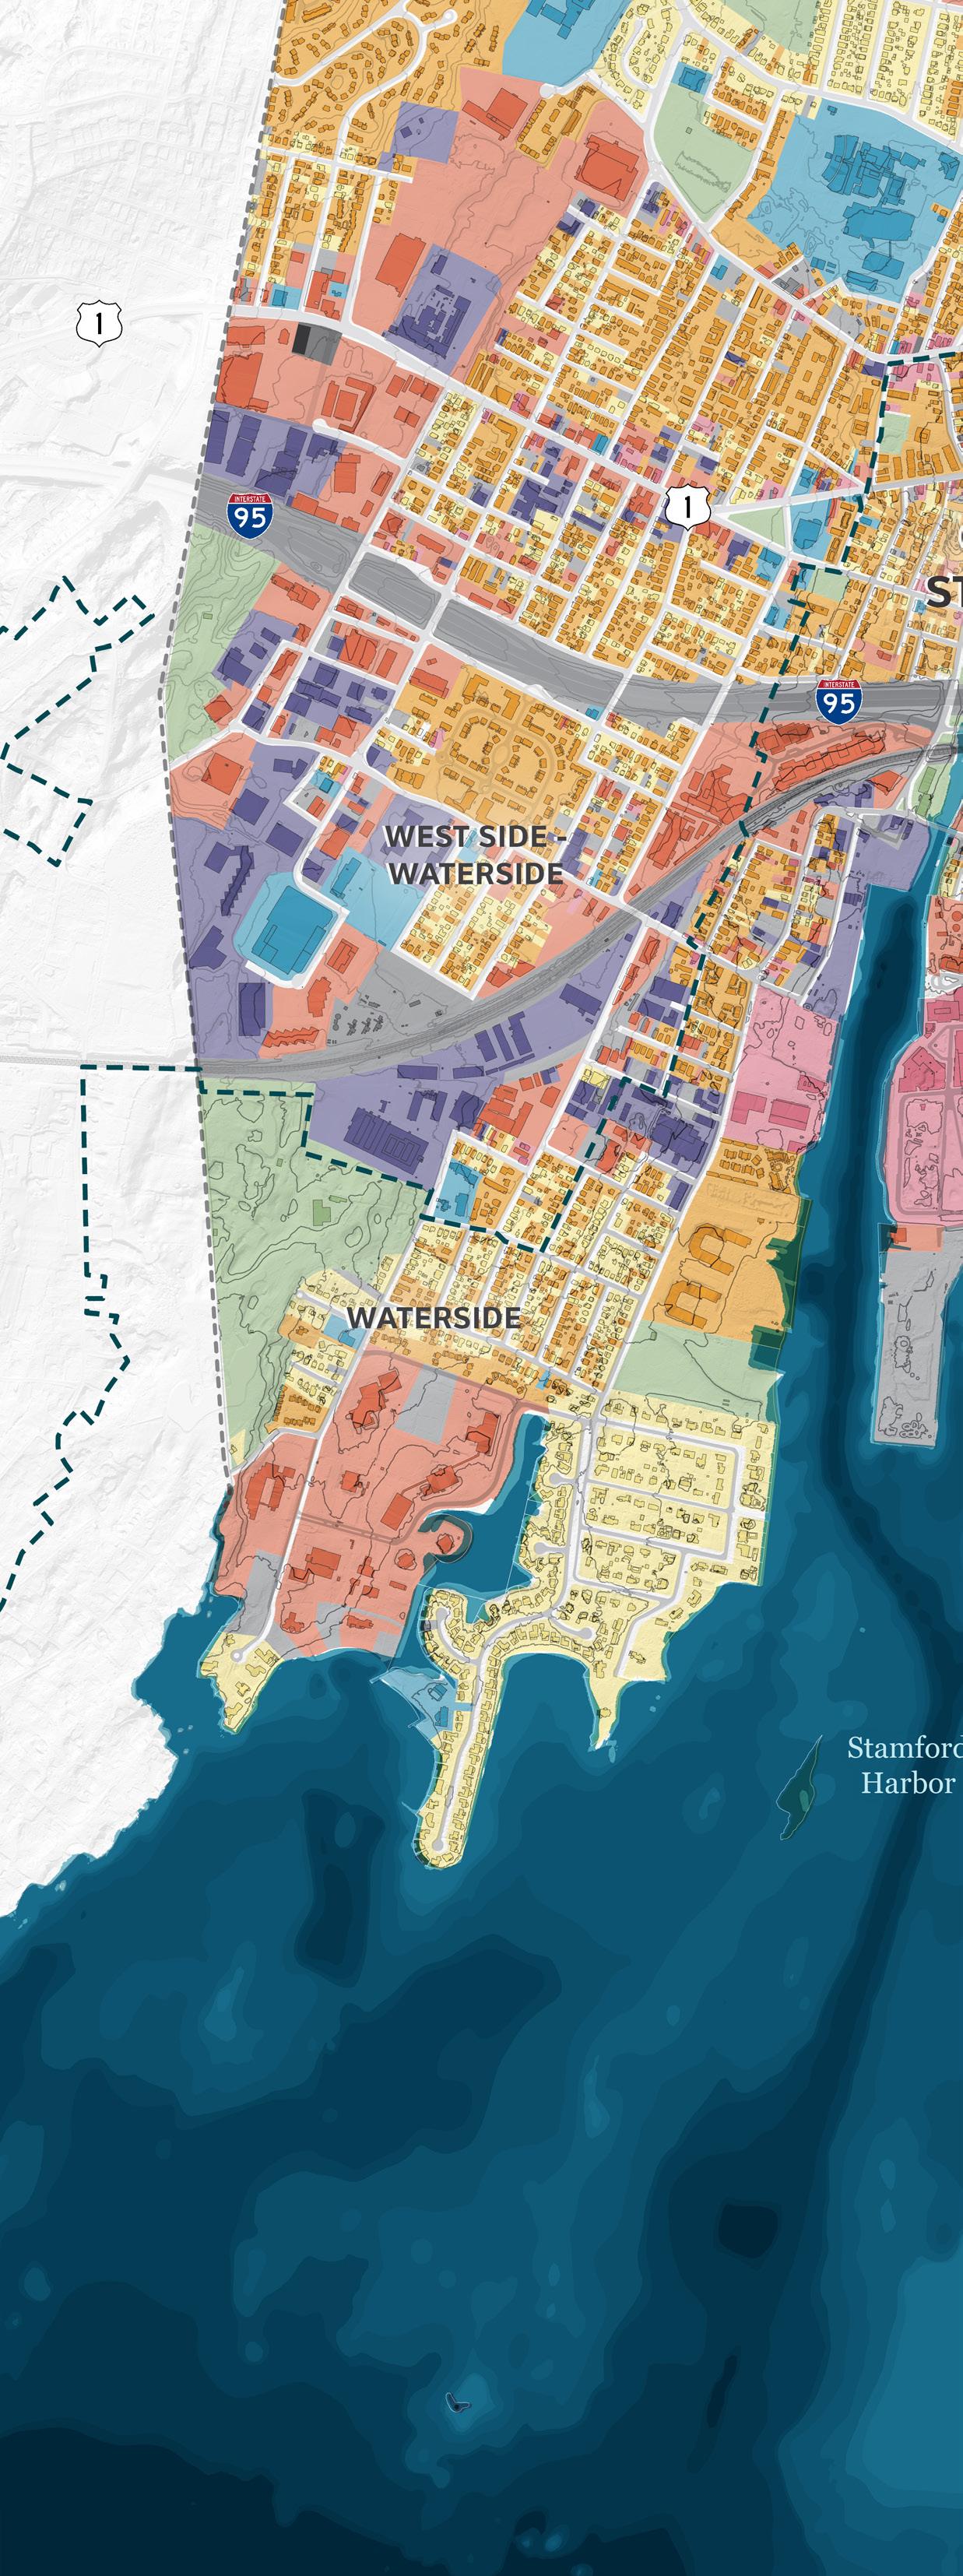
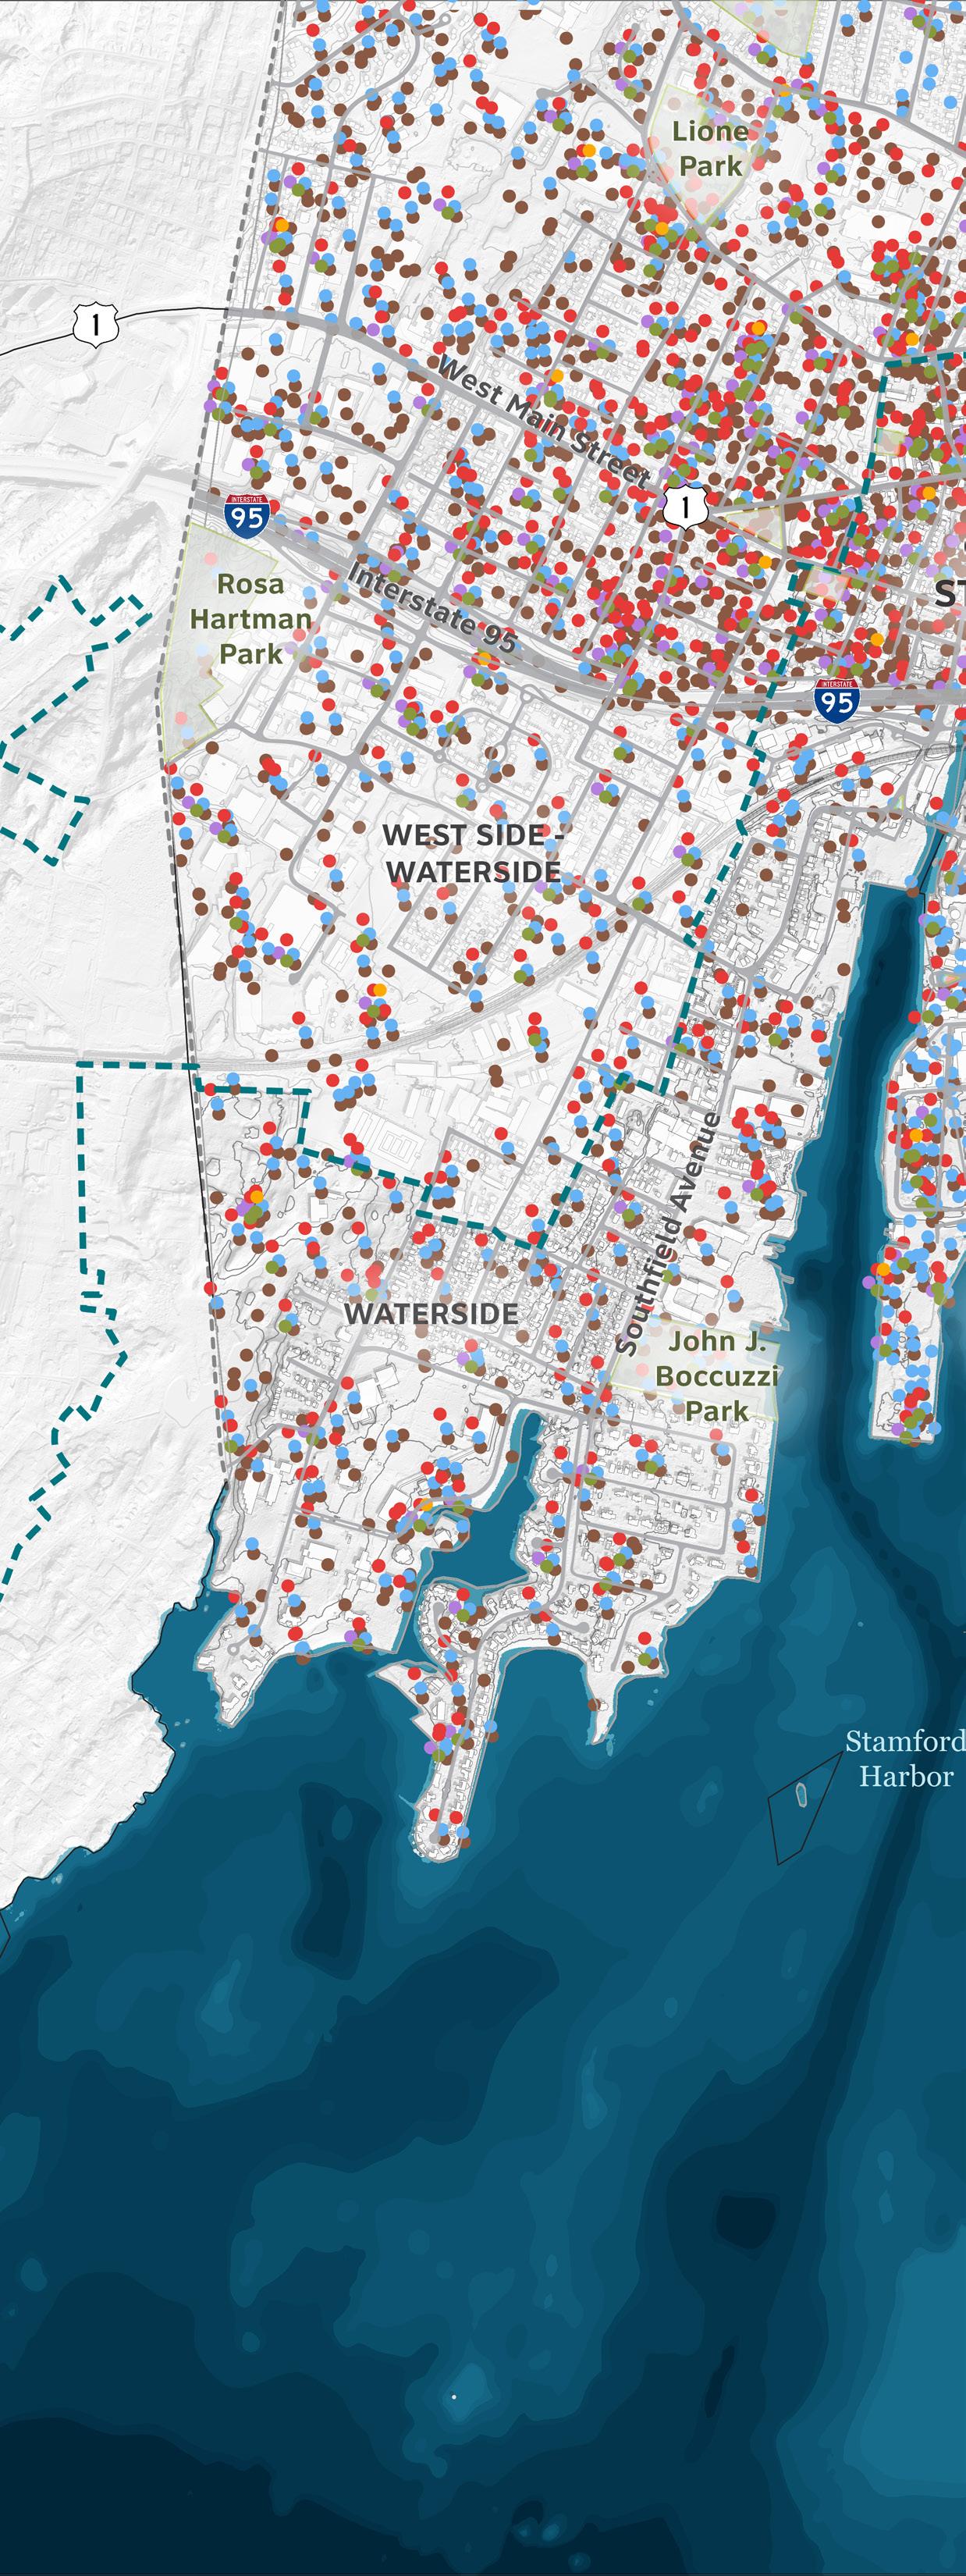
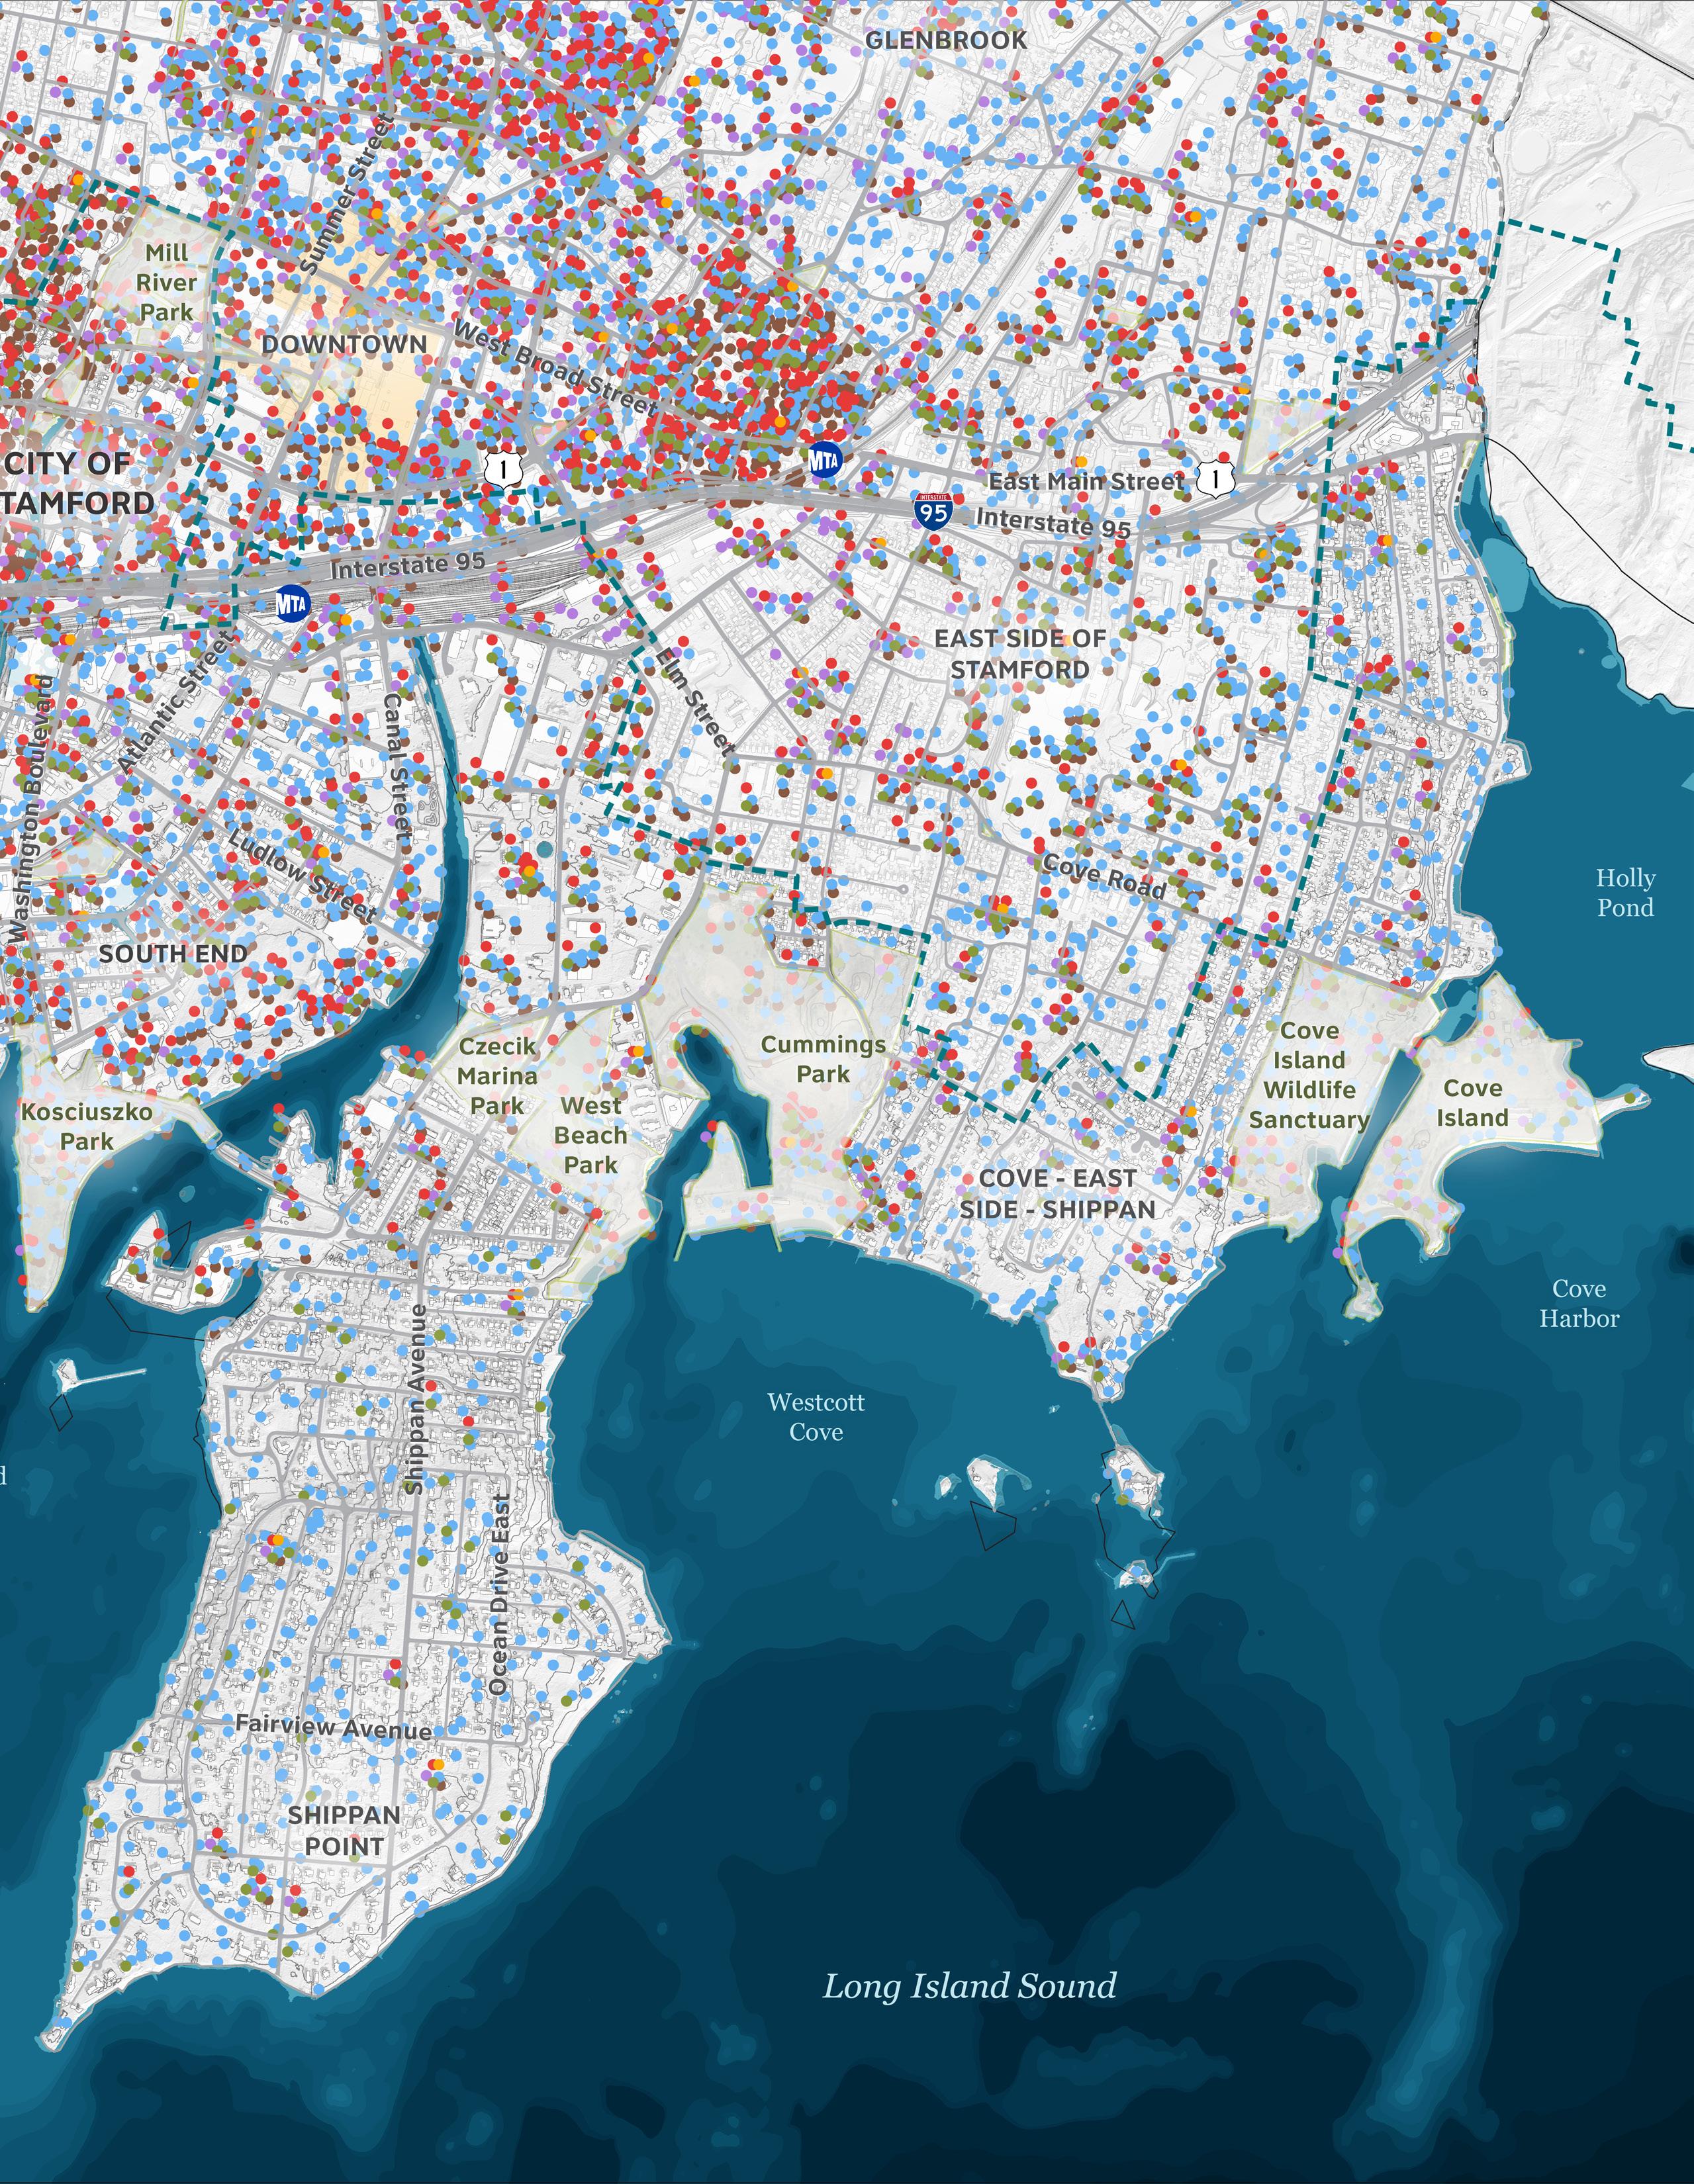
Population density is highest in downtown Stamford and in the West Side neighborhood, directly to the north of I-95. These areas contain most of the city’s multi-family housing and host a higher number of commuters. Supported by community development initiatives, the population of the South End has likewise grown rapidly with commercial, multi-use, and multi-family housing projects. By comparison, coastal neighborhoods such as Shippan Point and Water Side are primarily filled with single-family housing with correspondingly lower population density.
Among Stamford’s coastal neighborhoods, there are greater numbers of nonwhite residents in Waterside (20% Black and 43% Latino) and Cove-East Side (12% Black, 48% Latino). Shippan is relatively homogenous at 82% white, and South End remains mixed demographically at 46% white, 11% Black, and 34% Latino.


Vulnerability is the propensity to be adversely affected by hazards such as extreme weather due to higher degrees of exposure, sensitivity, and lack of adaptive capacity (i.e., the ability to cope or respond to a disruption when it does occur). Non-English speaking, young, elderly, homeless, or physically disabled people are more likely to need support to prepare, respond to, or recover from climate events like flooding and heat waves. Minority and elderly populations are also less likely to have equal access to financial and physical resources.
Resilient Connecticut has developed a Social Vulnerability Index (SVI) to aid in identifying populations that may be more vulnerable to the impacts of climate change, adapted from two widely used social vulnerability resources:
• University of South Carolina Social Vulnerability Index (SoVI)
• Center for Disease Control and Prevention (CDC) Social Vulnerability Index (SVI)
Social vulnerability in Stamford is highest in the West Side, Waterside, East Side, and the Cove.


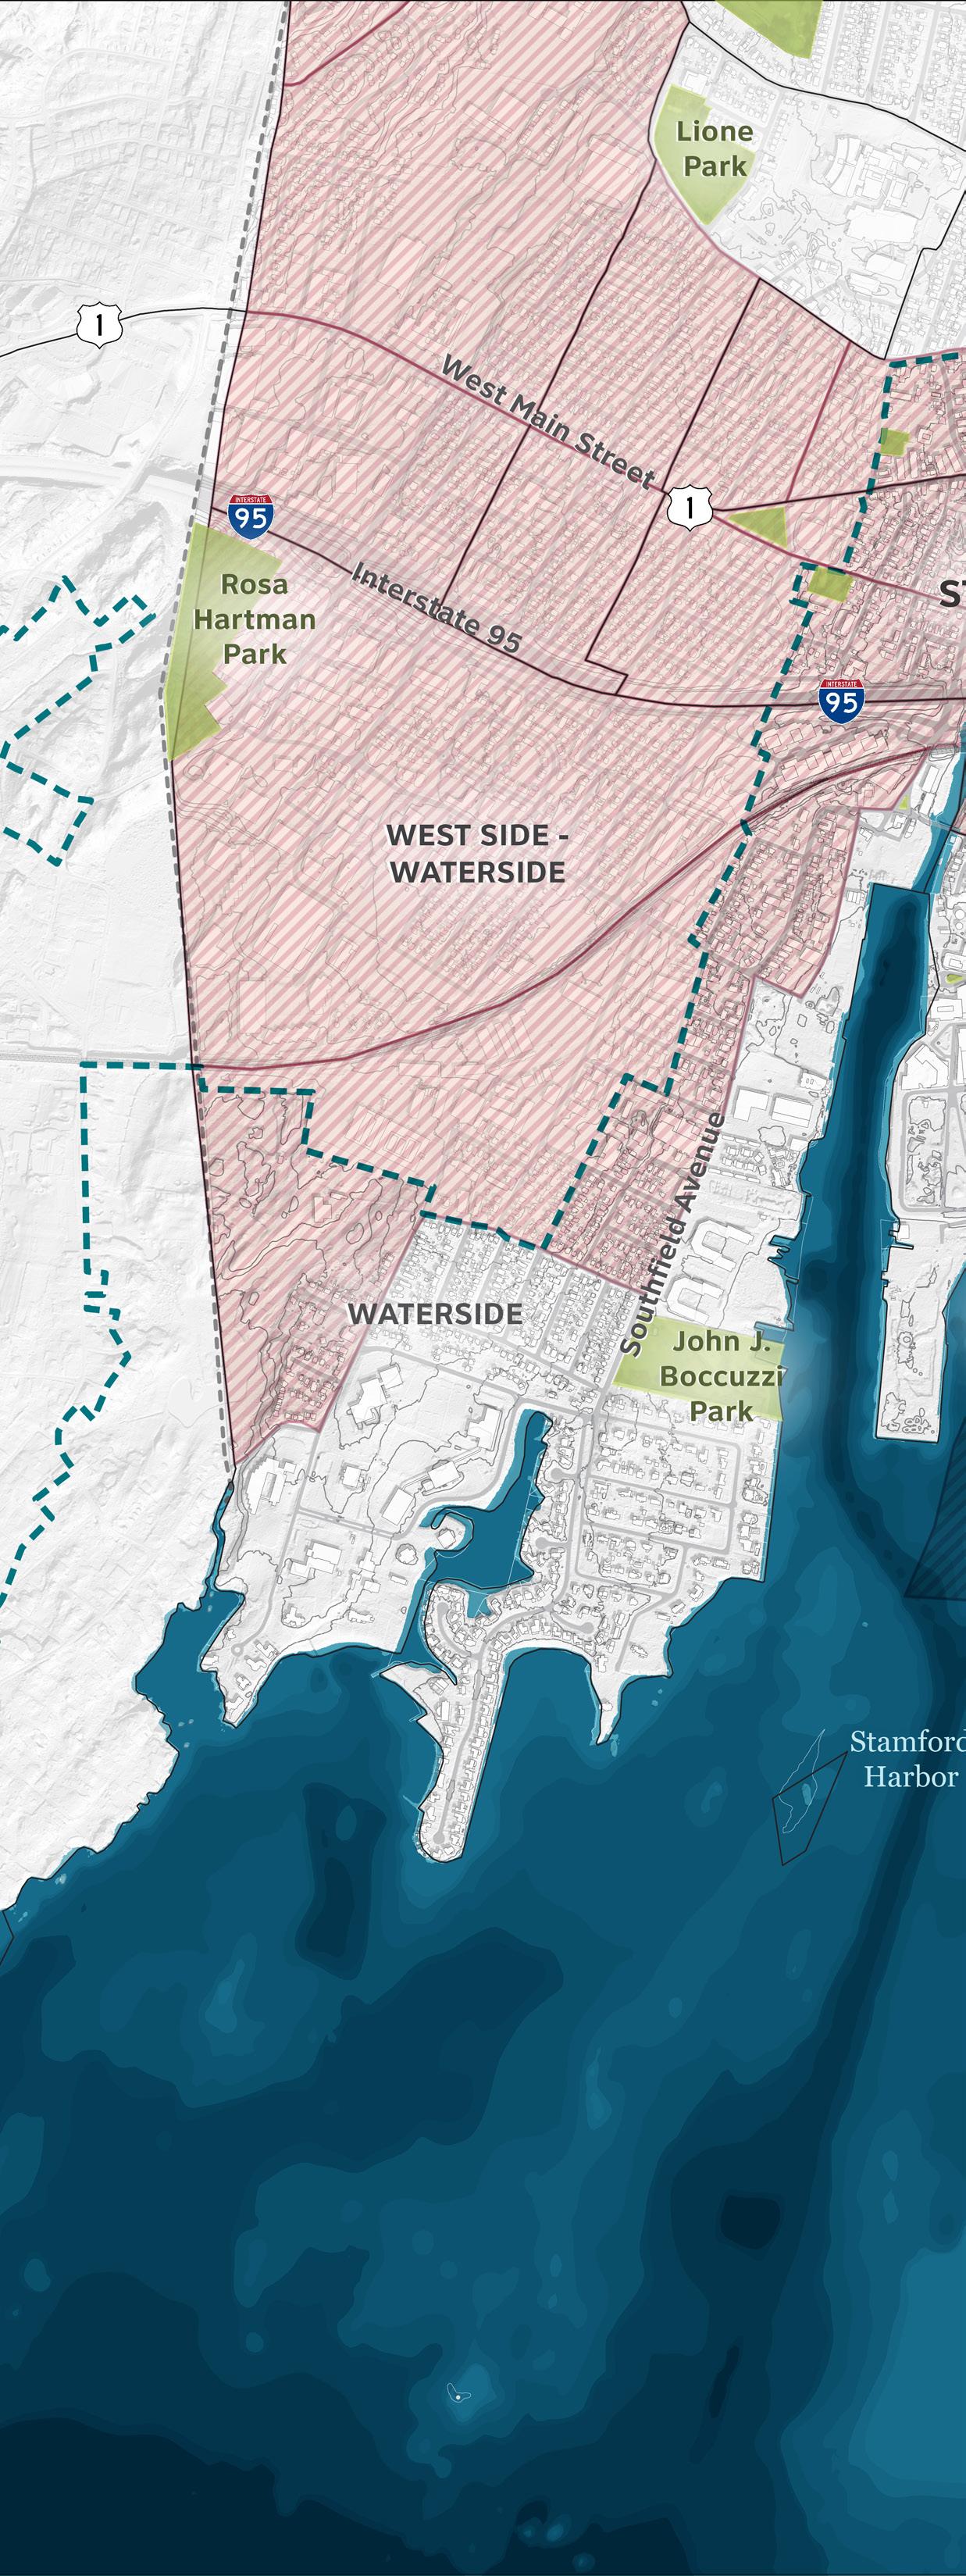
Environmental justice (EJ) is a similar composite measure of social vulnerability, with a particular emphasis on exposure to environmental harms that have been distributed unequally historically—such as air/water quality and green space access. Exposure to environmental harms can exacerbate underlying health issues, cause economic strain, or disrupt communities, making it even more challenging for certain areas to adapt to the stressors of climate change. In Stamford, census tracts designated as Environmental Justice communities broadly mirror neighborhoods indicated as Socially Vulnerable, with EJ census tracts particularly widespread in Harbor Point, West Side, Waterside, and East Side.

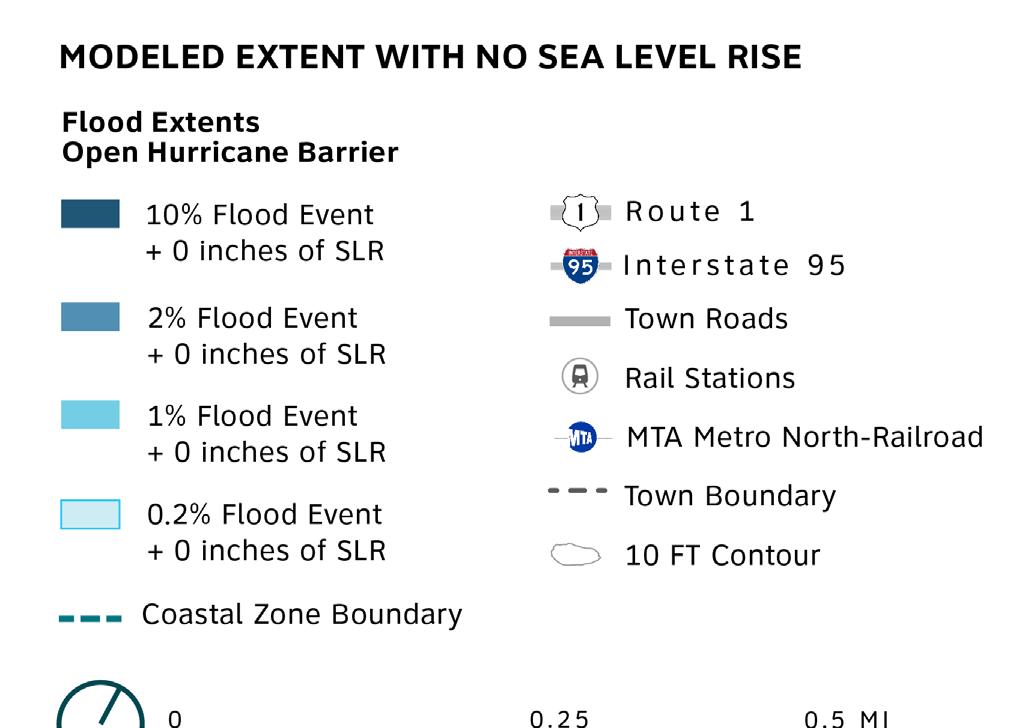

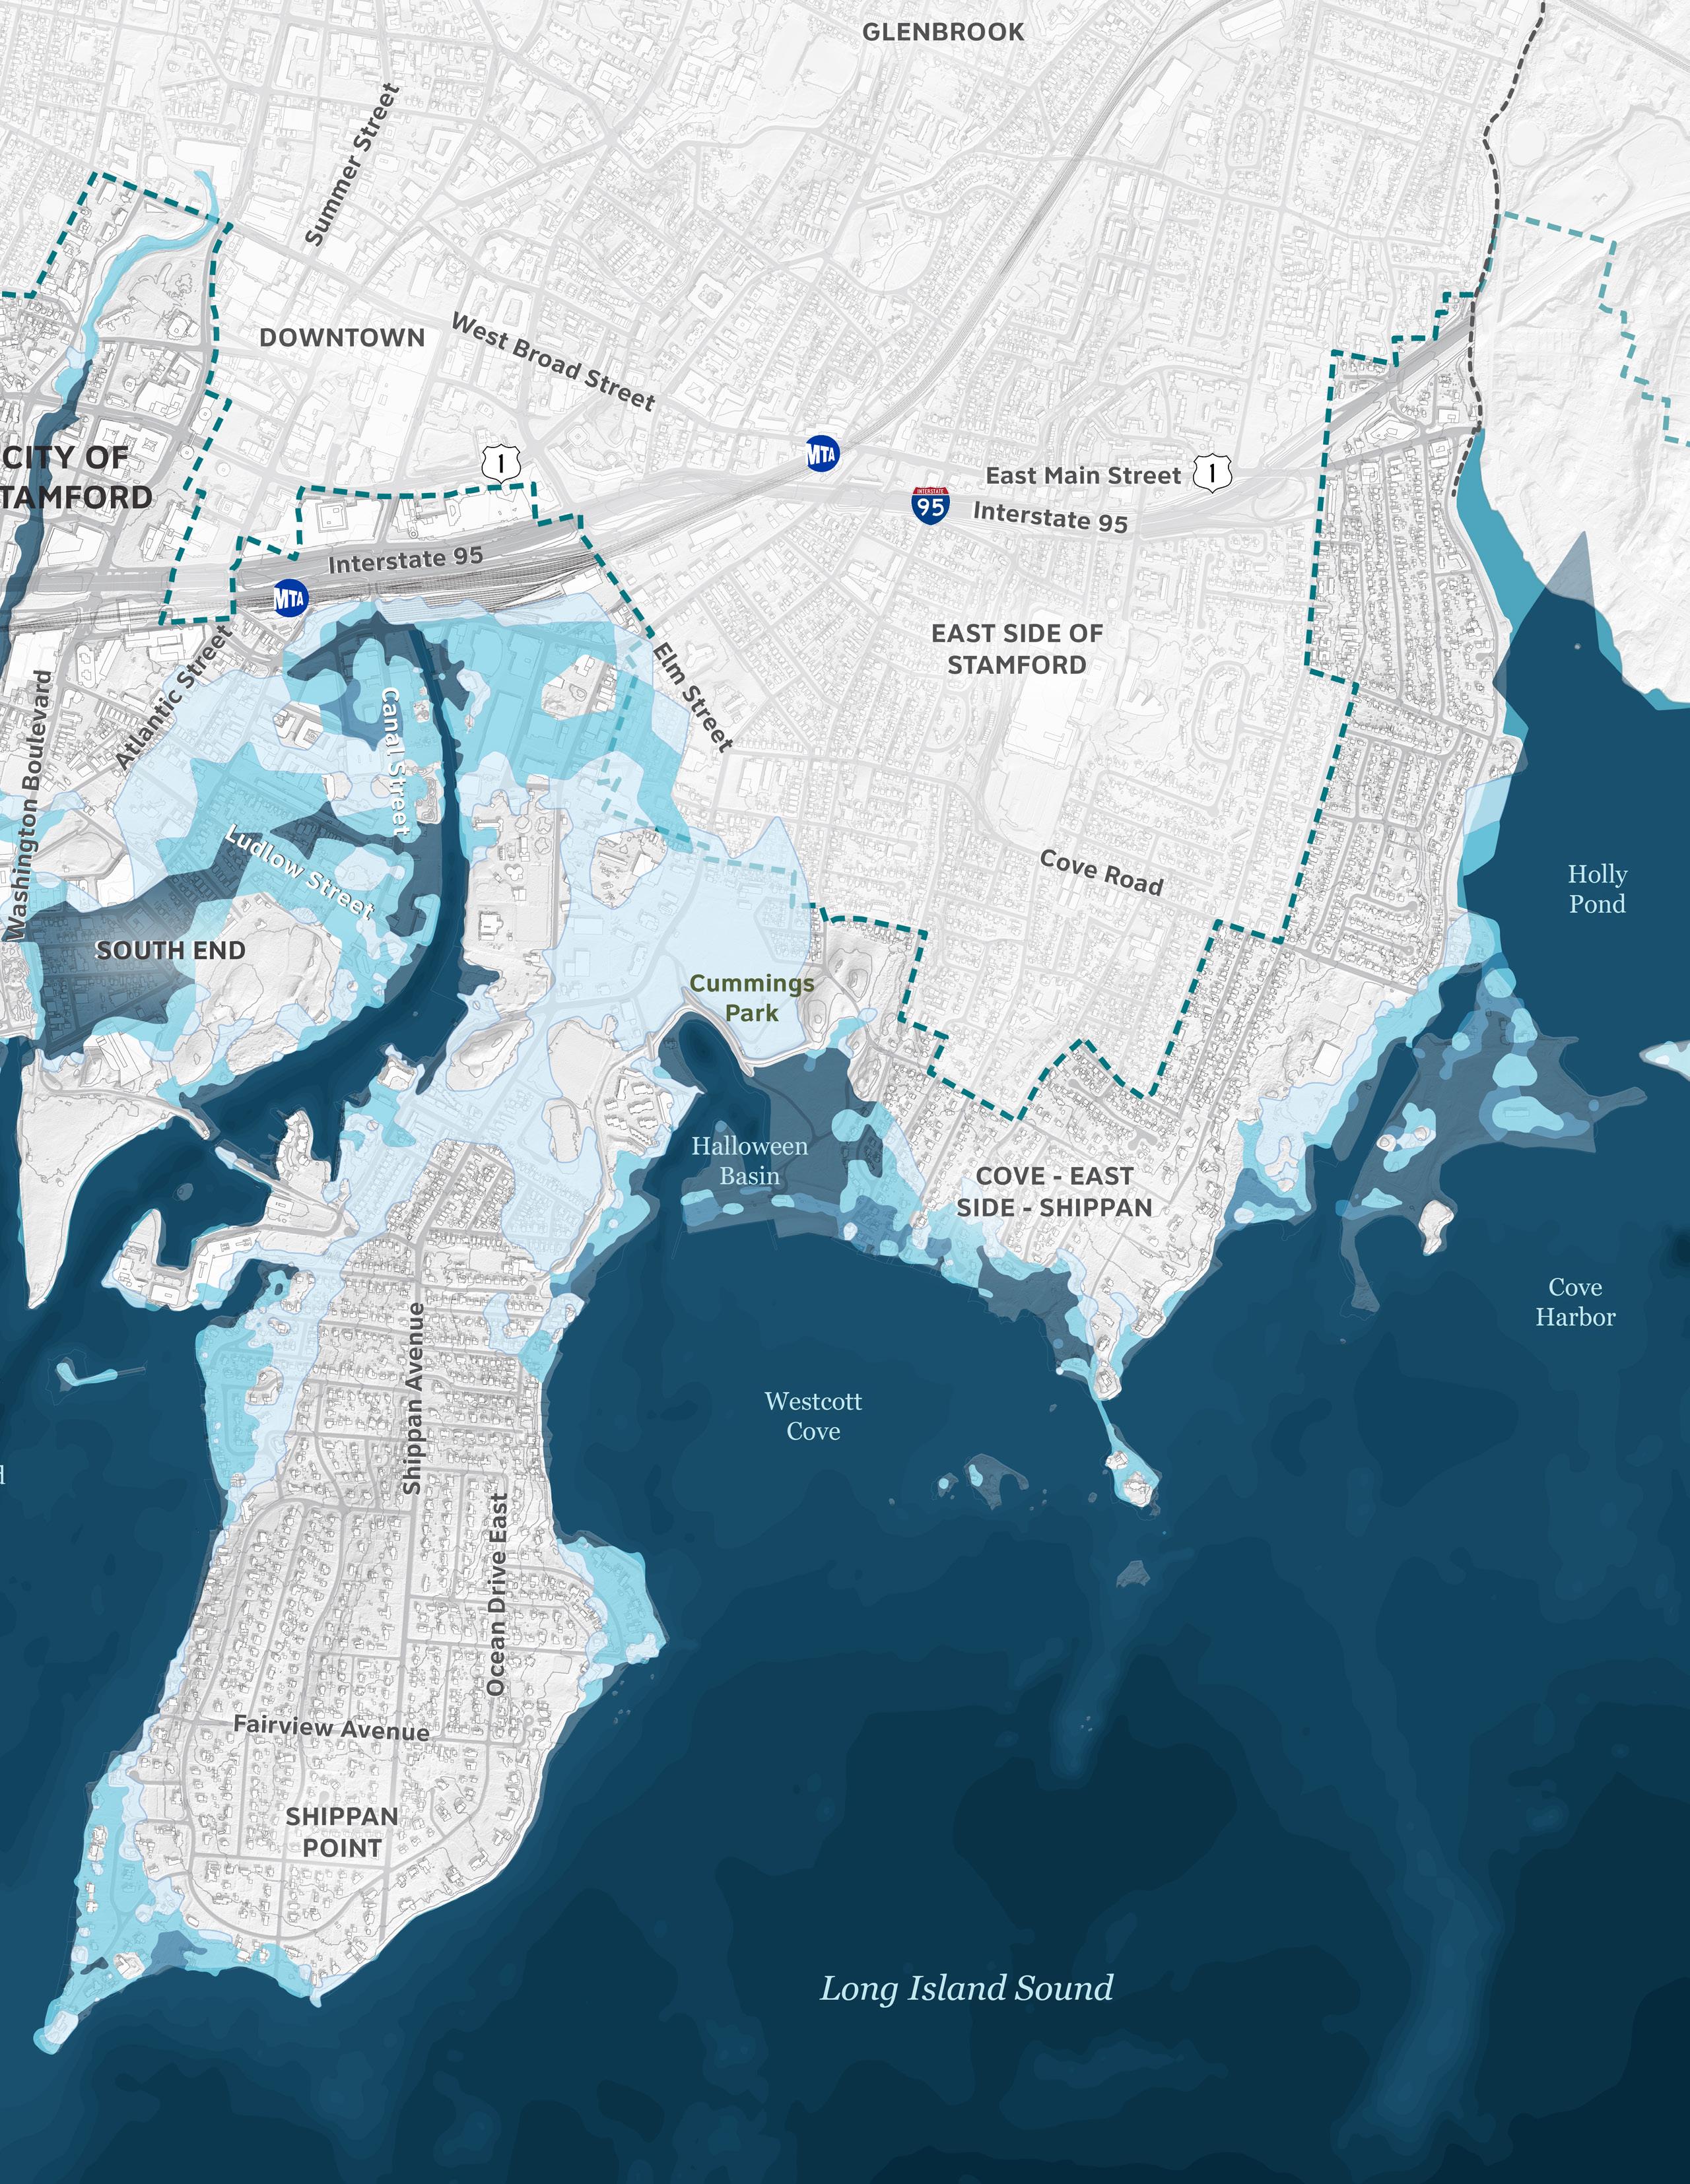
(Open Hurricane Barrier)
(Open Hurricane Barrier)
40 inches of SLR