


SELECT BOARD MEETING 03/06/2023
COASTALVULNERABILITY ACTION
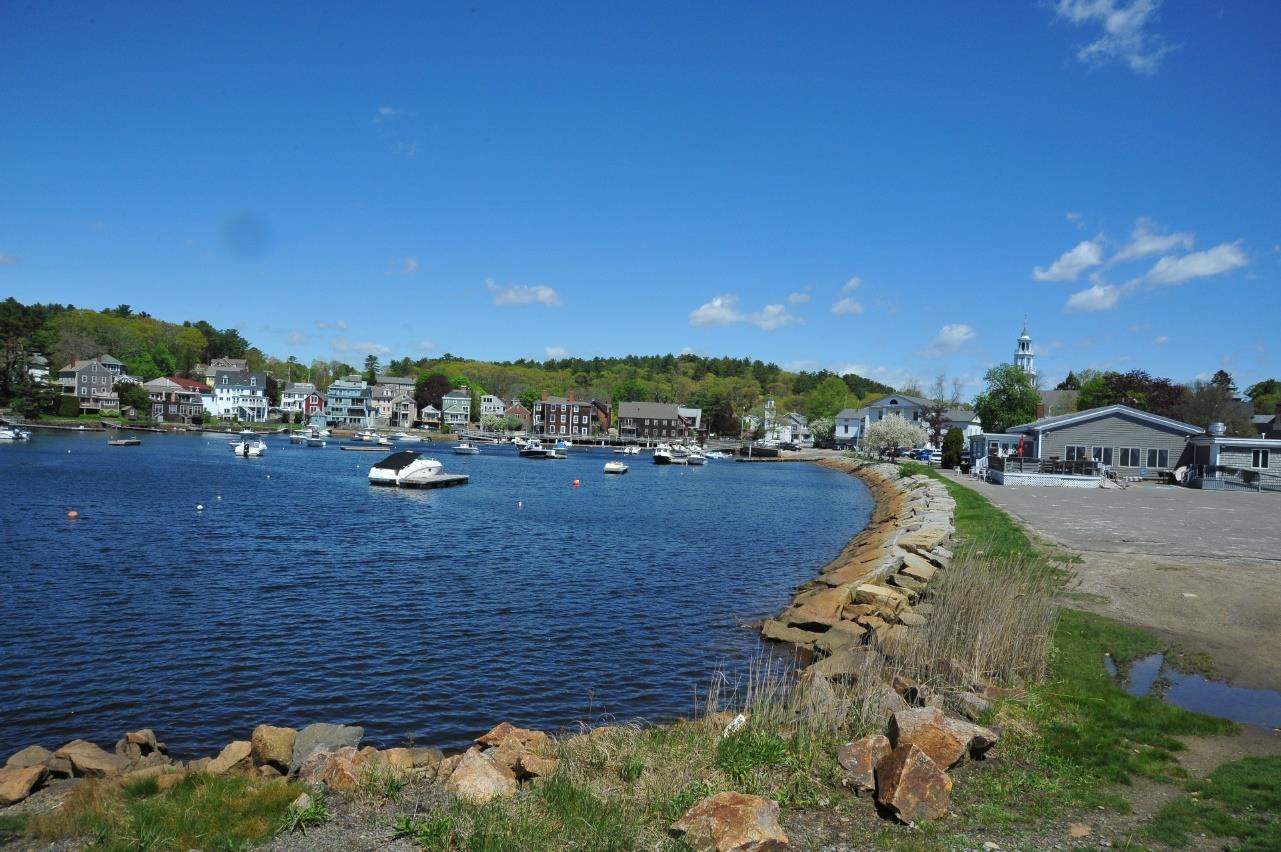
MANCHESTER-BY-THE-SEA |
PLAN

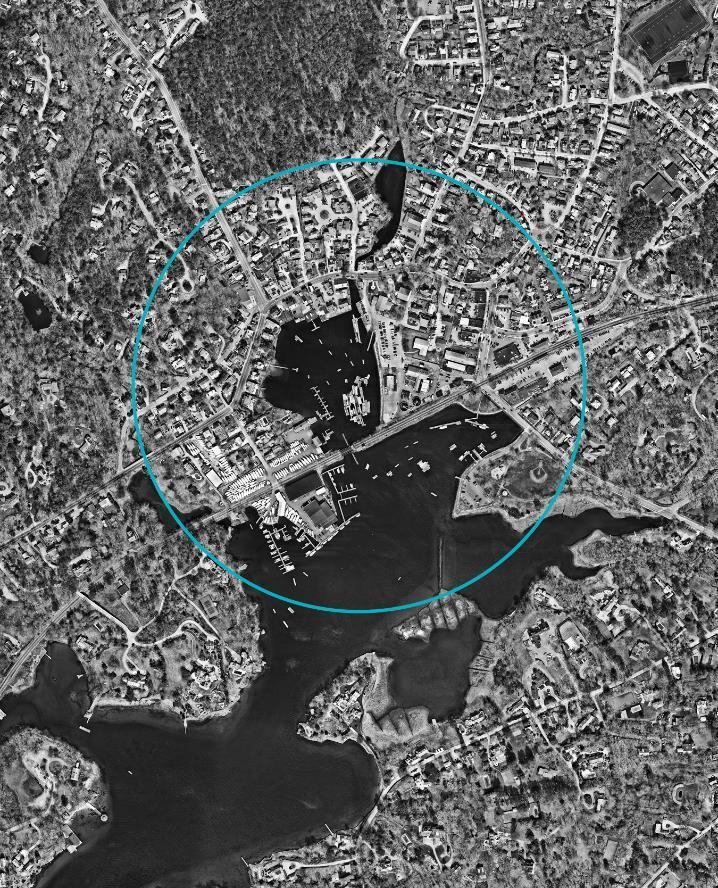
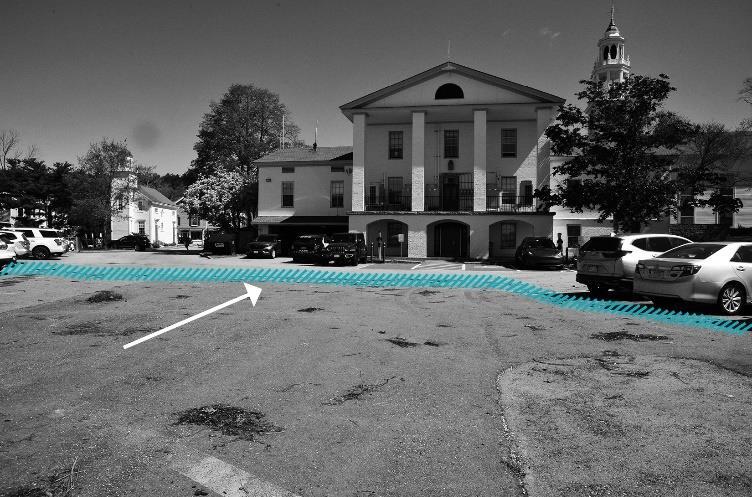
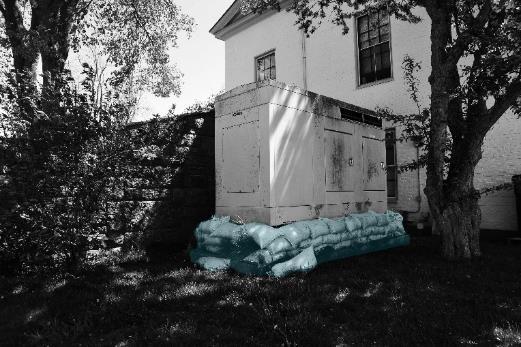
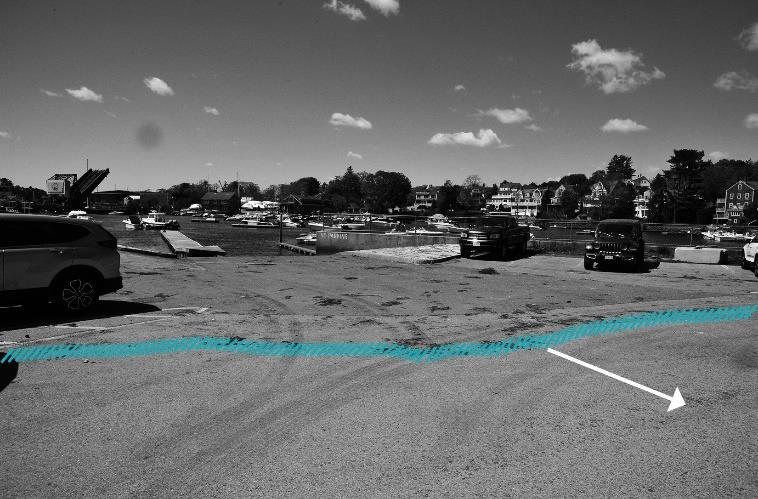
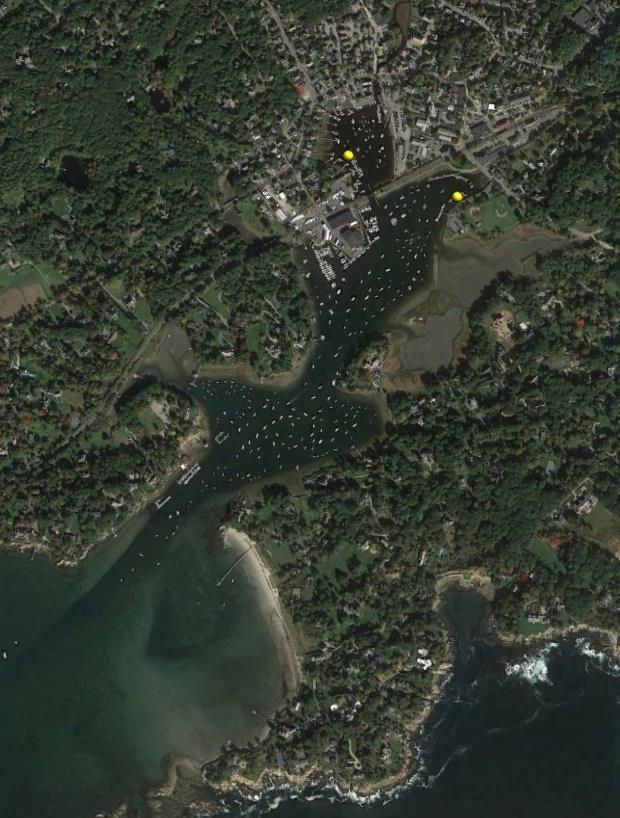
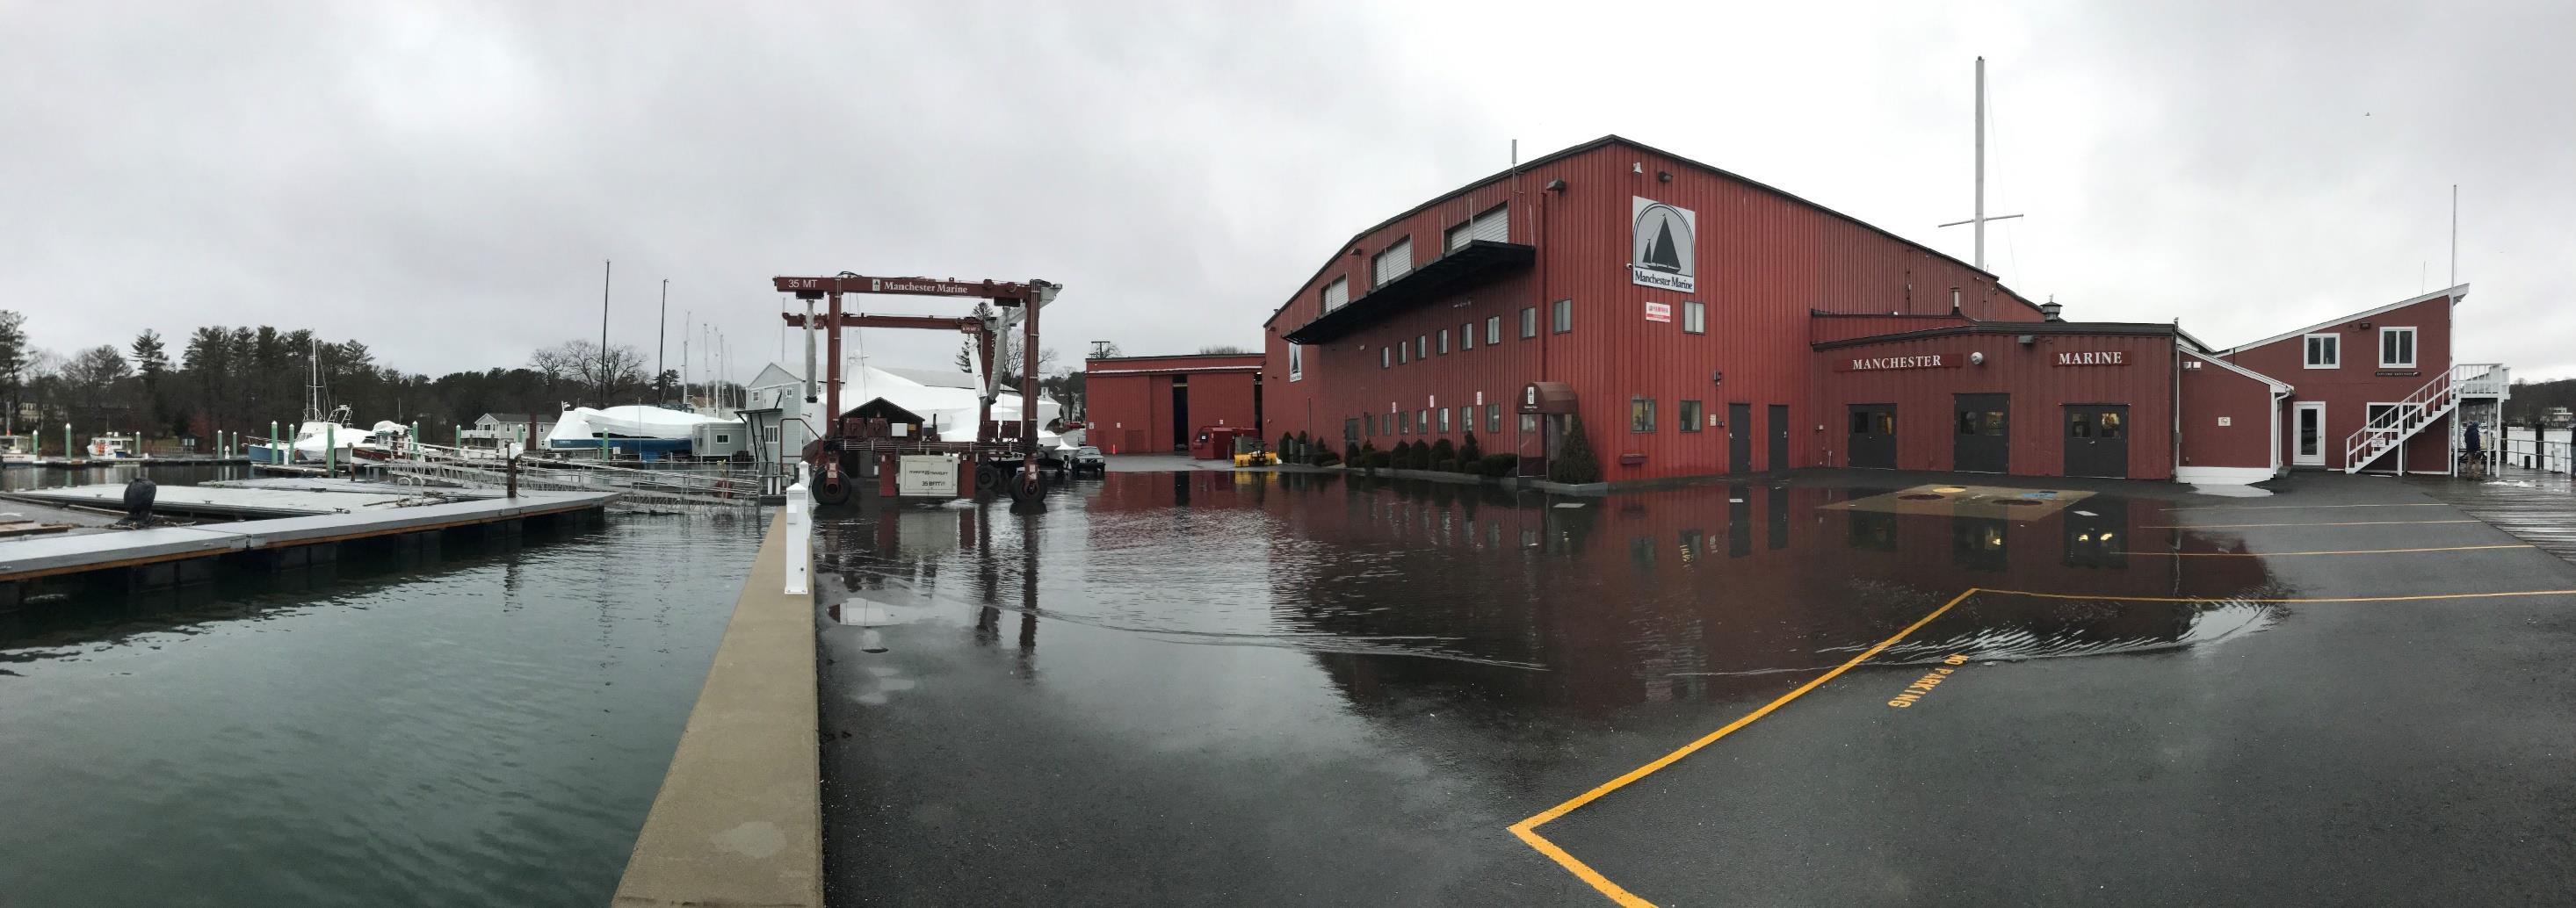
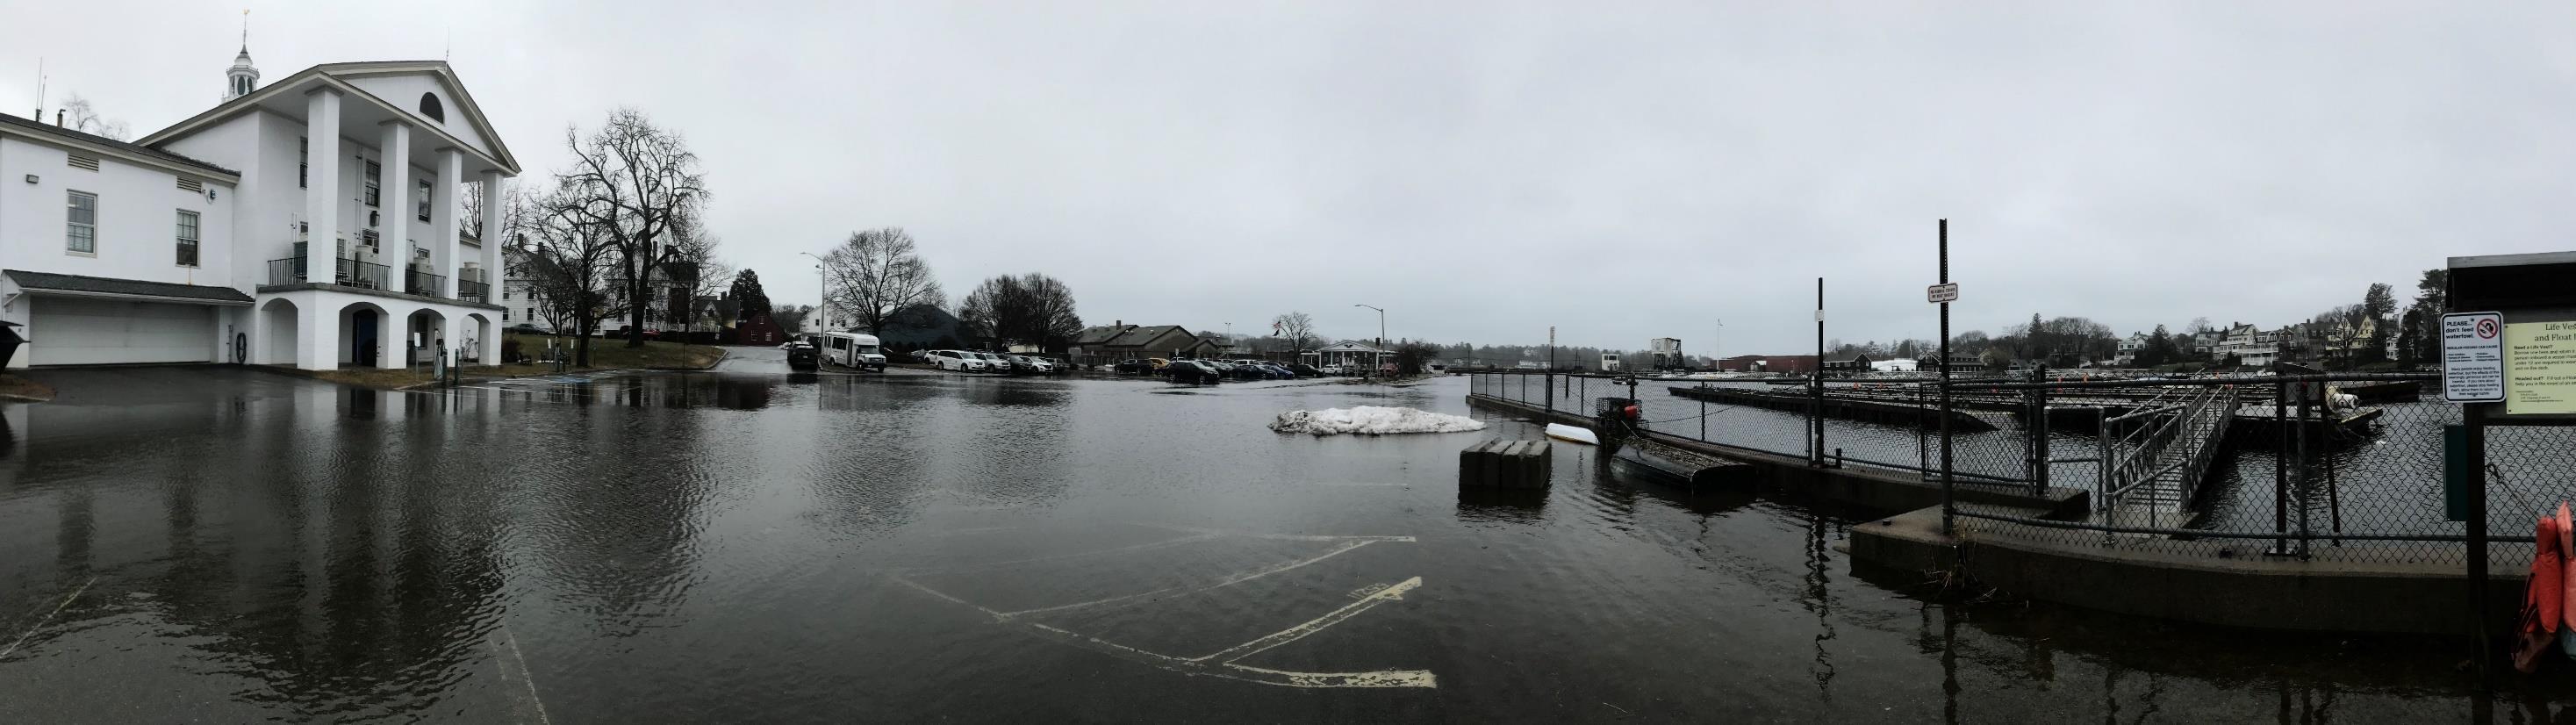
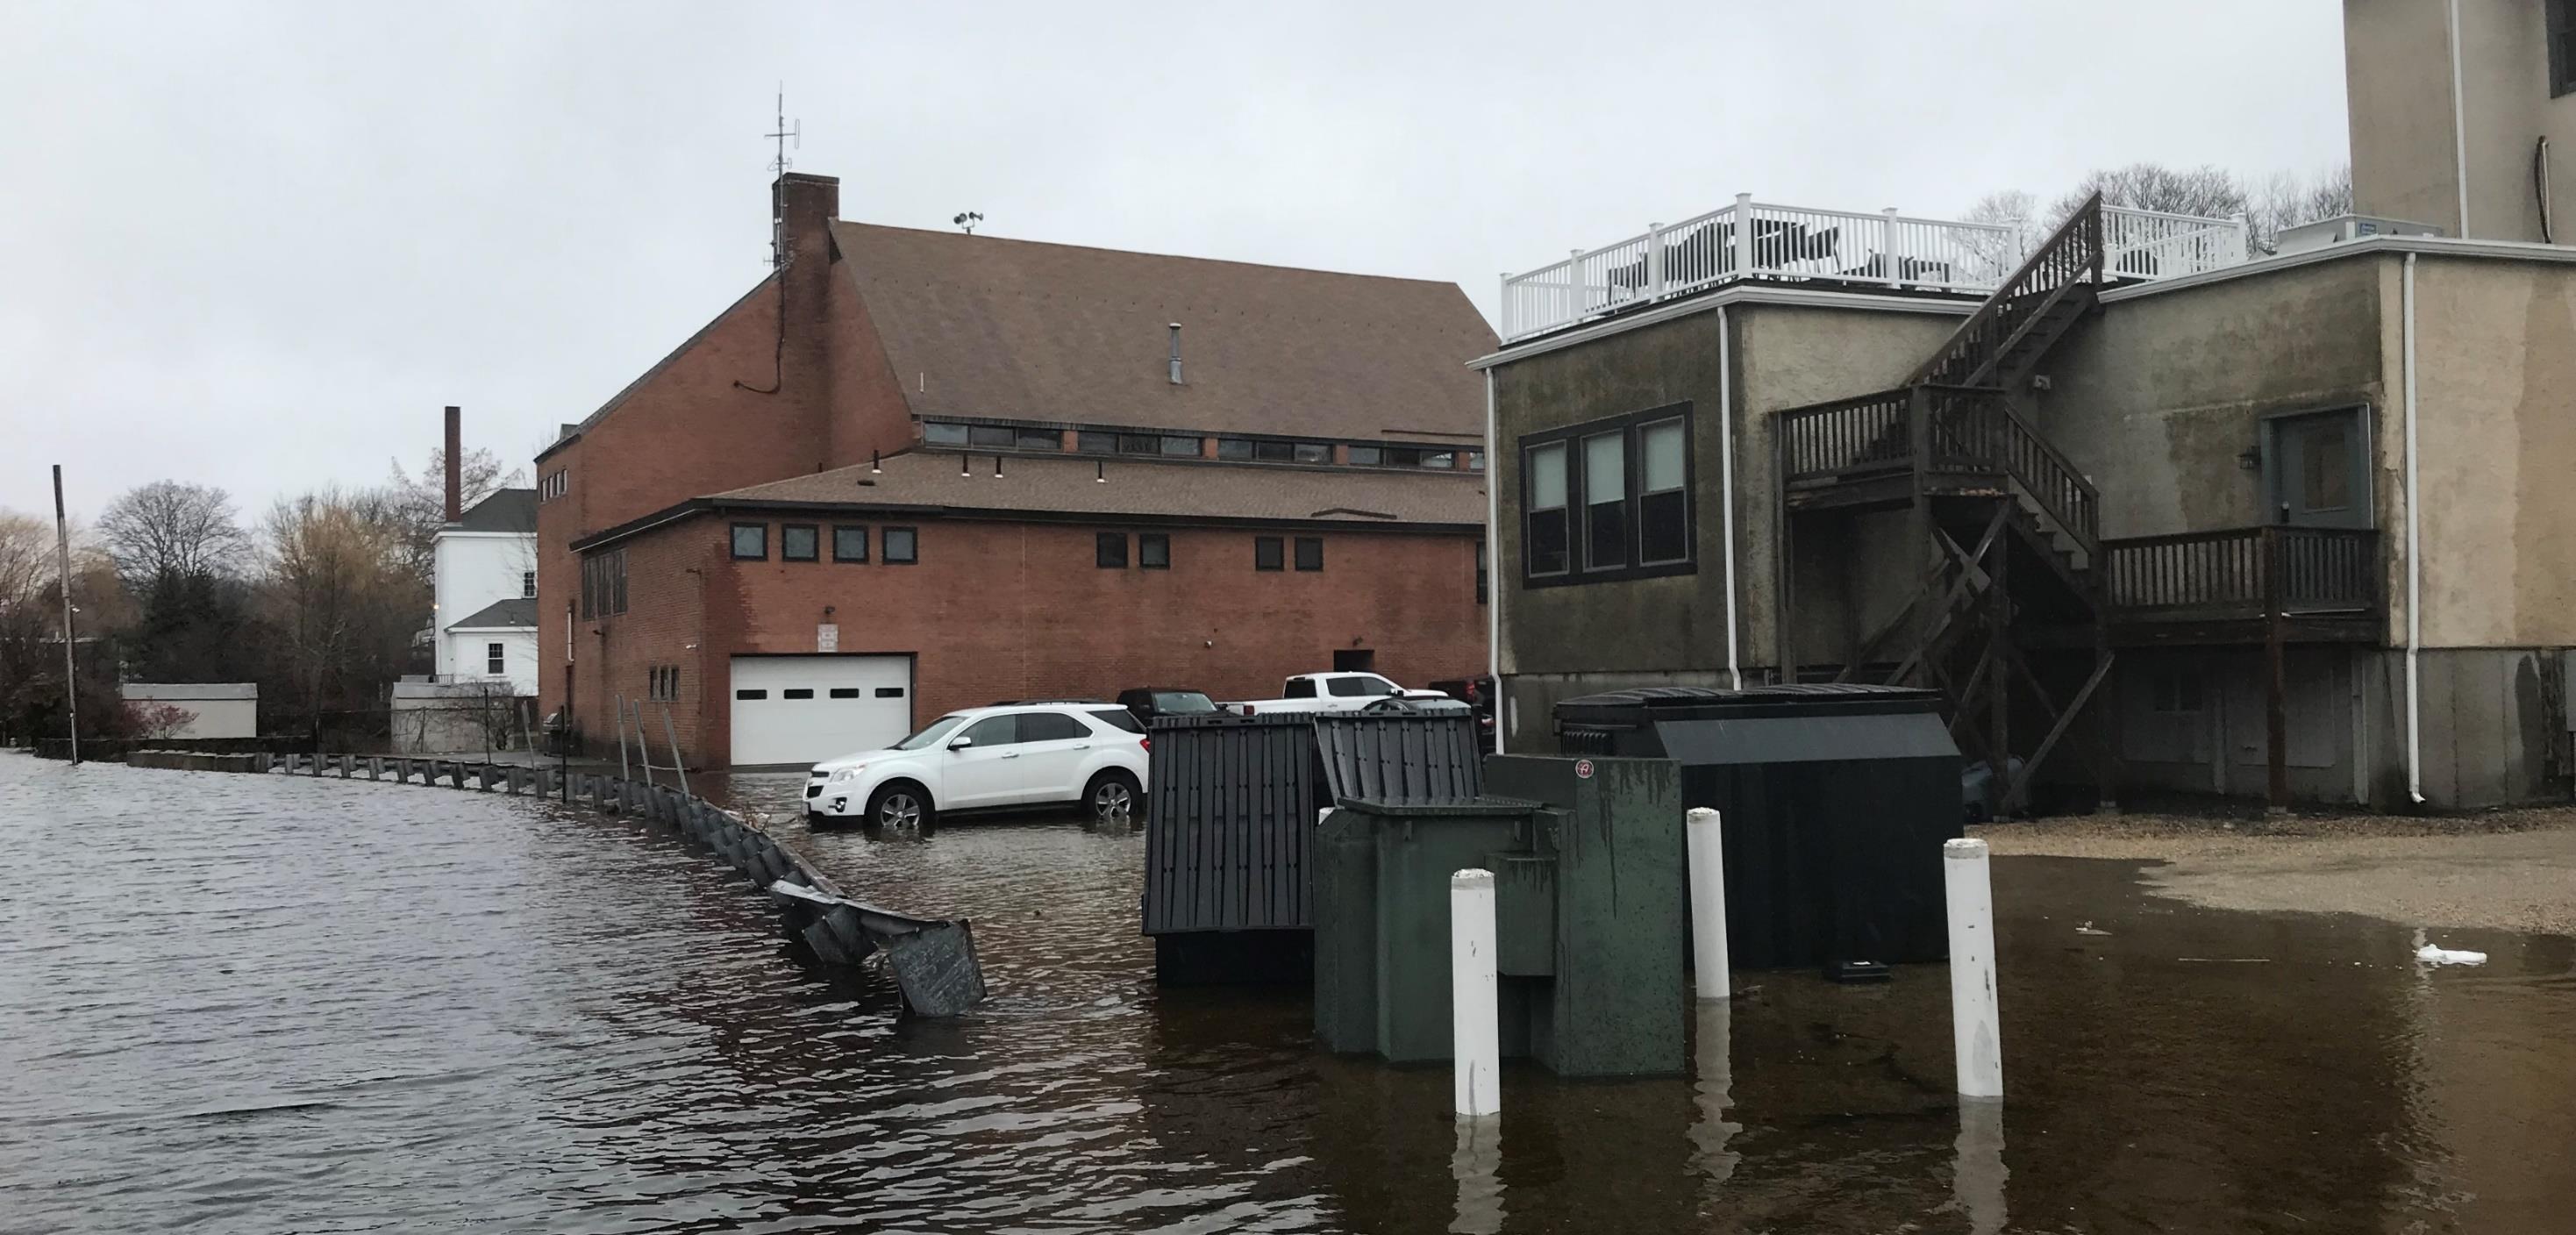
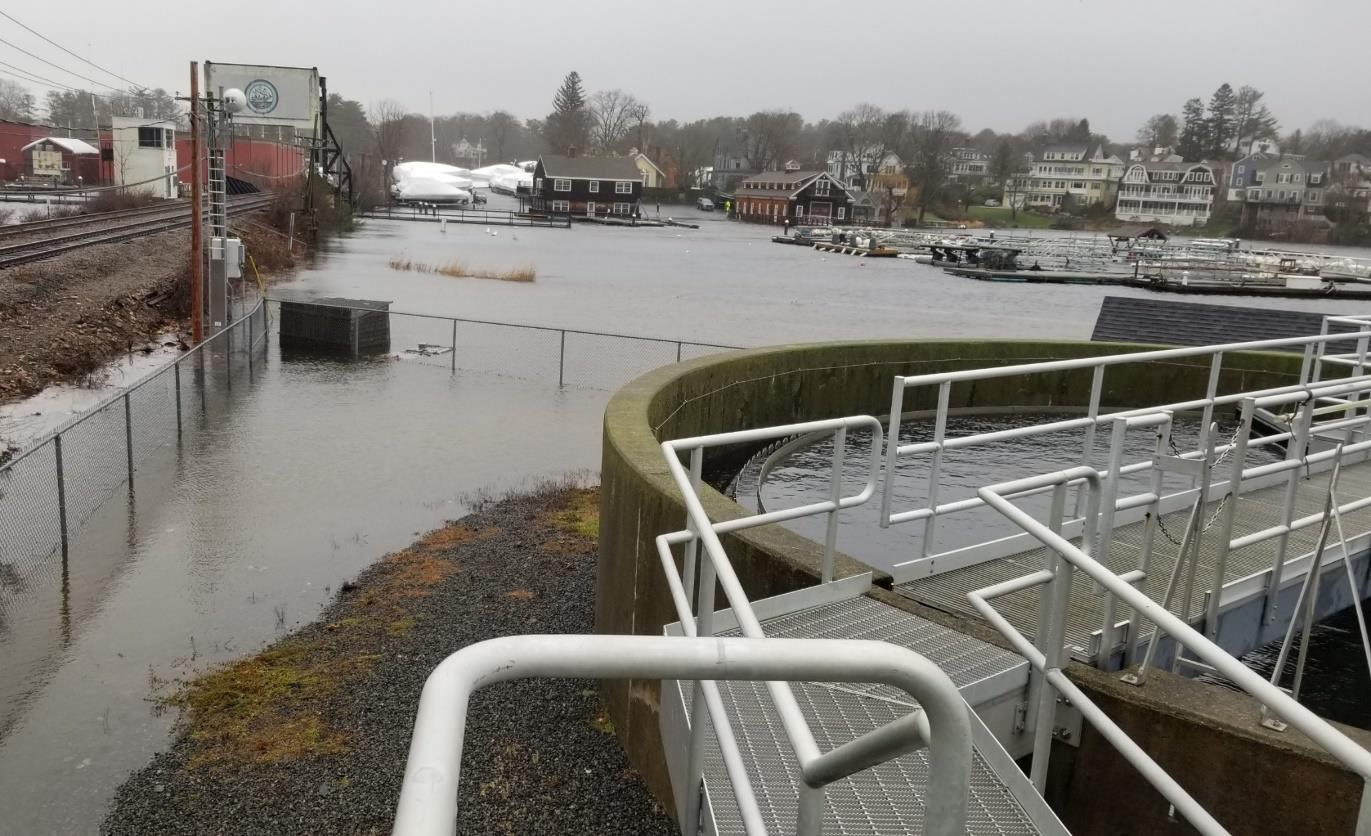
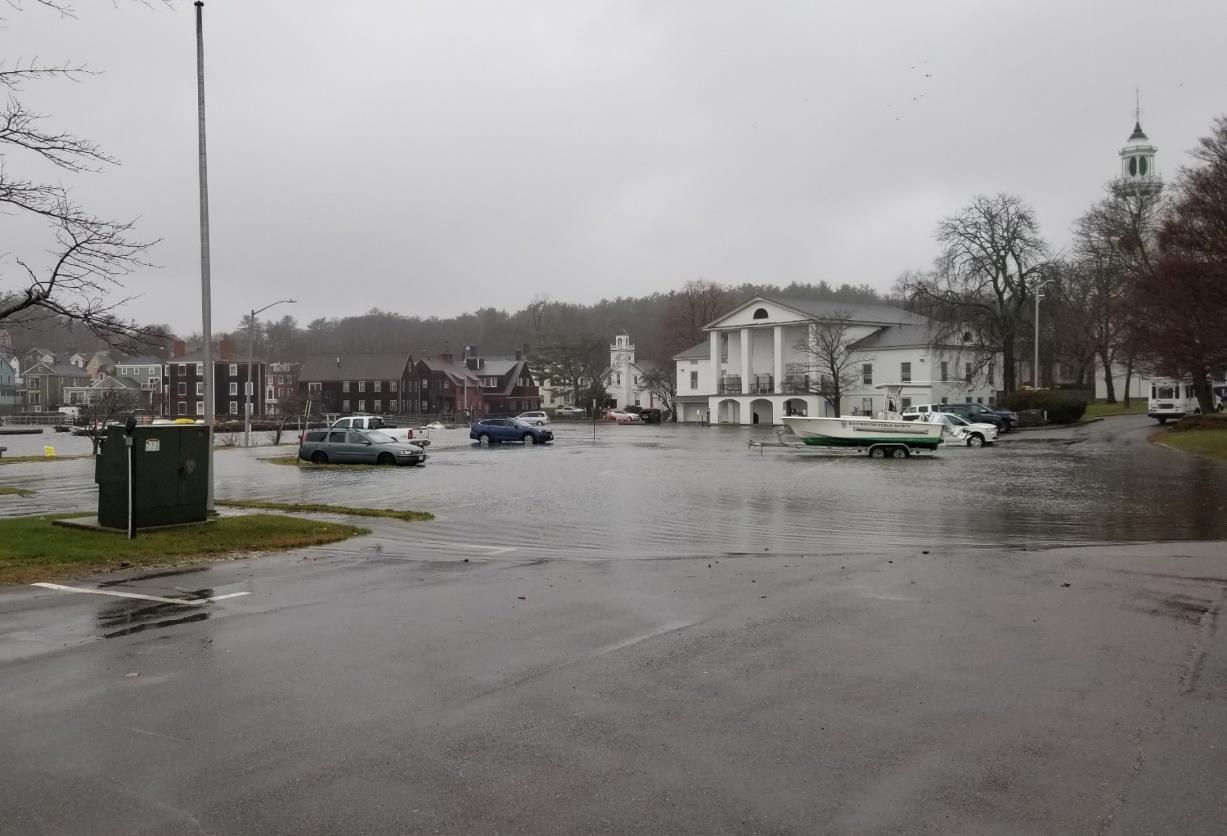
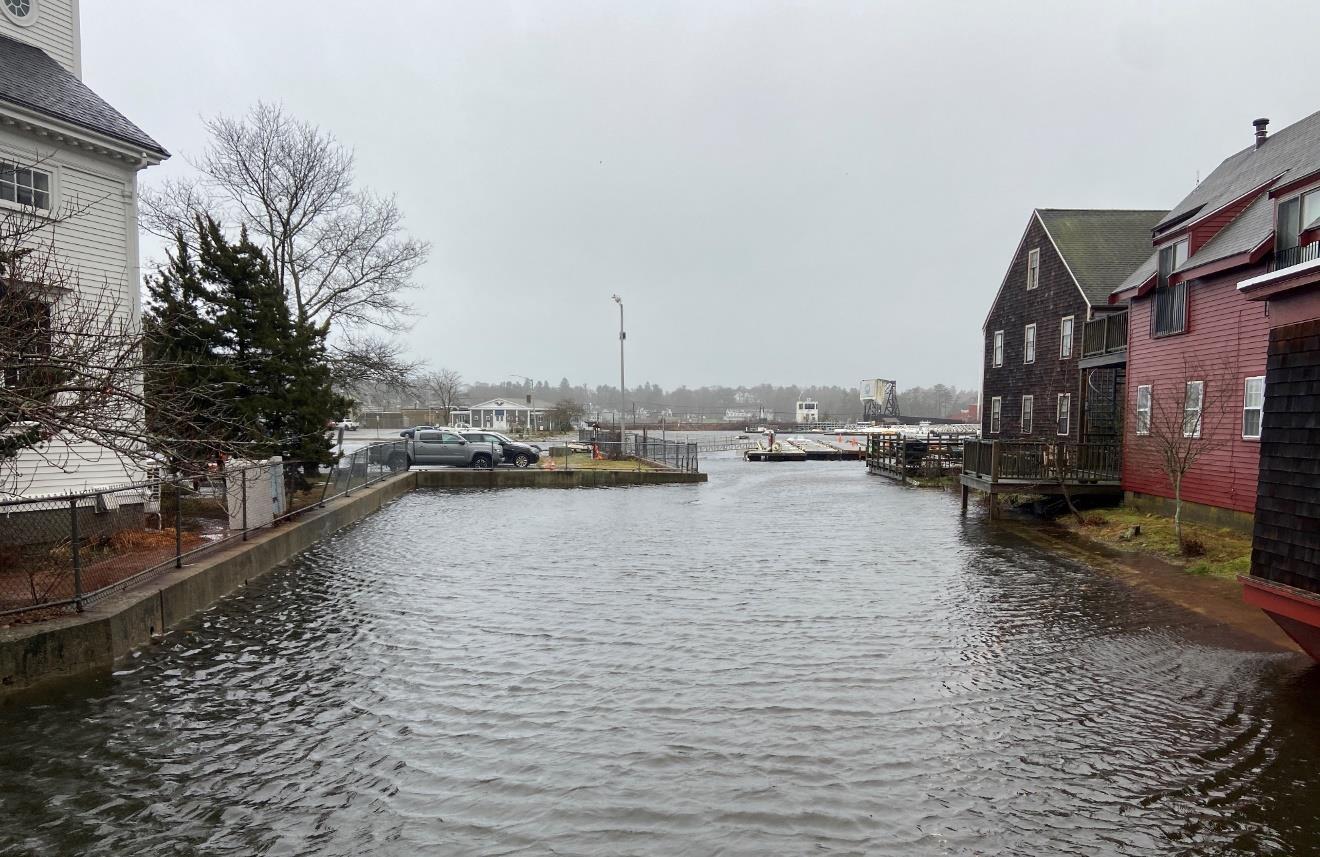
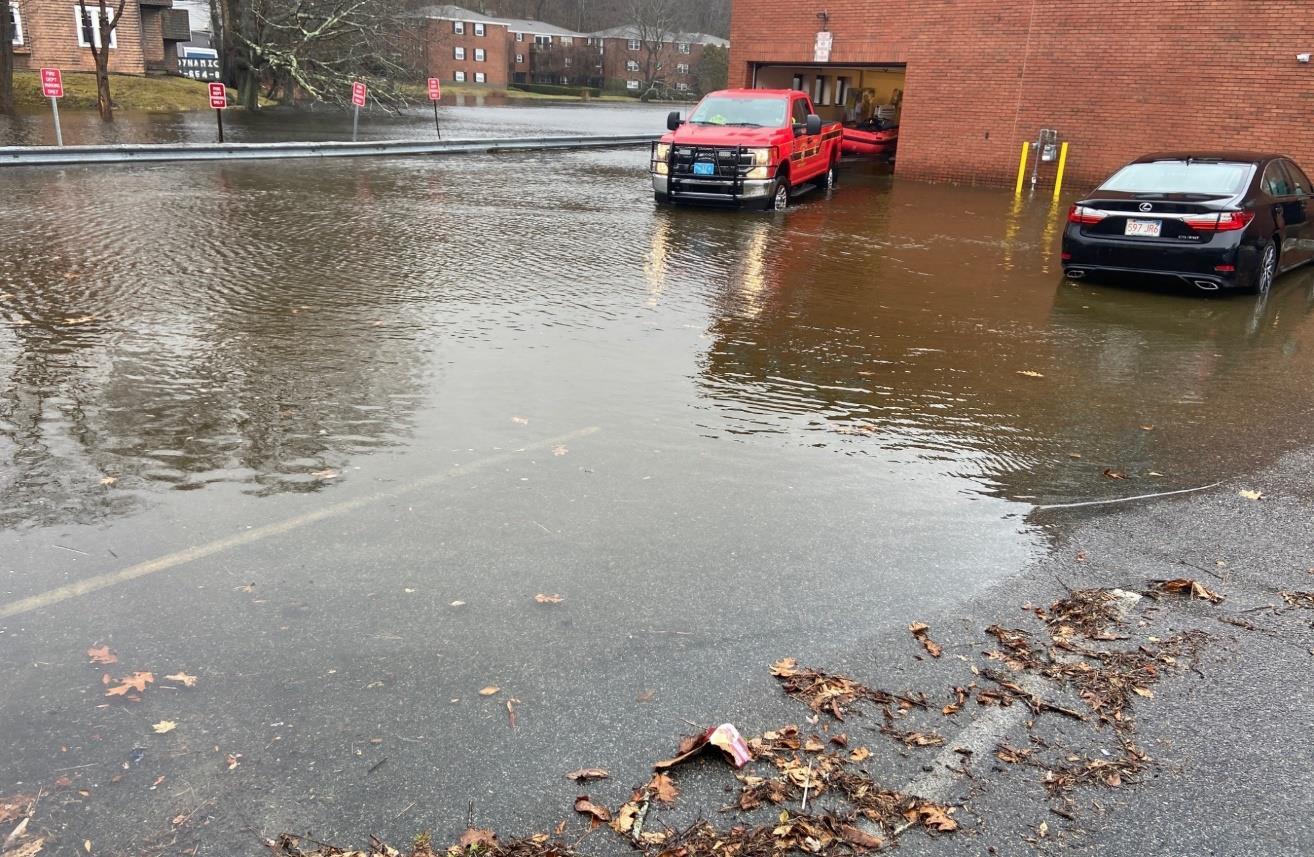
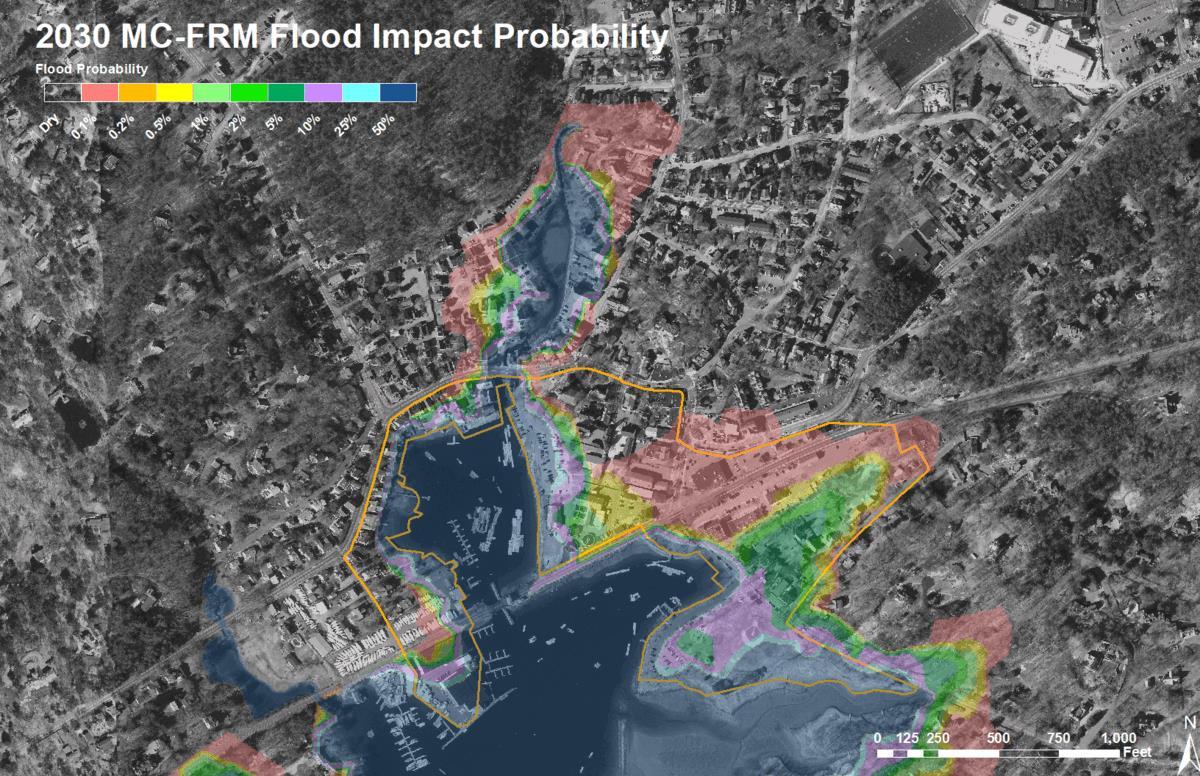
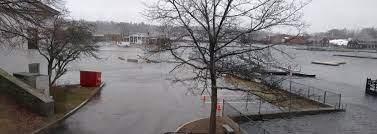
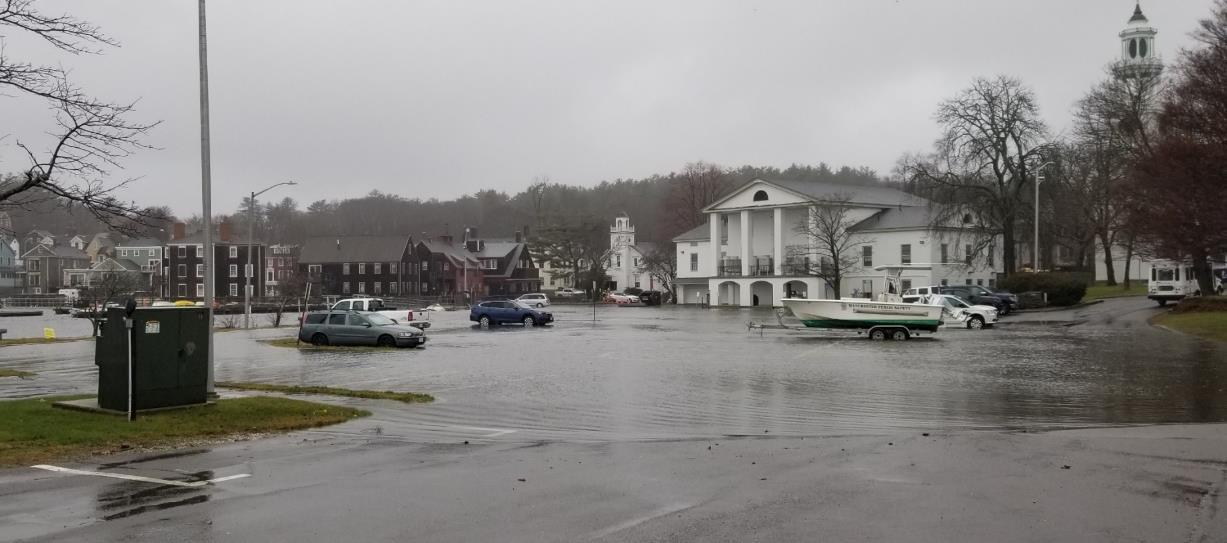
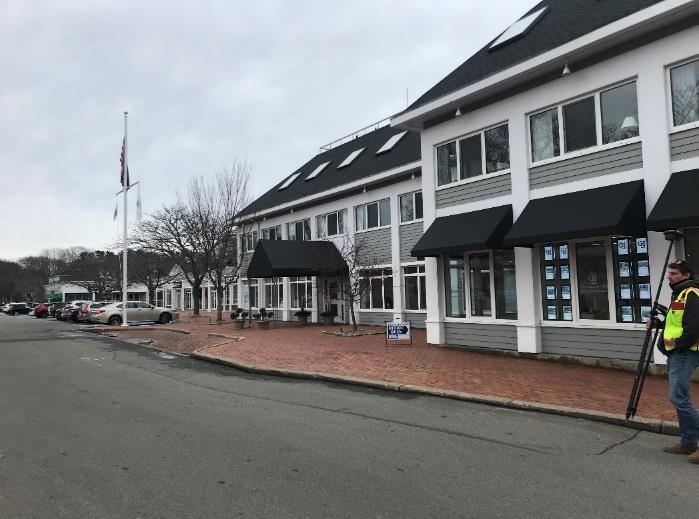
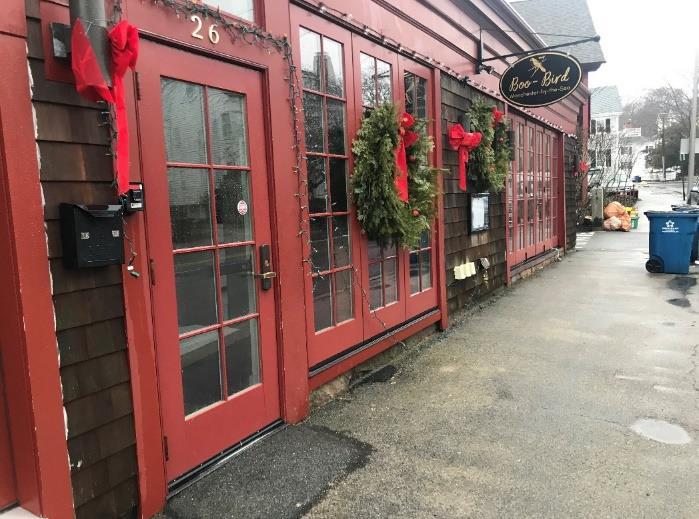
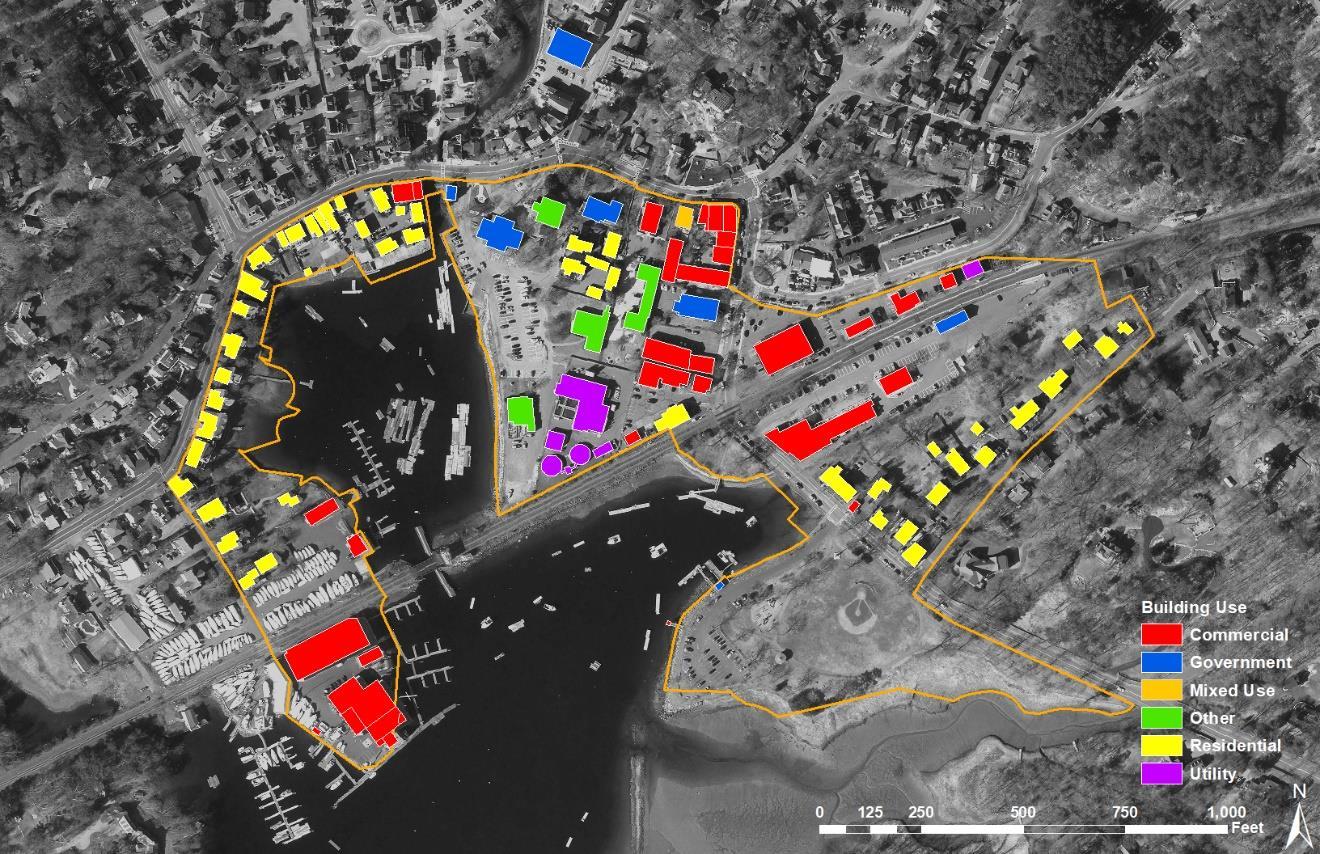
Manchester-by-the-Sea experiences frequent flooding in the downtown and inner harbor area
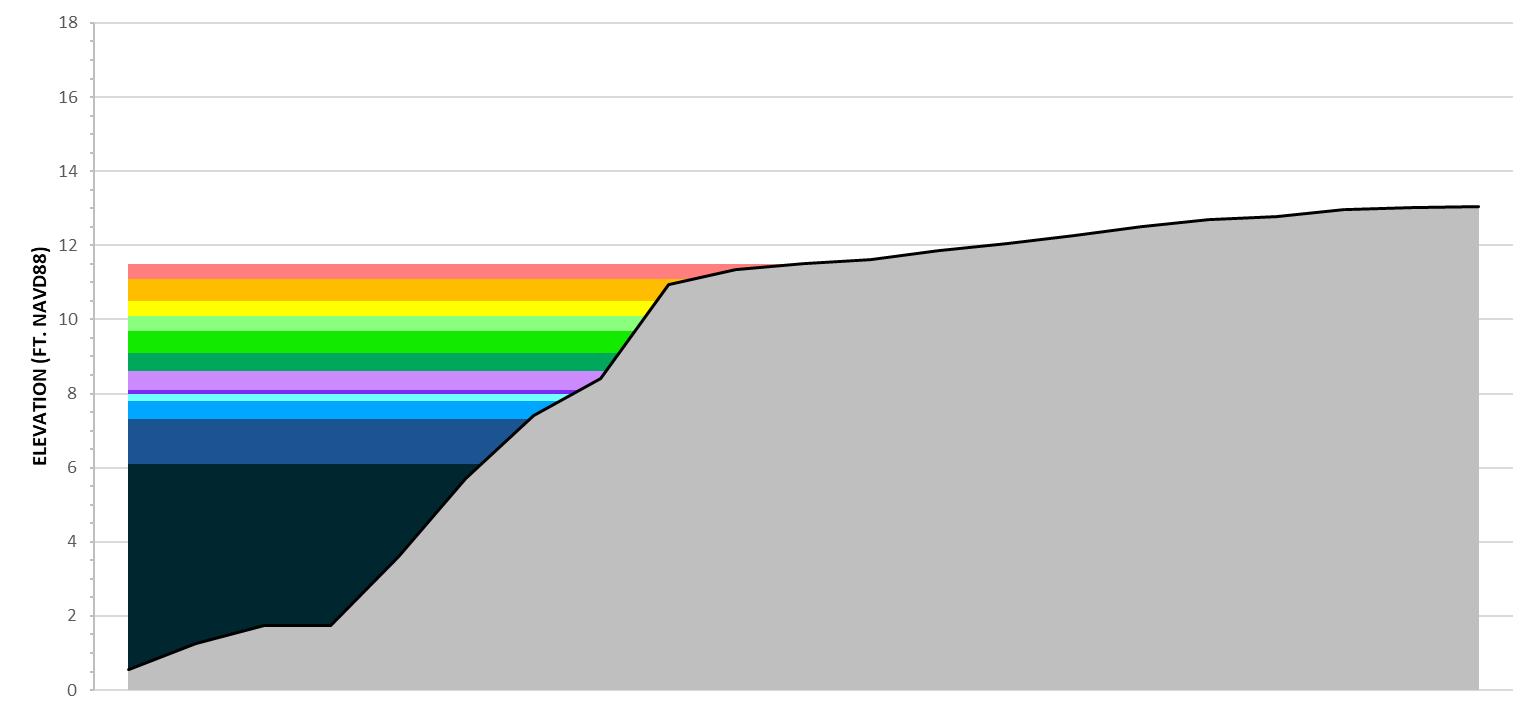
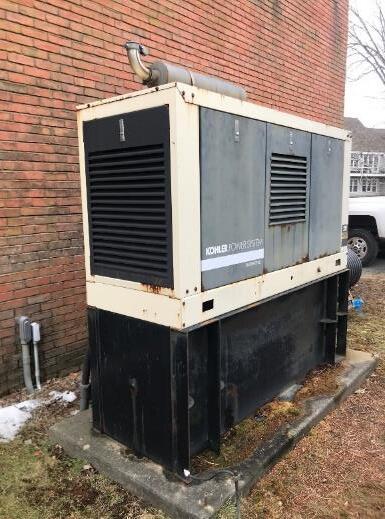
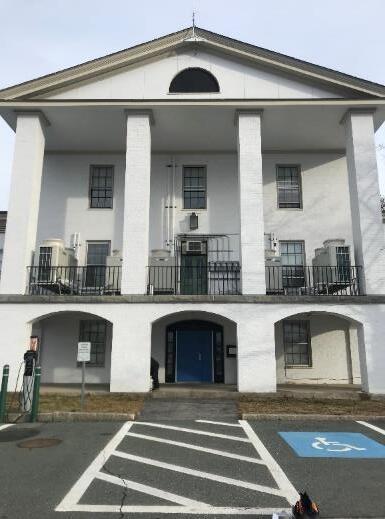
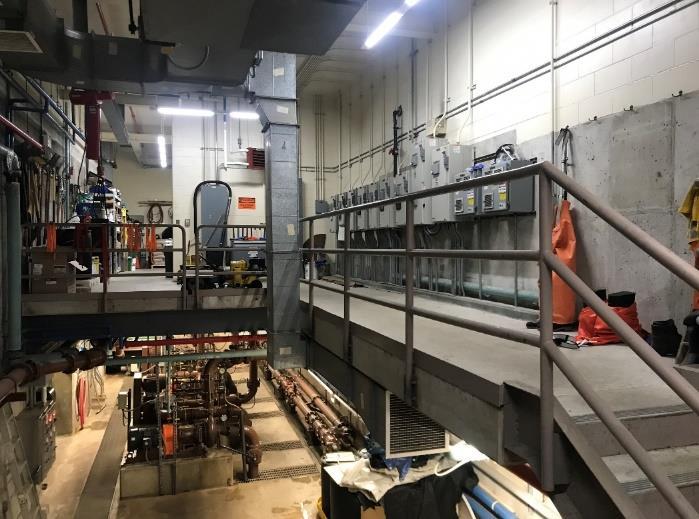
Critical infrastructure is at lower elevations
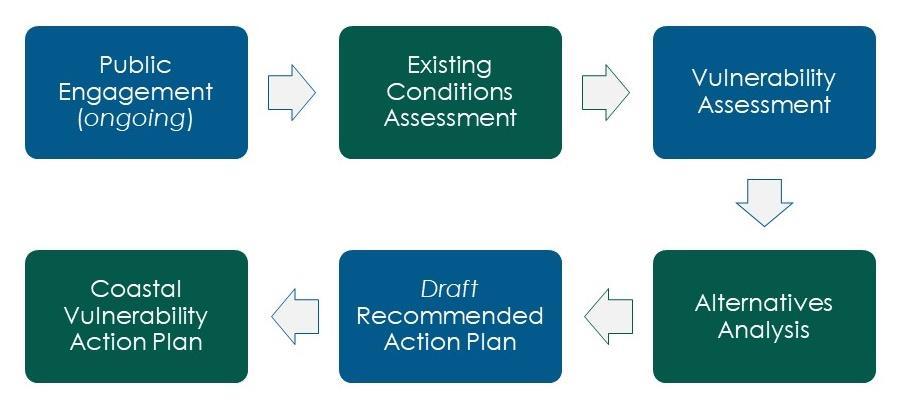
Plan will provide a roadmap to reduce coastal flood risks and increase coastal resilience

Build upon past studies
Develop a phased approach to establishing action-oriented mitigation measures
(JUN 2023)
(APR – JUN 2023)
(MAR – APR 2023)
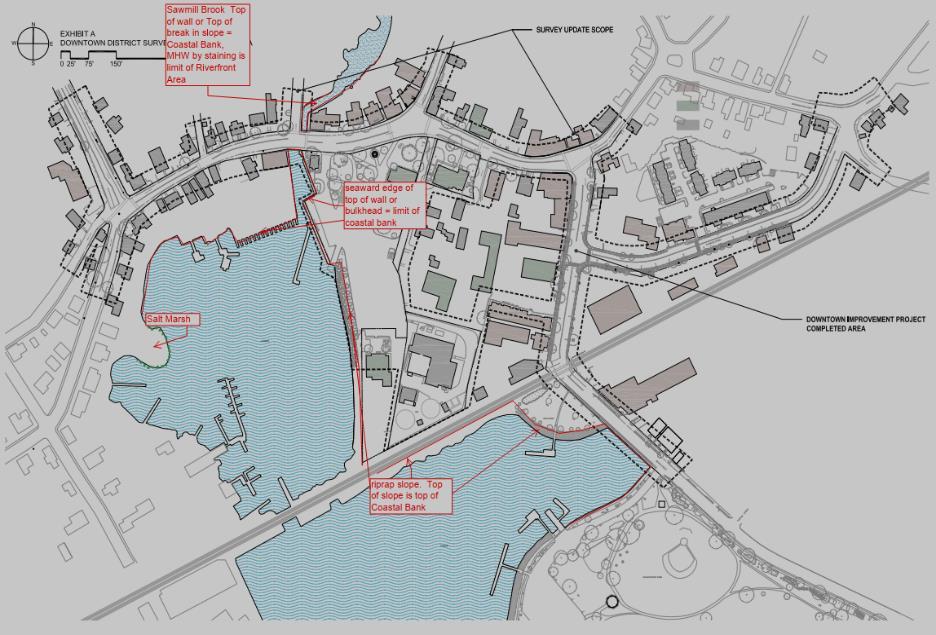
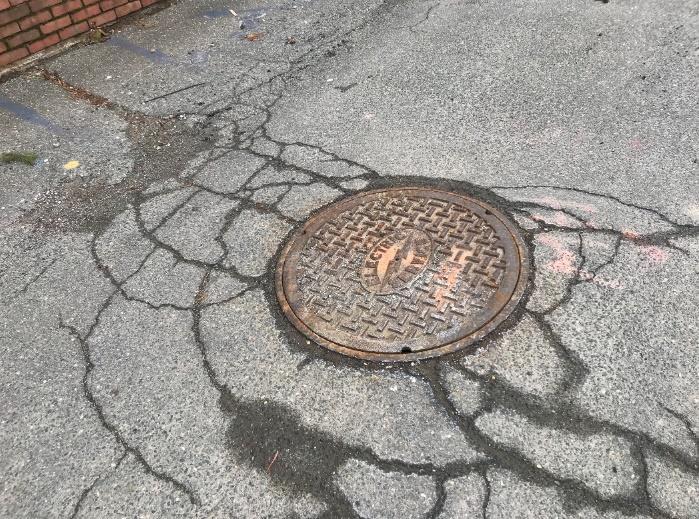
Compiling mapping information and collecting data on past flood elevations
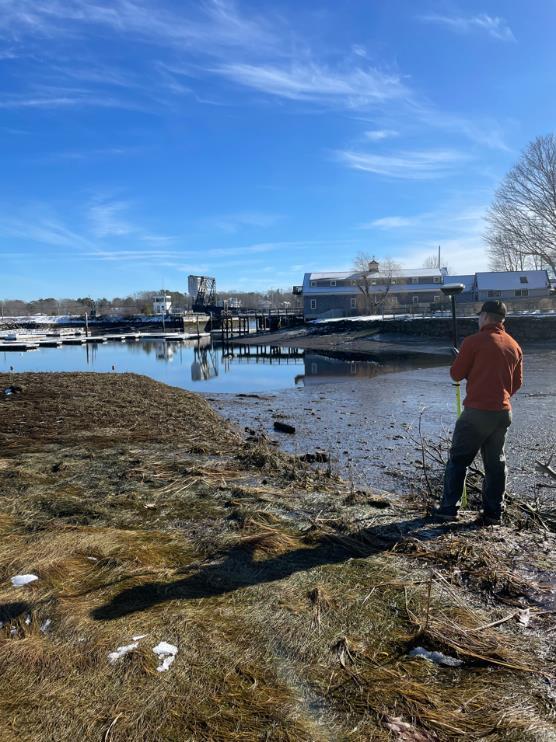
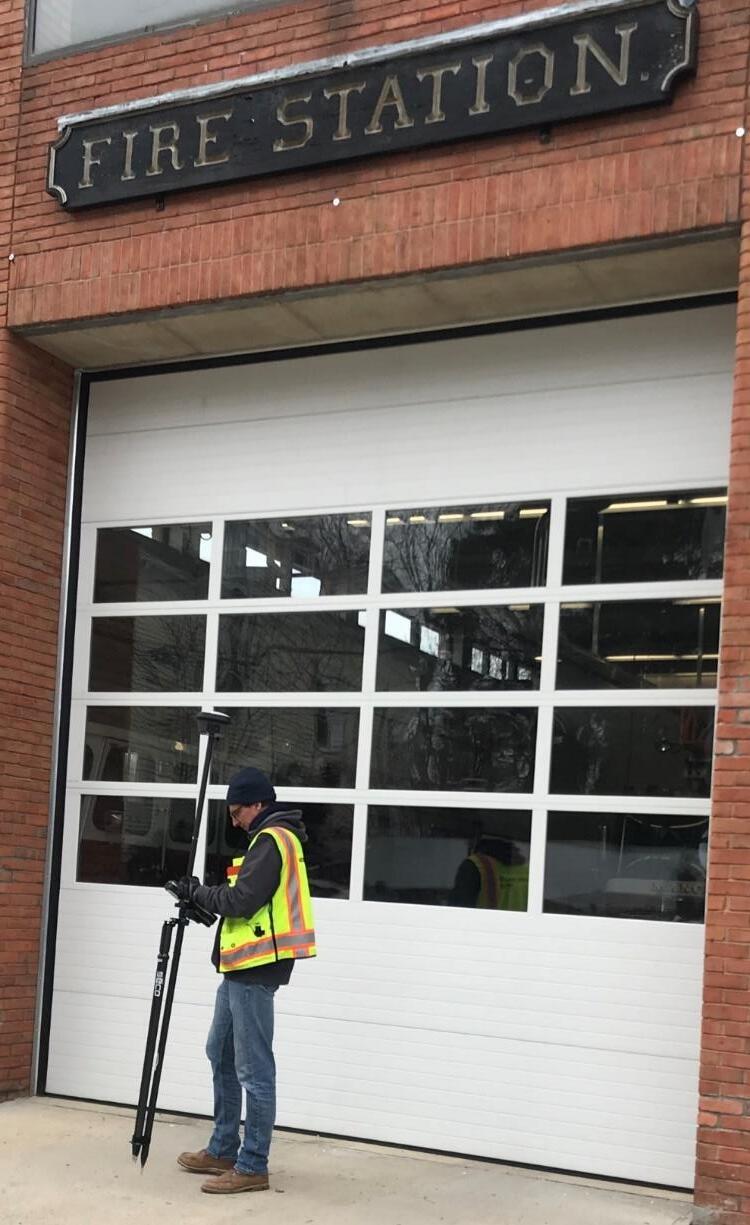
Performing site assessments and collecting critical elevations
Build upon the 2016 Town-wide Vulnerability and Risk Assessment
Assess current and future flooding conditions, water surface elevations, and projected habitat change
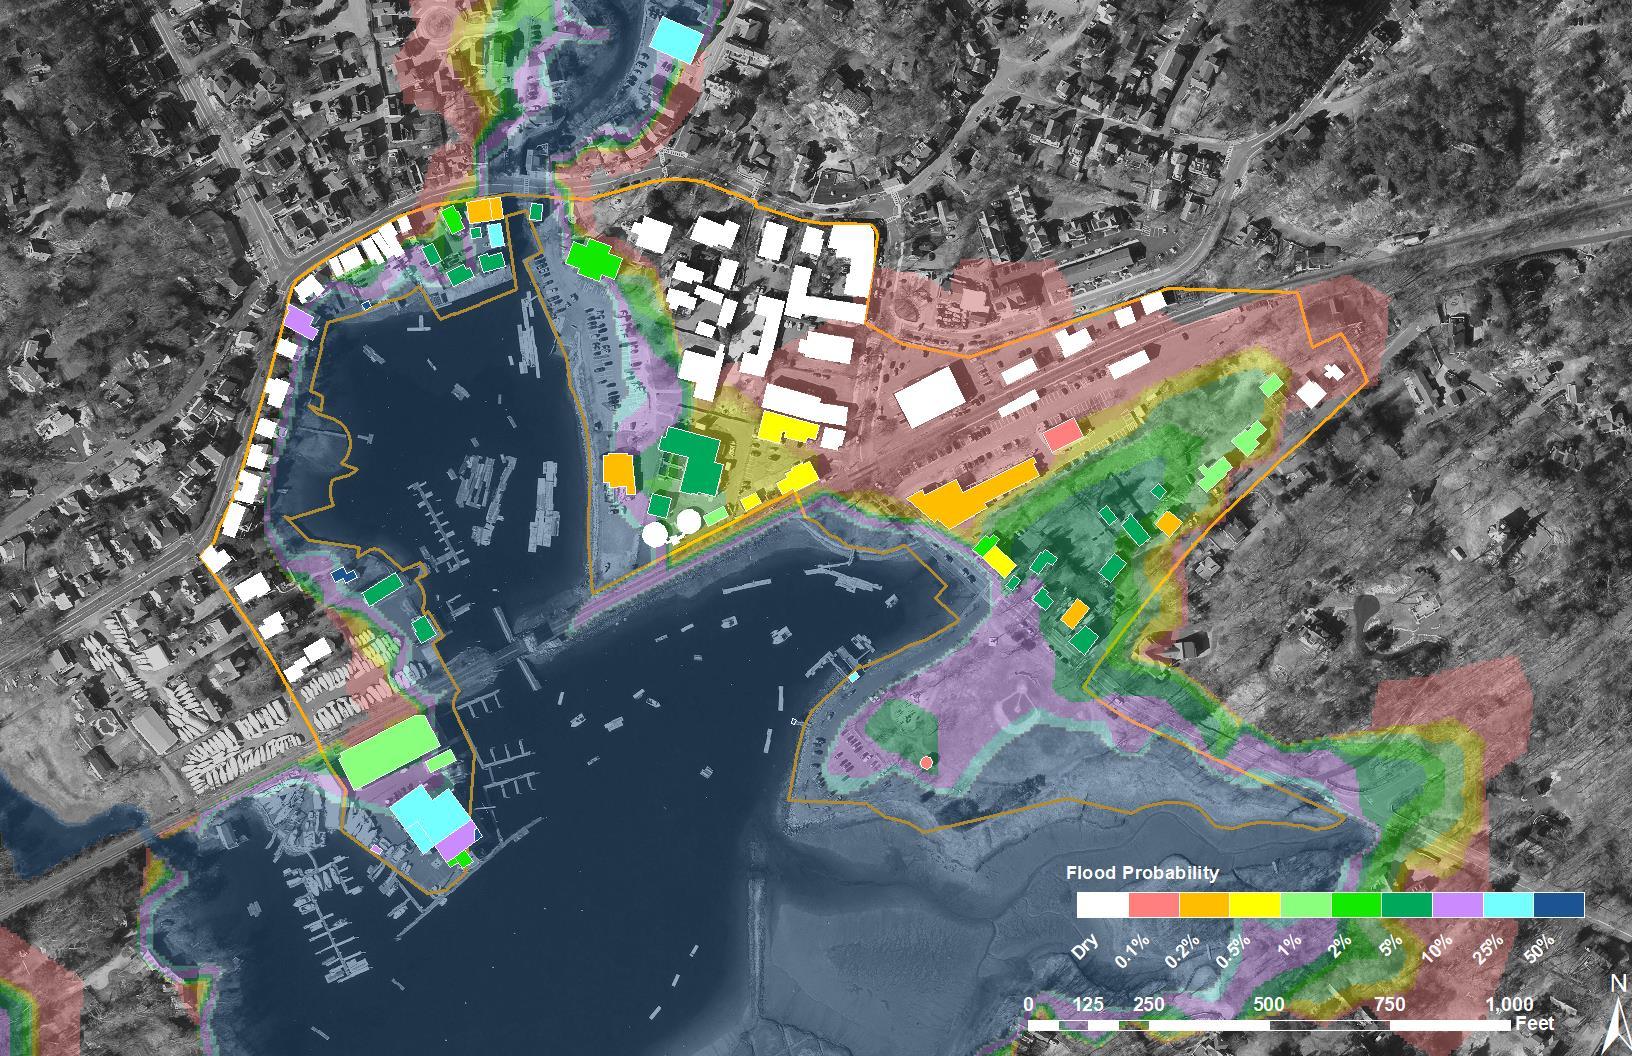
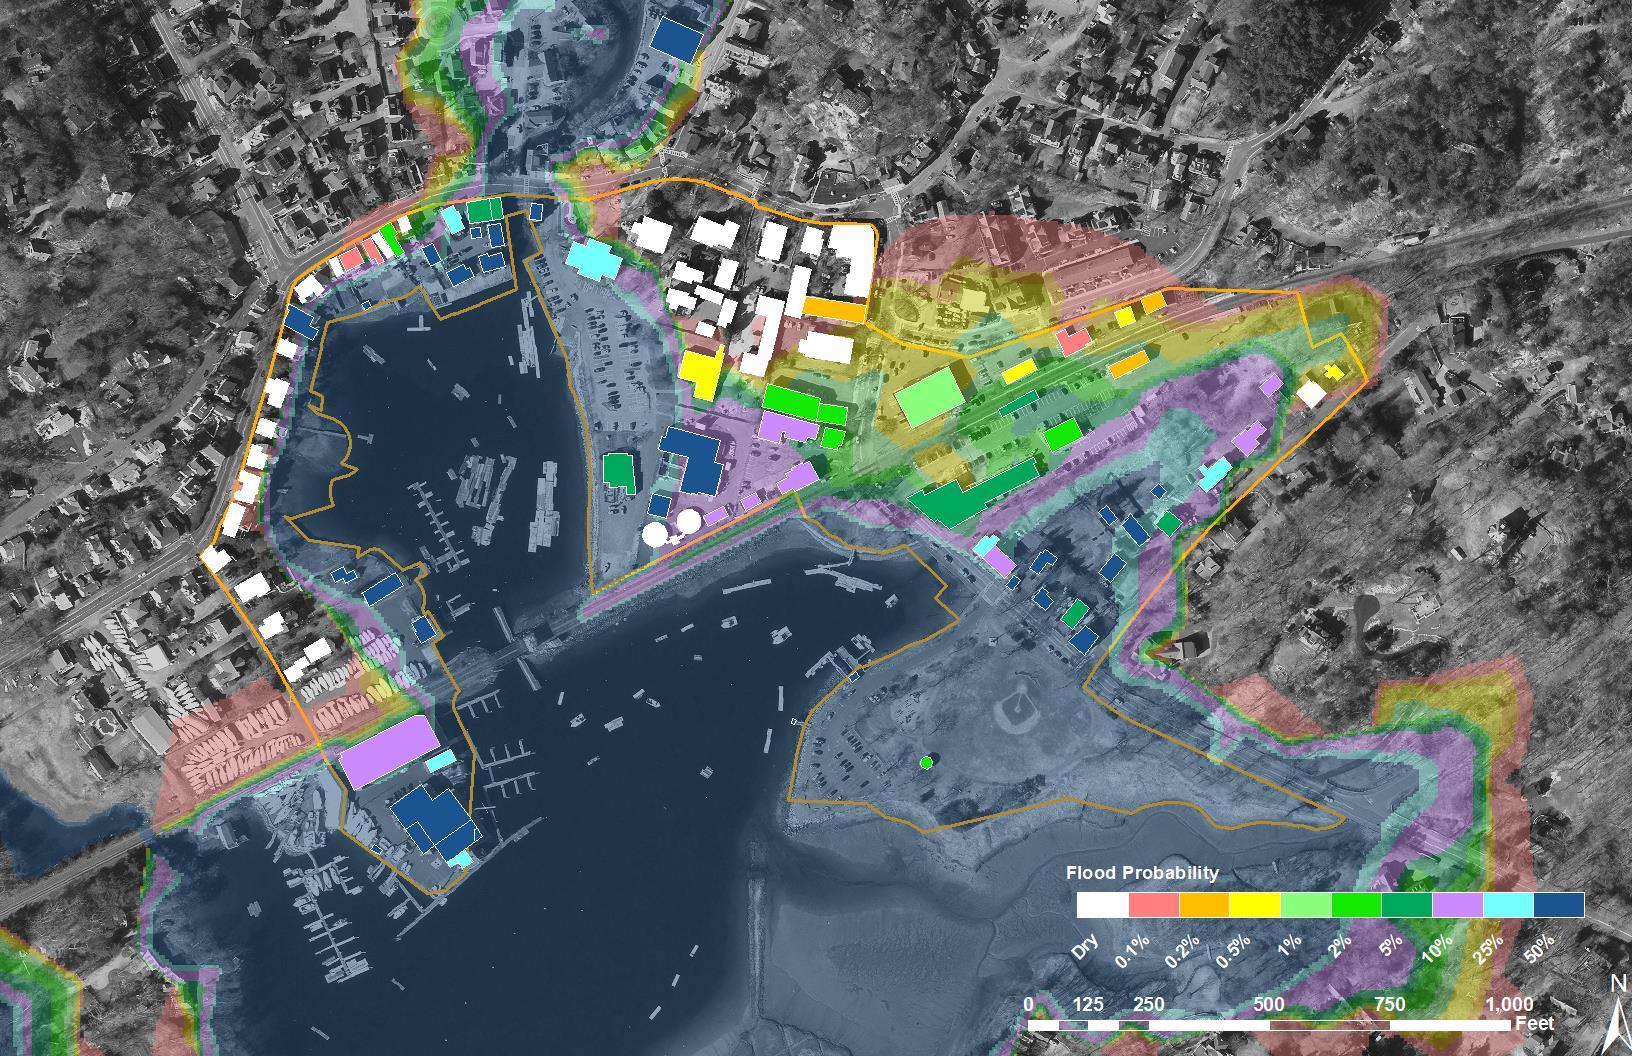
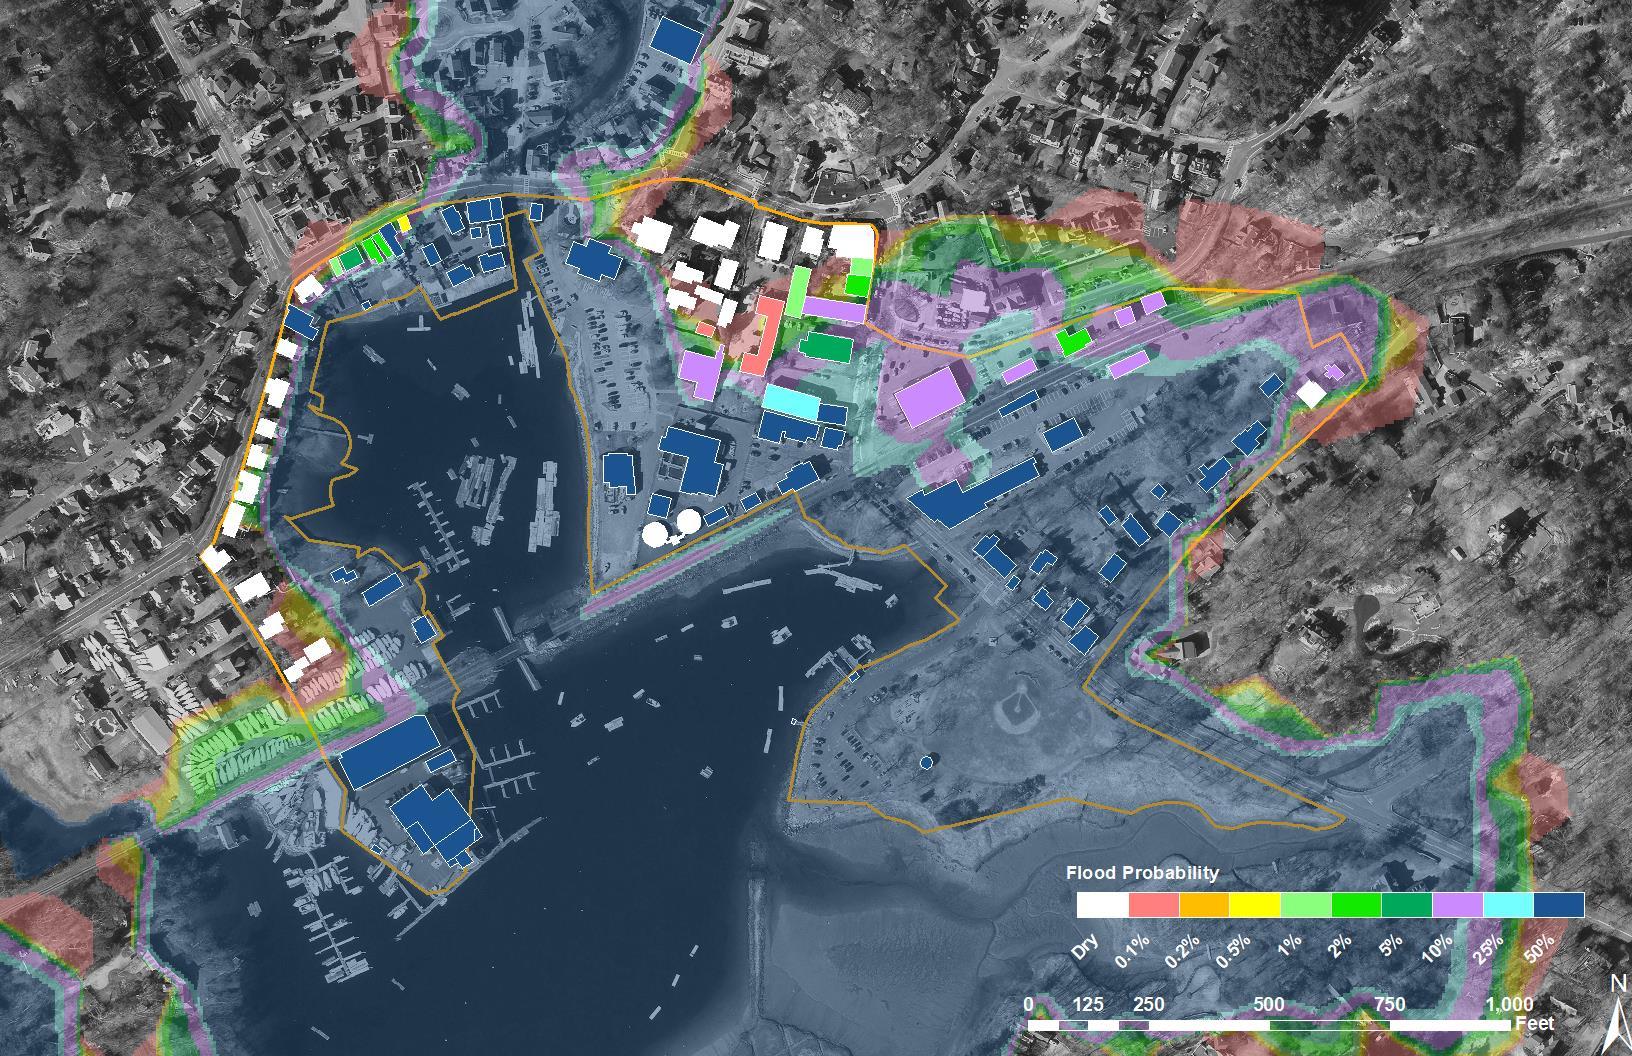
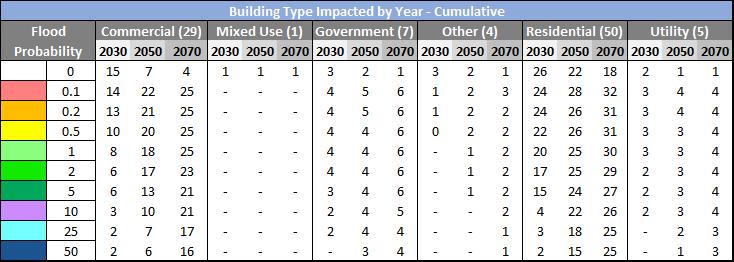
Develop inundation maps and a detailed, asset-specific assessment for buildings and infrastructure

 (Rimmer, 2015)
(Woods Hole Group 1/17/23)
(Rimmer, 2015)
(Woods Hole Group 1/17/23)
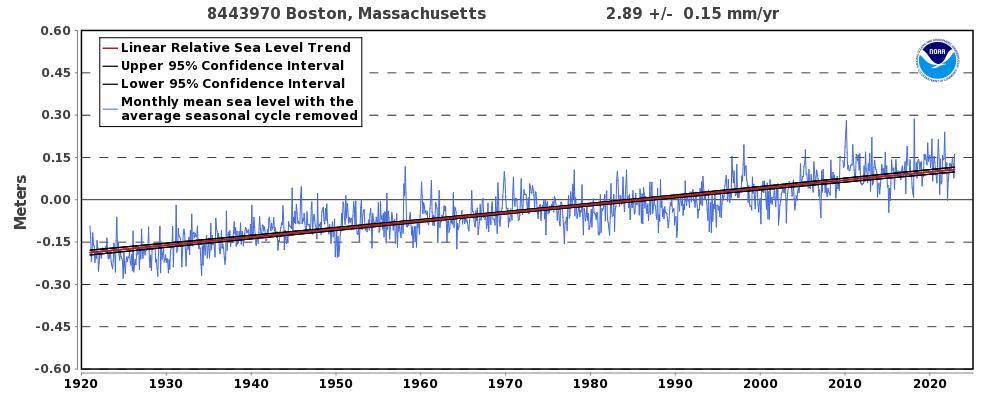
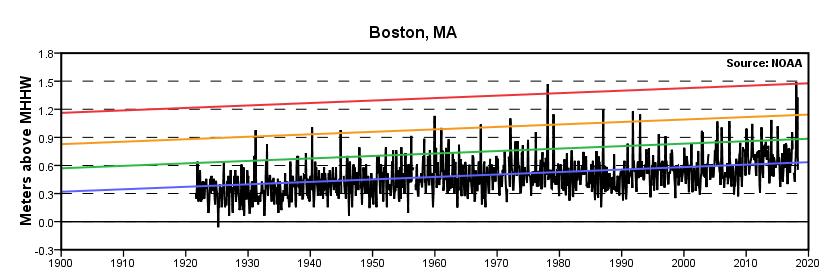
The relative sea level trend is 2.89 millimeters/year with a 95% confidence interval of +/- 0.15 mm/yr based on monthly mean sea level data from 1921 to 2021 which is equivalent to a change of 0.95 feet in 100 years.
MASSACHUSETTS COASTAL FLOOD RISK MODEL (MC-FRM) NORTH (DECONTO & KOPP, 2017)
Relative Mean Sea Level (feet NAVD88)
Note: MA selected the High Scenario for planning
Observed Monthly Average
Scenarios (High)
2008 Baseline (1999-2017)
×
NOAA Epoch (19832001)
NOTES: (1) Projections from Resilient MA Labels in flags are relative sea level rise from baseline year of 2008 (1999-2017) in MC-FRM & (2) Boston Tide Gauge (Station 8443970) Local Tidal Datums: MHHW is 5.1 FT. above MSL

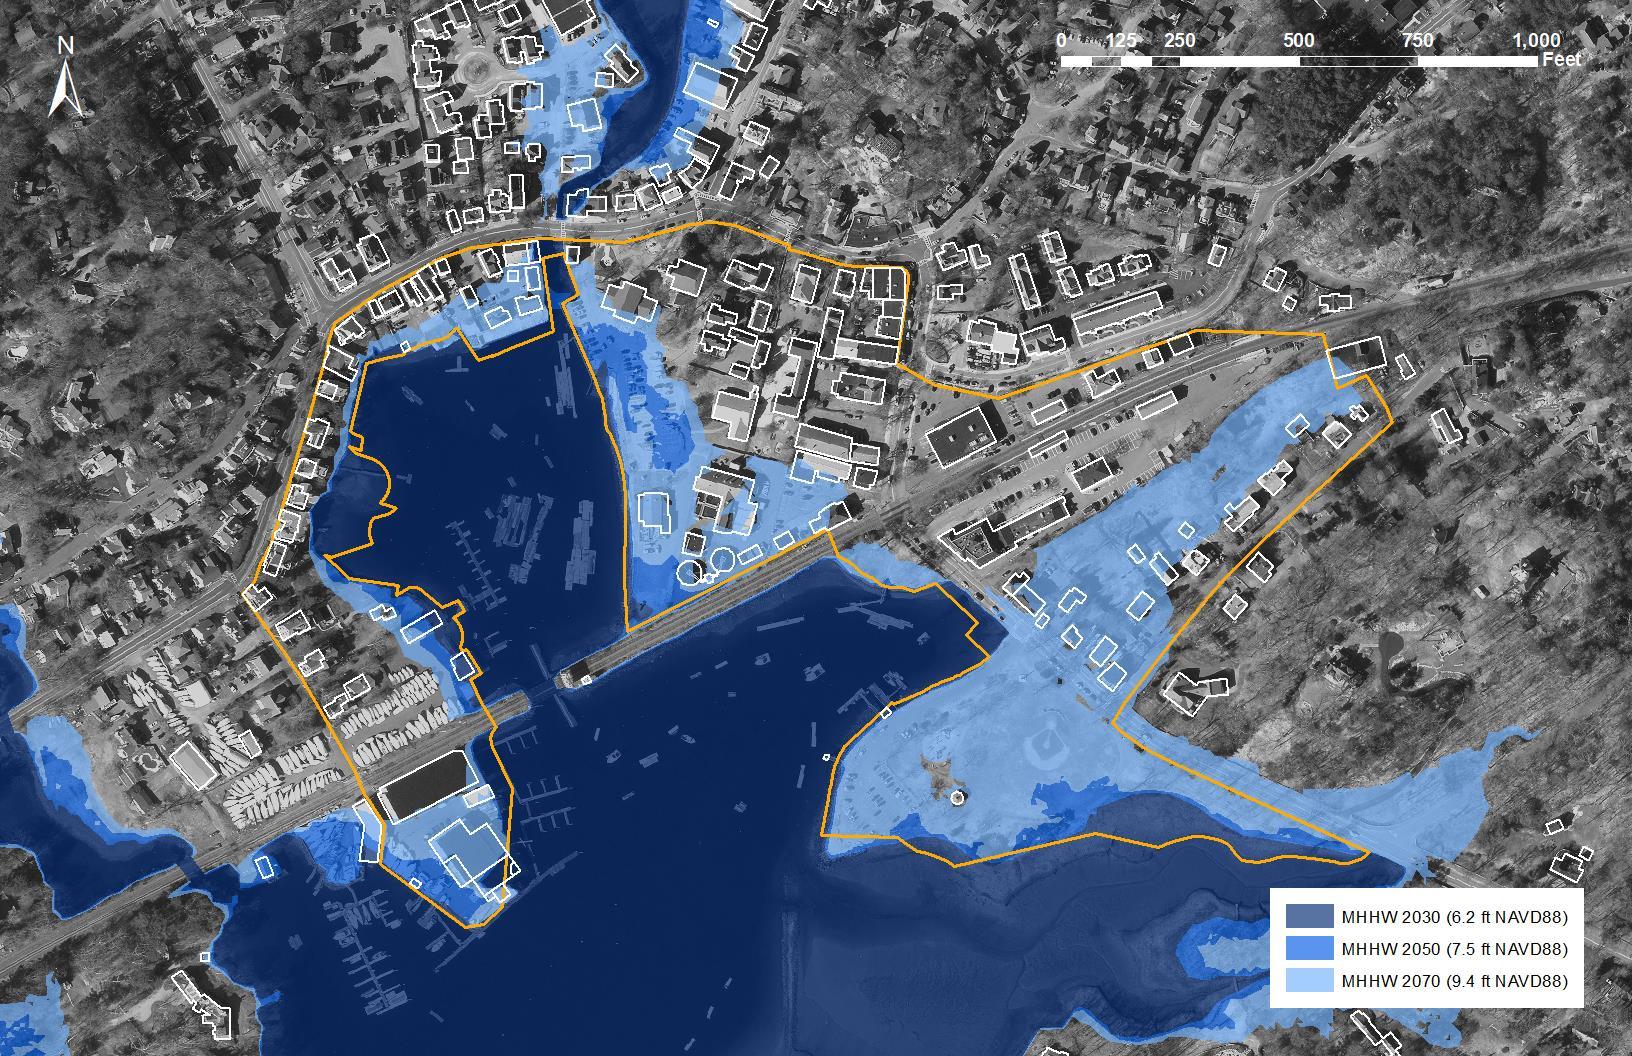
Mean Higher High Water (MHHW) is the avg of the higher high water heights of each tidal day observed over a 19-year period
1/4/18: NEW STORM OF RECORD
*Note: Historic water levels recorded at the Boston tide gauge may not be representative of actual storm surge elevations in Manchester Harbor; comparisons are an approximation only and should only be used to put future water levels into a local context.
Note: 12/23/22 storm produced the 8th highest water level recorded in Boston, and the specific water level for MBTS according to our tide gauge was: 8.3 ft NAVD88.
Note: 12/23/22 storm produced the 8th highest water level recorded in Boston, and the specific water level for MBTS according to our tide gauge was: 8.3 ft NAVD88.
INPUTS
SEA LEVEL RISE

PROBABILISTIC /


HYDRODYNAMIC MODEL

TROPICAL / EXTRATROPICAL STORMS
LANDSCAPE ELEVATION
CHANGING CLIMATE
Includes relevant physical processes: sea level rise, tides, storm surge, wind, wave setup / run-up / overtopping, future climate scenarios

Future version to incorporate coastal erosion
FLOOD PROBABILITY
FLOOD DEPTH
FLOOD
DURATION

FLOOD VOLUMES
FLOOD
PATHWAYS
WINDS
WAVES

CURRENTS OUTPUTS


Boston Harbor (NOAATide Gauge)*
#1 9.65 ft NAVD88 Winter Storm Grayson (1/4/18)
#2 9.59 ft NAVD88 Blizzard of ’78 (2/7/78)
*Note: Historic water levels recorded at the Boston tide gauge may not be representative of actual storm surge elevations in Manchester Harbor; comparisons are an approximation only and should only be used to put future water levels into a local context.
Warren B., M. Reilly and G. Belfit (2018) Town of Manchester-by-the-Sea Community Resilience Building Workshop Summary of Findings. Salem Sound Coastwatch,Tighe & Bond,Town of Manchester-by-the-Sea, Massachusetts.
Boston Harbor (NOAATide Gauge)*
#5 8.63 ft NAVD88 Perfect Storm (10/30/91)
*Note: Historic water levels recorded at the Boston tide gauge may not be representative of actual storm surge elevations in Manchester Harbor; comparisons are an approximation only and should only be used to put future water levels into a local context.
Boston Harbor (NOAATide Gauge)
#8 8.46 ft NAVD88 Christmas Storm (12/23/22)
Woods Hole Group’s tide gauge was in the water for the 12/23/22 storm and recorded a maximum water level of 8.33 ft
NAVD88 locally in Manchester Harbor

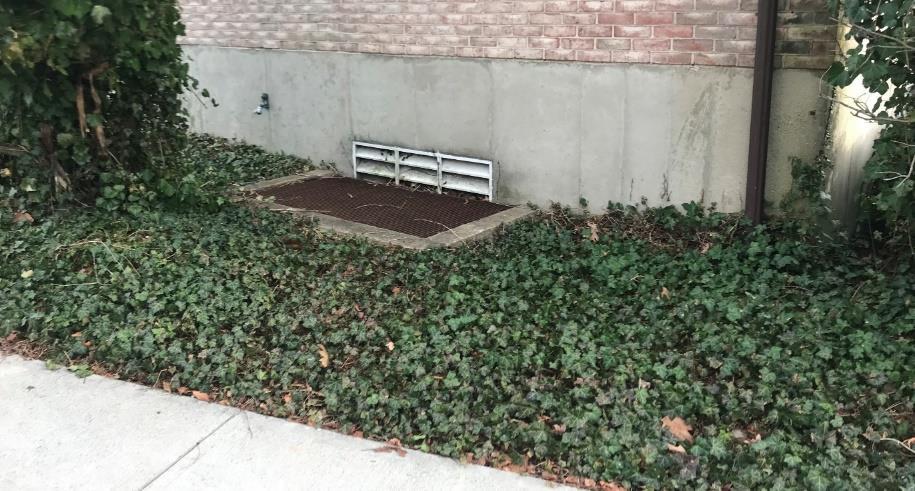

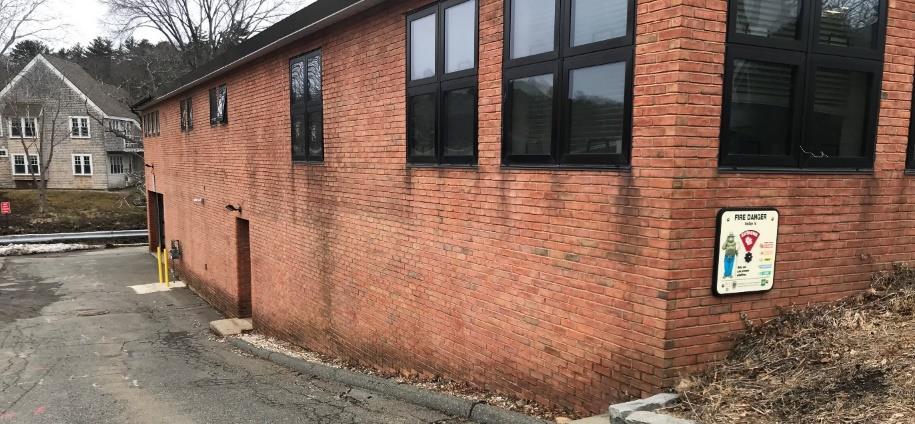
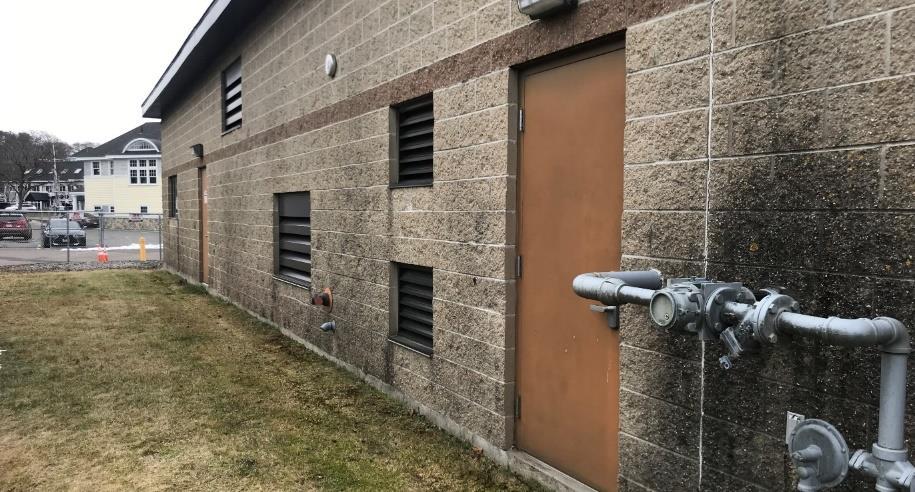
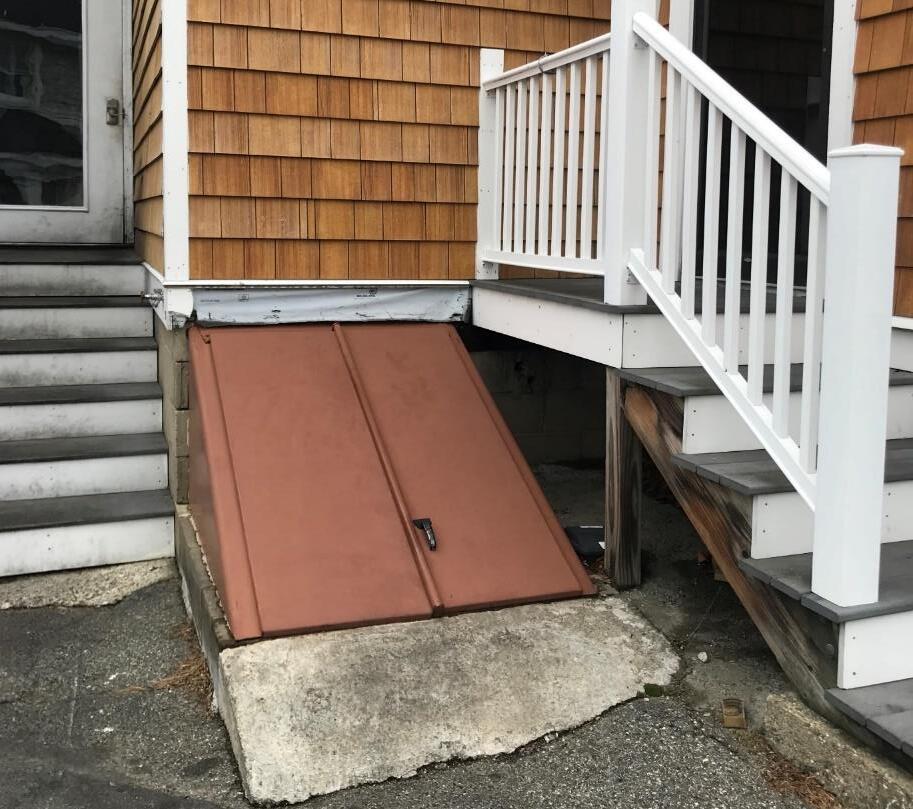
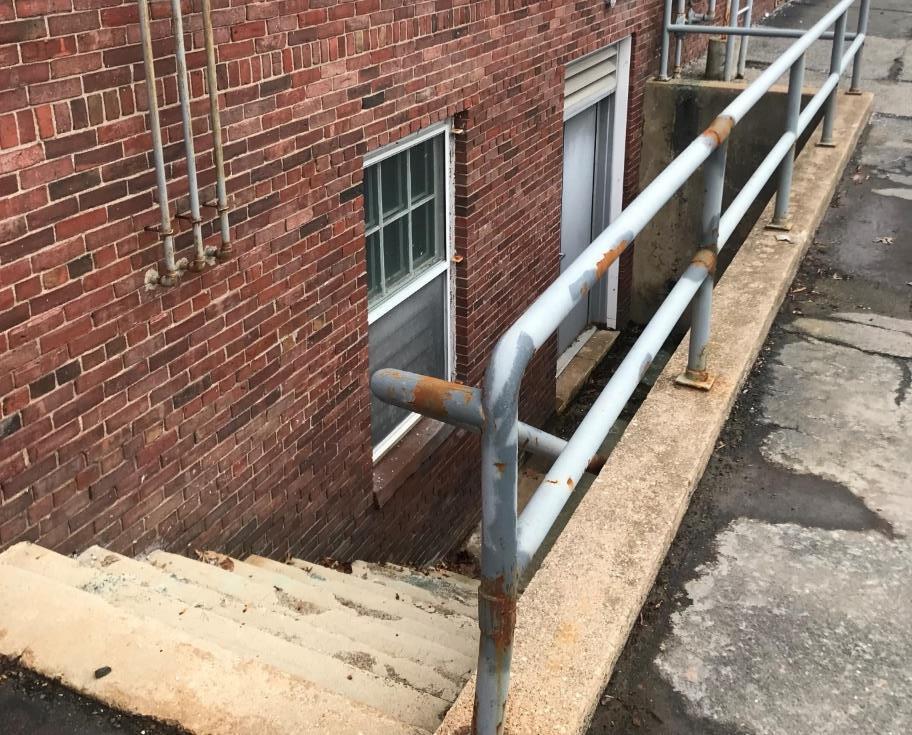
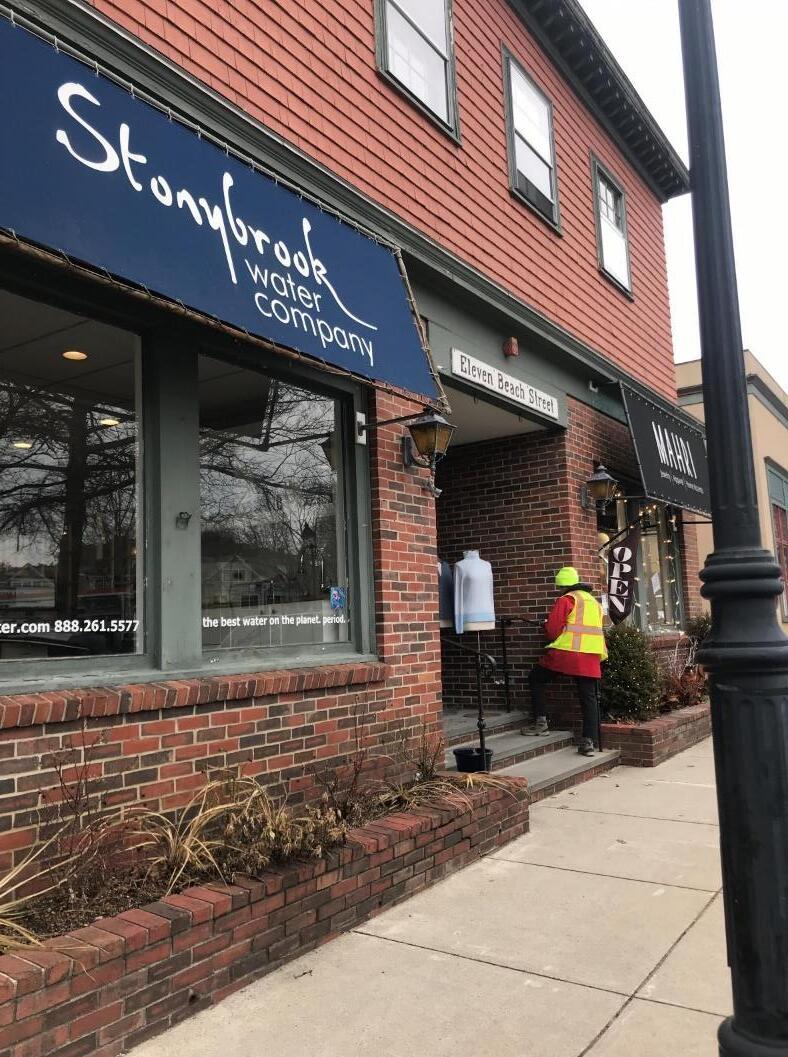
*CEs from surveyed lower-level entry points where available or from minimum LiDAR elevation within building footprint
*CEs from surveyed lower-level entry points where available or from minimum LiDAR elevation within building footprint
*CEs from surveyed lower-level entry points where available or from minimum LiDAR elevation within building footprint
Identify potential neighborhood-scale and sitescale alternatives
Maximize the potential of nature-based and hybrid design approaches
Propose phasing of improvements
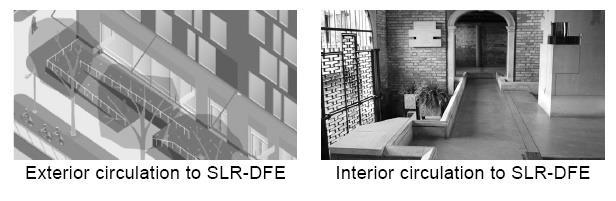
Building Form +
Access
Building
Adaptation
Building Systems Site
(Credit: Modified from Boston Planning & Development Agency, Coastal Flood Resilience Design Guidelines)
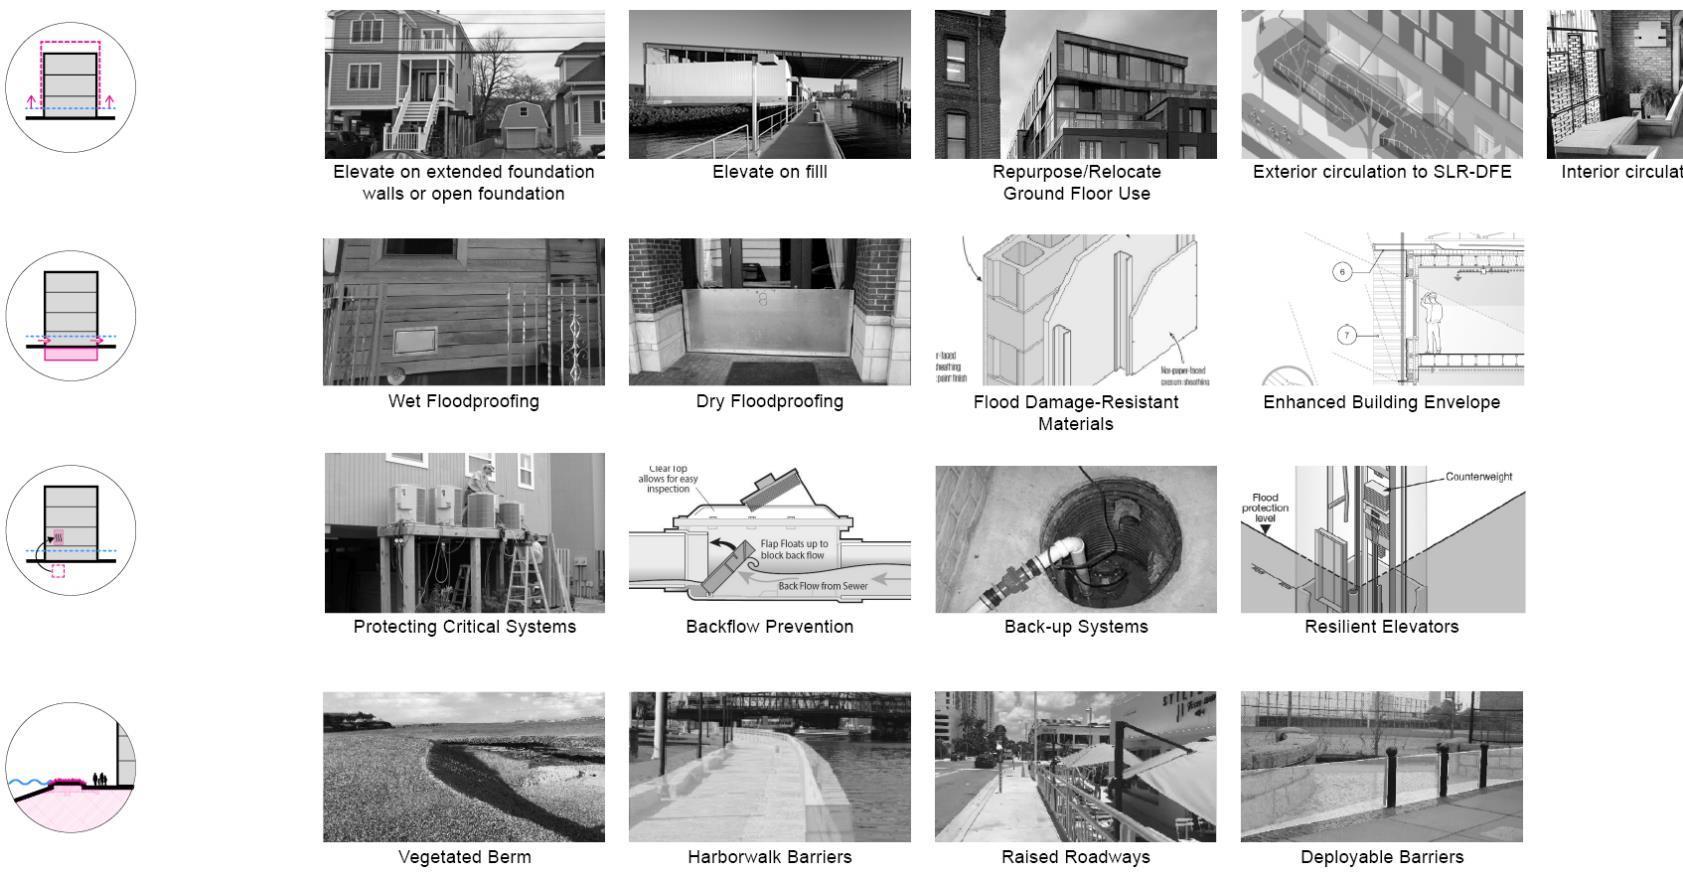
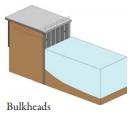
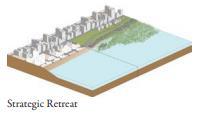
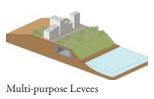
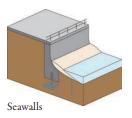
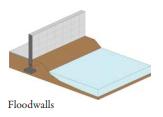
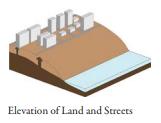
Protect (hardened infrastructure)
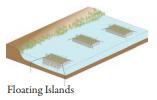
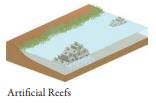
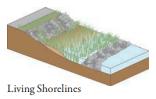
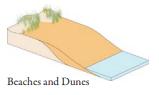
Protect (natural or nature-based infrastructure)


Protect (hybrid infrastructure)
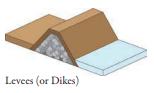
Relocate/Retreat
(Credit: Modified from NYCPlanning, Coastal Climate Resilience Urban Waterfront Adaptive Strategies)


Thank you for your time and we look forward to engaging with you as the project moves forward
Contact:
Alex Maxwell, Resilience Planner | Project Manager, Fuss & O’Neill: amaxwell@fando.com Joseph Famely, Climate & Sustainability Team Lead | Woods Hole Group: jfamely@woodsholegroup.com