OMAINTEC JOURNAL
(Journal of Scientific Review)
ISSU# 04 - December 2022 OMAINTEC.org

A refereed scientific journal issued semi- Annual by the Arab Council of Operation and Maintenance.
Publisher
The Arab Council of Operation and Maintenance

Address & Contact Info
Registerd NGO in Switzerland – Lugano
Via delle scuole 13 , 6900 Paradiso, Switzerland
Riyadh Liason Office:
PO Box 19419 Riyadh 11435 , KSA
Tel: +966 11 460 8822
Fax: +966 11 4608282
Website: www.omaintec.org
Email: ejournal@omaintec.org
© Copy rights reserved for The Arab Council of Operation and Maintenance
www.omaintec.org
It is not permitted to reproduce, publish or print the articles or data contained in the magazine by any means without the prior approval of the Arab Council of Operation and Maintenance.
It is permitted only to download the PDF files for research purposes and postgraduate studies.
Prof. Mufid Samarai
Senior Advisor at Sharjah Research Academy & Member of the Board of Trustees of the Arab Operations & Maintenance Council
Dr. Zohair Al-Sarraj
Chairman of International Maintenance Association (IMA) & Vice Chairman of the Board of Trustees of the Arab Operations & Maintenance Council
Dr. Adel Al Shayea
Associate Professor at King Saud University, KSA
Prof. Essam Sharaf
Member of the Board of Trustees of Arab Operations & Maintenance Council
Dr. Mohammed Al-Fouzan
Chairman of the Board of Trustees of the Arab Operations & Maintenance Council
Prof. Emad Shublaq
Member of the Board of the Arab Operations & Maintenance Council
Dr. Alan Wilson
Founder and Chairman of the UK Computer Aided Maintenance Management Group, founder member of IMA
James Kennedy former Chairman of Council of Asset Management (Australia) & IMA Board Member.
Prof. Wasim Orfali
Dean of the Faculty of Engineering / University of Taiba / Saudi Arabia
Prof. Osama Awad Al-Karim
University of Pennsylvania / USA
Professor Adolfo Crespo Marquez SUPSI University (Switzerland)
Mr. Khairy Al-Kubaisi
University of Taiba / Saudi Arabia
Eng. Basim Sayel Mahmoud , Secretary
General - Arab Council of Operation & Maintenance
Dr. Alan Wilson
Dr. Zohair Al-Sarraj
The magazine aims to be a distinctive platform through:
• Creating common ground of discussion among researchers, academics and Arab specialists in the operation and maintenance, facilities management and asset management sectors.
• Encouraging research in the operation and maintenance, facilities management and asset management sectors, and proper management of properties. The magazine will conduct research, scientific reviews or technical studies on the following topics in these sectors:
Operations and Maintenace Management
Transformation for Asset
Management
Maintenance
Performance Indicators
Safety Management Systems
KPI
Methodologies And definition
Asset Management Strategy planning in facilities & asset management
Total cost of ownership
Energy Management
facilities
Management
Operations and Maintenace Standards
Environment
Management Systems
Health and safety polices
1 Professor, Department of Civil Engineering, University of Baghdad, Iraq *Corresponding author, email: saadisasarsam@coeng.uobaghdad.edu.iq
2Department of Civil Engineering, University of Baghdad, Iraq email: engsaad09@yahoo.com
Abstract
Utilizing reclaimed asphalt pavement (RAP) in new asphalt mixtures has increased in recent years because of its economic and environmental benefits. The flexibility of recycled asphalt concrete (with cutback and emulsion) in terms of resilient modulus (Mr), rutting resistance, and permanent microstrain have been investigated in this work. Cylindrical specimens of 102 mm in diameter and 102 mm in height have been prepared from the recycled mixture after the short -term aging process. Specimens were subjected to 1200 repeated compressive stresses at (25) ºC. The vertical permanent microstrain was monitored through video capture. It was concluded that RAP mixture can hold the applied loading with minimal permanent deformation as compared to the recycled mixtures . The resilient modulus is lower by (24 and 39) % for mixes recycled with cutback and emulsion respectively as compared to that of RAP. The rate of strain (slope) increases by 11 % and 4 % when cutback and emulsion were implemented as recycling agents respectively as compared to that for RAP mixture.
Keywords: Recycling; Asphalt Concrete; Rutting; Resilient Modulus; Permanent strain
1 Introduction
The challenge facing road engineers is to develop a sustainable asphalt mixture that reduces pavement system failure by developing new road materials and new methods of road construction and maintenance, [1]. Progress in road material science has focused on aged and waste materials, such as RAP, likely because of the continued availability of low-cost materials and due to the functional design of asphalt pavements. Recycling can provide the RAP, which is an important economical saving, RAP is usually considered to be a cost-effective pavement construction material that is placed in the pavement at increasing percentages, [2]. Many researchers had indicated the economic benefits of recycling, [3]. construction and reconstruction of road pavements imply a considerable consumption of valuable and non -renewable natural resources and the component materials of asphalt mixtures, [4]. The properties of the recycled mixture are believed to be mainly influenced by the aged, reclaimed asphalt pavement (RAP) binder properties, and the amount of RAP in the mixture, [5]. Asphalt binder loses many of its oil components during construction and service resulting in a high proportion of asphaltenes in the blend, wh ich leads to increased stiffness and viscosity of the binder and decreased ductility, making the binder hard and brittle, [6]. To recycle this hard and brittle aged pavement, the asphalt must be returned or changed to have the rheological properties of the original asphalt. This transformation is completed by adding liquid additives to the mixture being recycled, these additives have been called recycling agents or softening agents, [7]. Rejuvenating emulsions are normally used, containing oils that reduce the viscosity of aged asphalt cement, thus improving the adhesion and cohesion properties, as well as the flexibility of the binder. In addition, rejuvenators can penetrate the voids of the pavement, filling them and minimizing binder oxidation, [8]. The r utting resistance of recycled mixtures was studied by [9]. Four mixtures with RAP percentages of 0%, 15%, 30% and 50%, were tested. Results obtained from the wheel tracking test indicated that RAP mixtures have very similar rut depth values at the end of t he test when calculated between cycles 5000 and 10,000 which means that the presence of RAP in mixtures provides greater resistance to rutting. laboratory investigation of permanent deformation characteristics of asphalt concrete mixes containing reclaimed materials was presented by [10]. The permanent deformation characteristics of asphalt concrete with and without reclaimed materials were evaluated in the laboratory using the Repeated Load Axial Test and Wheel Tracking Test at a range of test temperatures. Test results showed that the asphalt concrete prepared using reclaimed materials such as waste plastic and Reclaimed Asphalt Pavement (RAP) was more resistant to permanent deformation over a range of temperatures. The use of resilient modulus testing to compare mixtures compacted with only virgin materials to those compacted with varying amounts of RAP was conducted by [11]. Resilient modulus testing was conducted in accordance with ASTM D 4123-82. The test was performed at 0.33, 0.5, and 1 Hz. In a 1 -Hz test, the applied cycles consisted of a 0.1-second load followed by a 0.9-second rest period. It was concluded that the resilient modulus rapidly decreases with increasing temperature. This is due to the softening of the asphalt binder as the temperature increases
In this investigation, the variation in the flexibility of the RAP and recycled asphalt concrete pavement (with cutback and emulsion) in terms of resilient modulus (Mr), rutting resistance, and permanent microstrain have been investigated.
The reclaimed asphalt mixture was obtained by the rubblization of the binder course layer of asphalt concrete of the highway in the province of Babylon. This highway heavily deteriorated with various cracks and ruts existing on the surface. The reclaimed asphalt mixture obtained was assured to be free from deleterious substa nces and loam that gathered on the top surface. The reclaimed mixture was heated, combined , and reduced to testing size as per AASHTO, [12]; a representative sample was subjected to an Ignition test according to AASHTO T 308, [12] procedure to obtain binde r and filler content, gradation, and properties of aggregate. Table 1. Presents the properties of aged materials after the Ignition test.
Gradation for the RAP obtained from the reclaimed mixture was determined; six samples have been selected randomly from the publication process of the material stack. These samples were subjected to an Ignition test to isolate binder from aggregate and then aggregate was sieved and separated to various sizes to calculate gradation for each sample. The differences between samples were to a minor extent, and the average gradation of the six samples obtained to be the old aggregate gradation is shown in Fig ure 1 which illustrates that the gradation of old (reclaimed) aggregate for the binder layer has slimly deviation with Specification limits of Roads and Bridge SCRB, [13].

Two types of liquid asphalt have been implemented as recycling agents based on the available literature, [1, 4, 5, 6, and 14]. They are medium-curing cutbacks and cationic emulsions
Medium curing cutback (MC-30) obtained from the Al-Dura refinery was adopted for recycling in this work. The properties are listed in Table 2.
Cationic emulsion obtained from ministry of industry and minerals was adopted for recycling in this work, the properties are listed in Table 3.
The recycled mixture consists of 100 % reclaimed pavement RAP and a recycling agent mixed together at specified percentages according to the mixing ratio. First, RAP was heated to approximately 160º C and liquid asphalt was added to the heated RAP at the desired amount of 0.5% by weight of the mixture and mixed for two minutes until all mixture was visually coated with recycling agent as addressed by [1]. The recycled mixture was prepared using two types of liquid asphalt: medium curing cutback and cationic emulsion.
The recycled mixture was heated to 130°C to become loose and then diffuses in shallow trays with 3cm thickness and subjected to accelerated aging by laying inside an oven at 135°C for 4 hours as per the Superpave procedure, [12, and 16]. The mix was stirred every 30 m inutes during the short-term aging to prevent the outside of the mixture from aging more than the inner side because of increased air exposure.
A cylindrical specimen of 102 mm in diameter and 102 mm in height has been prepared from the recycled mixture after the short-term aging process. The mold, spatula, and compaction hammer were heated on a hot plate to a temperature of 150º C. A piece of non -absorbent paper, cut to size, was placed in the bottom of the mo ld before the mixture was introduced. The asphalt mixture was placed in the preheated mold, and then it was spaded drastically with a heated spatula 15 times around the perimeter and 10 times around the interior. Another piece of non -absorbent paper cut to size was placed on top of the mix. The temperature of the mixture immediately prior to compaction temperature was 150ºC. The mold assembly was placed on the compaction pedestal and subjected to static compaction. The mixture was compressed at the top and bottom at a temperature of 150 °C under an initial load of 1Mpa to set the mixture versus the sides of the mold, after that the required load to achieve the target density of 2.372 gm/cm 3 was applied for two minutes and the specimen was left to cool at room temperature for 24 hours and then it was removed from the mold using the mechanical jack. Specimens were implemented for the Repeated compressive stresses test. Details of obtaining the target density were published elsewhere, [17]. Fig ure 2 exhibit part of the prepared cylindrical specimens.
Asphalt concrete specimens were subjected to repeated compressive stresses in the pneumatic repeated load system PRLS. The axial repeated load was app lied to the specimen and the axial permanent deformation was measured. Compressive loading was applied in the form of a rectangular wave with a constant loading frequency of 60 cycles per minute and the loading sequence for each cycle is 0.1-sec load duration and 0.9 sec. Load repetitions were applied under constant three
stress levels of (0.069, 0.138, and 0.207) MPa , while the testing temperatures of (25) ºC were implemented in the test. Figure 3 exhibit the repeated compressive stress setup. The permanent vertical strain is measured as a function of the number of load applications recognizing the fact that the lower permanent strain is related to the lower sensitivity for rutting and corrugation. The ac cumulation of permanent and resilient strains (εp and εr) was monitored directly through continuous video capture, while the resilient modulus (Mr) was calculated using equations 1 and 2, [16 and18]. Specimens have been tested under three stress levels.
(1)
where:
σ: repeated diametral stress (N/mm²)
t: the thickness of specimen (mm).
P: applied load (N)
h: specimen diameter (mm).

(2)
Where:
Mr: resilient modulus (N/mm²).
σ: repeated diametral stress (N/mm²).
εr: vertical resilient strain (mm/mm).
Figure 4 exhibit the influence of the stress level on resilient modules for the aged and recycled mixture (cutback and emulsion) under compressive stress at 25 °C after 1200 load repetitions. The resilient modulus increases up to a stress level of 0.138 KPa, then decreases when the stress level increases to 0.207 MPa. The highest resilient modulus could be achieved at 0.138 MPa level of stress for all mixtures. This may be attribut ed to that the recycled mixture requirement of strength is suitable under the moderate traffic loading condition. A higher stress level of 0.207 MPa will possess extra tensile stresses which the mixture is unable to accommodate, then the resilient modulus is decreased. On the other hand, a lower stress level of 0.069 MPa will not exhibit a high impact on the resilient modulus. It can also be observed that the RAP mixture exhibits a resilient modulus of 171 MPa, while the recycled mixtures show lower resilient modulus by (24 and 39) % for mixes recycled with cutback and emulsion respectively as compared to that of the aged mixture. Such results agree with [16] work.
Figure 5 shows the impact of stress level on the permanent deformation parameter of aged and recycled mixture with (cutback and emulsion) after 1200 load repetitions, it can be obser ved that while the stress level increases, the intercept value, and the slope increase as well for different mixtures. The rate of increase for RAP (aged) asphalt concrete is (37.5, and 45.3) % for 0.138 and 0.207 MPa stress levels as compared to that at 0 .069 MPa. For recycled mixture with (cutback), the rate of increases is (17, and 25) % as compared to that at 0.069 MPa.

For recycled mixture with (emulsion), the rate of increases is (12, and 17) % as compared to that at 0.069 MPa. The rate of change in slope value is different for different stress levels and different mixtures. At a moderate stress level of 0.138 MPa, the recycled mixture with cutback asphalt shows a lower intercept value by 2 % as compared to that of RAP mixture, while the recycled mixture with emulsion exhibit a higher intercept value by 14 % as compared to an of RAP mixture. On the other hand, the rate of strain (slope) increases by 11 % and 4 % when cutback and emulsion were used as recycling agents respectively as compared to that for RAP mixture. this may be attributed to the more flexible nature of recycled asphalt concrete as compared to RAP. Such test results agree with [16 and 18] work.

Figure 6 exhibits the rutting performance of various asphalt concrete mixtures; it can be observed that the stiffer RAP mixture can hold the applied loading with minimal permanent deformation as compared to the recycled mixtures. At a high-stress level of 207 kPa, the permanent strain increases by (20 and 28) % for recycled mixtures wit h cutback and emulsion respectively as compared to RAP mixture. Table 4 demonstrates the mathematical models regarding the resistance to rutting of asphalt concrete where (Y) represent the permanent deformation (microstrain) and (X) denotes the load repetitions. A similar rutting trend was reported by [14].

4 Conclusions
Based on the testing program, the following conclusions could be drawn:
1- The resilient modulus is lower by (24 and 39) % for mixes recycled with cutback and emulsion respectively as compared to that of RAP (aged) mixture at a moderate stress level of 0.138 MPa.
2- The resilient modulus increases up to a stress level of 0.138 KPa, then decreases when the stress level increases to 0.207 MPa. The highest resilient modulus could be achieved at 0.138 MPa level of stress for all mixtures.
3- At a moderate stress level of 0.138 MPa, the recycled mixture with cutback asphalt shows a lower intercept value by 2 % as compared to that of RAP mixture, while the recycled mixture with emulsion exhibit a higher intercept value by 14 % as compared to to that of RAP mixture.
4- The rate of strain (slope) increases by 11 % and 4 % when cutback and emulsion were implemented as recycling agents respectively as compared to that for RAP mixture.

[1] Sarsam S. “A study of aging and recycling of Asphalt Concrete pavement. University of Sharjah ” , Journal of pure and applied Sciences, Sharjah UAE Vol.4 No.2 June- P79-94. (2007)
[2] B. Colbert, and You, Z., “The Determination of Mechanical Performance of Laboratory Produced Hot Mix Asphalt Mixtures Using Controlled RAP and Virgin Aggregate Size Fractions ” , Construction and Building Materials, Vol. 26, pp. 655- 662. (2012).
[3] NCHRP Synthesis 495. “Use of Reclaimed Asphalt Pavement and Recycled Asphalt Shingles in Asphalt Mixtures. A Synthesis of Highway Practice” National Cooperative Highway Research Program. Project 20-05, Topic, 46-05. (2016).
[4] I. Al-Qadi, E Seifi, M., and Carpenter, S., “Reclaimed Asphalt Pavement A Literature Review” , Report No. FHWAICT-07-001, Illinois Center for Transportation , Rantoul, IL. (2007)
[5] P. S. Kandhal, and Mallick R.B., “Pavement Recycling Guidelines for State and Local Governments Participant's Reference Book” , Report No. FHWA-SA-98-042, Federal Highway Administration Office of Engineering. (1997).
[6] A. Copeland, “Reclaimed Asphalt Pavement in Asphalt Mixtures: State of the Practice” , Report No. FHWA-HRT-11021, Report Date April (2011)
[7] H. M. Silva, Oliveira J.R.M., and Jesus, C.M.G., “Are totally recycled hot mix asphalts a sustainable alternative for road paving?” Resources, Conservation and Recycling , Vol. 60, PP. 38-48. (2012).
[8] K. A. O’Sullivan, “Rejuvenation of Reclaimed Asphalt Pavement (RAP) in Hot Mix Asphalt Recycling with High RAP Content” , M.Sc. thesis, Worcester Polytechnic Institute. (2011).
[9] R. Miro, Valdés, G., Martinez, A., Segura, P., Rodriguez, C. , “Evaluation of High Modulus Mixture Behavior with High Reclaimed Asphalt Pavement (RAP) Percentages for Sustainable Road Construction ” , Construction and Building Materials, Vol. 25, PP. 3854–3862. (2011).
[10] I. Aschuri, Woodward D. and Woodside A., “Permanent deformation characteristics of asphalt concrete containing reclaimed materials” , International Society for Maintenance and Rehabilitation of Transportation Infrastructure; technical report, Transportation Research Board. (2009).
[11] M. S. Sondag, Chadbourn, B.A., and Drescher, A., “Investigation of Recycled Asphalt Pavement (RAP) Mixtures ” , Report No. MN/RC – 2002-15, Minnesota Department of Transportation. (2002).
[12] AASHTO. “Standard Specification for Transportation Materials and Methods of Sampling and Testing” , American Association of State Highway and Transportation Officials , 14th Edition, Part II, Washington, D.C. (2013).
[13] SCRB, “General Specification for Roads and Bridges, Section R/9 Hot -Mix Asphalt Concrete Pavement”, Revised Edition, State Corporation of Roads and Bridges, Ministry of Housing and Construction , Republic of Iraq. (2003).
4 Conclusions
Based on the testing program, the following conclusions could be drawn:
1- The resilient modulus is lower by (24 and 39) % for mixes recycled with cutback and emulsion respectively as compared to that of RAP (aged) mixture at a moderate stress level of 0.138 MPa.
2- The resilient modulus increases up to a stress level of 0.138 KPa, then decreases when the stress level increases to 0.207 MPa. The highest resilient modulus could be achieved at 0.138 MPa level of stress for all mixtures.
3- At a moderate stress level of 0.138 MPa, the recycled mixture with cutback asphalt shows a lower intercept value by 2 % as compared to that of RAP mixture, while the recycled mixture with emulsion exhibit a higher intercept value by 14 % as compared to to that of RAP mixture.
4- The rate of strain (slope) increases by 11 % and 4 % when cutback and emulsion were implemented as recycling agents respectively as compared to that for RAP mixture.
[1] Sarsam S. “A study of aging and recycling of Asphalt Concrete pavement. University of Sharjah ” , Journal of pure and applied Sciences, Sharjah UAE Vol.4 No.2 June- P79-94. (2007)
[2] B. Colbert, and You, Z., “The Determination of Mechanical Performance of Laboratory Produced Hot Mix Asphalt Mixtures Using Controlled RAP and Virgin Aggregate Size Fractions ” , Construction and Building Materials, Vol. 26, pp. 655- 662. (2012).
[3] NCHRP Synthesis 495. “Use of Reclaimed Asphalt Pavement and Recycled Asphalt Shingles in Asphalt Mixtures. A Synthesis of Highway Practice” National Cooperative Highway Research Program. Project 20-05, Topic, 46-05. (2016).
[4] I. Al-Qadi, E Seifi, M., and Carpenter, S., “Reclaimed Asphalt Pavement A Literature Review” , Report No. FHWAICT-07-001, Illinois Center for Transportation , Rantoul, IL. (2007)
[5] P. S. Kandhal, and Mallick R.B., “Pavement Recycling Guidelines for State and Local Governments Participant's Reference Book” , Report No. FHWA-SA-98-042, Federal Highway Administration Office of Engineering. (1997).
[6] A. Copeland, “Reclaimed Asphalt Pavement in Asphalt Mixtures: State of the Practice” , Report No. FHWA-HRT-11021, Report Date April (2011)
[7] H. M. Silva, Oliveira J.R.M., and Jesus, C.M.G., “Are totally recycled hot mix asphalts a sustainable alternative for road paving?” Resources, Conservation and Recycling , Vol. 60, PP. 38-48. (2012).
[8] K. A. O’Sullivan, “Rejuvenation of Reclaimed Asphalt Pavement (RAP) in Hot Mix Asphalt Recycling with High RAP Content” , M.Sc. thesis, Worcester Polytechnic Institute. (2011).
[9] R. Miro, Valdés, G., Martinez, A., Segura, P., Rodriguez, C. , “Evaluation of High Modulus Mixture Behavior with High Reclaimed Asphalt Pavement (RAP) Percentages for Sustainable Road Construction ” , Construction and Building Materials, Vol. 25, PP. 3854–3862. (2011).
[10] I. Aschuri, Woodward D. and Woodside A., “Permanent deformation characteristics of asphalt concrete containing reclaimed materials” , International Society for Maintenance and Rehabilitation of Transportation Infrastructure; technical report, Transportation Research Board. (2009).
[11] M. S. Sondag, Chadbourn, B.A., and Drescher, A., “Investigation of Recycled Asphalt Pavement (RAP) Mixtures ” , Report No. MN/RC – 2002-15, Minnesota Department of Transportation. (2002).
[12] AASHTO. “Standard Specification for Transportation Materials and Methods of Sampling and Testing” , American Association of State Highway and Transportation Officials , 14th Edition, Part II, Washington, D.C. (2013).
[13] SCRB, “General Specification for Roads and Bridges, Section R/9 Hot -Mix Asphalt Concrete Pavement”, Revised Edition, State Corporation of Roads and Bridges, Ministry of Housing and Construction , Republic of Iraq. (2003).
[14] S. I. Sarsam, AL-Zubaidi I. “Resistance to Deformation under Repeated Loading of Aged and Recycled Sustainable Pavement” American Journal of Civil and Structural Engineering , (AJCSE), Vol. 1(2), April Sciknow Publications Ltd. USA. p34-39. (2014).
[15] ASTM. “Road and Paving Material, Vehicle-Pavement System” . American Society for Testing and Materials. Annual Book of ASTM Standards, Vol.04.03 (2009).
[16] S. I. Sarsam and AL-Shujairy A. “Influence of recycling agent type on resilient modules and rutting resistance of asphalt concrete pavement” Applied Research Journal, ARJ . Vol.2, Issue, 1, January, pp.10 -18. (2016).
[17] M. C. Saleem “Influence of Liquid Asphalt Additives on the Properties of Recycled Asphalt Concrete ” MSc. Thesis, College of Engineering, University of Baghdad, (2018).
[18] S. I. Sarsam and AL-Janabi I. “Assessing Shear and Compressive Strength of Reclaimed Asp halt Concrete” International Journal of Scientific Research in Knowledge, (IJSRK) 2(8), pp. 352-361. (2014).
Poorna Manasa Bhamidimarri1, Bassam Mahboub3, Laila Salameh3, Mahmood Hachim4, Qutayba Hamid2, Rifat Hamoudi1,2
1Sharjah Research Academy, Sharjah, UAE
2College of Medicine, University of Sharjah, Sharjah, UAE
3 Department of Pulmonology, Rashid Hospital, Dubai, UAE
4 College of Medicine, Mohammed Bin Rashid University, Medicine and Health Sciences, Dubai, UAE
Corresponding author email: rhamoudi@sharjah.ac.ae
Abstract
Asthma has been classified into subtypes based on pathophysiological conditions, immunological markers, FEV1 , and FENO values. Nevertheless, there has been no single biomarker that can differentiate between different subtypes owing to its heterogenicity. These limitations urged to development of mathematical models to deduce specific differential biomarkers for various phenotypes of asthma with the help of a systems biology approach. The current study aims at understanding the differential mRNA biomarker for severe asthma and deduces a mathematical cutoff value to predict severity from healthy control in a non-invasive approach. Here, we report two salivary mRNA biomarkers, amphiregulin (AREG) and fibrillin 2 (FBN2) that can differentiate severe asthma patients from healthy control samples collected from UAE residents. The information from the hospital records and the mol ecular profiling in the laboratory facilitated to the discovery of the above biomarkers.
Key Words: biomarkers, mathematical modeling, severe asthma
Introduction
At present, asthma cannot be defined by a single condition but has generally been described as airway hyperresponsiveness and is often associated with allergies. Asthma can be broadly classified into Th2-associated and Non-Th2-associated inflammatory responses (Wenzel, 2012). Further classified into subtypes based on pathophysiological conditions, immunological response, the fraction of exhaled nitric oxide ( FENO), and forced expiratory volume in one second ( FEV1) levels(Agache et al., 2018). The complexity in determining asthma type also falls on various environmental factors like exacerbations, infections, pollutants, allergens, and other unidentified triggers. Hence, a similar treatment cannot be provided to all the subtypes. In order to p rovide successful treatment to the patients recruited by asthma conditions, it is important to identify a specific biomarker for every sub-phenotype that can be considered as a therapeutic target. In view of the heterogenicity, unidentified triggers, and varied immunological responses, there is a need for a mathematical approach to decode the complexity and arrive at a single specific biomarker from large datasets (Tang et al., 2020)
In the global context, the systems biology approach was used to analyze the big data available from the databases and hospital records to manage asthma in the respective local populations (Richards et al., 2018) Some of the biomarkers identified using genomics, transcriptomics, epigenetics, and other “omics” technologies have been reviewed by Tang et al and the importance of enlightening clinicians with systems biology tools was also emphasized (Tang et al., 2020). By using a similar approach, a model to predict type 2-high asthma with 100% positive predictive value was developed which was otherwise solely identified using conventional markers like serum IgE levels, eosinophilic count , and FENO levels but were not consistent in detection(Silkoff et al., 2017)
The present study was considered to apply system biology tools to detect severe asthma conditions among the UAE population with the help of linear mathematical modeling and omics technology. In UAE, approximately 8 -10% of adults were known
to suffer from asthma(B. H. S. H. Mahboub et al., 2010). According to recent reports, this percentage is going to increase and it is the need of the hour to rightly distinguish severe asthma patients from mild/moderate asthmatics to improve the treatme nt prospects (B. H. Mahboub et al., 2012). Asthma can be cured if treated properly and a few earlier reports proved that specific treatments help patients to recover faster. The major challenge is to identify the appropriate biomarker and corresponding therapeutic target (Tiotiu, 2018). At the moment, the only method to overcome the problem is record keeping of the patient history, the right clinical classification, and analyzing the patient’s molecular profile by genomics, transcriptomics, and epigenetics and correlating all the parameters by machine learning tools (Vijverberg et al., 2013). By this approach, a specific biomarker for each subtype can be identified and a personalized treatmen t can be prescribed. The other important outcome of the study would be to identify markers that can predict the possibility of an individual developing severe asthma conditions in the future which helps clinicians to advise patients for any lifestyle-related modifications to avoid the disease development.
The reports from the laboratory earlier this year have established periostin (POSTN)(Hachim et al., 2020) and amphiregulin (AREG) (Hachim et al., 2020) as important biomarkers to differentiate non -severe and severe asthmatics from healthy control based on the studies on bronchial epithelial cells and ELISA method. The genome-wide association studies (GWAS) performed for specific populations worldwide in the context of asthma reported population-specific genes and possible mutations(Altman & Busse, 2017) From such studies, using image filtering algorithms and in -house developed pipelines, genes that differentially expressed for severe asthmatics were deduced (Hachim et al., 2019) These differentially expressed genes (DEG) were considered for the current study to identify specific mRNA biomarkers for severe asthma.
The major clinical manifestation of asthma is bronchi constriction which leads to difficulty in breathing. The tissue remodeling events occurring due to immunological response inside the airways and the modulatory effects of certain epidermal growth factors result in bronchi constriction (Enomoto et al., 2009). Hence, most of the studies related to asthma focus on tissue remodeling mechanisms. The major structural cell types that involve in tissue remodeling are epithelial cells, fibroblasts, and smooth muscle cells(Erle & Sheppard, 2014) In the present study, the primary cells obtained from the healthy controls and the asthmatic patients were compared for the differential biomarkers.
The unique aspect of the current investigation is to detect severe asthma-specific biomarker in saliva samples collected from asthmatics and control subjects living in UAE. Globally, studies conducted to identify asthma biomarkers largely focused on sputum, blood, bronchial brushings, and urine samples (Vijverberg et al., 2013). The salivary biomarkers for asthma known so far are proteins detected by ELISA. There are no mRNA salivary biomarkers reported to date. Therefore, the current study attempted to develop non-invasive mRNA biomarkers from saliva for severe asthma using molecular tools and mathematical modeling.
Saliva from asthma patients and healthy controls were collected according to the previous protocol (Hachim et al., 2020). Ethical approval was granted for the present study under the reference number DSREC-11/2017_04 at the University of Sharjah. The samples were collected at Rashid Hospital, Dubai, UAE. The information about the patients and the parameters required for asthma regulation was recorded at the time of sample collection.
The primary cells obtained for the bronchial brushings of asthma patients and the healthy control subject were maintained at the tissue bank facility at Sharjah Institute of Medical Research (SIMR), College of Medicine, University of Sharjah. The specific culture medium required to maintain the cells was procured from Gibco, Thermo Fisher Scientific, US , and Sigma Aldrich, US. The primary human lung fibroblast cells for both healthy (NHLF) and asthmatic (DHLF) were obtained from Lonza, Switzerland. The smooth muscle cells and epithelial cells were obtained from the patient recruited in McGill University Health Centre/Meakins-Christie Laboratories Tissue Bank, Montreal, Canada
RNA from saliva samples was isolated by Qiazol m ethod as described in (Sullivan et al., 2020)Approximately, 500 ng of RNA was used to synthesize cDNA using high-capacity cDNA synthesis kit from Applied Biosystems.
RNA was isolated from cells using Trizol method and cDNA was synthesized as described a bove.
The quantitative real-time PCR (qPCR) was performed for the cDNA obtained from both the saliva samples and the cells using primers for amphiregulin (AREG) and fibrillin 2 (FBN2) as listed in Table 2 The analysis was conducted in Quant Studio® 3 qPCR machine from Applied Biosystems.
Mathematical modeling method to determine the optimal value of the cutoff
The Index of Union method was applied to the data to determine the optimal cutoff value for the specific ge nes across the different groups (Unal, 2017). The method provides an “optimal” cut-point with the best maximum sensitivity and specificity values simultaneously and can be summarized by the following equation:
IU (c) = (|Se (c) AUC| + |Sp (c) AUC|) (1)
IU = Index of Union
AUC = Area Under Curve
Se = Sensitivity
Sp = Specificity
(c) = cutoff
IU(c) = the optimal cutoff point based on the Index of Union
Data obtained from the quantitative real-time PCR were analyzed by using an in-house R script and the P value was obtained using Mann Whitney U test between the groups.
The whole saliva samples were collected from 10 healthy controls, 2 0 moderate asthma patients, and 18 severe asthmatics. The information regarding patient disease history and certain other characteristics was recorded using Salama Electronic Medical Record System launched by Dubai Health Authority (DHA).
From the records, patient history and characteristics were retrieved and were classified into moderate and severe asthma based on the FEV1 values, the number of asthma attacks, and hospitalization frequency (Table 1). Hence, it is important to maintain the clinical records with complete information and up to date.
The major cell types known to involve in tissue remodeling are smooth muscle cells, epithelial cells , and fibroblasts. From the qPCR data, it is evident that AREG is highly expressed in asthmatic smooth muscle cells and epithelial cells. This data is consistent with the earlier known fact that AREG is upregulated in injured lung tissues and bronchial epithelial cells (Kuwano et al., 2017).
Similarly, FBN2 was upregulated in both the asthmatic smooth muscle cells and epithelial cells. Surprisingly, both genes showed no significant difference among the diseased fibroblast cells indicating their specific function in the preliminary ti ssue remodeling events.
Among the asthmatics, moderate/non-severe patients could be differentiated from the severe asthmatics based on the expression profile for AREG and FBN2 genes. Severe asthmatics showed highe r expression for AREG and lower for FBN2 as compared to moderate asthmatics. Both genes showed a significantly higher expression in asthmatics than in healthy controls indicating that they can be used as asthma biomarkers. In addition, the differential pat tern of expression among moderate and severe asthma can be exploited to differentiate the severity of the condition among the patient samples.
Based on the Index of Union mathematical equations, an optimal cutoff value to differentiate severe from moderate asthmatics was deduced for both AREG and FBN2 genes in saliva. The fold change greater than 15 for FBN2 differentiates non -severe asthmatics from severe. And a fold chang e cut-off value 2 for AREG differentiates asthmatics from healthy controls. A combined profile for both AREG and FBN2 could be used to predict the severity of asthma among the patients.
From the study, a cutoff value was determined for two salivary mRNA biomarkers amphiregulin and fibrillin 2 using a linear mathematical model and the information from patient records to assess the severity of asthma in a non-invasive approach. The expression profile from the cells involved in tissue remodeling validated the mRNA biomarkers considered in the study. In the future, a similar study on larger datasets and robust mathematical modeling tools could help deduce a functional cutoff value that can be used to differentiate and predict s evere asthma samples from moderate asthmatics and prescribe personalized medication.
This research has been financially supported by Sharjah Research Academy (Grant code: MED001); the University of Sharjah (Grant code: 1901090254).
Agache, I., Strasser, D. S., Pierlot, G. M., Farine, H., Izuhara, K., & Akdis, C. A. (2018). Monitoring inflammatory heterogeneity with multiple biomarkers for multidimensional endotyping of asthma. Journal of Allergy and Clinical Immunology, 141(1), 442–445. https://doi.org/10.1016/j.jaci.2017.08.027
Altman, M., & Busse, W. W. (2017). A Deep Dive into Asthma Transcriptomics. American Journal of Respiratory and Critical Care Medicine, 195, 1279–1280.
Enomoto, Y., Orihara, K., Takamasu , T., Matsuda, A., Gon, Y., Saito, H., Ra, C., & Okayama, Y. (2009). Tissue remodeling induced by hypersecreted epidermal growth factor and amphiregulin in the airway after an acute asthma attack. Journal of Allergy and Clinical Immunology , 124(5), 913-920.e7. https://doi.org/10.1016/j.jaci.2009.08.044
Erle, D. J., & Sheppard, D. (2014). The cell biology of asthma. Journal of Cell Biology , 205(5), 621–631. https://doi.org/10.1083/jcb.201401050
Hachim, M. Y., Elemam, N. M., Ramakrishnan, R. K., Hachim, I. Y. , Salameh, L., Mahboub, B., al Heialy, S., Halwani, R., Hamoudi, R., & Hamid, Q. (2020). Confounding patient factors affecting the proper interpretation of the periostin level as a biomarker in asthma development. Journal of Asthma and Allergy , 13, 23–37. https://doi.org/10.2147/JAA.S230892
Hachim, M. Y., Mahboub, B., Hamid, Q., & Hamoudi, R. (2019). Identifying Asthma genetic signature patterns by mining Gene Expression BIG Datasets using Image Filtering Algorithms. IST 2019 - IEEE International Conference on Imaging Systems and Techniques, Proceedings , 1–6. https://doi.org/10.1109/IST48021.2019.9010412
Hachim MY, Elemam NM, Ramakrishnan R , Salameh L , Olivenstein R, Hachim I , Venkatachalam T, Mahboub B, Heialy S , Halwani R, H. Q. and H. R. (2020). Blood and Salivary Amphiregulin levels as biomarkers for Asthma. Frontiers Medicine, 10.3389/fm
Kuwano, K., Yanagihara, T., Hamada, N., Ikeda -Harada, C., Yokoyama, T., Suzuki, K., Kawaguchi, T., Maeyama, T., & Nakanishi, Y. (2017). Amphiregulin suppresses epit helial cell apoptosis in lipopolysaccharide -induced lung injury in mice. Biochemical and Biophysical Research Communications , 484(2), 422–428. https://doi.org/10.1016/j.bbrc.2017.01.142
asthma samples from moderate asthmatics and prescribe personalized medication.
This research has been financially supported by Sharjah Research Academy (Grant code: MED001); the University of Sharjah (Grant code: 1901090254).
Reference
Agache, I., Strasser, D. S., Pierlot, G. M., Farine, H., Izuhara, K., & Akdis, C. A. (2018). Monitoring inflammatory heterogeneity with multiple biomarkers for multidimensional endotyping of asthma. Journal of Allergy and Clinical Immunology, 141(1), 442–445. https://doi.org/10.1016/j.jaci.2017.08.027
Altman, M., & Busse, W. W. (2017). A Deep Dive into Asthma Transcriptomics. American Journal of Respiratory and Critical Care Medicine, 195, 1279–1280.
Enomoto, Y., Orihara, K., Takamasu , T., Matsuda, A., Gon, Y., Saito, H., Ra, C., & Okayama, Y. (2009). Tissue remodeling induced by hypersecreted epidermal growth factor and amphiregulin in the airway after an acute asthma attack. Journal of Allergy and Clinical Immunology , 124(5), 913-920.e7. https://doi.org/10.1016/j.jaci.2009.08.044
Erle, D. J., & Sheppard, D. (2014). The cell biology of asthma. Journal of Cell Biology , 205(5), 621–631. https://doi.org/10.1083/jcb.201401050
Hachim, M. Y., Elemam, N. M., Ramakrishnan, R. K., Hachim, I. Y. , Salameh, L., Mahboub, B., al Heialy, S., Halwani, R., Hamoudi, R., & Hamid, Q. (2020). Confounding patient factors affecting the proper interpretation of the periostin level as a biomarker in asthma development. Journal of Asthma and Allergy , 13, 23
37. https://doi.org/10.2147/JAA.S230892
Hachim, M. Y., Mahboub, B., Hamid, Q., & Hamoudi, R. (2019). Identifying Asthma genetic signature patterns by mining Gene Expression BIG Datasets using Image Filtering Algorithms. IST 2019 - IEEE International Conference on Imaging Systems and Techniques, Proceedings , 1–6. https://doi.org/10.1109/IST48021.2019.9010412
Hachim MY, Elemam NM, Ramakrishnan R , Salameh L , Olivenstein R, Hachim I , Venkatachalam T, Mahboub B, Heialy S , Halwani R, H. Q. and H. R. (2020). Blood and Salivary Amphiregulin levels as biomarkers for Asthma. Frontiers Medicine, 10.3389/fm
Kuwano, K., Yanagihara, T., Hamada, N., Ikeda -Harada, C., Yokoyama, T., Suzuki, K., Kawaguchi, T., Maeyama, T., & Nakanishi, Y. (2017). Amphiregulin suppresses epit helial cell apoptosis in lipopolysaccharide -induced lung injury in mice. Biochemical and Biophysical Research Communications , 484(2), 422–428. https://doi.org/10.1016/j.bbrc.2017.01.142
Mahboub, B. H., Al-Hammadi, S., Rafique, M., Sulaiman, N., Pawankar, R ., al Redha, A. I., & Mehta, A. C. (2012). Population prevalence of asthma and its determinants based on European Community Respiratory Health Survey in the United Arab Emirates. BMC Pulmonary Medicine, 12. https://doi.org/10.1186/1471-2466-12-4
Mahboub, B. H. S. H., Santhakumar, S., Soriano, J. B., & Pawankar, R. (2010). Asthma insights and reality in the United Arab Emirates. Annals of Thoracic Medicine, 5(4). https://doi.org/10.4103/1817-1737.69109
Richards, L. B., Neerincx, A. H., van Bragt, J. J. M. H. , Sterk, P. J., Bel, E. H. D., & Maitland -Van der Zee, A. H. (2018). Biomarkers and asthma management: Analysis and potential applications. Current Opinion in Allergy and Clinical Immunology, 18(2), 96–108. https://doi.org/10.1097/ACI.0000000000000426
Silkoff, P. E., Laviolette, M., Singh, D., FitzGerald, J. M., Kelsen, S., Backer, V., Porsbjerg, C. M., Girodet, P. -O., Berger, P., Kline, J. N., Chupp, G., Susulic, V. S., Barnathan, E. S., Baribaud, F., & Loza, M. J. (2017). Identification of airway mucosal type 2 inflammation by using clinical biomarkers in asthmatic patients. The Journal of Allergy and Clinical Immunology, 140(3), 710–719.
https://doi.org/10.1016/j.jaci.2016.11.038
Sullivan, R., Heavey, S., Graham, D. G., Wellman, R., Khan, S., Thrumurthy, S., Simpson, B. S., Baker, T., Jevons, S., Ariza, J., Eneh, V., Pye, H., Luxton, H., Hamoudi, R., Whitaker, H., & Lovat, L. B. (2020). An optimised saliva collection method to produce high -yield, high-quality RNA for translational research. PLoS ONE, 15(3), 1–16.
https://doi.org/10.1371/journal.pone.0229791
Tang, H. H. F., Sly, P. D., Holt, P. G., Holt, K. E., & Inouye, M. (2020). Systems biology and big data in asthma and allergy : Recent discoveries and emerging challenges. European Respiratory Journal, 55(1).
https://doi.org/10.1183/13993003.00844 -2019
Tiotiu, A. (2018). Biomarkers in asthma: state of the art. Asthma Research and Practice , 4(1), 1–10. https://doi.org/10.1186/s40733-018-0047-4
Unal, I. (2017). Defining an optimal cut -point value in ROC analysis: An alternative approach. Computational and Mathematical Methods in Medicine , 2017. https://doi.org/10.1155/2017/3762651
Vijverberg, S. J. H., Hilvering, B., Raaijmakers, J. A. M., Lammers, J. W. J., Maitland -van der Zee, A. H., & Koenderman, L. (2013). Clinical utility of asthma biomarkers: From bench to bedside. Biologics: Targets and Therapy , 7(1), 199
210. https://doi.org/10.2147/BTT.S29976
Wenzel, S. E. (2012). Asthma phenotypes: The evolution from clinical to molecular approaches. Nature Medicine, 18(5), 716
725. https://doi.org/10.1038/nm.2678


Abstract This paper analyzes the three-case studies for aging electrical assets which have highly impacted the technical key performance indicators (KPIs) in Jubail city, Saudi Arabia. It has been discussed the optimal way for the operating expenses on that asset and shown how to be reflected in its reliability as a KPIs. The paper applied to 115 kV overhead transmission line and 13.8 kV switchgear on the National Grid SA Company. This research highlighted the benchmarks to expand the asset life cycle with minimization of the expenses or to take a decision to replace it using Markov based model
Index Terms Asset management (AM), Reliability, Key performance indicator (KPI), maintenance, Asset life cycle.
Aasset management, extending the asset life cycle, optimizing operation operational expenditure (OPEX) , and improving key performance indicators (KPIs) are substantial topics in the electrical network. The governments and national electricity companies are investing billions of dollars to build reliable electrical grids. These assets have a specified life cycle such as 30,40 or 50 years, then, after that age, the assets must be replaced or bear the consequences of its poor dependabi lity. However, there is a third option to expand the asset life using the asset management (AM) approach. AM is operating the asset on the optimal way to assuring a proper return [1].
The Asset Management (AM) on National Grid SA (NGSA) aimed to find the optimal balance between Risks, Costs, and Performance. The Asset Risk management contains several aspects to evaluate it as the compliance, the safety of assets and human, energy lost reliability, reputation, financial cost, and likelihood.
In this paper, a system consisting of an ageing 115 kV overhead transmission line and 13.8 kV switchgear. It will study the impact of (AM) on their (KPIs) included Energy Not supplied (ENS), the System average interruption duration index (SAIDI), the system average duration frequency index (SAIFI), the momentary average interruption frequency index (MAIFI), and the forced outage frequency index (FOFI). Additionally, the research assesses the (OPEX) and how to be affected by the interpretation indicators and the forced outages cost.
The OPEX on this research be made up of materials, equipment, tools, manpower costs, and the forced outages cost (FOC), the FOC comprise the same factors with opportunity costs from ENS loses which is that supposed money to gain it from the consumer in case no interruption
Asset Management (AM) aims to increase asset return while maintaining a certain level of reliability. The AM difficulty and challenges increased with the ageing of equipment. The objectives of the paper are:
• Determine and analyze the OPEX for a specific asset that considering in the paper case studies.
• Define and evaluate the technical KPIs for those assets.
• Investigate the relationship between the expenses and their impact on the KPI.
• Apply Markov based model on the case studies
The Asset Management of ageing equipment provides an optimal way for the expenses and ensures the financial and technical return on the investment is taken.
The purpose of this paper is to achieve the maximum return of operational expenditure. The return knows to be a financial, technical improvement, or minimize the asset risk
A. Main Objective Function:
The main objective function of Asset Management is a combination of three main topics, which are OPEX, KPI, and Asset risk, it can be expressed as:
Were, R Return on the investment.
OPEX Operational expenditure KPIs Key Performance Indicators.
B. Operational Expenditure:
The Operational Expenditure can be formulated in this research paper as :
OPEX = �������� + �������� + ������������ (2)
Were, MB Manpower cost
MT Materials cost
FOC Forced outages cost
C. Forced Outages Cost:
On the other hand, the forced outage costs which mainly on the interpretation time can be devised as:
������������ = Opc + MB + MT (3)
Were,
������������ = ������������ ∗ ������������ ���������������������������� (4) Opc and ENG are Opportunity cost Energy not supplied, respectively.
D. Asset Risk Register:
������������ = ������������������������������������������������ × Probaility (5)
Were,
������������������������������������������������ = ∑5(C 1 + S + ELR + R + FC) (6) ARR Asset Risk Register
C Compliance
S Safety of assets and human
ELR Energy lost reliability
R Reputation
FC Financial costs
E. Reliability Indices:
To study the power quality and reliability of the system we need to calculate different indices [2,3]
������������% = ∑(���������������� ������������(��������) ×���������������� ���������������� ��������������������������������(����)) ×100
�������������������� ������������������������ �������������������������������� (������������) (7)
�������������������� = ∑ �������������������������������� �������� ������������������������������������ ���� ���� ������������������������������������������������ ������������������������ �������������������� �������� �������� �������������������������������� ������������������������ (8)
A. Markov based model:

The Markov based model classifies the asset condition into four stages, the time of need for refurbishing/replacement is defined as shown in Fig.1. However, it depends on many criteria to confirm which routing services are, and what is the action needs.
B. Run, Repair, Refurbish , and Replace Decisions:
The Asset Management has the popular strategic which called run, repair, refurbish and replace [6], the question is for the companies how could minimize the repair and refurbish as well as extend the asset life cycle, on the other hand when the organization takes the decision stope the expenses on the asset by taking actions such as replace or disposal the asset. It is difficult to find an answer that can be applied to every company, although, this paper will touch some practices that can be applied to minimize the OPEX and facilitate decision making.
1. Maintenance Strategies:
The main factor is to increase asset life cycle is the efficient maintenance. it is classified base on two aspect conditions of asset and maintenance importance as shown i n Fig 2. The most popular type is Time Based Maintenance (TBM), despite TBM is widespread The Reliability Centered Maintenance (RCM) for the ageing assets is used for many organizations even it is not documented on its procedures. Illustrated to increasing maintenance frequency for the asset has poor performance. RCM NGSA has been changing its maintenance strategy to be RCM to develop the assets dependability and optimize the resources and minim ize the OPEX.
Additionally, the condition base maintenance and corrective maintenance for HV [7] and distributions grid respectively, used in some companies as a maintenance strategy . Although it is used to reduce costs, the consequences for these applied are more than what achieving from the cost reductions
2. Risk Management:

Asset Risk Management is one of the three pillars of asset management [10]. It is providing a clear view for the company, have it to continue spending on the repair/ refurbish or must decide, and which kind of decision is required, the risk management plays an important role in this aspect. The NGSA adopted the Consequences and probability module as Fig.3. The consequences of its, including the compliance, the safety of assets and human, energy lost reliability, reputation, and financial costs [11]. The outcome from this module after taking the happened risk probability and its consequences shall classify all assets in different categories as shown in fig.1 Based on that the proposed solution submitted and reassessment to investigate the solution validations.
A. Input data:
It has applied three case studies, two of them on high voltage overhead transmission lines, and one case specified on the med ium voltage switchgear as shown in Table.1

The results show expenses on the case studies assets of Line A, Line B and SWG 1 have fluctuated which means time base maintenance is not used mainly. The equipment condition is one of the main factors as displays in the charts the relation between OPEX and KPIs.
The transmission lines have almost the same behaviors as graph form. It is noted OPEX increased /decreased parallels with forced outages cost in several years such as 2011 in Line A and 2018 in Line B. However, the scale measure is different in Fig.4 and Fig 5 due to the high amount of expenses in Line B, especially refurbish what was happed in 2011.
The SWG 1 has been the liner relation between high expenses
outages cost as shown in Fig.6, that due to the asset was on the stage called on Markov based model "poor" Referring to Fig.1 it has two options, whether to continue spending o n refurbishing or replace. Therefore, the decision -maker chooses the replace option in 2016 after OPEX increased continuously.
In this part, it will show the technical KPIs for every case study from 2011 -2019, which included on the chart for SAID and another chart for the remaining KPIs such as SAIFI, MAIFI, FOFI, and No. of interruptions.
The Line A case study shows how the improvement on the KPI that related to the duration as SAIDI concurrently with the measure investing to repair the asset in 2011 as shown in Fig.7 and Fig.4. However, it is shows enhancements it's on four years from 2012-2015, this perfection was not sustainable for the years 2016 -2019.
On the other hand, it is clear from the Fig.8 the expenses have reinforcement the asset has a temporary improvement on interruption frequency KPIs as noted o n 2013, although, the investment on the line on 2018, Its positive results began to appear for all KPIs, It could be the root cause of the failures has been repaired or replace it.
The second case study for Line B has massive expenses in 2011, although of that, its KPI has not improved as expected as shown in Fig9 and 10, compared with its expenses (Fig.5) and Line A KPIs. The charts show fluctuated behavior; therefore, it is not healthy to confirm the improvement in some years which could temporary enhancement.
In the final case study in this paper, it was on switchgear 13.8 kV, this is the ideal application of effective maintenance with getting excellent outcomes from expenses from what was invested in. It is clear from Fig.11 and Fig.12 compared with Fig.6
Asset risk management (ARM) of the three cases has been applied to varying degrees. Table 2 shows the asset risk register included two aspects which are consequences and probabilities. It evaluates the consequences out 25 included compliances, the safety of assets and humans, energy lost reliabil ity, reputation, and financial cost. The formulation no (6) has been used. The probabilities evaluation was out of 5.
It is clear from table 2, the asset response to the repaired/ refurbish has reflected on the asset risk register rates. However, the ARM is the main input factor of asset management that can be decided, manage, and monitor the asset on the optimal way until the disposal decision is made.
The objective of this paper is to investigate the asset management applications in three case studies using Markov based model. The results of that were different outcomes of these cases have been noted an d analyzed.
It demonstrates the return on expenditures depends on asset condition and the kind of action taken to reinforce the equipment. It has been proven in the line A case, it has a good return on the duration of the interpretation KPI, with a modest impact on frequencies interpretation after 2011 repairing. However, the 2018 reinforcement has a massive improvement on all KPIs. The efficacious rehabilitation has been shoes on SWG 1 case.
However, continence maintenance and repairing not always the ideal solution as substantiated online B. The asset management could choose the optimal solution which even the disposal of the assets could be the optimal option in some cases. Alternative options such as change the network configurations or replace the assets sometimes are feasible and useful inst ead of continuing to growl OPEX of the organization.
To sum up, it is recommended to make disposal/repaired decisions based on optimization between expenditures and KPIs affect feeding on historical data. Asset risk management shall be a consideration as one of the main factors to determine to continue expenses on ageing assets or disposal
The reliably centered maintenance is the suitable type for the ageing asset due to kept and monitor the asset -based its outcomes. However, the assets KPIs is advisable to include it as the main factors for RCM and the kind of repairing/action taken required.
For further studies, the feasibility study of the ageing case studies asset using CAPEX, OPEX, and other factors to formulate the optimal time to dispose of/replace the assets.
[1] Schneider, J., Gaul, A., Neumann, C., Hogräfer, J., Wellßow, W., Schwan, M. and Schnettler, A., “Asset management techniques” International Journal of Electrical Power & Energy Systems, 28(9), pp.643-654, 2006
[2] CIGRE Technical Brochure 367 “Asset Management Performance Benchmarking”, Working group C1.11,2008
[3] Electricity & Cogeneration Regulatory Authority “ECRA Régulations Codes”, Ecra.gov.sa ,2020
[4] Kurtz, C. et al “Managing Aged Transformers” Transmission and Distribution World , July 1, 2005
[5] Gaul, A. J. Nilges, J., Nockmann, E., Thurlby, R.”Strategic Investment Planning” CIRED 2005, Turin 6-9 June 2005, session 6
[6] Gilpin, A. and P, –., 2020. "Strategic Asset Management for physical infrastructure: Run, Repair, Refurbish, Replace ” Master. The University of Sierra Leone , 2019
[7] Study Committee 37 “Ageing of the System. Impact on Planning” CIGRE Technical Brochure 176, 2000
[8] CIGRE Technical Brochure 309 “Asset management of transmission systems and associated CIGRE activities” Working Group C1.1, 2006
[9] Singh C, Schwan M, Wellssow WH. “Reliability in liberalized electric power markets- from analysis to risk management -survey paper” 14th Power system computation conference PSCC, 2002, Sevilla.
[10] Schneeweis, Thomas, Schneeweis, Thomas, Crowder, Garry B, & Kazemi, Hossein. “The new science of asset allocation” 1st ed., Wiley Finance. New York, 2010.
[11] Schoeman, J.S, & Vlok, P.J. “The possible influence of risk management, forecasting, and personnel training in physical asset management ”, South African Journal of Industrial Engineering, 25(2), 96-104, 2014
1 Professor, Department of Civil Engineering, University of Baghdad, Iraq *Corresponding author, email: saadisasarsam@coeng.uobaghdad.edu.iq
2Department of Civil Engineering, University of Baghdad, Iraq email: engsaad09@yahoo.com
Abstract
Utilizing reclaimed asphalt pavement (RAP) in new asphalt mixtures has increased in recent years because of its economic and environmental benefits. The flexibility of recycled asphalt concrete (with cutback and emulsion) in terms of resilient modulus (Mr), rutting resistance, and permanent microstrain have been investigated in this work. Cylindrical specimens of 102 mm in diameter and 102 mm in height have been prepared from the recycled mixture after the short -term aging process. Specimens were subjected to 1200 repeated compressive stresses at (25) ºC. The vertical permanent microstrain was monitored through video capture. It was concluded that RAP mixture can hold the applied loading with minimal permanent deformation as compared to the recycled mixtures . The resilient modulus is lower by (24 and 39) % for mixes recycled with cutback and emulsion respectively as compared to that of RAP. The rate of strain (slope) increases by 11 % and 4 % when cutback and emulsion were implemented as recycling agents respectively as compared to that for RAP mixture.
Keywords: Recycling; Asphalt Concrete; Rutting; Resilient Modulus; Permanent strain
1 Introduction
The challenge facing road engineers is to develop a sustainable asphalt mixture that reduces pavement system failure by developing new road materials and new methods of road construction and maintenance, [1]. Progress in road material science has focused on aged and waste materials, such as RAP, likely because of the continued availability of low-cost materials and due to the functional design of asphalt pavements. Recycling can provide the RAP, which is an important economical saving, RAP is usually considered to be a cost-effective pavement construction material that is placed in the pavement at increasing percentages, [2]. Many researchers had indicated the economic benefits of recycling, [3]. construction and reconstruction of road pavements imply a considerable consumption of valuable and non -renewable natural resources and the component materials of asphalt mixtures, [4]. The properties of the recycled mixture are believed to be mainly influenced by the aged, reclaimed asphalt pavement (RAP) binder properties, and the amount of RAP in the mixture, [5]. Asphalt binder loses many of its oil components during construction and service resulting in a high proportion of asphaltenes in the blend, wh ich leads to increased stiffness and viscosity of the binder and decreased ductility, making the binder hard and brittle, [6]. To recycle this hard and brittle aged pavement, the asphalt must be returned or changed to have the rheological properties of the original asphalt. This transformation is completed by adding liquid additives to the mixture being recycled, these additives have been called recycling agents or softening agents, [7]. Rejuvenating emulsions are normally used, containing oils that reduce the viscosity of aged asphalt cement, thus improving the adhesion and cohesion properties, as well as the flexibility of the binder. In addition, rejuvenators can penetrate the voids of the pavement, filling them and minimizing binder oxidation, [8]. The r utting resistance of recycled mixtures was studied by [9]. Four mixtures with RAP percentages of 0%, 15%, 30% and 50%, were tested. Results obtained from the wheel tracking test indicated that RAP mixtures have very similar rut depth values at the end of t he test when calculated between cycles 5000 and 10,000 which means that the presence of RAP in mixtures provides greater resistance to rutting. laboratory investigation of permanent deformation characteristics of asphalt concrete mixes containing reclaimed materials was presented by [10]. The permanent deformation characteristics of asphalt concrete with and without reclaimed materials were evaluated in the laboratory using the Repeated Load Axial Test and Wheel Tracking Test at a range of test temperatures. Test results showed that the asphalt concrete prepared using reclaimed materials such as waste plastic and Reclaimed Asphalt Pavement (RAP) was more resistant to permanent deformation over a range of temperatures. The use of resilient modulus testing to compare mixtures compacted with only virgin materials to those compacted with varying amounts of RAP was conducted by [11]. Resilient modulus testing was conducted in accordance with ASTM D 4123-82. The test was performed at 0.33, 0.5, and 1 Hz. In a 1 -Hz test, the applied cycles consisted of a 0.1-second load followed by a 0.9-second rest period. It was concluded that the resilient modulus rapidly decreases with increasing temperature. This is due to the softening of the asphalt binder as the temperature increases
In this investigation, the variation in the flexibility of the RAP and recycled asphalt concrete pavement (with cutback and emulsion) in terms of resilient modulus (Mr), rutting resistance, and permanent microstrain have been investigated.
The reclaimed asphalt mixture was obtained by the rubblization of the binder course layer of asphalt concrete of the highway in the province of Babylon. This highway heavily deteriorated with various cracks and ruts existing on the surface. The reclaimed asphalt mixture obtained was assured to be free from deleterious substa nces and loam that gathered on the top surface. The reclaimed mixture was heated, combined , and reduced to testing size as per AASHTO, [12]; a representative sample was subjected to an Ignition test according to AASHTO T 308, [12] procedure to obtain binde r and filler content, gradation, and properties of aggregate. Table 1. Presents the properties of aged materials after the Ignition test.
Gradation for the RAP obtained from the reclaimed mixture was determined; six samples have been selected randomly from the publication process of the material stack. These samples were subjected to an Ignition test to isolate binder from aggregate and then aggregate was sieved and separated to various sizes to calculate gradation for each sample. The differences between samples were to a minor extent, and the average gradation of the six samples obtained to be the old aggregate gradation is shown in Fig ure 1 which illustrates that the gradation of old (reclaimed) aggregate for the binder layer has slimly deviation with Specification limits of Roads and Bridge SCRB, [13].
Two types of liquid asphalt have been implemented as recycling agents based on the available literature, [1, 4, 5, 6, and 14]. They are medium-curing cutbacks and cationic emulsions
Medium curing cutback (MC-30) obtained from the Al-Dura refinery was adopted for recycling in this work. The properties are listed in Table 2.
Cationic emulsion obtained from ministry of industry and minerals was adopted for recycling in this work, the properties are listed in Table 3.
The recycled mixture consists of 100 % reclaimed pavement RAP and a recycling agent mixed together at specified percentages according to the mixing ratio. First, RAP was heated to approximately 160º C and liquid asphalt was added to the heated RAP at the desired amount of 0.5% by weight of the mixture and mixed for two minutes until all mixture was visually coated with recycling agent as addressed by [1]. The recycled mixture was prepared using two types of liquid asphalt: medium curing cutback and cationic emulsion.
The recycled mixture was heated to 130°C to become loose and then diffuses in shallow trays with 3cm thickness and subjected to accelerated aging by laying inside an oven at 135°C for 4 hours as per the Superpave procedure, [12, and 16]. The mix was stirred every 30 m inutes during the short-term aging to prevent the outside of the mixture from aging more than the inner side because of increased air exposure.
A cylindrical specimen of 102 mm in diameter and 102 mm in height has been prepared from the recycled mixture after the short-term aging process. The mold, spatula, and compaction hammer were heated on a hot plate to a temperature of 150º C. A piece of non -absorbent paper, cut to size, was placed in the bottom of the mo ld before the mixture was introduced. The asphalt mixture was placed in the preheated mold, and then it was spaded drastically with a heated spatula 15 times around the perimeter and 10 times around the interior. Another piece of non -absorbent paper cut to size was placed on top of the mix. The temperature of the mixture immediately prior to compaction temperature was 150ºC. The mold assembly was placed on the compaction pedestal and subjected to static compaction. The mixture was compressed at the top and bottom at a temperature of 150 °C under an initial load of 1Mpa to set the mixture versus the sides of the mold, after that the required load to achieve the target density of 2.372 gm/cm 3 was applied for two minutes and the specimen was left to cool at room temperature for 24 hours and then it was removed from the mold using the mechanical jack. Specimens were implemented for the Repeated compressive stresses test. Details of obtaining the target density were published elsewhere, [17]. Fig ure 2 exhibit part of the prepared cylindrical specimens.
Asphalt concrete specimens were subjected to repeated compressive stresses in the pneumatic repeated load system PRLS. The axial repeated load was app lied to the specimen and the axial permanent deformation was measured. Compressive loading was applied in the form of a rectangular wave with a constant loading frequency of 60 cycles per minute and the loading sequence for each cycle is 0.1-sec load duration and 0.9 sec. Load repetitions were applied under constant three
stress levels of (0.069, 0.138, and 0.207) MPa , while the testing temperatures of (25) ºC were implemented in the test.
Figure 3 exhibit the repeated compressive stress setup. The permanent vertical strain is measured as a function of the number of load applications recognizing the fact that the lower permanent strain is related to the lower sensitivity for rutting and corrugation. The ac cumulation of permanent and resilient strains (εp and εr) was monitored directly through continuous video capture, while the resilient modulus (Mr) was calculated using equations 1 and 2, [16 and18]. Specimens have been tested under three stress levels.
(1)
where:
σ: repeated diametral stress (N/mm²)
t: the thickness of specimen (mm).
P: applied load (N)
h: specimen diameter (mm).
(2)
Where:
Mr: resilient modulus (N/mm²).
σ: repeated diametral stress (N/mm²).
εr: vertical resilient strain (mm/mm).
3.1 Effect of Recycling Agent Types and stress levels on Resilient Modulus (Mr)
Figure 4 exhibit the influence of the stress level on resilient modules for the aged and recycled mixture (cutback and emulsion) under compressive stress at 25 °C after 1200 load repetitions. The resilient modulus increases up to a stress level of 0.138 KPa, then decreases when the stress level increases to 0.207 MPa. The highest resilient modulus could be achieved at 0.138 MPa level of stress for all mixtures. This may be attribut ed to that the recycled mixture requirement of strength is suitable under the moderate traffic loading condition. A higher stress level of 0.207 MPa will possess extra tensile stresses which the mixture is unable to accommodate, then the resilient modulus is decreased. On the other hand, a lower stress level of 0.069 MPa will not exhibit a high impact on the resilient modulus. It can also be observed that the RAP mixture exhibits a resilient modulus of 171 MPa, while the recycled mixtures show lower resilient modulus by (24 and 39) % for mixes recycled with cutback and emulsion respectively as compared to that of the aged mixture. Such results agree with [16] work.
Figure 5 shows the impact of stress level on the permanent deformation parameter of aged and recycled mixture with (cutback and emulsion) after 1200 load repetitions, it can be obser ved that while the stress level increases, the intercept value, and the slope increase as well for different mixtures. The rate of increase for RAP (aged) asphalt concrete is (37.5, and 45.3) % for 0.138 and 0.207 MPa stress levels as compared to that at 0 .069 MPa. For recycled mixture with (cutback), the rate of increases is (17, and 25) % as compared to that at 0.069 MPa.
For recycled mixture with (emulsion), the rate of increases is (12, and 17) % as compared to that at 0.069 MPa. The rate of change in slope value is different for different stress levels and different mixtures. At a moderate stress level of 0.138 MPa, the recycled mixture with cutback asphalt shows a lower intercept value by 2 % as compared to that of RAP mixture, while the recycled mixture with emulsion exhibit a higher intercept value by 14 % as compared to an of RAP mixture. On the other hand, the rate of strain (slope) increases by 11 % and 4 % when cutback and emulsion were used as recycling agents respectively as compared to that for RAP mixture. this may be attributed to the more flexible nature of recycled asphalt concrete as compared to RAP. Such test results agree with [16 and 18] work.
Figure 6 exhibits the rutting performance of various asphalt concrete mixtures; it can be observed that the stiffer RAP mixture can hold the applied loading with minimal permanent deformation as compared to the recycled mixtures. At a high-stress level of 207 kPa, the permanent strain increases by (20 and 28) % for recycled mixtures wit h cutback and emulsion respectively as compared to RAP mixture. Table 4 demonstrates the mathematical models regarding the resistance to rutting of asphalt concrete where (Y) represent the permanent deformation (microstrain) and (X) denotes the load repetitions. A similar rutting trend was reported by [14].
Based on the testing program, the following conclusions could be drawn:
1- The resilient modulus is lower by (24 and 39) % for mixes recycled with cutback and emulsion respectively as compared to that of RAP (aged) mixture at a moderate stress level of 0.138 MPa.
2- The resilient modulus increases up to a stress level of 0.138 KPa, then decreases when the stress level increases to 0.207 MPa. The highest resilient modulus could be achieved at 0.138 MPa level of stress for all mixtures.
3- At a moderate stress level of 0.138 MPa, the recycled mixture with cutback asphalt shows a lower intercept value by 2 % as compared to that of RAP mixture, while the recycled mixture with emulsion exhibit a higher intercept value by 14 % as compared to to that of RAP mixture.
4- The rate of strain (slope) increases by 11 % and 4 % when cutback and emulsion were implemented as recycling agents respectively as compared to that for RAP mixture.
[1] Sarsam S. “A study of aging and recycling of Asphalt Concrete pavement. University of Sharjah ” , Journal of pure and applied Sciences, Sharjah UAE Vol.4 No.2 June- P79-94. (2007)
[2] B. Colbert, and You, Z., “The Determination of Mechanical Performance of Laboratory Produced Hot Mix Asphalt Mixtures Using Controlled RAP and Virgin Aggregate Size Fractions ” , Construction and Building Materials, Vol. 26, pp. 655- 662. (2012).
[3] NCHRP Synthesis 495. “Use of Reclaimed Asphalt Pavement and Recycled Asphalt Shingles in Asphalt Mixtures. A Synthesis of Highway Practice” National Cooperative Highway Research Program. Project 20-05, Topic, 46-05. (2016).
[4] I. Al-Qadi, E Seifi, M., and Carpenter, S., “Reclaimed Asphalt Pavement A Literature Review” , Report No. FHWAICT-07-001, Illinois Center for Transportation , Rantoul, IL. (2007)
[5] P. S. Kandhal, and Mallick R.B., “Pavement Recycling Guidelines for State and Local Governments Participant's Reference Book” , Report No. FHWA-SA-98-042, Federal Highway Administration Office of Engineering. (1997).
[6] A. Copeland, “Reclaimed Asphalt Pavement in Asphalt Mixtures: State of the Practice” , Report No. FHWA-HRT-11021, Report Date April (2011)
[7] H. M. Silva, Oliveira J.R.M., and Jesus, C.M.G., “Are totally recycled hot mix asphalts a sustainable alternative for road paving?” Resources, Conservation and Recycling , Vol. 60, PP. 38-48. (2012).
[8] K. A. O’Sullivan, “Rejuvenation of Reclaimed Asphalt Pavement (RAP) in Hot Mix Asphalt Recycling with High RAP Content” , M.Sc. thesis, Worcester Polytechnic Institute. (2011).
[9] R. Miro, Valdés, G., Martinez, A., Segura, P., Rodriguez, C. , “Evaluation of High Modulus Mixture Behavior with High Reclaimed Asphalt Pavement (RAP) Percentages for Sustainable Road Construction ” , Construction and Building Materials, Vol. 25, PP. 3854–3862. (2011).
[10] I. Aschuri, Woodward D. and Woodside A., “Permanent deformation characteristics of asphalt concrete containing reclaimed materials” , International Society for Maintenance and Rehabilitation of Transportation Infrastructure; technical report, Transportation Research Board. (2009).
[11] M. S. Sondag, Chadbourn, B.A., and Drescher, A., “Investigation of Recycled Asphalt Pavement (RAP) Mixtures ” , Report No. MN/RC – 2002-15, Minnesota Department of Transportation. (2002).
[12] AASHTO. “Standard Specification for Transportation Materials and Methods of Sampling and Testing” , American Association of State Highway and Transportation Officials , 14th Edition, Part II, Washington, D.C. (2013).
[13] SCRB, “General Specification for Roads and Bridges, Section R/9 Hot -Mix Asphalt Concrete Pavement”, Revised Edition, State Corporation of Roads and Bridges, Ministry of Housing and Construction , Republic of Iraq. (2003).
[14] S. I. Sarsam, AL-Zubaidi I. “Resistance to Deformation under Repeated Loading of Aged and Recycled Sustainable Pavement” American Journal of Civil and Structural Engineering , (AJCSE), Vol. 1(2), April Sciknow Publications Ltd. USA. p34-39. (2014).
[15] ASTM. “Road and Paving Material, Vehicle-Pavement System” American Society for Testing and Materials. Annual Book of ASTM Standards, Vol.04.03 (2009).
[16] S. I. Sarsam and AL-Shujairy A. “Influence of recycling agent type on resilient modules and rutting resistance of asphalt concrete pavement” . Applied Research Journal, ARJ . Vol.2, Issue, 1, January, pp.10 -18. (2016).
[17] M. C. Saleem “Influence of Liquid Asphalt Additives on the Properties of Recycled Asphalt Concrete ” . MSc. Thesis, College of Engineering, University of Baghdad, (2018)
[18] S. I. Sarsam and AL-Janabi I. “Assessing Shear and Compressive Strength of Reclaimed Asp halt Concrete” International Journal of Scientific Research in Knowledge, (IJSRK) 2(8), pp. 352-361. (2014).
venkatesh.engg.consultants@gmail.com
Abstract:
A Digital Twin (DT) is a digital replica of a physical object. In this presen tation, Digital twins are currently mostly used in power systems for visualization or to bring data together, validate software or extract data and do maintenance remotely. We did this DT to enable the remote accessing of RTUs (Remote Terminal Units), SAS (Substation Automation Systems), and protection Systems, and validate requirements on the digital model Unlike other regions in (Name of the organization not mentioned here) , the southern Telecom &SCADA team was in the field of implementing the Digital Twin technology as continuous improvement works during 2009 -2010, which was named as “Benefits Oriented Zero Cost projects in Communication Automation Technologies” (hereafter BOPCAS). Communication Automation was a rapidly growing area of technology that is seeing growing interest within the power system. The Zero cost projects were the real history projects which were implemented in electric power systems have a wide impact on the prevention of blackouts, less maintenance cost enables the Control center to take quick decision making in the operation and maintenance field. In earlier years there were no such Digital Twin technologies provided by the project execution, hence the power system network has faced lots of problems and delays in execution in operation, and maintenance. Today the world is facing an economic crisis and power system problems, SCADA & Communication team plays an important role in minimizing the impact of widespread power system Disturbances by having implemented the Benefits Oriented Zero Cost projects since 2009. The purpose of this paper locates the notion of technological revolutions in the Communicat ion Automation Systems in southern power system effort to understand innovation an d to identify the regularities and discontinuities in the process of manufacturers’ design. All the ambiguities of the Manufacturing design stage were corrected by the team and are up to the standards and operational with good results to date. It fulfills the patterns observed in the evolution of Technical change and the interrelations with the context that shape the rhythm and direction of innovation. On this basis, it defines technological revolutions and examines their structure and the role that they play in rejuvenating the whole system through the application of the accompanying techno -economic paradigm. All the Zero Cost Projects( no money spent for the materials, utilized the old materials ) which have been implemented in the Najran power system are without any additional equipment, materials , and additional Project Costs which helps the power systems in Najran to tackle the various techno-economic problems. It renders trust worth Services and time-proven systems to Consumers, operation and Control Sections, and the Transmission section of Najran.
Key Words: Millions Cost to Zero Cost Projects - Reduces Income loss - No maintenance cost - Serves as Backbone to Master Station
1 Introduction
A digital twin is a virtual representation of a real -world object or system. Such a digital carbon copy gives developers many interesting opportunities. For instance, they can test their software, and they can run all kinds of simulations and what-if scenarios on the digital twin long before the physical system is available. This way they can drastically reduce development time and boost first-time right deployment. In this talk, we give a definition of ‘being a twin’ using testing equivalences and conformance relations. We then give methodologies to actual create requirements and automatically validate these requirements using model -based testing. We apply our definition and methodology to a factory model representative of typical systems used and developed by our customers. Unlike other regions in the world, the Najran region from the south of electricity sectors has implemented many historical Zero cost projects in the electricity sectors in HV, LV Substations, and Control centers in terms of low-income loss to the distribution department and ensuring uninterrupted power to 150,0000 Consumers, the introduction of Zero cost projects, modernization and a new approach for operation and maintenance. All of the Projects which have been implemented are based on the recycled process which in turn improves the economic performance of the running and maintenance costs of the power system. This Zero cost
technology projects are known as “Najran Blooms with Zero Cost Projects” or “Million costs to Zero cost Projects” has wide positive effects on the Key Performance Indices (KPIs) in the Najran region. In addition to the Zero Cost Projects, Najran National Grid is launching various precautionary measures to the Communication systems for fail Safe operation by implementing various modifications and designs to suit the existing systems for upgrading in an efficient manner.
In such Zero Cost Projects, Najran National Grid will implement these projects in other inter -regional Communication Systems in an efficient manner. Three Major dimensions can be identified in such a project (1) Technical dimensions, (2) Economical dimensions, and (3) Safe operation dimensions Although the Najran National Grid team had devised many (7) Zero Cost Projects, only five topics will be introduced in this paper.
1. Remote Reset of RTUs in HV & LV Stations
2. Remote Access and Remote Configuration of RTUs
3. Continuous Monitoring of UPS and DC System ( 125 & 48 V DC ) system voltage at Control Centres from remote Stations HV & LV
4. Online monitoring of Fibre Splicing
5. Integration of Radio systems with Fibre network
All of the above Projects that we designed, engineered, and implemented in Najran wer e with Zero Cost; no money has been spent from the National Grid department’s budget. All the projects are operational in the southern region., all the materials and equipment have been used in these projects are based on the recycling technique, hence no additional cost for the projects and achieved the goals in a short time [1][3]
2.1 Remote Reset of RTUs (Remote Terminal Units) – Zero Cost Project for 14 Substations in Najran:
RTUs in Remote Substations are sometimes subject to Hang up (Sleep mode or Image Mode ) that time if any 132 KV line feeders or 33 KV Feeders or 13.8 KV feeders trip, the Control centre tries to Close the CB, but this Command cannot reach to that Circuit Breaker due to that RTU is in Hang up condition and. RTU needs to be reset manually by any SCADA Personnel traveling to that remote S/S and then the Control centre can give close Commands to those CBs. [2][3]
To overcome such above problems, Telecom Group had designed a new Zero Cost mec hanism to reset the particular remote Station RTU from the southern control canter Desk; this facility is available in Najran since 2009. To reset the RTUs in all Substations in the southern Area, Control Centre personnel shall do it by themselves, with no need for assistance from SCADA Personnel for r e-setting the RTU. Reset of RTU facility in Najran area gives trust worth Services and time-proven systems to the Consumer, Operation, and Control Sections of the electricity sector in southern regions.
All materials used in this project were utilized by the recycling process, hence no money was spent from SEC budget, with available materials in the Southern electricity sector for this Remote Reset of RTUs mechanism implemented within one month in 14 Substation’s RTUs in the southern Area. The control centre can access to reset the remote substation RTUs from the Control centre table and hence providing flexibility to the Control centre operations
When the RTU is in sleep mode, the remote reset of RTUs mechanism is helpful to the distribution maintenance team, Transmission line maintenance team , and Control centre when there is any 13.8 KV poles getting fire, also any foreign object (polythene papers or clothes , etc) touching or hanging on HV transmission lines and need to open the CBs at Substations, the CC shall to press the related reset button for the substation to reset the RTU which is in sleep mode, within 2 minutes the RTU will be in service to open the CBs [1][4]
To reset the RTUs in Remote Substations in Najran, Just press the button in the Key telephone button the command will be sent to that particular RTU through MDFOTE and DPLC links and then the RTU will rest within 2 minutes and the RTU becomes operational state without the involvement of SCADA & Telecom. Staff and network operators. Each station RTU reset is independent of the other All the RTU Wirings are safe and secured properly, ensuring more reliability of RTUs operation due to the presence of Remote reset of RTUs from the Control Centre Screen and Communication room as well.

RTUs or any electronic equipment which operates with a high baud rate are sometimes subject to hang-up (sleep mode or image mode). Hang up of electronic equipment due to the following reasons [5][7].
a. Mismatch levels in MDFOTE link
b. Mismatch level in DPLC link
c. Hold Over situation in MDFOTE
d. Error in serial Communication ports of RTU


e. Command Interruption
f. Error in Data module
g. Any other command in progress
h. Poor connections
RTU modules are operating with 24 V DC and 5 V DC Voltages; CPU module is with flash memory and operates with different Data Speed as set by the maintenance personnel by RTU Software too l. In Najran all the 132 KV RTUs are operating with a data speed of 19 200 b/s [3]


1. No need to travel to the remote Substation to reset the RTU [1]
2. No need Operator to travel to the Substation to close the CB when RTU hangs up during Day or Night time.
3. Cuts down Time
4. Cuts loss of revenue to electricity departments
5. Ensures RTUs reliability and thus maintains Reliable Electricity to Customers

6. Remote reset of RTU facilitates the CC dispatcher to reset the particular RTU in the Substation by pressing the button in the Telephone set in any kind of emergency situation, Reset mechanism is kept at the control centre
7. Reduces traveling time & traveling expenditure
8. Reduces Operational Costs
2.6 Remote Access and Remote Configuration of RTUs , SASs, and Protection Systems
This facility is available only in this electricity sector, modification of any Data in a remote Substation’s RTU normally a maintenance person needs to travel to that substation, but in Najran no need to travel to the remote substations, all the Data modification shall be done at Najran CPS Communication Room itself. Also , this facility serves as the backbone of the Master station computers[1][2].
Any modification or addition of Data in RTUs in a Remote substation needs a SCADA staff to travel to that Substation and then perform the Data modification with Laptop, also needs the Operator to be present till the RTU becomes in operation mode.
As an example S/S E RTU in the southern Area if it needs configuration change, SCADA Staff need to travel from headquarters to S/S E i.e. 300 Kms away from CC After implementing this facility no need to travel to any of the 132 KV S/Ss for data modification [5]
In case of the Master station, the computer fails, an inoperative stage arises or any emergency at that time this Remote Access facility will perform all operations such as Command execution, back indications, alarms , and measurements shall be collected from the remote Substations. It serves as the backbone mechanism for the Master station. RTU Training for maintenance employees shall be performed with different station RTUs in one place at a reduced cost. A behavioral study of different RTUs shall be carried out[1]
Here the Picture shows that the RTU is being accessed locally at Substation Need to travel to that Substation & network Operator is required to close the tripped CBs while uploading the RTU

3.1 Accessing the RTU, SAS, Protection systems, DC systems r emotely from Control centre
Here the Flow diagram shows that the RTUs, SAS system, Protection systems, and DC system 125&48V dc shall be accessed through related telecom panels and brought to the control centre screen. From the Control centre all the downloading/uploading of data and creation and modification of data for all the utilities can be done from the control centre. Normally to download/upload data in above said asset ut ilities need to travel to each substation, but after implementing the Digital Twin facilities it is very easy from the control centre building to view and modify the data.

The HMI ports of RTUs, SAS, protection panels , and DC systems shall be carefully interfaced at each substation E, D, C, B, A, and CC with suitable connections[3] [4]
RTU Process signal flow diagram shows how the RTU 560 remote accessing and how the signals such as commands, indications, alarms, and measurements are processed from the Substation’s Switch Gears


a. No travel expenditure
b. Cuts downtime.
c. No additional manpower (operator or maintenance personnel).
d. During a Blackout situation, this Digital Twin technology is very much useful to know the power system parameters from the Control center.
e. Serves as the backbone of the Master station. If the Master Station Computer system fails or is in the inoperative stage that time this Remote Accessing for RTU will take care of the activities of the Master Station to open and close the switch gears
f. Training for maintenance personnel shall be carried out with different station RTUs , SAS, protection systems, and DC systems in one place
The continual improvement of Telecom & SCADA, Group had implemented the project of monitoring 125 and 48 V DC System Voltage at the control center with old scrap materials, recycle process technique was followed with out spending any money from the electricity sector’s Budget
The improvement group completed this implementation of DC System Voltage Monitoring at the control center with Zero cost during 2009-2010. Earlier there was no such monito ring of the DC system Voltage at the control center, but now all the 132 KV S/Ss and 33 KV S/Ss have been implemented for the continuous monitoring of the DC system Voltage at the Control Centre screen. SCADA & Telecom Group used Scrap materials -Transducers, cables, and fixtures.
The old Voltage Transducers were suitably modified to comply with DC system voltage and tested for its accuracy and then installed at various substations and commun icated the voltage readings to the Control center. Now 125&48 DC voltage of all Substations, SCADA UPS were implemented at Control center. Old Transducers were with 0 -1mA which was not compatible with the new SCADA System, but SCADA & Telecom Group had done suitable by conversion in the configuration in all RTUs and made suitably and comply with SCADA systems without any additional cost and materials[7]
These Transducers were removed from the old SCADA System, checked for their accuracy and calibrated for their linear characteristics, and then installed for the DC system voltage monitoring in each substation. After the


installation of transducers at each Substation several tests were carried out such as the discharge and recharge of battery banks and observing the linearity of the magnitude of DC voltages at the Control center Screen. All the results are satisfactory and up to the standards [7]
Earlier there was no monitoring facility for the DC system voltages to appear at LDC, but now 48 & 125 V DC Voltages of different Substations in Najran are appearing at LDC Najran screen.
Fig. 9 shows the dc system voltage levels from various substations (132 & 33 KV ) that were being monitored for 48 V, and 125 V dc systems. The provision also has been implemented to monitor the SCADA UPS system voltage at the Control center [1][7]

a. During a Blackout situation the DC Voltage & SCADA UPS Voltage monitoring in different substations are helpful to the S/S maintenance team as well as to the Control centre dispatcher.
b. Assume the alarm card in RTU for Charger Alarms is defective or has no connection, that time this DC system Voltage monitoring at the Control centre is useful

c. Any dip in power system voltage occurs that time study the DC system performance shall be known with time & date at the Control centre itself
d. Automatic boost voltage function if it happened in DC system, then it will be known for Date & time
e. Chargers having poor performance and poor voltage regulation characteristics shal l be easily known from the daily CC voltage log
f. Anyoneone needs to know the present level of DC voltage, no need to tra vel to the Substation which is 400 or more Km distance, just visit and request the Control centre dispatcher for the present status of DC system in a particular Substation
g. Comparison of different DC systems Voltage in different Substation collectively at one place at Control Centre, no need to travel different substations.
h. Cuts Travelling time & traveling expenditure drastically
i. If both chargers are having problems due to Ac input failure, that time we will come to know the Voltage level of that DC system, Voltage level is enough to withstand up to 10 hours or 5 hours so that the DC system maintenance personnel will rush to the Substation according to the Voltage level indicated at LDC screen
j. Control centre dispatcher and dc system maintenance teams relieve tension and they will be strong in psychologically too
k. Daily Log shall be prepared at headquarters without visiting each Substation
l. Behavioral study of DC system for continuous service
The improvement team also studied the possible steps to implement the remote charging and discharging of the valve-regulated battery bank (maintenance-free battery bank ) in the power system. If this facility is to be implemented in the electricity sector, then no need to travel or go to the remote substations for discharging and recharging the battery banks. This is applicable only to valve-regulated battery banks. Maintenance of DC system group shall able to give command from the headquarters to open command to the chargers to switch off the AC input source to the rectifier while discharging the voltage level s shall be obtained from the Control centre ( if already implemented the remote monitoring of DC systems ) screen. After discharging with a safe operating voltage level, the close command will be executed by the DC system maintenance personnel and then the rectifier will b e in service and voltage will be monitored continuously at the Control centre screen.
All the SCADA & Communication equipment in the southern area was free from circulation currents from the Substation ground system by having implemented the separate ground system for the Communication system. Also all Substations we have removed the shield wire of the Control & signal cables at the Switch gears panels side and have an earth connection at the communication equipment side. This ensures that the communication equipment such as RTU, MDFOTE, DPLC, SDH, and DPABX systems are free from circulation currents and hence the operation of all SCADA & Telecom equipment are in safe environments at Najran. All the voice circuits MDF & E1 circuits were equipped with suitable protectors to protect against the surge in the networks
Un - Cleared E/F Current arises due to 1. NO DC for tripping .
2. Relay may inoperative state .
3. Mechanical problem of CB


RTU Signal Cables and command cables are earthed , Shiled wires are with +48 V CB
O/G Cable Assume this cable has earth fault and CB not tripped , hence un Cleared E/F current circulate through Hardware metalllic contacts and cable cores
HOW COMMUNICATION EQUIPMENTS GETTING AFFECTED WITH CIRCULATION CURRENTS IN SUBSTATIONS
When there is a Circulating current occur in any Substation and if it is persisting for long time say 1 to 3 minutes , the circulating current may flow in RTU ,DPLC and FOX cables cores and reach to the cabinets of RTU , DPLC and FOX., In RTU560 the Modules 23BE21/23 are having filed contact voltage as +48 V , Since the filed contact Voltage is positive ground , the Circulation currents with high magnitude may enter inside the 23BE21 modules according to the effective resistance of 23BE21 Modules and damage the complete 23BE21 modules .
1. RTU-560 - 23BE21/23 modules may fail , if the circulation current magnitude is high the other modules 23AE21 , 23BA22 7 23 Ba20 may also fail
2. FOX - 515 - SUB-H module is prone to damage due the Telephone line inside the Cable ttrench / cable duct due to circulation current in S/S
3. DPLC -640- Power supply module may fail , DPLC balancing transformer and HF Hybrid may fail
HOW TO AVOID THE COMMUNICATION EQUIPMENTS FAIL FROM CIRCULATION CURRENTS FROM SUBSTATION
1. Implement separate Ground system with MGB for Communication equipments , No connection with Substation ground system

2. All the cables of RTU , FOX , DPLC , DPABX , SDH etc - The ground wires shall be earthed at communication cabinets only , other end no need .
Fig.11. Effects of Circulation currents on +48 V grounded Communication Systems
5.2 Command execution Successful Alarms: Whenever Control Centres execute a command either open or close the CB in any substations in the Najran area, that time if any interlock in force or local /Remote switch is in local position or no 125 V DC , such co nditions will not be permissive for the successful com mands up to the Switch gears

When the command is not successful, the Control Centres immediately inform the SCADA & Communication crew that the command was not successful to open or close the CB in the substation and an abnormality report will be issued to SCADA & Communication crew even if the closing and opening of CB problems which are not related to the SCADA system. To overcome these problems for SCADA & Communication crew, in Najran we have implemented a feedback signal for each command executed by RTU, this feedback signal will be disp layed at the Control Centre screen saying that the command executed by RTU was successful. This Command successful alarm in Najran relieves the SCADA & Telecom crew and also the Control Centre directly calls the substation crew to troubleshoot the control circuits of the CB. Such facilities in the southern electricity sector save in troubleshooting time
All the auto voltage (110-220 V) operating communication equipment such as the Radio system, ADAS system, and Chargers were connected with a 110 V source as safe operating voltage, in case any surge voltage occurs in the power source that will not affect electronic modules due to more reserve in voltage tolerance up to 220 V.
Double-stage fuse protection for Radio Base and repeater stations: in case any hi gh voltage if it comes in low voltage distribution circuits, this high voltage will damage the electronic modules with successive stages, to avoid such damage Najran maintenance team has introduced one more fuse circuit which is outside the Radio equipment as a fail-safe system
RADIO Station Ground Connection: All the Radio Station ground connections were not mixed with the ground ( MGB ) from the tower ground connection due to the lightning stroke from the antenna (built -in self-lightening arrestor ) cable should not reach the Radio station and affecting the power supply modules of Radio station .
CAS (Communication Automation Systems) whatever facilities are not covered in the Substation Project by the contractors and which cannot be designed by the manufacturers are modified and designed by Najran SCADA & Telecom. Team with zero cost and achieved goals for the beneficial use of electricity sectors. After implementing these Communication Automation Facilities Najran had not faced any Abnormalities due to RTUs in all S/S with the Presence of mechanism
a) Remote reset of RTUs from the Control center’s table
b). Remote configuration of RTUs and
c). remote configuration of Protection systems
d). Remote monitoring of DC system voltages
Above mentioned Zero cost project’s effective mech anism has drastically null the emergency works and hence no additional expenditure also these Digital Twin facilities are much useful to the electricity sectors , especially in the crucial situations of COVID19 .
The maintenance cost and running costs have been drastically reduced since 2009. Now Najran is stepping into the 4th year for achievement in NO abnormalities, NO Overtime, and NO maintenance cost. SCADA & Telecom Group did other four Zero Cost Projects, but due to the limitation of presentation rules those projects have not been mentioned in this Paper [5][6]
I sincerely thank my academic advisor and thesis Dr. N. Nanda Gopal, technical expert, and Director Eng. Fareed Al Asmari, Department Manager- National Grid south, KSA for his guidance and support throughout the preparation of this paper. Also, I am very thankful to Eng. Abdul Mohsin Ali Al Garni, Divisional Manager, SCADA & Communication South, KSA for their support in the preparation of this paper.
[1] Mr. Hiromitsu Kumamoto & Ernest j. Henley – “Probabilistic risk Assessment and management for engineers and scientist” IEEE, Second Edition, the Year 1998
[2] Mr. Joseph Di Giacomo, editor in chief, department of Electrical Engg. Villanova University – “Digital Bus handbook”, IEEE Third Edition, the year 1998
[3] Dr. Muhammad H. Rashid, Purdue University at Fort Wayne – “ Spice Simulations of power electronics, IEEE – Second edition, the Year 2000
[4] Mr. William R. Blood. Jr – “ MECL System Design Handbook ” Motorola – Fourth Edition, the Year 2005
[5] QMS-Quality management systems ISO 9001:2015
[6] EMS-Environmental management systems ISO 14001:2015
[7] IEC 61850-7-420; Communication networks and systems for power utility automation –part 7-420.norm IEC, 2009
1.0.Abstract::
One of the KSA’s key challenges, to keep pace with the future development of the country, is to ensure that its education system is geared toward supporting the growing private sector as a means of aiding diversification and reducing reliance on state-run industries. The scenarios demonstrate that ensuring that highly qualified Saudi workers with relevant skill sets are available in an innovative economy is crucial to the country, in reducing national unemployment and the economy’s current reliance on foreign labor.
A Saudi Government initiation project – the College of Excellence (CoE), is implementing an ambitious upgrade of the Technical and Vocational Training Corporation’s (TVTC) system in the KSA through a public-private partnership with global independently run international training providers with a focus on industrial needs. This enables the youths to obtain world-class qualifications that allow them to turn their passions into successful future careers. `
The education sector in the Middle East is expected to grow exponentially on the back of a rising population, increasing private sector participation, and growing unemployment. Especially in countries like Saudi Arabia, government spending in the Education sector has been increasing and currently contributes to ~25% of the total budget. However, the share of the private sector has been gradually increasing - from 18% in 2007 to 20% in 2012. This is expected to rise to 22% in 2017. In addition, the support services management spending to upkeep the facilities to the optimum utilization is almost a SAR3million per year per facility. A component of the irrational spending on support services is largely due to the fact that most of the facilities are as old as 5+ years without being operational since their build-up
The scenario needs processes to retain the identified educational facilities; their support services and facilities to acceptable operating standards that are often challenged by the requirement to sustain their utilities and outlook. The absence of appropriate operating strategies, maintenance methods, and adequate administrative functionalities led to keeping a backlog of maintenance and repairs of their respective built environments (now in some non-operating conditions) which may impact negatively the staff and learners’ performance and reduce their production levels.
This paper seeks to assess and evaluate the works and support services level in educational institutions by examining the effectiveness of maintenance works being carried out in connection with identifying the adoption and use of asset condition surveys and maintenance methodologies. Based on the findings a framework is proposed to assist key decision-makers to develop enduring solutions to such maintenance challenges in the educational facilities in KSA.
We have never lived in a world of faster and more wide -reaching technological innovations. Our jobs, businesses, and how we operate as societies are being transformed by technology, and the current global pandemic is only fast-tracking digital transformation.
The Chartered Institute of Buildings (1990) defines maintenance and refurbishment as ‘work undertaken in order to keep, store, or improve the very facility and surrounds to currently acceptable Standards and to sustain the utility and value of the facility. The British Standard (BSI,1993) defines building maintenance as a combination of any actions required to retain an item or restore it to acceptable conditions.
The systems engineering field has identified maintainability and availability as important characteristics of any technological system. These parameters govern t he cost and revenue components of the profit equation which directly or indirectly determines the usefulnes s of the system. Maintainability is a design parameter while availability is a result of implementing various systems management policies to the given technological system. The formulation and implementation of these policies are critical to achieving high system performance in terms of availability, reliability, and total life cycle cost.
In order to meet increasing performance standards, there is a growing emphasis on effectively utilizing the limited maintenance capability to carry out preventive and corrective maintenance. Planning these activities beforehand and determining the resource requirements would help the managers reduce various delays associated with maintenance activities and hence reduce the overall system downtime and life cycle costs. In order to plan and manage these maintenance activities, it is very important to understand the dynamics behind these activities and their impact on system performance. Various models have been developed and policies have been proposed to improve systems’ performance. These models have been developed with the objective of improving system availability, improving system reliability, or minimizing repair costs.
A cursory look at most of the higher education institution buildings in KSA, especially those built/taken up for the TVTC system suggest that they are not well maintained. Today’s technological systems are expected to perform at very high standards throughout their operational phase. The cost associated with the unavailability of these systems is very high and especially with the HVAC or water network which can directly affect human lives. The maintenance systems play an important role in achieving higher performance targets. In order to manage maintenance activities in a more informed and rational manner, it is very important to understand the inherently complex and dynamic structure of the system. Traditionally maintenance policies are derived from the reliability characteristics of individual components or sub -systems. This research makes an attempt to understand the existing system and suggest better maintenance policies for achieving higher availability and lower system degradation. The leverage is gained from the System Dynamics framework’s ability to model complex systems and capture various feedback loops. The simulation results reveal that with the limited preventive maintenance capacity and within the given assumptions of the model, there exists an optimal preventive maintenance interval which is not the minimum. The simulation results also reflect that frequent preventive maintenance is
required at higher load factors. However, meaningful skills and knowledge need to be imparted to learners in a very conducive environment. In addition, the workplace for academic and other faculty staff must also be conducive. The study needs to evaluate current approaches to asset maintenance.
1.1.2.
The study needs to assess the constraints of Education Institution Buildings under the TVTC system with a view to evaluating their strategies, maintenance models and methods, assets sustainability, and the influence of culture in the execution of CoE programs. The existing colleges, Male and Female [@01nos each] under CoE have been taken as a pilot project for this study. The study aims to propose a theoretical strategic framework for asset management in these educational institutions.
1.1.3.
*To establish current theoretical approaches to asset maintenance management
* To study and analyze the dynamic behavior and the causal effects of various elements of maintenance policy on the system’s economic and technical performance.
*To assess and evaluate support services and works constraints in relation to procurement strategies, maintenance methodologies & methods, effective maintenance management; and, the influence of culture.
*To develop a theoretical asset maintenance strategic framework for the TVTC system institutions
* To formulate, analyze and compare various problems to determine the optimum level of maintenance parameters for improved system performance.
*To validate the framework (through literature surveys, interviews, and research).
2.1. Maintenance Strategy::
No single maintenance method and strategy can effectively provide needed remedies to both natural and artificial defects in the facility elements, like buildings, HVAC, Communication & Security & Water networks, etc.
2.2 Maintenance Methods::
The facility has been classified with various types of buildings. Hence their respective maintenance has been classified into three classes – preventive, predictive, and corrective maintenance methods. Repairs or replacement of works that are minor or major and the use of planned preventive maintenance methods have been recommended. However, in some critical areas [like electrical panel boards, motors, etc.] a stock condition survey [combination of predictive and curative - by means of infra-red recording tools] is used to assess the need for maintenance.
For the purpose of this study, both qualitative and quantitative approaches [mixed method research design based on pragmatism] are adopted and research questions are drawn to ensure that the study achieves its objectives. However, for the purpose of this presentation, the research used semistructured interviews [Figure – 5, Qualitative, from the field personnel] to collect the relevant database
3.1. Methodology and Data Collection Strategy:
The selection of a philosophical paradigm consisting of three essentials, such as Ontology, Epistemology, and Methodology has been made to be used in this study. In the whole study, both the hard and soft paradigms are used.
3.2 Research Design Criteria:
Ontology is the study of being and concerns with what is the nature of existence with the structure of reality, such as ‘meaning’ and ‘realism’.
Epistemology is the study of reality – that is, what it means to know, and that is a way of understanding and explaining how we know what we know.
And,
The methodology is the strategy, plan of action, process, or design underlying the choice and use of the particular method and linking the choice and use of methods of the desired outcomes.
3.3. Sources of Data:
For the purpose of the study, the researcher has used both primary source [literature standard data] and secondary source [field, men and equipment, actual data] collection.
3.4.Limitation of Methodology:
The study is limited to the selected TVTC system institutions (Male & Female) located in Al Aflaj, KSA, only. This area is largely underestimated to achieve the best building performance, ROi, and most importantly statutory compliance. The responsibility of Designers and Consultants to ensure the information on assets is collated from design, selection (lifecycle) and installation is critical to meet end-user expectations during operations. We have been focused on this area in practice and academically and the findings are quite common and in some instances, worst...no data exists.
The systems dynamic field provides a framework for modeling complex and dynamic systems. Considering the complexity and dynamics associated with the problem that has been dealt in this research,
4.1. System Dynamics is considered to be an appropriate tool for modeling the system structure in this study The iterative and continual process modeling [Figure – 1] is a part of the implementing process for formulating hypothesis testing and revision of both formal and mental models. This is an important step in the modeling process.
4.1.1. In the above-stated step the field problems were identified, defined, and clearly stated. In order to characterize the problem dynamically, the behavior of the key variables is plotted over time to illustrate how the problem arose over time and how it might evolve in the future. Also, the time horizon for the problem under study is defined so that the cause and effects that are distant in time and space are not missed.
4.1.2. An endogenous explanation has been taken into considerat ion while working with the dynamics of the system. Endogenous means that the dynamics are generated within the system as a result of interactions and feedback among the various maintenance elements. To manage the model and prevent the field personnel from losing focus on the various problems, the model boundary diagram or subsystem diagram was well defined. This helped the research team in
defining the boundaries of our model and mapping the model based on the subsystem considerations. Next, a causal loop diagram and stock and flow structures were developed to map the causal links among the operating variables.

4.1.3. Our inability to infer correctly the dynamics of the complex system requires us to formulate the conceptual model that we have developed and simulate it using the software tools. Formalization helped us to recognize the vague concepts and resolve contradictions that were overseen during the conceptual phase. Each variable corresponds to a meaningful concept of the real-world scenario.
4.1.4 Testing partially involved the comparison of the model output with the real site data behavior of the system. The testing model was used for policy design and evaluation. One of the ways to design and test the policy was to change the values of some of the variab les and observe if the system performance improved.
4.1.5. We found most of the time, the high-leverage policies involved changing some of the feedback structures or time delays or the stock and flow structures. The robustness of the policies and their sensitivity to uncertainties in model parameters and structures were assessed under a range of alternative scenarios.
4.1.6. The interactions of different policies were also considered: because the real systems’ parameters were insufficient (no availability) for the test; and, hence showed highly non -linear in most of the cases.
4.2. Dynamic complexity and Feedback – study conclusion::
4.2.1. Complexity is defined in terms of the number of components in a system or the number of combinations one must consider in making a decision. This is called combinatorial complexity. Dynamic complexity can arise even in simple systems with low combinatorial complexity. Dynamic complexity results from the combination of interactions among system elements over time. Even systems with low combinatorial complexity can exhibit a high level of dynamic complexity Complex behavior is observed in systems that are dynamic, tightly coupled, governed by feedback, non-linear, counterintuitive, and policy resistant.
4.2.2. In complex systems nothing is stand alone and everything is connected to everything else. They interact with each other through feedback. In fact, the most complex behaviors usually arise from the interactions among the components of the system, not from t he complexity of the component themselves. Feedback processes along with the stock and flow structures, time delays, and nonlinearities determine the dynamics of the system. Causal loop diagrams [Figure – 2] were used for representing the feedback structure of the systems.
4.2.3. Feedback is one of the core concepts of system dynamics. It captures the interactions among the elements. A causal loop diagram consists of two or more causal links that connect the various elements in the model. Each link is assigned a polarity, as shown in figure-2, to indicate the direction of change of the affected element with respect to the causing element. A positive link means that if the cause increases the effect increases above what it would have been; and, if the cause decreases the effect decreases below what it would otherwise have been.
4.2.4. A negative link means that if the cause increases the effect decreases above what it would have been; and, if the cause decreases the effect increases below what it would otherwise have been. It is important to note that link polarities describe the structu re of the system and not the behavior of the variable parameters under test.
4.2.5. Three fundamental modes of behavior and three derived modes of behavior were taken into consideration while conducting this study. Each of these modes was generated from a particular type of system structure, which included a positive loop, a negative loop, and balancing loops with delays. An example, as shown in Figure – 3, is the exponential growth resulting from a positive feedback loop. The loop shows the general structure of a positive feedback loop. With the increase in the state of the system net increase rate increased, which further increased the state of the system. This caused the state of the system to grow exponentially as shown in the graph.

4 2.6. Simultaneously, goal-seeking behavior; oscillations that are observed frequently in dynamic systems; ‘S-shaped growth with overshoot and collapse; and, other modes of behaviors were also studied.

4.2.7. In some systems especially in HVAC and Chiller networks, it is extremely important to avoid failure during the operation as it can be dangerous or disastrous. Also given the cost associated with these systems and their importance for organizational performance, the availability and degradation of these systems over their operational phase are extremely important.
4.2.8. The economic impact of machine availability, reliability, as well as corrective maintenance costs, are demanding considerable improvement in maintenance techniques and operations to monitor machine degradation and defect faults in the production system. Hence , in order to improve system availability and reliability, various maintenance policies have to be proposed and tailored made to site assumptions and considerations. A typical sub-system failure is shown in Figure – 4.
5.0.

Another unified maintenance modeling framework with six classifying factors is developed for formulation and analysis of a wide range of maintenance systems, under which many existing

models in literature were formulated as optimal stopping models. A systematic optimization methodology was developed based on optimal stopping, semi -martingale, and λ- maximization techniques A concrete model was presented and solved as an example to illustrate the proposed modeling and optimizing methodology.
5.1. Maintenance Modeling Framework:
5.1.1. The diversity and complexity of maintenance problems from various practical situations have led to numerous concrete models and policies. While it is not possible to come up with a generic model that can describe all interesting situations and scenarios, it is feasible to generalize and reorganize the conceptual models under a unified maintenance modeling framework based on the essence of these problems.
5.1.2. We considered a maintenance system that consists of stochastically identical and independent units which are put into use sequentially in time. The unified maintenance modeling framework proposed for such a system includes six factors:
(i) Maintenance Horizon: it describes the time interval on which all the maintenance activities take place.
(ii) System Deterioration Dynamics: it describes how the system becomes more and more prone to failure.
(iii) Maintenance Actions: it describes various preventive measures and ways to rectify system failures.
(iv) Cost Structures: it describes the costs that are related to maintenance actions and the loss due to system failure.
(v) Information Level: it describes information on system conditions that is available for decisionmaking.
(vi) Objective Criterion: it describes the objective of maintenance management, which could be the minimization of cost or maximization of benefits.
5.2. In this study, we have proposed a unified maintenance modeling and optimization methodology for single-unit repairable systems, with which policy comparison and optimally verification are carried out in a systematic manner and a natural structure among many models is established.
5.2.1. The whole procedure of analyzing a maintenance policy problem can be described as follows –
a. Specify the six factors under the modeling framework.
b. Find the optimal policy in admitted stopping time class for each model. And,
c. Evaluate policies based on the related model comparisons.
5.2.2. A general maintenance modeling framework with six classifying factors was developed for formulation and analysis of a wide range of maintenance systems, under which m any existing models in literature could be nicely incorporated and reformulated as optimal stopping modes.
5.2.3. A systematic optimization methodology was developed based on o ptimal stopping, semimartingale, and ƛ-maximization techniques. A concrete model was presented and solved as an example to illustrate the proposed methodology, where the numerical analysis lead to some additional insights which are beyond the scope of this research.
6.1. Satisfaction surveys:
Any fault or defect discovered during the research was recorded and reported for immediate action [corrections of the defects]
6.2.Quality Control and Risk Assessment of Maintenance projects:
The quality of facility buildings was determined by desk top process design, materials’ quality of ongoing O&M process, and instant desk communication between facility users and ground O&M personnel. Quality management and Risk assessment cum mitigation were aimed to increase facility users’ and customers’ satisfaction.
6.3. Sustainability of the Built Environment:
Project performance has been considered in terms of cost, time , and quality that asserts sustainability development that has been divided into three typ es – Build for Durability (Social); Make the Environment Safe (Environment), and Use of Materials from Sustainable Resources (Economic). Sustainable development is a development that meets the needs of the present without compromising the ability of future generations to meet their own needs. However, in the future study, we may also research a different scenario placing local strategies in environmental sustainability, material resourcing, waste disposal, and energy management policies in an attempt to set up a framework to achieve a sustainability operation.
6.4. Use of Maintenance Control Computer-based program::
The replacement of the use of existing manual maintenance control toolkit, such as maintenance schedule, maintenance program, job specification, and facility register by computerized
maintenance software shall make the maintenance project planning, execution, monitoring and evaluation efficient and effective and reduce maintenance costs.
6.5. The study emphasized the great importance to put theoretical investigation into the practice. The proposed modeling framework of Dynamic Maintenance and Optimization procedures in fact is very convenient for the design and implementation of the O&M procedures vied a computerbased system.
6.6. From a user’s perspective, the model construction process makes it very easy to select a model that is most appropriate and tailored made to one’s own application needs. From a designer’s point of view, the common optimization procedures enable efficient implementation of the system. The availability of such a system further closes the gap between theoretical results and practical field needs.
6.7. The most promising and challenging topic in the field of maintenance is emerging Condition Based Maintenance [CBM], also known as Sensor Based Maintenance [SBM], which is both technology-intense and information-intense. The optimal stopping approach represents a very appropriate tool due to its strength in representing, processing, and utilizing information.
6.8. While some works have applied optimal stopping in CBM, a systematic investigation on this topic is still lacking and need wide-based research and investigations. It is a strong belief, after this research, that serious studies in CBM with Optimal Stopping methodology could contribute significantly to the pursuit of maintenance excellence.
6.9. As an ongoing process, we have developed the following semi-structured element-wise interview as an ideal approach for a similar study [Figure – 5].
Quality Control Unit
Project Design & Costing
Commission Consultants
Planning Department
Quality Assurance
Project Planning
In-House & Outsourced staff
Project Execution
Project O&M Department

Maintenance Strategy
Sustainable Programs
Cultural Influence
Maintenance Budget Survey of Users’ Satisfaction
Maintenance Methods
1. Beichelt, F. (1993), “A unifying treatment of replacement policies with minimal repair,” Naval Research Logistics 40, 51-57.
2. Bloch-Mercier, S. (2002), “A preventive maintenance policy with sequential checking procedure for a markov deteriorating system,” European Journal of Operational Research 147, 548 -576.
3. Block, H.W., Borges, W.S. and Savits, T.H. (1988), “A general age repla cement model with minimal repair,” Naval Research Logistics 35, 365 –372.
4. Block, H.W., Langberg, N.A. and Savits, T.H. (1990), “Maintenance comparisons: block policies,” Journal of Applied Probability 27, 649 -657.
5. Bahrami K, Prince J, Mathew J, “The constan t interval replacement model for preventive maintenance”, International journal of quality and reliability management, 2000, vol 17.
6. Aven, T. (1983), “Optimal replacement under a minimal repair strategy – a general failurev model,” Advances Applied Probability 15, 198-211.
7. Aven, T. and Bergman, B. (1986), “Optimal replacement times a general set-up,” Journal of Applied Probability 23, 432-442.
8. Aven, T. (1996), “Condition -based replacement policies - a counting process approach,”
9. Reliability Engineering and System Safety 51, 275 -281.
10. Aven, T. and Jensen, U. (2000), “A general minimal repair model,” Journal of Applied Probability 37, 187-197.
11. Barlow, R.E., Hunter, L.C. and Proschan, F. (1963), “Optimum checking procedures,” Journal of the Society for Industrial and Applied Mathematics 4, 1078 -1095.
12. Davies A., “Management guide to condition monitoring in manufacturing”,The institute of Production Engineers, 1990, London.
13. Kim C, Djamaludin I, Murthy D, “Warranty and discrete preventive maintenance”,
14. Reliability Engineering and System Safety, 2004; 84; 301 -309 Lam C., Yeh R., “Optimal maintenance-policies for deteriorating systems under various maintenance strategies”,
15. Dagpunar, J.S., Jack, N., “Preventive maintenance strategy for equipment under warranty”, Microelectronics and Reliability, 1994; 34 (6); 1089 –1093.
16. Block, H.W., Langberg, N.A., Savits, T.H., “Repair replacement policies”, Journal of Applied Probability, 1993; 30 (1); 194 –206.
17. The Building Commissioning Guide – GSA
18. Lincoln College, UK (H&SE Policy) - Mr. Ian Dobson, Executive Director for Facilities and Estates, KSA.
19. Conditioning Survey sittings – Mr. Anders Berndtsson,L&TS Resources Manager, Saab Saudi LLC, Riyadh.
Abdulilah
F. Alsaeedi1,2, Yasin Khan3, Ali M. Eltamaly2,41 Saudi Electricity Company, Operation and Control Business Unit, Riyadh, Saudi Arabia.
2 Sustainable Energy Technologies Center, King Saud University, Riyadh Saudi Arabia.
3 Electrical Engineering Department, King Saud University, Riyadh, Saudi Arabi a.
4 Electrical Engineering Department, Mansoura University, Mansoura, Egypt.
Abstract Most of the generation in Saudi Arabia consists of a centralized generation solely depending on oil and gas, to meet the country’s growing energy requirement. Distributed Generation Resources such as wind and photovoltaic, or any other approach t hat has been adopted lately. These distributed generation sources are normally placed close to load centers and are added mostly at the di stribution level in the grid system. This study focuses on the optimal size and placement of photovoltaic distributed generation units in the real power system in Layla Town, Kingdom of Saudi Arabia. The objective function of this research study is to reduce the generation cost, and r eal power losses while improving the system voltage profile. In addition, the Voltage Stability Ind ex is also considered with a certain related weighting factor in the objective function. The Particle Swarm Optimization method is used to allocate suitable distributed generation units in the system. The proposed technique is applied firstly to IEEE 33-bus distribution system for verification, then the transmission network of Layla town is used as a case study. Both models were simulated and executed using MATLAB. According to the results obtained, the optimal size and location of the distributed generation units can reduce real power losses ranging from 29% up to 41% depending on the system size, the amount of Variable Renewable Energy penetrated, and structure along with a substantial enhancement in the bus voltages.
Keywords Distributed Generation Resources, Photovoltaic, Loss Minimization, Particle Swarm Optimization
The rapid growth of the electrical energy demand in the Kingdom of Saudi Arabia is one of the greatest challenges. In the past, it has been eliminated by using conventional generation resources such as oil and gas. Nonetheless, Saudi Arabia initiates the national renewable energy program under Vision 2030 to increase the renewable energy share in the present energy mix with the ambitious aim to add 27.3 GW to the national grid by 2023[1]. The minister of energy stated, “The kingdom has taken its first step on the road to diversify its domestic energy mix as part of a long -term, sustainable economic vision and a goal of becoming a leader in renewable energy.” [2] Most of the generation in Saudi Arabia consists of centralized generation power plants that also include distribution and transmission network expansion infrastructure to meet the demand requirement. Distributed Generation (DG) is another approach that has been adopted lately. Distributed generation is a small generation source that is connected closely to the load. DG source could be conventional fuel or renewable-based small generation source. Fuel sources are usually small scaled gas turbines or diesel generators, and renewable sources are commonly solar-based or windbased [3]. An optimal allocation and size of DG will enhance several aspects of the network, it will minimize power losses, improve the voltage profile, increase system reliability, and reduce pollution, and it could be more economically viable than the centralized generation. However, non-optimal allocation and size could lead to an increment in power losses which might consider a burden to the system. For the optimum size and allocation purpose, complex integrative optimization techniques are required such as Particle Swarm Optimization (PSO) [4]-[6], and Genetic Algorithms (GA). Layla town network will be chosen as a case study to apply PV DG due to the severity and criticality of that spot. This article focuses deeply on finding the o ptimal size and allocation of PV DG, and three different aspects have been followed through this study:
• Studying network by running power flow analysis using MATLAB to find the power losses and voltage magnitude on each bus.
• Defining the optimization method used in this paper with its parameters, formulating it, and executing it.
• Observing the technical impact of optimally allocating the DG into the proposed case studies.
VSI Voltage Stability Index
�������������������� The real power losses at line ����
�������������������� The reactive power losses at line ����
B Buses of the network
�������� The voltage profile at bus ����
���������������� The reference voltage profile
���������������� The Voltage Stability Index at bus n
������������������������ The active power of the slack bus
������������������������ The reactive power of the slack bus.
������������ The active power of DG unit
������������ The reactive power of DG unit
�������������������� The total active load
�������������������� The total reactive load
������������ The position vector of particle ���� at time
������������ The velocity vector of particle ���� at time
t;
����1 , ����2 Acceleration constants
����1���� ���� , ����2���� 2 Random numbers chosen at time t.
���� Inertia weight.
In this paper, the objective function of the model will focus on real power losses minimization, and improving voltage in the network. The real power losses objective function will take total real losses of the system without DG integration as a refer ence base case with respect to system real losses with DG presence. While the vol tage improvement objective will look into two aspects of the system bus voltage profile, and Voltage Stability Index (VSI). The total objective function will be expressed as follows:
The total system real losses objective will be represented as:
The bus voltage deviation objective is described below:
The Voltage Stability Index (VSI) is given in equation (4):
Such that,
The objective function stated above is respected to the load flow constraints:
Also, the voltage profile at each bus must be in the permissible zone as given in the equation below. ����������������
|�������� |
���������������� ���� ∈ {1,2,3, , ����} (7)
In addition, the real and reactive power output of the DG units should be within the limits as given below. ������������
, �������� } (9)
Finally, power flow in the lines must obey the rated thermal limits in equation (10) below at all times.
Particle Swarm Optimization (PSO) basically, it is an optimization technique used to locate the optimum solution to complex optimization problem. The main inspiration of PSO algorithm is the animal’s movements. Where swarm means population in PSO, and particles indicates members of the population. In PSO algorithm each particle is randomly moving in different directions through the entire space looking for the best solution remembering the personal best solution and the position of its neighbor member. Each particle will update his position and velocity dynamically by communicating with global best particle in the swarm. In the end, all particles will move towards the best position until an optimal solution is reached. PSO algorithm introduced by Kennedy and Eberhart as a non-linear optimization technique inspired by observing the behavior of a flock of birds [8]. The main concept of PSO developed relay on group communication to share individual information such as a flock of birds search for food or migrate to better environment even though the group of birds does not know the optimal position. Eventually, an individual of the group will locate a desirable destination and he will share this information among the group driving them to go towards that position. To understand PSO algorithm model, let’s assume the global optimum of n dimension defined as:
Where �������� defined as the search variable that represents the set of variables for any given function. The desired purpose here is to find the value of ���� where the function ����(���� ) could be either a maximum or minimum value. In PSO algorithm, each member represents a possible solution. All members go through search space and adjust their position and velocity depending on its own knowledge and other particles too. Assume ������������ indicate particle ���� position vector search space at a time step ���� , then the updated position of that particle in the search space is given by:
Where ������������ ���� is the particle velocity vector used to update the particle own experience and other particles too in order to drive the optimization process.
The main idea of the global best PSO is each particle updates its position depending on the best position of a particle in the entire swarm. Suppose �������� , and �������� indicates the current position and velocity of each particle in the swarm respectively and ��������������������,���� signifies the personal best position of each member in search space. Taking a minimization prob lem as an example, ��������������������,���� would be the position of particle ���� in search space with the smallest value that predetermined by the objective function. Thus, global best position �������������������� will be equal the lowest value between all the personal best values. The personal and global best positions will be evaluated and determined in each iteration as follows:
�������������������� ,���� ����+1 = {�������������������� ,���� ���� �������� ����(������������+1 ) > �������������������� ,���� ���� ������������+1 �������� ���� (������������+1 ) < ��������������������,���� ���� (13)
�������������������� = min(��������������������,���� ���� ), ����ℎ������������ ���� ∈ [1, , ����] ������������ ���� > 1 (14)
In this paper, several locations have been examined and evaluated to choose the suitable location as a case study to apply Distributed Generation (DG). The criteria for nominating these locations were based on the criticality and sensitivity of the location. Layal town transmission system was nominated as a case study since the load of the town considered critical due to industrial factories located nearby, the transmission system of the town fed from single switching substation (8712 S/S) and small power plant (Layla Power Plant) that will be retired soon, and it is been noted that there are many voltage violations on some buses during peak time [9]. Also, the average daily global horizontal irradiance is 6482 Wh/m2 [10], thus the location has a great potential for installing PV DG. Single line diagram of Layla transmission system shown below. Table 1 and 2 presented the line and bus data of the Layla network.
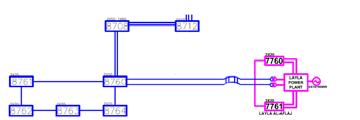

Firstly, tests have been conducted on IEEE 33 -bus radial distribution system to validate the results. the load flow analysis was carried without inserting DG’s in order to calculate the total real power losses of the system and bus voltage profile. Numb er of DG’s was chosen to be 3 units with a size vary between 0.1 and 2 MW. PSO global best method was designated in this study with the desired parameters listed below after trying several options.
Regarding the inertia weight, linear decreasing approach mentioned earlier was conducted with an upper value of 0.9 and lower value of 0.4 [11]. Successively, the three DG’s inserted in the most sensitive buses 15 and 13 with an optimal total size of 2.81 MW. As a result, the total real power losses reduced from 0.176 MW to 0.103 MW with a reduction of around 41%. Voltage profile improvements after inserting DG’s with the optimal size and location obtained are demonstrated in the figure below.

In the second model same parameters and configuration used in the IEEE-33 Bus radial distribution system applied here, except it was assumed a 5% growth in the load due to future residential expansion. The results show the three DG’s will be placed on busses 3, and 1 respectively with an aggrega ted size equal 3.22 MW. The total real power losses initially were 0.206 MW and decreased to 0.146 MW after DG integration with an approximate reduction of 29%. Moreover, the bus voltage profile of the network summarized in figure 5
It is worth mentioning the bus voltage profile improved but turn slightly above 1 p.u. value on some buses. However, the execution time was slower than the previous test system, and the fina l solution obtained in the thirty seventh iteration as demonstrated in the figure below.


In this article, IEEE-33 bus radial distribution system and Layla town transmission system was selected for placing PV DG with optimal size and location. The PSO global best optimization algorithm used in this case with an objective function focuses on real power losses reduction and improve bus voltage profile. From the results obtained in this paper it can clearly notice the optimal allocation of multiple PV DG’s would reduce the real power losses up to 41% in IEEE 33 bus system and 29% in the Layla network. Furthermore, bus voltage profile generally improved with the optimal PV DG integration. However, placing PV DG’s in Layla case study revealed the bus voltage profile might increase above 1 p.u. value. Finally, PSO global best optimiz ation method approved its superiority in this study, and the final solution reached within short period of time, and PV DG might be considered as an optimal solution in the future.
[1] www.powersaudiarabia.com.sa
[2] Saudi Arabia Awards First NREP Solar Projec. (2018, February 06). Retrieved from https://www.powersaudiarabia.com.sa/web/attach/news/300MWSakaka-Solar-PV-Project-Awarded.pdf
[3] Albadi, Mohammed & Soliman, Hisham & Thani, Mahmood & Al -Alawi, A. & Al-Ismaili, S. & Al-Nabhani, Ahmed & Baalawi, Haitham. (2017). Optimal Allocation of PV Systems to Minimize Losses in Distribution Networks Using GA and PSO: Masirah Island Case Study. Jou rnal of Electrical Systems. 13. 678-688.
[4] Eltamaly, Ali M., and M. S. Al-Saud. "Nested multi-objective PSO for optimal allocation and sizing of renewable energy distributed generation." Journal of Renewable and Sustainable Energy 10, no. 3 (2018): 035302.
[5] Khaled, Usama, Ali M. Eltamaly, and Abderrahmane Beroual. "Optimal power flow using particle swarm optimization of renewable hybrid distributed generation." Energies 10, no. 7 (2017): 1013.
[6] Farh, H. MH, A. M. Al-Shaalan, Ali M. Eltamaly, and A. Al-Shamma’A. "A Novel Crow Search Algorithm Auto-Drive PSO for Optimal Allocation and Sizing of Renewable Distributed Generation." IEEE Access 8 (2020): 27807 -27820.
[7] Danish, Mir Sayed Shah & Senjyu, Tomonobu & Danish, Sayed Mir Shah & Sabory, Najib Rahman & Krishnan, Narayanan & Mandal, Par as. (2019). A Recap of Voltage Stability Indices in the Past Three Decades. Energies. 12. 1544. 10.3390/en12081544.
[8] Talukder (2011). Mathematical Modelling and Applications of Particle Swarm Optimization by Satyobroto.

[9] Saudi Electricity Company, National Control Center Department, 2019.
[10] Erica Zell, Sami Gasim, Stephen Wilcox, Suzan Katamoura, Thomas Stoffel, Husain Shibli, Jill Engel -Cox, Madi Al Subie, Assessment of solar radiation resources in Saudi Arabia, Solar Energy, Volume 119, 2015, Pages 422 -438, ISSN 0038-092X,
[11] Xueyan, Lin & Zheng, Xu. (2015). Swarm size and inertia weight selection of Particle Swarm Optimizer in system identification . 1554-1556. 10.1109/ICCSNT.2015.7491026
Abstract - The Maintenance and Asset Management activities are important tools in the Architecture, Engineering, Construction, and Operation (AECO) sector. These activities promote proper management of the resources involved and increase competitiveness. These issues are in constant evolution along with the widespread adoption of information systems and new technologies. The use stage is a relevant one in the building life cycle because it covers an extended range of time with several economic variables with associated uncertainty. Accurate cost estimation, during this stage, thus contributes to improving the economic performance throughout the building life cycle. This paper presents a framework of Maintenance and Asset Management and highlights its origin and evolution over the last decades, including the sc ientific developments as well as applicable specifications and standards. It also presents case studies related to buildings for collective use, to demonstrate the benefits of Maintenance and Asset Management activities integration, to improve economic per formance.
Keywords: Maintenance; Asset Management; Facility Management; BIM; COBie; Buildings; Collective Use
1. Introduction
The importance of Asset Management has been under development and discussion, for several decades, connected with the life-cycle concept. This is not a recent discipline. Asset Management activities, in an organization, integrate several fields including engineering; financial management; risk management; logistics and support; relationship with customers; environmental management and legislation; and finally, asset life cycle requirements [1].
Although this evolution is only thought of as a change in semantics, it is more certain that its functions and responsibilities evolve alongside changes in nomenclature. Asset Management is a terminology that has been used in organizations and can present different meanings, depending on the country or sector where it is used [2]. Research studies, all over the world, demonstrate the importance of Asset Management in different areas, levels , and applications. It is verified that this concept is used more in the financial area and is less used in the area of engineering and Maintenance [3,4]. Over time, Asset Management activities acquired growing importance in organizations. It corresponds to the natural evolution of the organization’s operation and monitoring of its assets in order to achieve resource optimization. I t also achieves the evolution of the AECO sector requirements, the increasing need for reliability, and the assurance of quality in the products’ supply and services. The need for optimization in Asset Management activities is visible in the progressive in crease of the regulatory entities’ requirements in different service areas [5].
Until recently, the attention of stakeholders was mainly directed toward the reduction of construction costs, and only a few paid attentions to the reduction of the maintenanc e and operation costs of buildings. While architects and planners can refer to several tools for the planning and calculation of construction costs, calculation methods for use costs are scarce and not very accurate. It has been reported that between 70% a nd 85% of the building Maintenance and Operation costs can be influenced during the design stage, which is a significant part of the total building life cycle costs [6].
The publication of the Institute of Asset Management [7] emerged with the purpose of providing a broader view of the Asset Management discipline. It is based on an integration of all groups of activities and emphasizes the importance that Asset Management has in fulfilling organizational objectives.
In Australia, under a scenario of reduc ed service levels, cost increases, and low-quality planning, a restructuring was carried out in the public sector, in order to establish strategies for planning, prioritizing , and assessing the cost/benefit ratio of assets [7]. In this context, the Asset M anagement Council published a compilation of definitions and models related to this discipline. It systematizes an Asset Management conceptual model, where risk management allows "all organizations to understand and develop an appropriate balance between t he cost of doing something, the risk resulting from the expense of those resources, and the expected result of the performance of the asset and the organization" [8]. In order to reduce the costs associated with assets, without compromising the performance of other requirements, a critical and holistic view of the entire life cycle is required. However, this task faces new challenges when applied, not only to the built asset, but to the entire project that encompasses it, and even more when it comes to the management of a program or portfolio simultaneously by an organization [9].
Buildings for public use are those managed by entities of the public administration, direct and indirect, or by companies providing public services and intended for the general public, while buildings for collective use are those intended for commercial, hotel, cultural, sports, financial, tourism, recreational, social, religious, educational, industrial and health activities, including buildings of the same nature activities.
The concept of Maintenance has several definitions, depending on the author. Building maintenance is currently difficult to define and precise, covering various activities such as building inspection, service execution , and small repairs and replacements, providing functional elements to maintain their quality [10].
The term Maintenance is defined in ISO 15686 -1, as a combination of technical and administrative actions that allow the building and its constituent elements to perform, during their useful life, the functions for which they were designed [11]. In Brazil, th e NBR 5674 standard defines Maintenance as a set of activities to be carried out to conserve or recover the functional capacity of the building and its constituent parts, in order to meet the needs and safety of its users [12]. According to British Standar d 3811, Maintenance is the combination of all actions taken to maintain the building or to restore it to a reasonable state, clarifying that the maintenance of a building includes tasks such as inspection, cleaning, repair , and replacement of various systems or elements [13]. In Portugal, there is no norm or legislation that defines the concept of building maintenance. The standard NP EN 13306: 2007 defines the term of Maintenance, as the combination of all technical, administrative , and management actions, during the life cycle of an asset, aimed to keep it in a state in which it can perform the function required [14]. All Maintenance concepts defined above, meet common objectives, such as [15]: i) give better performance to the building and its elements, trying to restore its initial quality; ii) improve the useful life of buildings and their elements; iii) avoid high costs with major repairs , and iv) ensure the performance requirements established in the project.
Facility Management (FM) emerged in the late 1960s, in the United States of America, in order to describe the growing practice followed by outsourcing banks in the responsibility of processing credit card transactions for specialized suppliers [16]. This activity h as been growing a lot since there is a greater concern with the phase of exploration and operation of the facilities. Currently, in a building with a useful life of 50 years, it is estimated that its operating costs can exceed 80% of the total costs and on ly 20% of the costs are applied to its design and
construction. In Portugal, the first steps at the FM level were taken in 2006, and the Portuguese Facility Management Association (APFM) was formed with the objective of disseminating and developing the FM “as the integrated management of workplaces and environments”, with the purpose of optimizing spaces, processes , and technologies [17]. Although there are several definitions for FM, all of them converge in the main idea [18]: FM is a concept that aggregates resources such as people, properties, and experience in process management, in order to provide vital support services for the organization [19].
An asset is something capable of generating potential or effective, tangible or intang ible, financial or nonfinancial value, considering its useful life from conception/acquisition to its end-of-life phase. According to ISO 55000, Asset Management (AM) comprises a coordinated set of activities from an organization to obtain value through it s assets, being formulated comprehensively to adapt to specific asset needs, changing contexts, and differences of the organizations. In this sense, AM is the set of coordinated activities that an organization uses to see its assets generate value. The benefits of AM may include: i) improved financial performance; ii) informed decisions on asset investment; iii) risk management; iv) improvement of services and results; v) demonstration of social responsibility; vi) demonstration of conformity; vii) improvin g reputation; viii) improving the organization's sustainability; and ix) improving efficiency and effectiveness [19, 20].
2.5. BIM and COBie
Building Information Modelling (BIM) allows you to manage installations by visualizing them, based on accurate and precise information about systems and equipment, their locations, and technical specifications, among others. From the outset, this information in a three -dimensional digital model appears to be a huge advantage over traditional (2D) drawings. Since the BIM model contains all the necessary information for an installation, it is possible to carry out its strict management, including maintenance and operation. In fact, this will be one of the great advantages of BIM since, by controlling all the elements of an installation, it facilitates any type of intervention. BIM, in Facility Management, goes through the specification of the necessary information during the entire design and construction phase, so that this information can later be used in the operation ph ase. By doing automation through BIM, the possibility of generating equipment inventories, such as a Computerized Maintenance Management System (CMMS), is also created. The advantages are not only visible in terms of cost reduction but also in quality gains in the response to customers [21]. The BIM Project Execution Planning Guide [22, 23] provides guidelines for the implementation of FM in BIM methodology. The possibility of using BIM for FM is the use of features presented by the BIM model to the Facilit y Manager. Through this model, you can collect geometric or non-geometric information and manage the building in an efficient and organized way [24].
Construction Operations Building information exchange (COBie) [25] is an international standard that rela tes to the exchange of building information and is mostly used in product data handover, from the construction team to the operation team. It is, in addition to other proprietary formats of commercial applications, an information-sharing format for the cycle of a given installation, which allows for the organization of all information, from the initial process to its exploitation. COBie was created in the USA by building SMART, which corresponds to a format that intends to “manage the exchange of information about assets” despite “not adding new requirements to contracts, it only changes the way documents are delivered in a standardized way” and aims to describe spaces and equipment. The exchange of information occurs in the first instance at the end of the construction, however , the maximum efficiency exponent of COBie will be obtained during the life cycle of an installation, when there is a need to share information regarding spaces or equipment [26].
Long-term economic sustainability represents an important factor in the AECO sector. To assess the building economic sustainability, the Life-Cycle Cost (LCC) approach can be used. LCC is defined as the cost of a building
throughout the consecutiv e and interlinked stages of its life while fulfilling the technical and functional requirements [27].
In the sustainability context, several standards related to the LCC concept have been published, such as EN 156434 [27] and EN 16627 [28]. On the other hand, EN 16646 [29] related to maintenance within physical asset management, highlights the importance of the use stage throughout the building life cycle. Following the need to unify FM in the European space, CEN adopted the following standards EN 15221: i) Part 1: Terms and Definitions;
ii) Part 2: Guidelines for the elaboration of FM agreements; iii) Part 3: Guide57 lines for quality in FM; iv) Part 4: Taxonomy, classification and FM structures; v) Part 5: Guidelines for FM processes; vi) Part 6: Measure ment of FM areas and spaces; and vii) Part 7: Benchmarking [19]. The Institute of Asset Management (IAM), in partnership with the British Standard Institute (BSI), developed PAS 55 specification [30], which defines Asset Management as the systematic and coordinated activities and practices, that an organization uses to manage its assets and systems in an optimal and sustainable way.
The international standards series, ISO 55000 [20], defines the requirements for an appropriate Asset Management system throughout the asset’s life cycle and considers that the value realization requires a balance between the cost, risk, and benefits of the asset over different time periods.
This series of norms establish principles, requirements, and guidelines for the implementation of Asset Management. International cooperation confirmed that the common practices identified can be applied to an ample range of assets in diversified organizations and cultures. Adherence to these standard procedures provides the expected benefits: predictability and consistency.
EN 16646 introduces Asset Management as a framework for Maintenance activities. It also introduces the relationship between organizational strategic planning and maintenance management systems and describes the interrelations between the maintenance process and all the other physical asset management processes. It addresses the role and importance of Maintenance within the Asset Management system during the whole life cycle of an item.
It is important to structure the data related to the economic information of buildings during the use stage. According to EN 15643-4, the building life cycle economic information is divided into three groups: i) before the use stage; ii) use stage, and iii) after the use stage. Table 1 shows the organization and the types of costs to be included, for structuring economic data during the use stage of buildings.
Use Stage Typical scope of costs
Operation
Maintenance
Repair
Building-related facility management costs; Cyclical regulatory costs; Building -related insurance costs; Subsidies and incentives; Professional fees.
Costs related to all components and products used in maintenance activities; Cleaning; Land and garden maintenance costs, consistent with the environmental assessment; Costs related to processes to ensure functional and technical building performance; Rede coration; Disposal inspections at end of the lease period; End of the lease; Taxes on goods and services; Subsidies and incentives; Professional fees.
Repair of minor components / small areas; Repair of major systems and components; Costs related to repair waste management; Taxes on goods and services; Subsidies and incentives; Professional fees.
Replacement
Replacement of minor components / small areas; Replacement of major systems and components; Costs related to replacement waste management; Revenue from sale goods, elements or components; Taxes on goods and services; Subsidies and incentives; Professional fees.
Operational energy use
Operational water use
3.1.
Costs related to new building components; Costs related to planned refurbishment; Costs related to building adaptations; Costs related to refurbishment; waste management; Revenue from sale goods, elements, or components; Taxes on goods and services; Subsidies and incentives; Professional fees.
Energy costs related to fuel and electricity for heating, domestic hot water, cooling, ventilation, lighting, power , and other systems; Taxes; Subsidies and incentives.
Costs related to water for consumption, sewerage, hot water, irrigation, roofs or green facades, heating, cooling, and ventilation, specific systems; Taxes; Subsidies, and incentives.
This case study covers a portfolio of 166 public school buildings (buildings for collective use constructed in Portugal). Costs related to operation (B1), maintenance (B2), repair (B3), replacement (B4), rehabilitation (B5), energy consumption (B6), and water consumption (B7) over their use stage were collected. The time period begins in the 1940s, with the original construction, and ends after the rehabilitation interventions that were h eld between 2007 and 2011. The building portfolio has a total constructed area of 2,404,500 m 2 and an estimated use stage net costs of 5,12 billion euros [31]. This portfolio is heterogeneous, both in terms of the morphological buildings type and their architectural and constructive quality. Although mainly composed of standard solutions resulting from the application of standard project designs, it comprises buildings with a recognized heritage value, as well as others in which innovative solutions were tested (at the time of construction) in spatial and constructive terms [32]. Historical data collection involved dealing with economic data dispersed in different public entities with different information organization formats. Some of the main contributors to the information included the following public entities: i) Portuguese Ministry of Education (data from 1942 to 1989), and Portuguese General Services of School Facilities and secretariat of school buildings (data from 1989 to 2008), with information in paper format; and ii) information management systems (data from 2007 to 2009), with information in informatic files format, consulted in the Portuguese public entity that is currently responsible for the building management activities. The costs were collected as real costs (cost expressed as a value at the base data, including estimated changes in price due to forecast changes in efficiency and technology but excluding general inflation or deflation). Nominal costs ( an expected price that will be paid when a cost is due to be paid, including estimated changes in price) were obtained using a multiplication factor that considers the annual inflation/deflation rate during the period of analysis [31]. Figures 1 and 2 represent examples of economic performance indicators (time series) obtained with the historical data obtained and structured in a standardized way (see Table 1).
This case study corresponds to a portion of the Colombo Shopping Centre car park and arises from a partnership between the National Civil Engineering Laboratory (L NEC) and SONAE-Sierra Portugal. To support FM activities, the BIM methodology and the COBie standard were used.
To model the building for FM purposes (Figure 3 to Figure 5), over 6,000 PDF files of the different design specialties, made available by SONAE-Sierra Portugal, were used. However, much of the information was irrelevant to the BIM modeling. After a careful analysis of all available files, the following specialties were modeled: i) Architecture; ii) Structure; iii) Electric network; and iv) Fire N etwork. It should be noted that the modeling of architectural and structural specialties was much easier than the modeling of the electrical network and the fire network because there were plants in AutoCAD of the first two specialties and these presented a very acceptable degree of updating.


One way to export information from a BIM model project to COBie data sheets is through the plug -in that is made available by Autodesk, called COBie Toolkit. For the present case study, this was the one used, presenting itself as the most advantageous solution, because there was a lot of information about how the plug -in worked and the basic steps to familiarize yourself with COBie. The great advantage of using COBie associated with a BIM model is the fact that it generates data sheets, with all the information available in the organized model, and serves these data sheets (Figure 6) for the manager to carry out the maintenance and operation processes, in the most effi cient way possible. From these sheets, it is possible to trace plans that guarantee the correct management of the facilities.


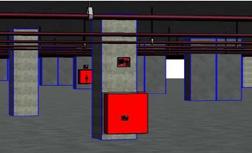


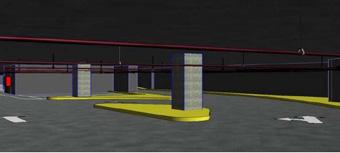
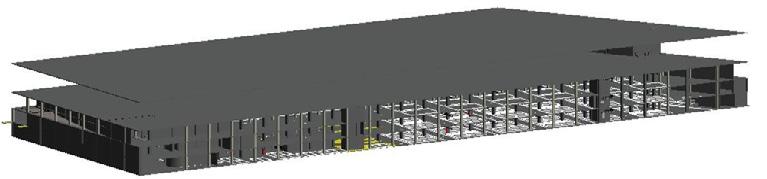
Since all the information is in the BIM model, it is possible to create alerts when there is a need to repair or replace a certain element. For these alerts to be created, it is up to the facility manager to provide information on when a particular element should undergo changes or not. Thus, since previous work has been done on the vari ous elements, the right time to carry out interventions will be known. With the adoption of these methodologies , it is possible to have planned maintenance, which leads to fewer failures. After the BIM modelling of the facilities under study and after it w as proposed to carry out its management using FM software, a survey of the necessary steps was taken to follow, with a view for structuring a method for altering COBie: i) analysis of the documents provided, verifying which are relevant to the BIM model; i i) evaluation of the design final drawings, to verify that they are identical to the existing reality; iii) if they are out of date, outline a method for updating them, in order to facilitate BIM modelling (in situ survey, laser scanning, etc.); iv) survey of equipment and elements present in the facilities, through documents or visits in situ; v) after collecting all the information about the equipment and elements, search the manufacturers' websites and BIM websites for availability in a compatible format ; vi) analysis of the information provided by the manufacturers and websites of BIM objects and identify the need for more information for the FM objectives; vii) in case of lack of information on the objects, place it manually right at an initial stage, so that all elements have the necessary information for a later efficient management of the facilities; viii) after placing the information on the BIM objects, make the modeling of the various specialties, based on the design final drawings provided or on t he final drawings updated by the manager, or through the survey by laser scanning, if available; ix) create a BIM file for each specialty, to do not make the model too heavy; x) after the modeling is finished, the errors of the different specialties must b e corrected; xi) installation of the COBie extension in Revit; xii) filling in the COBie parameters automatically, by exporting the data present in the families of elements; xiii) verification of parameters filled in automatically; xiv) if some parameters are missing, manually fill them in the various elements; xv) through the extension, choose which parameters are intended to be exported to COBie sheets; xvi) export the parameters to the data sheets; xvii) check on the COBie sheets if all the information necessary for the correct management of the facilities is placed , and xviii) control the COBie sheets so that everything is in accordance with what is intended, checking the need for interventions through the information placed on the sheets and, whenever n ecessary, updating the various elements present in the model. It is only necessary to update what is missing, there is no need to create new sheets, as COBie allows updates [33]. When using BIM and COBie together, it is essential that all the information contained in the model is available in a succinct and organized manner so that the model is constantly updated in order to provide correct management of a facility. With the growth of BIM, new opportunities are available in the architecture, engineering, c onstruction, and operation sectors, because the concept facilitates communication between all stakeholders. The association of Maintenance and FM with this concept will have enormous advantages, as there will be only one working environment, allowing professionals to work more effectively and keep themselves updated throughout the various


process phases. Choosing the COBie extension to solve the problem of how and when information for installation management should be collected further, improves the efficie ncy of FM.
In this case study, and for Asset Management purposes, the Architecture and Facilities Networks (MEP) design specialties of an Operative Laboratory Unit for Hydraulic Tests (OLUHT) in scientific research use, were modeled The structure specialty was excluded because, in this case, its components do not need frequent maintenance, being just objects of regular inspections. For the application of the BIM methodology in OLUHT Asset Management, a commercial BIM software was chosen and the plug -in for connection with Asset Management used was COBie. First, the BIM model of Architecture and MEP was created (Figure 7), then all the necessary information was added, such as equipment, types, location, and characteristics, among others. Afterward, all the information was exported to the data sheets (COBie). This way, Asset Management of the OLUHT installation takes place in an easier way.


For the development of asset management in the facilities under study, a set of duly identified processes was prepared, in accordance with ISO 55000 standards and the PDCA management cycle (Plan, Do , Check, Act / Action).
The first stage (Plan) corresponds to the definition of OLUHT asset management strategy and requirements. In this stage, strategic objectives, that correspond to w hat is intended to be achieved with UOLEH's asset management activities, were defined. The implementation of strategic asset management objectives was triggered by the following situations: i) aging of facilities; ii) increased service requirements; iii) i ncreased economic and environmental requirements, and iv) analysis of the cost/efficiency ratio. In this second stage (Do), a set of information was grouped for the implementation of the Asset Management Plan centered on the Comprehensive and Integrated Model of Industrial Asset Management (MAIGAI model) [34] and on the maintenance activities. This MAIGAI model aims to apply the ISO 55001 standard and proposes a methodology applicable to hydraulic testing facilities. The main elements considered for the asset management system at the OLUHT facilities are: i) business management (a clear view of the laboratory and its activities, good leadership, good communication skills, etc.); ii) engineering (concept of environmental impact, concept of risk/reliability); iii) operation and maintenance (continuous improvement, teamwork, reliability, etc.); and iv) asset manager (person responsible for verifying that asset management plans and regulatory legislation are being met).
In the third stage (Check), the efficie ncy of the asset management system and the performance of this activity at UOLEH is monitored. This way they can identify themselves, through a detailed process of a SWOT analysis (Strengths, Weaknesses, Opportunities, Threats) and a definition of the Matu rity Degree of asset management, the
need for improvements, and/or the necessity of errors correction and subsequently implement them (in the Action Plan). For the assessment of the degree of maturity, 29 questions were asked for each of the 27 requirement s of ISO 55001, prepared by IAM in 2014. The degree of maturity obtained was level “2” (Development).
In the final stage (Act or Action), efforts should be made so that, when occurs the event of nonconformity or an incident in the assets, asset management, or asset management system, certain actions are carried out, such as i) taking measures to control and correct; ii) dealing with the consequences; iii) assess the need for action to eliminate the causes of incidents, so that it does not recur or does not occur; iv) determine the causes of the non -compliance or incident, and v) determine the existence of similar nonconformities or the susceptibility of occurring.
Buildings for collective use represent an investment effort that mobilizes significant financial resources from public or private budgets, which are restricted. However, while it is increasingly important to justify investments and subsequently associated expenditure over several decades or even centuries, information relating to the economic performance over the use stage of those buildings is practically unknown.
The Maintenance and Asset Management activities do not directly address overarching issues such as policy and strategy for organizations but can be used to support decision-making processes in building projects or in managing building asset portfolios. It is also a driver for engaging stakeholders with noneconomic aspects of sustainability and encouraging environmentally sound building design, namely by highlighting the economic relevance of energy efficiency or water savings throughout the lifecycle of a building. It contributes to more accurate cost estimates over the life cycle of a building w hile optimizing maintenance and operation costs.
The demands for the AECO sector include the need to gather standardized information on the use stage and the creation of economic databases. This paper addresses these concerns and describes case studies t o demonstrate the generation of data on buildings for collective use constructed in Portugal.
The authors recognize the contribution of Eng.ª Svetlana João and Eng.º Tomás Fuzil from ISEL for some of the results used in the development of the case studies presented.
References
[1] IBM. The evolution of Asset Management - Finding the Right Best Practice is Not All Theory. 2007, United States of America.
[2] Davies, R., Register, L. PAS 55 - Why do we need a standard and how does it help ?. Water Event, 6th Institution of Engineering and Technology, 2008, 22, p. 1 -33.
[3] El-Akruti, K., Dwight, R. Research methodologies for Engineering Asset Management . Proceedings of ACSPRI Social Science Methodology Conference, 2010, Sydney, Australia.
[4] Henderson, K., Pahlenkemper, G., Kraska, O. Integrated Asset Management – An Investment in Sustainability, Procedia Engineering, 2014, 83, p. 448 -454.
[5] Abdelhamid, M.; Beshara, I.; Ghoneim, M. Strategic asset management: Assessment tool for educational building in Egypt. HBRC Journal, 2015, 11:1, p. 98 -106.
[6] Biondini, F. & Frangopol, D.M.: Proceedings of the first international symposium on life -cycle civil engineering. The first international symposium on life -cycle civil engineering. 2008. Varrena, Lake Como, Italy: Taylor & Francis Group, London, UK.
[7] IAM. (2012). Asset Management - an anatomy. Institute of Asset Management, Bristol, UK.
[8] AMBOK. (2014). Asset Management Body of Knowledge. Framework for Asset Management (2nd ed.). Melbourne, AU: Asset Management Council, UK.
[9] Salvado, F.; Almeida, N.; Azevedo, A. (2018). Towards imp roved LCC-informed decisions in building management. Journal of Built Environment Project and Asset Management , Vol. 8:2, pp.114-133.
https://doi.org/10.1080/09613218.2019.1612730
[10] Raposo, S. (2011). A gestão da manutenção em edifícios públicos, modelo e definição de estratégias para uma intervenção sustentável. Tese de Doutoramento, Instituto Superior Técnico.
[11] International Organization for Standardization. (2000). ISO 15686 -1 -Buildings and constructed assets -Service life p lanning -Part 1: General principles. Geneva, Switzerland, Suiça: Internacional Organization for Standardization.
[12] Associação Brasileira de Normas Técnicas. (1999). NBR 5674 -Manutenção de edificações Procedimento. Rio de Janeiro
[13] British Standard Institution. (1984). British Standard 3811 -glossary of maintenance management terms in terotechnology. London.
[14] Salvaterra, L. (2009). Processos de manutenção técnica de edifícios em revestimentos de piso. Faculdade de Engenharia da Universidade do Porto.
[15] Plácido, R (2013), Proposta de Modelo de Avaliação do Estado de Conservação de Equipamentos Escolares, Dissertação de Mestrado, Instituto Superior de Engenharia de Lisboa.
[16] Price, I (2012) The selfish signifier: Meaning, virulence and transmissib ility in a management fashion. International Journal of Organizational Analysis, 20(3), 337–348. https://doi.org/10.1108/19348831211243848
[17] Nik-Mat, N., Kamaruzzaman, S., Pitt, M. (2011) Assessing the maintenance aspect of Facili205 ties Management through a Performance Measurement System: A Malaysian case study. Procedia Engineering, 20, 329–338. Kuala Lumpur: International Building Control Conference. Disponível em: https://doi.org/10.1016/j.proeng.2011.11.174
[18] EN15221: 2016. Facility Management: I ntegration of processes within an organization to maintain and develop the agreed services which support and improve the effectiveness of its primary activities. CEN Comité Européen de Normalisation.
[19] Falcão Silva, M.J., Couto, P. (2019), Facility and asse t management on BIM methodology, CIAC2019Conference on Automation Innovation in Construction 2019. Instituto Politécnico de Leiria, Leiria, 7 e 8 de novembro,
[20] International Organization for Standardization. (2014) ISO 55000: 2014. Asset managem ent - Overview, principles and terminology. Geneva, Switzerland, Suiça: Internacional Organization for Standardization.
[21] GSA. BIM Guide for Facility Management, General Services Administration 1 –5 (2011). Washington: U.S. General Services Administration, GSA Building Information Modeling Guide Series: 08.
[22] CIC (2011a) - BIM Planning Guide for Facility Owners, Version 2.0. Pennsylvania: Manual para Facility Management. The Pennsylvania State University, University Park, PA, USA.
[23] CIC (2011b) - Computer Integrated Construction Research Program. BIM Project Execution Planning Guide, Version 2.1. Pennsylvania: Manual para Facility Management, The Pennsylvania State University, University Park, PA, USA
[24] Rodas, I. (2015). Aplicação da M etodologia BIM a Gestão de Edifícios. Porto: Faculdade de Engenharia da Universidade do Porto, Dissertação de mestrado.
[25] Sousa, F. (2013). A evolução de um modelo BIM de construção para gestão de empreendimentos. Porto: Instituto Superior de Engenharia do Porto, Dissertação de Mestrado.
[26] Silva, J. (2013). Princípios para o Desenvolvimento de Projeto com Recurso a Ferramentas BIM. Porto: Faculdade de Engenharia da Universidade do Porto, Dissertação de Mestrado.
[27] EN 15643-4:2012 Sustainability of constructi on works. Assessment of buildings - Part 4: Framework for the assessment of economic performance. European Committee for Standardization (CEN).
[28] EN 16627:2015 Sustainability of construction works. Assessment of economic performance of buildings –Calculation method. European Committee for Standardization (CEN).
[29] EN 16646:2014 Maintenance - Maintenance within physical asset management. European Committee for Standardization (CEN).
[30] PAS 55:2008. Specification for the optimized management of physical assets. B ritish Standard Institute (BSI).
[31] Salvado, F.; Almeida, N.; Azevedo, A. (2019). Historical analysis of the economic lifecycle performance of public school buildings. Building Research and Information . Vol.47:7, pp. 813 -832. https://doi.org./10.1080/0961321 8.2019.1612730
[32] PE. (2011). Parque Escolar 2007 -2011. Intervenção em 106 escolas. Lisboa: Parque Escolar EPE, DireçãoGeral de Projeto - Área de Edificações. [In Portuguese].
[33] Fuzil, T. (2017). Facility Management no Building Information Modelling, Disser tação de Mestrado, Instituto Superior de Engenharia de Lisboa.
[34] Martins, J (2015). O papel da engenharia na gestão de ativos de uma unidade industrial. Instituto Superior de Engenharia de Lisboa. Lisboa, Portugal.
[35] João, S. (2019). Metodologia BIM aplicada à gestão de ativos, Dissertação de Mestrado, Instituto Superior de Engenharia de Lisboa.
Rami
Alsodi 1, Mohamed G. Arab2, Mufid Samarai11 Sharjah Research Academy, Government of Sharjah P.O. Box 2580, Sharjah, United Arab Emirates; ramy@sra.ae; mufid.samarai@sra.ae
2 Department of Civil and Environmental Engineering, College of Engineering, University of Sharjah P. O. Box 27272 Sharjah, Sharjah, UAE marab@sharjah.ac.ae.
Abstract - Bio-mediated techniques such as Microbial induced carbonate precipitation (MICP) and Enzyme induced carbonate precipitation (EICP) have shown great potential as sustainable and environmentally friendly binder alternatives to conventional cementing binders. These techniques can modify and enhance the mechanical properties such as strength, stiffness, and permeability of construction materials
MICP and EICP rely on the precipitation of calcium carbonate as a basis for improving the mechanical properties of soils More recently, these techniques have also shown great potential for concrete crack healing. These methods have great potential to reduce production and operation costs and the environmental impact of concrete.
This review paper will explore the application of both MICP and EICP in mortar crack healing and the potential of using these methods as a maintenance tool for construction materials. These methods can be utilized in overall asset management, especially in the middle east region where challenges such as the hot climate may affect the overall concrete quality
Keywords –crack healing, maintenance, bio -cementation, carbonate precipitation
1. Introduction
Concrete is a very valuable asset since it is widely used in modern structures. Although concrete is considered a relatively inexpensive material, it is necessary to preserve the concrete structure to last longer Ordinary Portland cement (OPC) is a major source of carbon dioxide emissions worldwide and is considered a serious source of global warming . Moreover, preserving the concrete structures has several social and economic benefits for the community since it will preserve these structures for an extended period and improve these structures’ serviceability
Recently, extensive research has been undertaken to enhance the durability of concrete mixes as well as introduce maintenance methods that improve the concrete service life One of the most contributing factors to the deterioration of concrete elements is cracking. Especially, in a hot climate and arid environments as in the Middle East region where concrete deterioration occurs at a faster rate Temperature increases result in many cracking-related issues such as shrinkage cracking and drying shrinkage cracking [1] If this issue is tackled properly, it will significantly enhance the durability of the concrete structure and increase its service life.
Cracking makes concrete prone to harmful chemical attacks that lead to the corrosion of the reinforcing steel as well a s other chemically induced durability problems. One way of solving the issue is to produce concrete mixes that are not susceptible to cracking using admixture such as micro silica [2]
Another alternative is to seal the cracks after it is already formed and propagated . Several strategies have been already implemented to seal the cracks in concrete, such as using epoxy -based materials, acrylic resins, and silicon-based polymers [3-5] However, these methods tend to be more expen sive and not environmentally friendly.
Therefore, sustainable methods alternative has been proposed recently for the application of concrete healing. Enzyme Induced Carbonate Precipitation (EICP) and Microbial Induced Carbonate Precipitation (MICP) are proposed to heal concrete cracks via the precipitation of carbonate in these cracks
Both methods rely mainly on calcium carbonate precipitation to seal the concrete crack. In general, the process of ureaseaided carbonate mineralization (irrespective of the enzyme source) is derived by the urease catalyzing the hydrolysis of urea This reaction resulted in producing carbon dioxide (CO 2) and ammonia (NH3) transferring into ammonium (NH 4+) in an
aqueous environment and thereby increasing the pH of the solution. The increase in the pH, in the presence of dissolved Ca 2+ , creates favorable conditions for the ions to merge forming calcium carbonate precipitates. The overall process is summarized in Figure 1.

As shown, the overall reaction takes place by the supply of carbonate ions resulting from the hydrolysis of urea and of alkalinity generated by the reaction. When calcium carbonate precipitates within the concrete crack, it works on sealing it and prevents further harmful chemical leakage in these openings. The difference between MICP and EICP lies in the urease enzyme source. MICP process the urea hydrolysis utilizing bacteria ( sporosarcina pasteurii) as a source of urease enzyme [7] On the other hand, EICP contains urease from agricultural sources such as the Jack bean. [8-9]
There are many methods that can be implemented to evaluate the enhancement of mediated healing of concrete. It could be evaluated in terms of crack sealing that is measured through permeability testing such as water absorption and chlorine rapid migration test. Moreover, the concrete healing effectiveness could be measured by evaluating the regained strength by performing unconfined compressive strength or flexural strength testing. This section will discuss each of these aspects from the literature.
A major cause of durability reduction in concrete when it gets cracked is the seepage of harmful liquids in the concrete. When fluids seep inside the concrete it causes corrosion of the reinforcing steel, thereby reducing its strength and its expected age as well. Sealing these cracks is very useful to block this seepage. Abo-El-Enein et al. [10] performed a water absorption test on concrete samples cured at 3, 7, 14, and 28 days. The study compared samples treated at bacterial cell concentrations of optical densities of 0, 0.5 1, and 1.5. The bacteria culture of S. pasteurii was thoroughly mixed with sand and cement according to the corresponding optical density. After 24 hours the samples were demolded and cured in a solution of 20 g/L urea and 25 mM of calcium chloride for the specified interval.
As shown in Figure 2, the higher the optical density of the bacterial cell concentration the more reduction in water absorption is achieved. Reduced water absorption will highly enhance the durability of the treated concrete element. Manzur et al. [11] studied the effect of MICP treatment on concrete water sorptivity using ASTM C1585-13 standard test. A reduction of 37% was observed when comparing biotreated concrete against control samples.
Kulkarni et at. [12] tested the water permeability of biotreated concrete using the constant head method as per IS -2720 (Part 17) 1986. After intentionally generating the artificial cracks using a jaw clamp, the samples were ready for repair using MICP. The concrete cracked samples were soaked in bacterium solution and urea -CaCl2 for treatment. The test results show up to 80% reduction in the water permeability of the cracked concrete after treatment.
MICP and EICP produce calcium carbonate within the concrete cracks. Calcium carbonate is a cementing material that will work on binding cracks again. This binder will help in regaining part of the flexural or compressive strength of the damaged concrete. Abo-El-Enein et al. [10] found that treating the cracks with MICP leads to an increase in compressive strength from 200 to 280 kg/cm2 Moreover, Manzur et al. [11] observed an increase of up to 15% in compressive strength compared to control specimens, when treating the concrete with MICP. Dakhane et al. [13] show that treating pre-cracked concrete beams with EICP method leads to an approximately 33% increase in flexural strength and double the fracture toughness. The method of inducing the crack and healing process for Dakhne et al. [13] is shown in Figure 3. The notch above the crack was filled with EICP solution in order to permeat e inside the generated crack to induce the healing process.


Kulkarni et al. [12] performed a split tensile strength test according to IS 5816 -1999. The test was performed on intact and undamaged samples and it produced a strength of around 3600 kPa. After inducing the cracks on the samples, the untreated samples fail immediately after applying a negligible load. The cracked samples were then healed by soaking into a bacterium solution for 2 hours, and then they have soaked again in a Urea-CaCl2 solution. These MICP-treated samples have shown regain in strength in the range of 29.85 to 380.5 kPa. This is almost 10% of the original strength before cracking.
Self-healing concrete can be a great maintenance tool since the main purpose of utilizing it is to seal the load-induced cracking through the precipitation of calcium carbonate Concrete has a low tensile strength which makes it susceptible to cracking during its service life [14]. Cracking is one of the main factors causing the degradation of concrete durability. Timely repair of concrete cracks may contribute to extending the service life of concrete structures [15]
Cracks in concrete have a minor effect on the structure at the beginning, but they can reduce their lifespan later on [16] Maintenance cost accounts for around 40% of concrete structure maintenance problems as shown in Figure 4 [17]
Several countries are suffering from high concrete maintenance costs. For example, in Denmark m aintenance and repair costs are estimated to be around $147/m3 [17]. Moreover, USA spends around $18 to $21 billion on maintenance, repair, and replacement of deteriorated concrete [18] American Society of Civil Engineers (ASCE) reports that in the upcoming five years, the USA and Asian countries will spend around $2.2 trillion and $2 trillion on the maintenance of structures, respectively [19]

Self-healing concrete technologies have the potential to cut costs at a large scale, especially for applications where leakage is a major issue Since concrete cracks will be healed autonomously before it further propagates, this technology has the potential to reduce shrinkage, thus reducing reinforcement costs [20] The self-healing concrete market size worldwide is expected to reach $1,375,088 in 2025, from $216,720 in 2017 [21]. However, this technology is considered relatively young and it has to tackle a few challenges before it becomes a feasible and reliable tool in engineering applications.
There are many challenges that are facing the large-scale implementation of biocementation techniques for self-healing concrete in general. Concrete is subject to harsh conditions such as high alkalinity, and high temperatures in hot climates
accompanied with limited oxygen supply [22] These conditions will affect the molecular mechanisms involved in the healing process as well as choosing the suitable microorganisms for the intended application.
This section will focus on the effect of high temperatures on the biological treatment of concrete. Middle East region is known for high temperatures and climatic conditions, especially in summer. The effect of high temperature on biotreatment and biological treatment must be well understood before wide applications of this technology regionally.
It was reported that factors such as the bacterial species, initial concentration of the reagents, reaction temperature , and the pH of the environment, highly affect the activity of the urease enzyme, thus it has a high impact on the precipitation process [23] However, the bacteria that produce the urease can endure high temperatures and long periods of inactivation in concrete before the cracks occur. This ability is attributed to the bacteria being able to form spores that help the bacteria survive under harsh conditions [22]
Although Urease was found to be most active at a temperature of 60 °C [24-26], there was no observed precipitation at this degree of treatment [8], [27]. It was even confirmed by some studies that the urease activity has no significant correlation with the engineering properties obtained from MICP treatment [28].
Kim et al. [29] studied two types of bacteria (Staphylococcus saprophyticus and Sporosarcina pasteurii), and the results show both species were sensitive to temperature. Based on testing over a wide temperature range (20- 50 °C), 30 °C was optimum for the maximum precipitation mass of calcite. Also, Ryparová et al. [29] study show that 30 °C is optimal for the bacterial reaction. In contrast, Kong et al. [31] found that higher temperatures of up to 55°C is optimum to maximize MICP treatment efficiency. With that said, more calcite production does not necessarily mean better binding ability [32] Another factor affecting the strength of the cementation is the resulting crystal size which highly depends on the temperature and pH. [33] The threshold of 60°C was confirmed in another study for self-healing mortars. The self-healing enhancement of mortars increased gradually when temperatures increased from 10 °C to 50 °C, but when temperature increased to 60 °C the selfhealing capability decreased significantly [34].
Reinhardt & Jooss [35] tested the water permeability of pre-cracked high-strength concrete after MICP treatment. The treatment efficiency was evaluated at various temperature levels of 20, 50 , and 80 °C. The study concluded that higher temperature leads to a faster rate of concrete healing. However, regardless of the exact level of required temperature for optimum treatment efficiency, maintaining high water content is necessary for the bacterial reaction. It is challenging to maintain a well-hydrated environment at high temperatures in real environment situations [30] The effect of temperature and weather, in general, could be a great potential for future studies on this topic.
Nature has inspired researchers for several engineering application and biological-based methods to be used as construction materials. Self-healing concrete techniques through EICP and MICP has shown potential for concrete maintenance and preservation for longer service life These methods rely on the precipitation of calcium carbonate into concrete cracks. Sealing these cracks can be used in maintenance since it will help block water leakage and harmful chemicals from seeping into the concrete matrix. Thereby, these methods are capable of increasing the durability of concrete and lengthening its life span.
This method has many benefits such as reducing CO2 emissions from concrete production as well as production cost and downtime of structures. However, several challenges are still facing the wide application of these methods in the field . One of these challenges, especially in the middle east region, is the effect of high temperatures on the treatment reaction. Although the bacteria seem to endure harsh environments with their inherited survival mechanisms, further study is required to fully understand their behavior in real environment applications.
References
[1] M Al-Samarai, “Durability of Concrete in the Arabian Gulf,” J. Mater. Sci. Eng. A , vol. 5, no. 12, 2015.
[2] A. A. Bubshait, B. M. Tahir, and M. O. Jannadi, “Use of microsilica in concrete construction,” Build. Res. Inf., vol. 24, no. 1, pp. 41
49, Jan. 1996.
[3] M. Araújo et al., “Cross-linkable polyethers as healing/sealing agents for self -healing of cementitious materials,” Mater. Des., vol. 98, Mar. 2016.
[4] J. Feiteira, E. Gruyaert, and N. Belie, “Self -healing of moving cracks in concrete by means of e ncapsulated polymer precursors,” Constr. Build. Mater., vol. 102, pp. 671
678, Jan. 2016.
[5] H. X. D. Lee, H. S. Wong, and N. Buenfeld, “Self -sealing of cracks in concrete using superabsorbent polymers,” Cem. Concr. Res., vol. 79, pp. 194 –208, Jan. 2016.
[6] M. G. Arab, “Soil Stabilization using Calcium Carbonate Precipitation via Urea Hydrolysis,” in In Proceedings of the 4th World Congress on Civil, Structural, and Environmental Engineering (CSEE’19 ), Apr. 2016.
[7] V. S. Whiffin, “Microbial CaCO3 precipitation for the production of biocement.” Murdoch University, 2004.
[8] M. Nemati and G. Voordouw, “Modification of porous media permeability, using calcium carbonate produced enzymatically in situ,” Enzyme Microb. Technol. , vol. 33, no. 5, pp. 635–642, 2003.
[9] J. Larsen, M. Poulsen, T. Lundgaard, and M. Agerbaek, “Plugging of Fractures in Chalk Reservoirs by EnzymeInduced Calcium Carbonate Precipitation,” SPE Prod. Oper., vol. 23, no. 04, pp. 478 –483, 2008.
[10] S. A. Abo-El-Enein, A. H. Ali, F. N. Talkhan, and H. A. Abdel-Gawwad, “Application of microbial biocementation to improve the physico-mechanical properties of cement mortar,” HBRC J., vol. 9, no. 1, pp. 36–40, 2013.
[11] T. Manzur, F. Rahman, S. Afroz, R. S. Huq, and I. H. Efaz, “Potential of a microbiologically induced calcite precipitation process for durability enhancement of masonry aggregate concrete,” J. Mater. Civ. Eng. , vol. 29, no. 5, pp. 1–12, 2017.
[12] R. V. Kulkarni, V. Sreedhar, S. Mutalik, C. M. Setty, and B. Sa, “Interpenetra ting network hydrogel membranes of sodium alginate and poly(vinyl alcohol) for controlled release of prazosin hydrochloride through skin,” Int. J. Biol. Macromol., vol. 47, no. 4, pp. 520 –527, 2010.
[13] A. Dakhane et al., “Crack healing in cementitious mo rtars using enzyme-induced carbonate precipitation: Quantification based on fracture response,” J. Mater. Civ. Eng. , vol. 30, no. 4, pp. 1 –10, 2018.
[14] S. S. Bang, J. J. Lippert, U. Yerra, S. Mulukutla, and V. Ramakrishnan, “Microbial calcite, a bio -based smart nanomaterial in concrete remediation,” Int. J. Smart Nano Mater., vol. 1, no. 1, pp. 28 –39, 2010.
[15] J. Wang, H. Soens, W. Verstraete, and N. Belie, “Self -healing concrete by use of microencapsulated bacteria spores,” Cem. Concr. Res., vol. 56, pp. 139 –152, Feb. 2014.
[16] H. Mihashi and T. Nishiwaki, “Development of engineered self -healing and self-repairing concrete-state-of-the-art report,” J. Adv. Concr. Technol. , vol. 10, no. 5, pp. 170 –184, 2012.
[17] A. Danish, M. A. Mosaberpanah, and M. U. Salim, “Past and present techniques of self -healing in cementitious materials: A critical review on efficiency of implemented treatments,” J. Mater. Res. Technol. , vol. 9, no. 3, pp. 6883–6899, 2020.
[18] Z. Li, C. Leung, and Y. Xi, Structural renovation in concrete . CRC Press, 2009.
[19] B. Mather and J. Warner, “Why do concrete repairs fail,” Interview held Univ. Wisconsin, Dept. Engrg. Prof. Dev. MD, WI,< http//aec. engr. wisc. edu/resources/rsrc07. html>. Accesse d, 2003.
[20] Basilisk, Case Study: Reduction steel reinforcement , vol. BR1401. 2020.
[21] V. Banik, “Self-healing Concrete Market by Type (Intrinsic Healing, Capsule based Healing, Vascular Healing) by End User (Residential & Commercial, Industrial, and C ivil Infrastructure): Global Opportunity Analysis and Industry Forecast, 2018 - 2025,” 2019.
[22] Y. S. Lee and W. Park, “Current challenges and future directions for bacterial self -healing concrete,” Appl. Microbiol. Biotechnol., vol. 102, no. 7, pp. 3059 –3070, 2018.
[23] G. D. O. Okwadha and J. Li, “Optimum conditions for microbial carbonate precipitation,” Chemosphere, vol. 81, no. 9, pp. 1143
1148, 2010.
[24] W.-S. Ng, M.-L. Lee, and S.-L. Hii, “An overview of the factors affecting microbial -induced calcite precipitation and its potential application in soil improvement,” World Acad. Sci. Eng. Technol , vol. 62, no. 2, pp. 723 –729, 2012.
[25] K. L. Sahrawat, “Effects of temperature and moisture on urease activity in semi -arid tropical soils,” Plant Soil, vol. 78, no. 3, pp. 401–408, 1984.
[26] L. Cheng, M. A. Shahin, and J. Chu, “Soil bio -cementation using a new one-phase low-pH} injection method,” Acta Geotech., vol. 14, no. 3, pp. 615 –626, Oct. 2018.
[27] V. Rebata-Landa, “Microbial activity in sediments: effects on soil behavior (PhD Dissertation),” Georgia Institute of Technology, 2007.
[28] A. Mahawish, A. Bouazza, and W. P. Gates, “Factors affecting the bio -cementing process of coarse sand,” Proc. Inst. Civ. Eng. Improv., vol. 172, no. 1, pp. 25–36, 2019.
[29] G. Kim, J. Kim, and H. Youn, “Effect of Temperature, pH, and Reaction Duration on Microbially Induced Calcite
Precipitation,” Appl. Sci., vol. 8, no. 8, p. 1277, 2018.
[30] P. Ryparová, P. Tesárek, H. Schreiberová, and Z. Prošek, “The effect of temperature on bacterial self-healing processes in building materials,” IOP Conf. Ser. Mater. Sci. Eng. , vol. 726, no. 1, pp. 1–6, 2020.
[31] K. Henry, Ting, Pek, K. Khairul, Anuar, U. Murtala, Z. Muttaqa, Uba, M. Abubakar, Sadiq, and A. Kamarudin, “Microbially induced carbonate precipitations to improve residual soil at various temperatures,” Bull. Geol. Soc. Malaysia, vol. 67, no. June, pp. 75–81, 2019.
[32] L. Cheng, M. A. Shahin, R. Cord -Ruwisch, M. Addis, T. Hartanto, and C. Elms, “Soil stabilisation by microbialinduced calcite precipitation (micp): investigation into some physical and environmental aspects,” in 7th International Congress on Environmental Geotechnics: iceg2014 , 2014, p. 1105.
[33] T. Jones and R. L. Detwiler, “Fracture -aperture alteration induced by calcite precipitation,” in 49th US Rock Mechanics/Geomechanics Symposium , 2015.
[34] W. Du et al., “Effect of temperatures on self -healing capabilities of concrete with different shell composition microcapsules containing toluene-di-isocyanate,” Constr. Build. Mater., vol. 247, p. 118575, 2020.
[35] H. W. Reinhardt and M. Jooss, “Permeability and self -healing of cracked concrete as a function of temperature and crack width,” Cem. Concr. Res., vol. 33, no. 7, pp. 981
985, 2003.
Abstract
This paper focuses on the relationships between the maintenance of existing assets, and opportunities given by rapidly advancing digitalization.
Performance diagnostics throu ghout the life cycle is of high relevance for controlling the operation and maintenance of power and process plants. Monitoring systems based on gas path analysis can make a considerable contribution to the enhanced availability of turbomachinery. In order to carry out performance diagnostics, an accurate thermodynamic model has to be specified. Building a precise model for different types of turbomachines requires an exact layout of the turbine.
The exploitation of the potential given by predictive algor ithms, new (Internet of Things) IoT devices, higher measurement capacities, digital twin, and big data techniques are valid options to improve the performance and reduce costs and risks simultaneously of any existing asset under periodic maintenance schedu le and actions by minimizing CAPEX investment to expand and adapt the infrastructure and maintaining limited OPEX operating costs.
An innovative, suitable solution is technically introduced and financially evaluated.
Keywords: Asset management, maintenance, power generation, gas path analysis, smart grid integration, Internet of Things (IoT), real-time controls, Big Data analytics.
Performance Monitoring & Diagnostics Analytics not only mirrors the operating environment digitally but provides the basis for better decision-making at every level of plant and fleet operation. In order to carry out performance diagnostics, an accurate t hermodynamic model has to be specified. Building a precise model for different types of turbomachines requires an exact layout of the turbine. In particular, for each engine type layout data and engine design parameters have to be specified.
The present study describes the individual phases for conducting performance diagnostics using the gas path analysis method for a specific gas turbine. It shows how design data are modeled, component characteristics of compressor and turbine specified and instrumentation data assessed. Furthermore, the study demonstrates how additional reengineering is carried out in order to achieve an adequate thermodynamic model of the gas turbine. The implications of the results for applying this performance diagnostics technique to turbomachines are discussed.
In the past, as the operation and maintenance regime was dictated by the manufacturers the only approach was to reduce the cost of replacement parts. However, as recent fuel prices and the pressure to improve return on i nvestment for the new owners increase, management has to look at more innovative ways to reduce costs. They are more willing to explore newer technologies in replacement parts which often offer longer component life and therefore achieve not just cost reduction but also more revenue generation by reducing plant shutdown periods and/or increasing the time between overhauls. However, particularly for managers who are unused to such ventures, these projects can be fraught with risks. Under these conditions, operators of turbomachinery power plants need to constantly assess the health state of the turbine components. Based on measurement data they can take appropriate actions to reduce maintenance costs and increase the reliability of the turbomachinery componen ts.
Machines are the primary assets of production in a power plant. Condition monitoring and fault diagnosis can provide sufficient advanced warning of impending faults so maintenance can be cost -effectively planned ahead of time. For each type of machine, advanced analysis methods can be used to reliably detect and diagnose the relevant faults as early as possible.
This paper presents an approach based on gas path analysis for the diagnosis of the performance of single-shaft gas turbines. Data from an ac tual case study is used for illustration. The presented results are a 70MW gas turbine, single shaft, and with a constant speed 50Hz generator. Based on several hundred data sets of monitored quantities the gas turbine model is established and the health indices for the different components are derived.
“Real-time access to data and intelligence is driven by the continuous and cyclical flow of information and actions between the physical and digital worlds.” (6)
“Digital twin refers to the mapping of the physical asset models in a digital platform, where a virtual digital replica model is created.” (7)
A lot of computational physics-based and analytics-based models are housed in the virtual model to analyze and forecast the health and performance of operating assets over their lifetime. This allows the operator to understand the operations of the asset and prevent unexpected failures.

Through this paper, we introduce “Delphys” digital twin product as a performance monitoring & diagnostics analytics system for rotating equipment. The state -of-the-art tool provides so-called health indices for improving operation and switching from preventive to conditioned -based maintenance.
The proposed digital twin solution “Delphys” links the monitoring and diagnostic center(s) infrastructure to remotely evaluate the plant’s key performance indicators (KPI) through a daily operation.

Delphys enhances big data analytics and large-scale network infrastructure that will provide value for power plant insurers and power plant owners from many perspectives such as fewer unplanned outages, more refined maintenance strate gies, and better-managed asset life.
The following figure shows the overall architecture of the proposed technology.
The overall architecture of applied digital twin for critical infrastructures.
Core technologies of Delphys are Gas Path Analysis, Neural Network, and Data Validation. Gas Path Analysis (GPA) is a mature technology for aero engines and is now made ready to use for heavy-duty gas turbines. GPA is a mathematical
sensitivity analysis of the component maps that works based on a physical model of the gas turbine engine and actual measured values. The physical model of the gas turbine is equipped wit h component maps and is able to represent the engine at any operating point and under any ambient conditions of interest.
A major advantage of GPA is the calculation of deteriorated maps. This allows describing the actual performance of the analyzed gas turbine. Key figures for describing maps will quantify degradation such as compressor fouling, turbine erosion, etc.
The idea that performing preventive maintenance 1 on a pure, fixed time-based schedule is increasingly losing support amongst the utility maintenance managers, as the appliance of the so -called reactive maintenance2 approach bears high risks and eventually prohibitive costs due to the unavailability of the power supply.
The introduction and the adoption of a predictive maintenance 3 attitude have become interesting in recent years and will increasingly be taken into consideration as a new approach in the next future. Although the predictive approach has a great potential for optimizing the expenditures and the availability of the power plant, the current application is in many cases difficult: the lack of specific diagnostic software and specific operational data to be used for evaluation of abnormal conditions, the delay in the adoption of the concept by manufacturers and the resulting adaptation of the warranty conditions act as a brake.
As a precise evaluation, i.e. on factual data, of the actual condition , is not always possible, the specific technical knowhow and the experience of specialized service providers, having access to the largest amount of specific data become indispensable when trying to undertake the transition toward predictive maintenance strategy.
The security architecture is designed to address cyber security regulations, ensuring data availability, validity, and integrity based on a distributed approach that attempts to bring the most effective detection mechanisms and tools together with correlation and anomaly detection analysis techniques, in order to create a solution that starts with the state of the art in Critical Infrastructure security as its baseline and dealing with unknown threats, by incorporation of machine learning anomaly detection features.
To reduce the operational costs of an electrical power plant it is of important to know the actual and future conditions of the components, especially for rotating equipment like gas and/or steam turbines. While conventional monitoring systems allow for assessing the actual state of operation only, model -based approaches like gas path analysis (GPA) can be used for a detailed diagnostic of the plant as a whole or for individual components like compressors and turbines. As operating conditions vary over time, the model -based GPA technique enables comparison and analysis. GPA is used to distinguish the so-called health conditions of the main components from the overall performance of the entire gas turbine
GPA (model-based) in combination with knowledge -based diagnostics tools (e.g. filter condition) is applied for thermodynamic monitoring of the working fluid leading parts. In order to apply these models properly, data validation of the measured signals is of vital importance.
1 The preventive approach assumes that the components deteriorate in line with the expected degradation rate and undergo mainte nance at different levels after a given elapsed time or hours of operation. It may result in either unnecessary repairs, or catast rophic breakdowns.
2 The components are only fixed when they break down: the safety margin between planned and highly probable wear -out failure is disregarded and higher risks are accepted. This approach implies the management of more or less extensive sp are parts inventories, the availability of fast -reacting skilled labours, as well as the acceptance of long -lasting plant outages, loss of production and possibly higher costs for expedited shipments.
3 Several different indicators and parameters are dire ctly measured, monitored and evaluated to assess through factual data the actual operating conditions of the components and to offer diagnosis of issues of different nature. This approach aims at determining the actu al time-to-failure by judging the mechanical and functional conditions of the critical equipment: the safety margin is evaluated and the maintenance activities can b e optimized on an as-needed basis.
For modeling the specific gas turbine, operation characteristics of the components, i.e. filter, compressor , and turbine, are represented in the monitoring system. Data validation based on filter analysis and gas path analysis allows refinement of the modeling of the plant. In the following, the procedure for data validation is described and the required data input from filter analysis and gas path analysis is stated. With the methods of filter analysis, gas path analysis , and data validation, a monitoring system is a set-up that allows performing necessary reengineering of the plant in order to gain diagnostics data that are relevant for optimizing operation and maintenance.
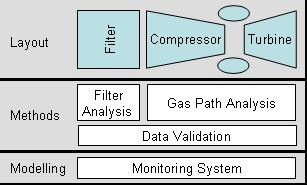
Measuring and data collection require that all relevant measurements and indicators which describe the conditions are identified. The necessary sensors have to be available or installed. In regular intervals, data is measured. Some preliminary validation of the sensors (e.g. Fast-Fourier-Transformation) may be performed. Finally, the data is transferred to a central server, where it is stored for later use. To facilitate fault detection, data is pre -processed: Outliers are removed and data is normalized to cancel the effects of environmental and contextual attributes. Limits or thermodynamic rules may be used to validate sensor values. If data from a particular sensor is inconsistent with the rest of the system, it points to a possible sensor failure. As a c onsequence, data from that specific sensor are ignored and replaced by a set of model-generated values. New parameters are created based on the composition of existing values. The most relevant sub-set of parameters is then selected and trended over time. For fault detection, the current values and trends of the parameter subset are then compared against standards (e.g. ISO 10816 (2)), thresholds, and/or modelpredicted values.
Filter houses are typically equipped with pressure drop sensors. As these values are not only dependent on the degree of fouling, but also on mass flow changes, engine load has to be considered. This can be achieved by combining the filter pressure drop, power output, and inlet guide vane position into a single filter characteristic. As a result, a filtered index is derived that has a value range of 0 to 100%, i.e., 100% indicating that the filter is running at the ideal point, and lower numbers indicating that the filter has deteriorated.
During the operation of a gas turbine (GT), measurement data are taken with appropriate sensors. Data are typically filtered and averaged. The GPA method is based on a mathematical sensitivity analysis of the component characteristics.
The results of GPA are the so-called „Health Indices “(HI). In the case of a single shaft GT with the appropriate measuring system four indices can be calculated (cf. Table 1):
Table 1: Description of Health Indices
Health Index Description
Compressor Flow Capacity Change of non-dimensional mass flow through the compressor
Compressor Efficiency Change of the compressor efficiency
Turbine Flow Capacity Change of non-dimensional mass flow through the turbine
Turbine Efficiency Change of the turbine efficiency.
The ratio of the various Health Indices over time can accurately locate a faulty component such as a compressor or turbine. With the derived ratios, GPA is able to diagnose physical faults such as fouling, erosion , etc.
A gas turbine is modeled with an analytical performance model, which is based upon component characteristics a nd aero-thermal relationships, such as the laws of conservation of energy and mass. The calculation then proceeds to “match” all of the components by satisfying the aero -thermo relationships. Assuming that the component characteristics are accurately defined, the model can assess the engine performance in terms of measurable parameters such as pressure, temperature, etc., and in terms of non-measurable parameters such as efficiency, flow capacity, etc. The nonmeasurable parameters describe the characteristics of the components such as the compressor, turbine, etc.
If component characteristics are not available, reenginee ring is necessary. This can be done for a sufficient range of operations according to data from the GT acceptance test and/or the collection of stationary measurement data with calibrated sensors at different engine loads (e.g. 80%, 90%, and 100%).
For a single-shaft gas turbine, the creation of component characteristics can be done as follows:
1) By using data from measurements (power output, compressor outlet temperature and pressure, turbine outlet temperature).
2) By using calculated data (that correspond to measurements) from performance calculation with assumed component characteristics.
3) By viewing differences of calculated and measured data over inlet guide vane, over ambient pressure and over ambient temperature.
4) With engineering know-how, by adjusting the component characteristics according to the shown differences.
The base of GPA is the thermodynamic model of the gas turbine. For the particular engine in the case study (70MW single shaft gas turbine with electrical generator) the following measured data are available:
1) Ambient conditions (pressure, temperature , and relative humidity)
2) Pressure loss over the inlet filter
3) Position of variable inlet guide vane
4) Pressure loss of the combustion chamber
5) Fuel volume flow
6) Active generator power
7) Pressure after the compressor
8) Temperature after the compressor
9) Exhaust temperature
10) Lower heating value (monthly averaged).
A typical set of data from a large single-shaft gas turbine is averaged every 30 minutes. Since these data are used for generating the gas turbine performance model, sensor validation analyses have been performed in advance of setting up the model, i.e. measurement results of redundant sensors are compared, and sensor results are analyzed for their plausible range and correct sampling.
Usually, for gas turbines of this size, the measurement equipment is suitable for the data to be taken from the standard engine acquisition system and applied as in put data for gas path analysis calculations. However, in our case study, although this particular engine was well equipped, an inappropriate storage frequency had been chosen, resulting in a considerable amount of useful data being discarded. This was reme died at the next overhaul of the gas turbine (cf. Fig. 2 and Fig. 3).
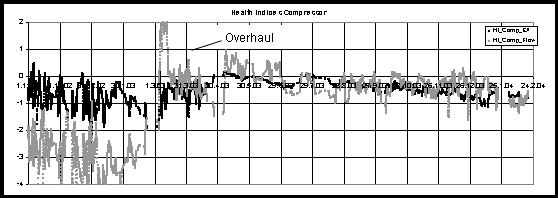
The operating point of a gas turbine power plant is seldom at design values. A common varying parameter is a load that can fluctuate. Also, some parameters respond relatively faster than others to a single event, for instance , pressure will rapidly adjust to the new state whereas temperatures take more time to settle. For performance modeling, averaged measurements (over a perio d of 30 minutes) were investigated from the standpoint of steadiness, i.e. only values were used where the measurements within the averaging process do not differ from each other by an assumed range of 0.2%.
The inlet temperature of the compressor is taken from three measurement signals. Figure 4 shows the temperature measured in front of the gas turbine compressor over the ambient temperature. For this particular application, at temperatures below 10° Celsius, operating points, w here the air preheater is switched on to prevent icing, can be identified. Since this behavior affects the model of the GPA, health indices were not calculated while the air preheater was switched on (cf. Fig. 4).

Differences between the three measured temperatures at the inlet of the gas turbine compressor are shown over ambient temperature (cf. Fig. 5). At ambient temperatures higher than 10° Celsius, measurement errors of the sensor are discernible. These errors can be minimized by calibrating and averaging the sensor signals. Data at ambient temperatures below 10° Celsius are ignored. It can be assumed, that the inlet air is not uniformly heated by the air preheater.


Unreliable relative humidity measurement can influence the health indices of the GPA as follows: an assumed error of relative humidity of 20% can change the health indices at an ambient temperature of 25° Celsius by 0.5% and at an ambient temperature of 15° Celsius by 0.2%.
The position of variable inlet guide vanes is a major contributing factor to engine mass flow and engine power. Accurate measurement is essential for modeling and diagnostics. Accuracy is attained by calibration and averaging with multiple sensors.
Although a fuel flow measurement in combination with the lower heating value was a promising basis for thermodynamic engine diagnostics, the averaging process of the heating value introduced a great degree of uncertainty into the GPA process (cf. Fig. 6). Since the monthly averaged values vary by about 1% and the daily values are unknown, heating value and fuel flow are not used in the modeling of the gas turbine with GPA. An engine regulation function giving a calculated turbine inlet temperature is used instead.
Variable guide vanes of compressor and turbine inlet temperature are the key to setting the operating point in the performance calculation. In many cases, the turbine inlet temperature is not measured. To overcome this problem, assumed turbine efficiency in combination with other measured parameters is used to deduce a function for the turbine inlet temperature over the engine load.

Conditions of the air intake filters are derived from the filter index (as described above). Figure 7 s hows how the system performance is affected by the status of the filters, e.g. as they deteriorate over time and when they are replaced. Independent from the load, the status of the filter can be shown. In the investigated case, heavy contamination of the filter was observed within a short period due to natural and anthropogenic environmental impact.

Modeling a gas turbine engine means setting up correct component maps. During the process of setting up th is model, the accuracy is tested over the operating range of interest. A useful method is to compare the relative deviation of measured and calculated values, i.e. power, compressor inlet pressure, compressor inlet temperature , and turbine outlet temperature (cf. Fig. 8). This method is aimed at keeping deviations constant and load -independent. Offsets can easily be corrected in the following gas path analysis.
Component characteristics for the performance calculation are adjusted with results from measure d values.
With the engine model set up the methodology of gas path analysis was applied for new sets of measurements
The resulting GPA health indices (cf. Fig. 9) show, that the compressor and turbine experience no physical fault (such as fouling or erosion). For a short period of time, a faulty sensor caused the health indices to overshoot values up to 4%. A normal running condition can be described by health indices in the range of 1% taking into consideration that the input values are filtered and averaged with respect to outliers, steadiness, and engine operation range.

Figure 10 describes the GPA health indices before and after an overhaul and the corresponding power output, measured and normalized to design ambient conditions. In addition, a root means square (RMS) value is calculated with the health indices in order to estimate the magnitude of the physical fault. Before the overhaul, the compressor indicated fouling, i.e. ratio of mass flow change to efficiency change = 4:1 (3). After the overhaul, clean performance was found to be recovered. Despite periodic and intensive washing cycles of the compressor, the compressor experiences slight fouling

over time, which can be accounted for to the non-recoverable performance losses. Like the filter indicator, the GPA health indices are independent of gas turbine load.
Gas path analysis and filter analysis of gas turbine components need an appropriate set of instrumentation. The ideal set of instrumentation depends on the type of gas turbine and the type of physical faults of interest.
Diagnostics of trended data requir e reliability in terms of data repeatability. However, instruments are susceptible to calibration errors, recovery losses, electromagnetic radiation interference , and drift caused by changes in ambient conditions. It is important at this point to different iate between repeatability and accuracy. Since gas path analysis is a differential method, changes in the health indices are important, not their absolute values. Inappropriate or badly maintained instrumentation can lead to the detection of spurious fault s, leading to unnecessary and costly maintenance actions.

The measurements depend on the accuracy and reliability of the chosen instruments and their position. Whereas accuracy errors are virtually eliminated in the process of measuring the change in per formance, reliable measurements are dependent on the random error that derives from repeated measurements (precision error).
Generally, the component characteristics of the gas turbines that are used for the gas path analysis performance modeling are hardly known from power plant design. Component characteristics can vary due to measurement errors, and differences of calculated and/or measured data. Monitoring deviations of measured data and calculated values of component characteristics is an essential element of model reengineering in order to increase the accuracy of health indices. This requires small adaptation to known component characteristics to fit the current measurements.
Over the years high costs of ownership in turbomachiner y have resulted in considerable interest in advanced maintenance strategies. One way to tackle this high cost is to employ thermodynamic diagnostics tools such as gas path analysis, filter analysis, and knowledge-based tools for monitoring continuously the state of the engine components. This enables the operator to proactively plan and manage maintenance activities.
The proposed method is complex and needs to be applied with considerable care. This is especially true for the choice of measurements and the awareness of measurement non -repeatability.
Model-based engine monitoring and diagnostics tools require the specific characteristics of the components to be considered individually. Sensor equipment and data processing have to be studied carefully and s ystematic errors have to be eliminated. In addition, the steadiness of operation and influence of intake preheaters, evaporation -coolers or online washing have to be considered either in the engine models or by appropriate selection of the evaluated sets o f measurement. Such data validation is based on the combination and evaluation of different performance diagnostics over time. The resulting pattern of diagnostics is represented in the monitoring system.
[1] MSc ETH Daniel Pfammatter, MSc ETH Tiziano Canali, MSc Shima Fahima “Grid stabilization solutions – grow existing grids under increasingly complex conditions” Easy Energy Companies & Consulting SA / IMA Forum , (2019).
[2] D. Pfammatter, T. Canali, “Gas turbines plants maintenance – A focus on auxiliaries facing cost reduction measures”, Easy Energy Companies & Consulting SA / IMA Forum , (2016).
[3] P. Escher, “Gas Turbine Data Validation Using Gas Path Analysis”, Proceedings of ASME TURBO EXPO 2002, Amsterdam, GT-2002-30024.
[4] ISO 10816, ‘Mechanical Vibration - Evaluation of Machine Vibration by Measurements on Non -Rotating Parts”, 1995.
[5] H. I. H. Saravanamuttoo , “A Preliminary Assessment of Compressor Fouling”, ASME Paper 85 -GT-153, [6] Deloitte insights “The Industry 4.0 paradox_ Overcom ing disconnects on the path to digital transformation”, [7] Deloitte insights “Tech Trends 2020”.
Languages:
The journal publishes research in English.
Referring:
All articles submitted for publications are subjected to peer referring. Final acceptance is subject to authors making all appropriate modifications suggested by the referees. Sole responsibility for contents, however, rests with the authors, not the editors nor the journal.
Manuscripts should not have been published before
Submitted manuscripts should not be considered for publication elsewhere
Accepted Manuscripts may not be published elsewhere without written permission from the Editor – in – Chief
Authors must agree to transfer copyright to the publication. If the Journal wishes to reprint the article, prior permission must be obtained from the authors
Permission to use previously published materials must be obtained by the authors
Authors must disclose sources of funding
A soft copy of the offprints will be sent to the author
Manuscripts received by the Journal cannot be returned whether published or not
1. Manuscripts must have the following sections: a one – page abstract in Arabic and English (about 150 words each); keywords; an introduction; a main body divided into the appropriate sections and sub-sections ; a conclusion, brief biographies of authors and a list of reference.
2. Author’s full names and current affiliation must be given immediately below the title of the article.
3. Manuscripts should be typed, double spaced in Simplified Arabic, 14 points font for the main text, and 12 point font for the end note. Only one side of the sheet should be used, and all copies must be meticulously proofread.
4. Figures, graphs, and illustrations should be included in the text and should be in black and white. They should also be consecutively numbered and given title beneath them.

5. Tables should be included within the text and consecutively numbered and given title beneath them.
6. Margins should be 2.5 cm in width on all sides of the page.
7. Footnotes should appear at the bottom of the page of the article followed by a list of references given in alphabetical order according authors family name.
Authors are required to submit the following:
1. Three copies of the manuscript prepared according to the Manuscripts preparation guideline.
2. An electronic copy of the Manuscript on Microsoft Word for Windows.
3. The Authors’ CV, including his/her full name in Arabic and English, current address, rank, and the most important publications.
4. A submittal cover letter