

Q2 2025 at a Glance
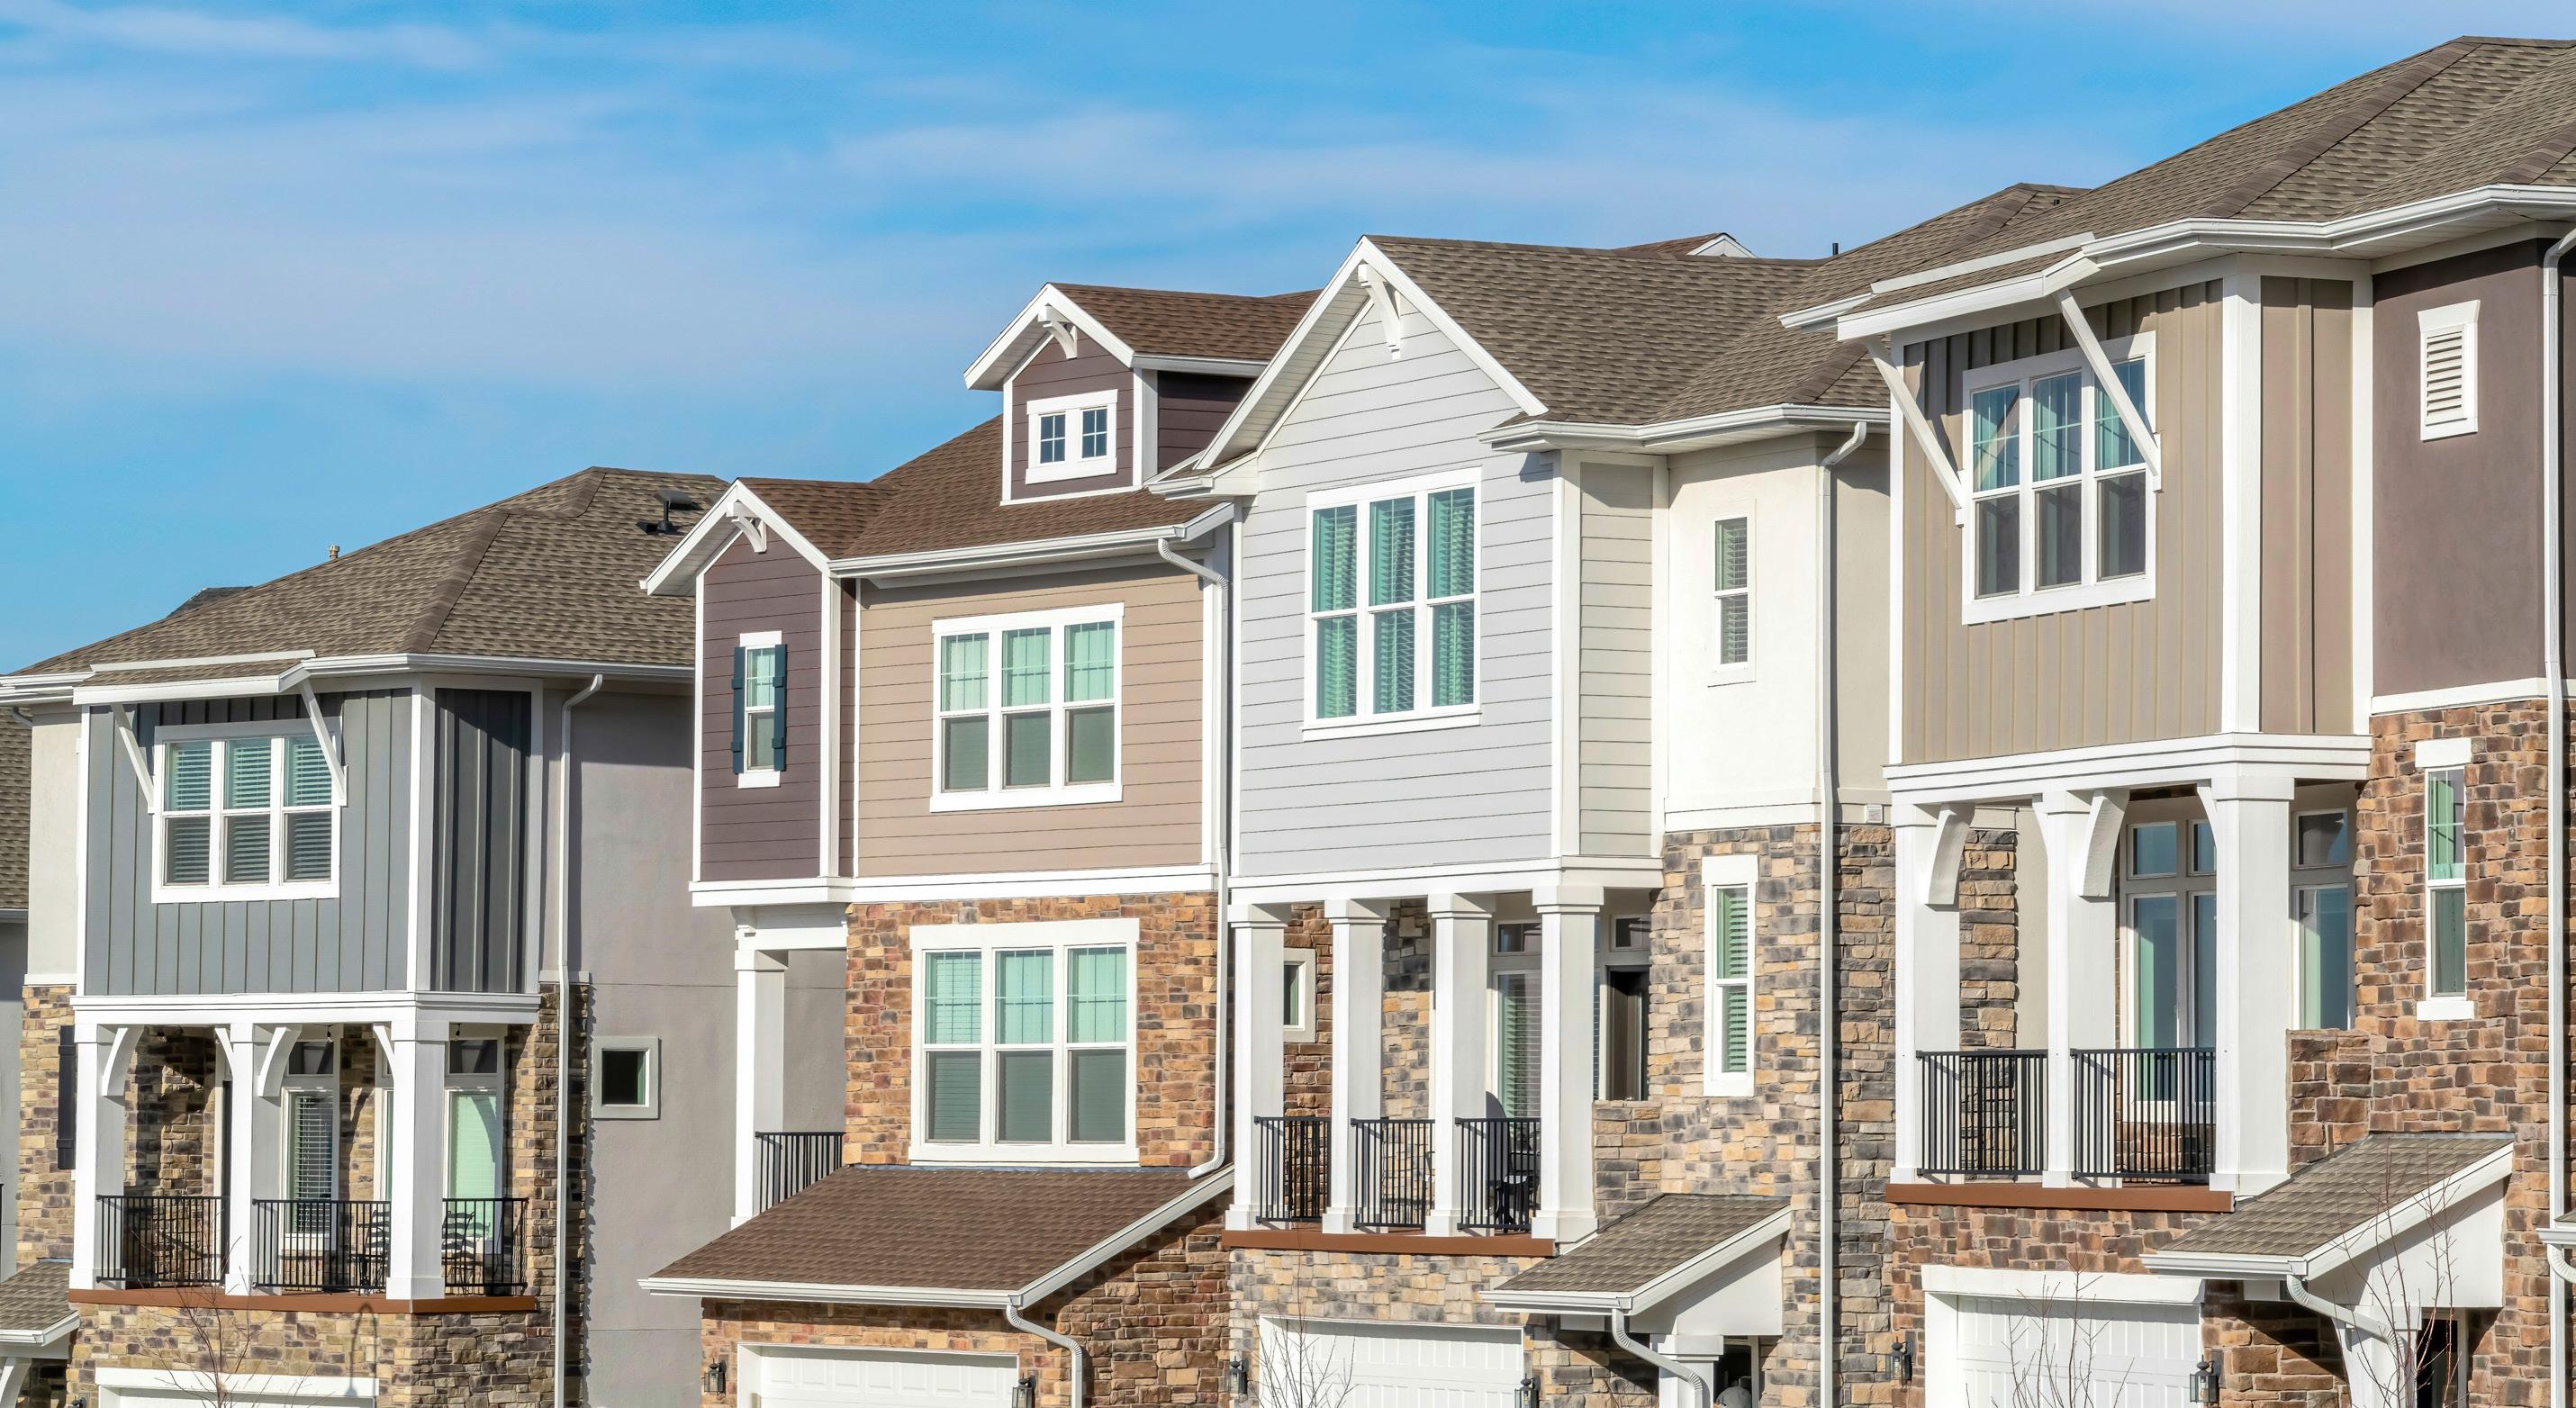
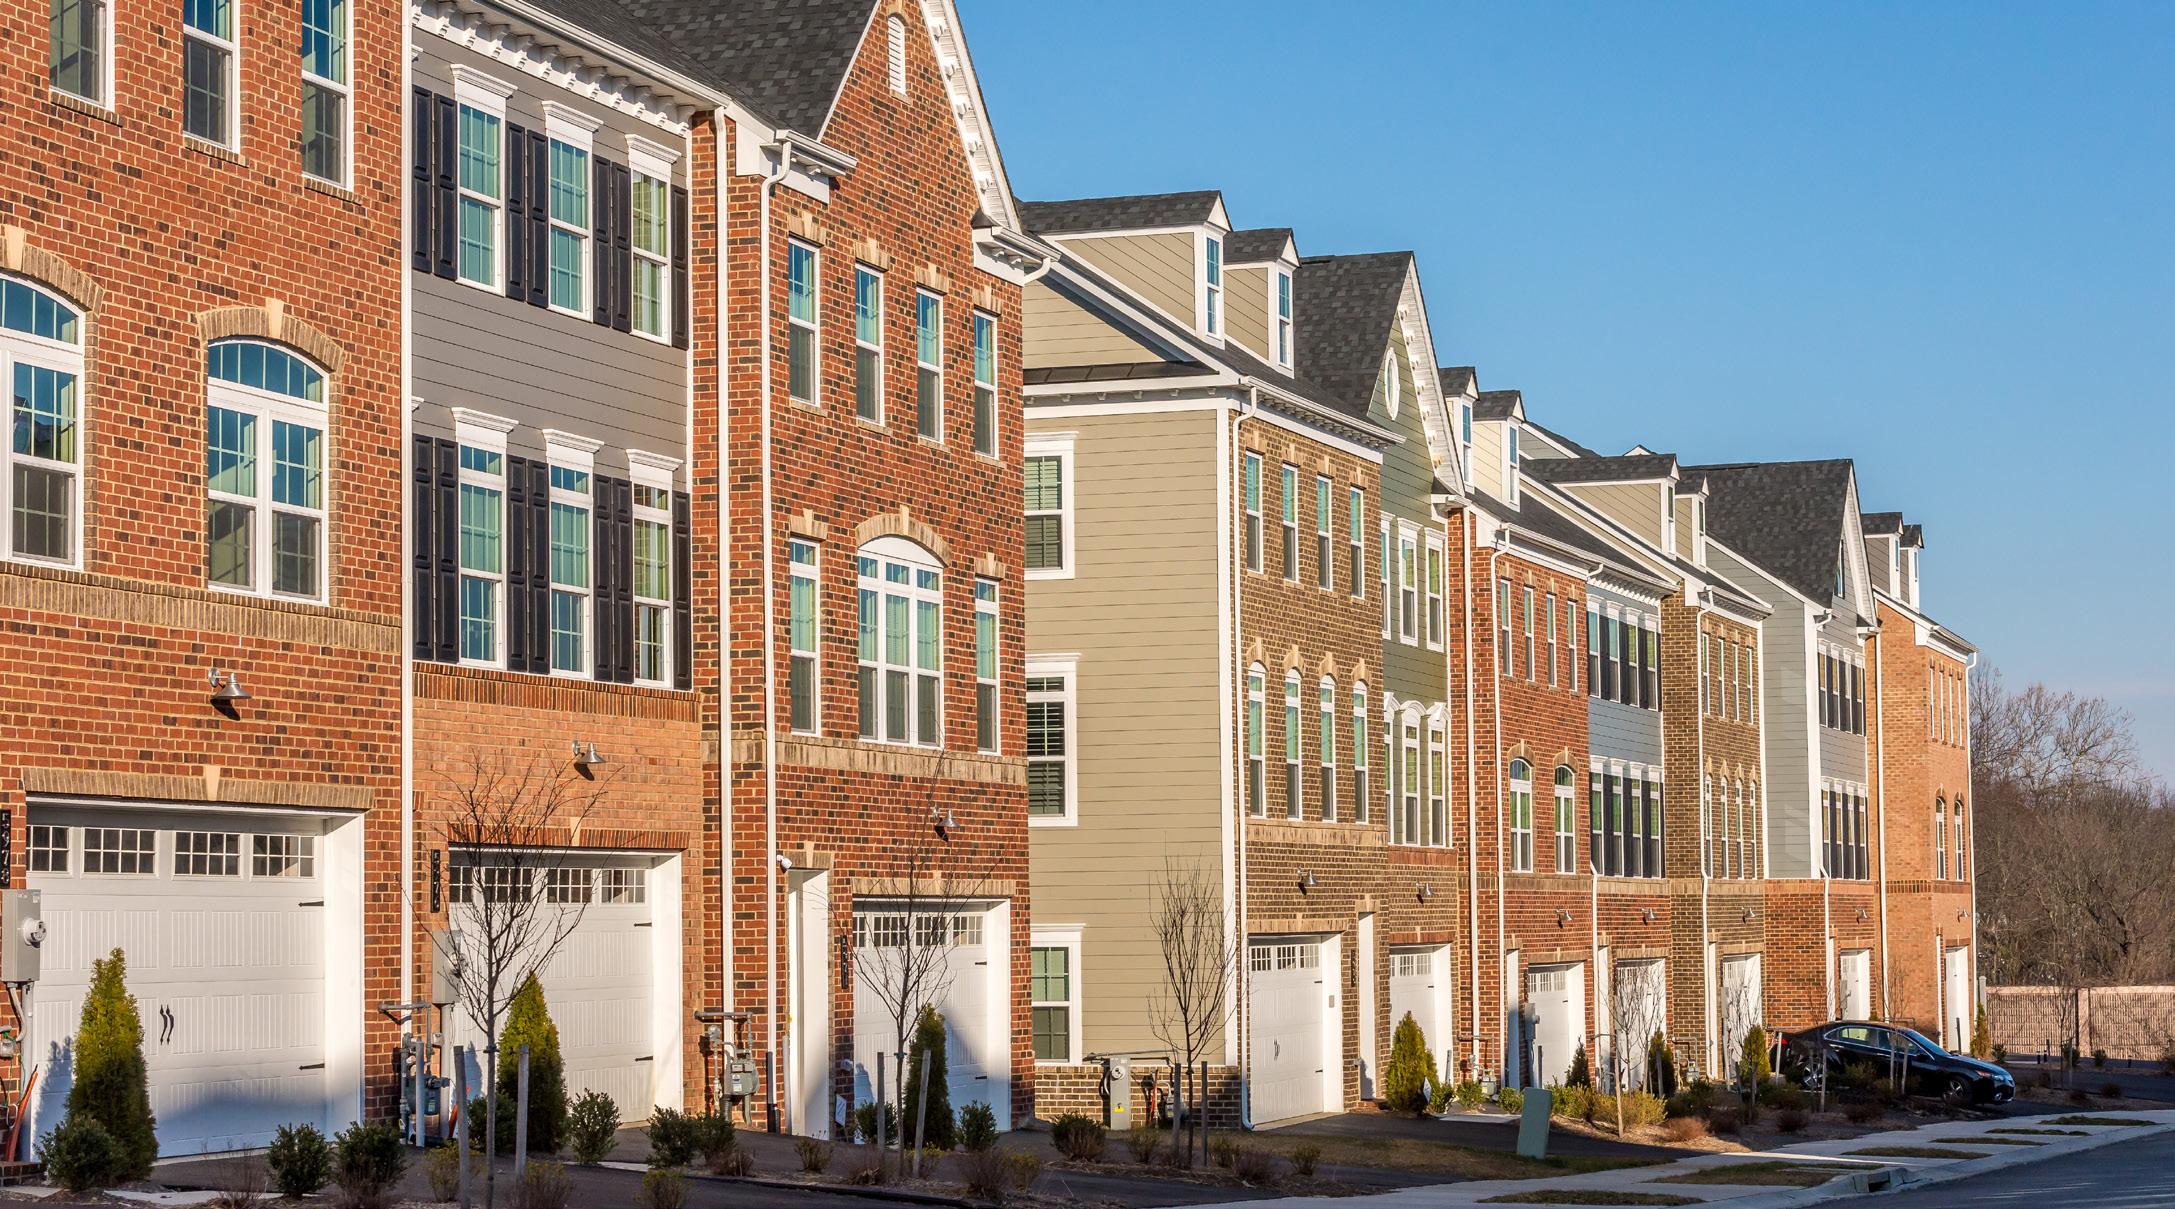
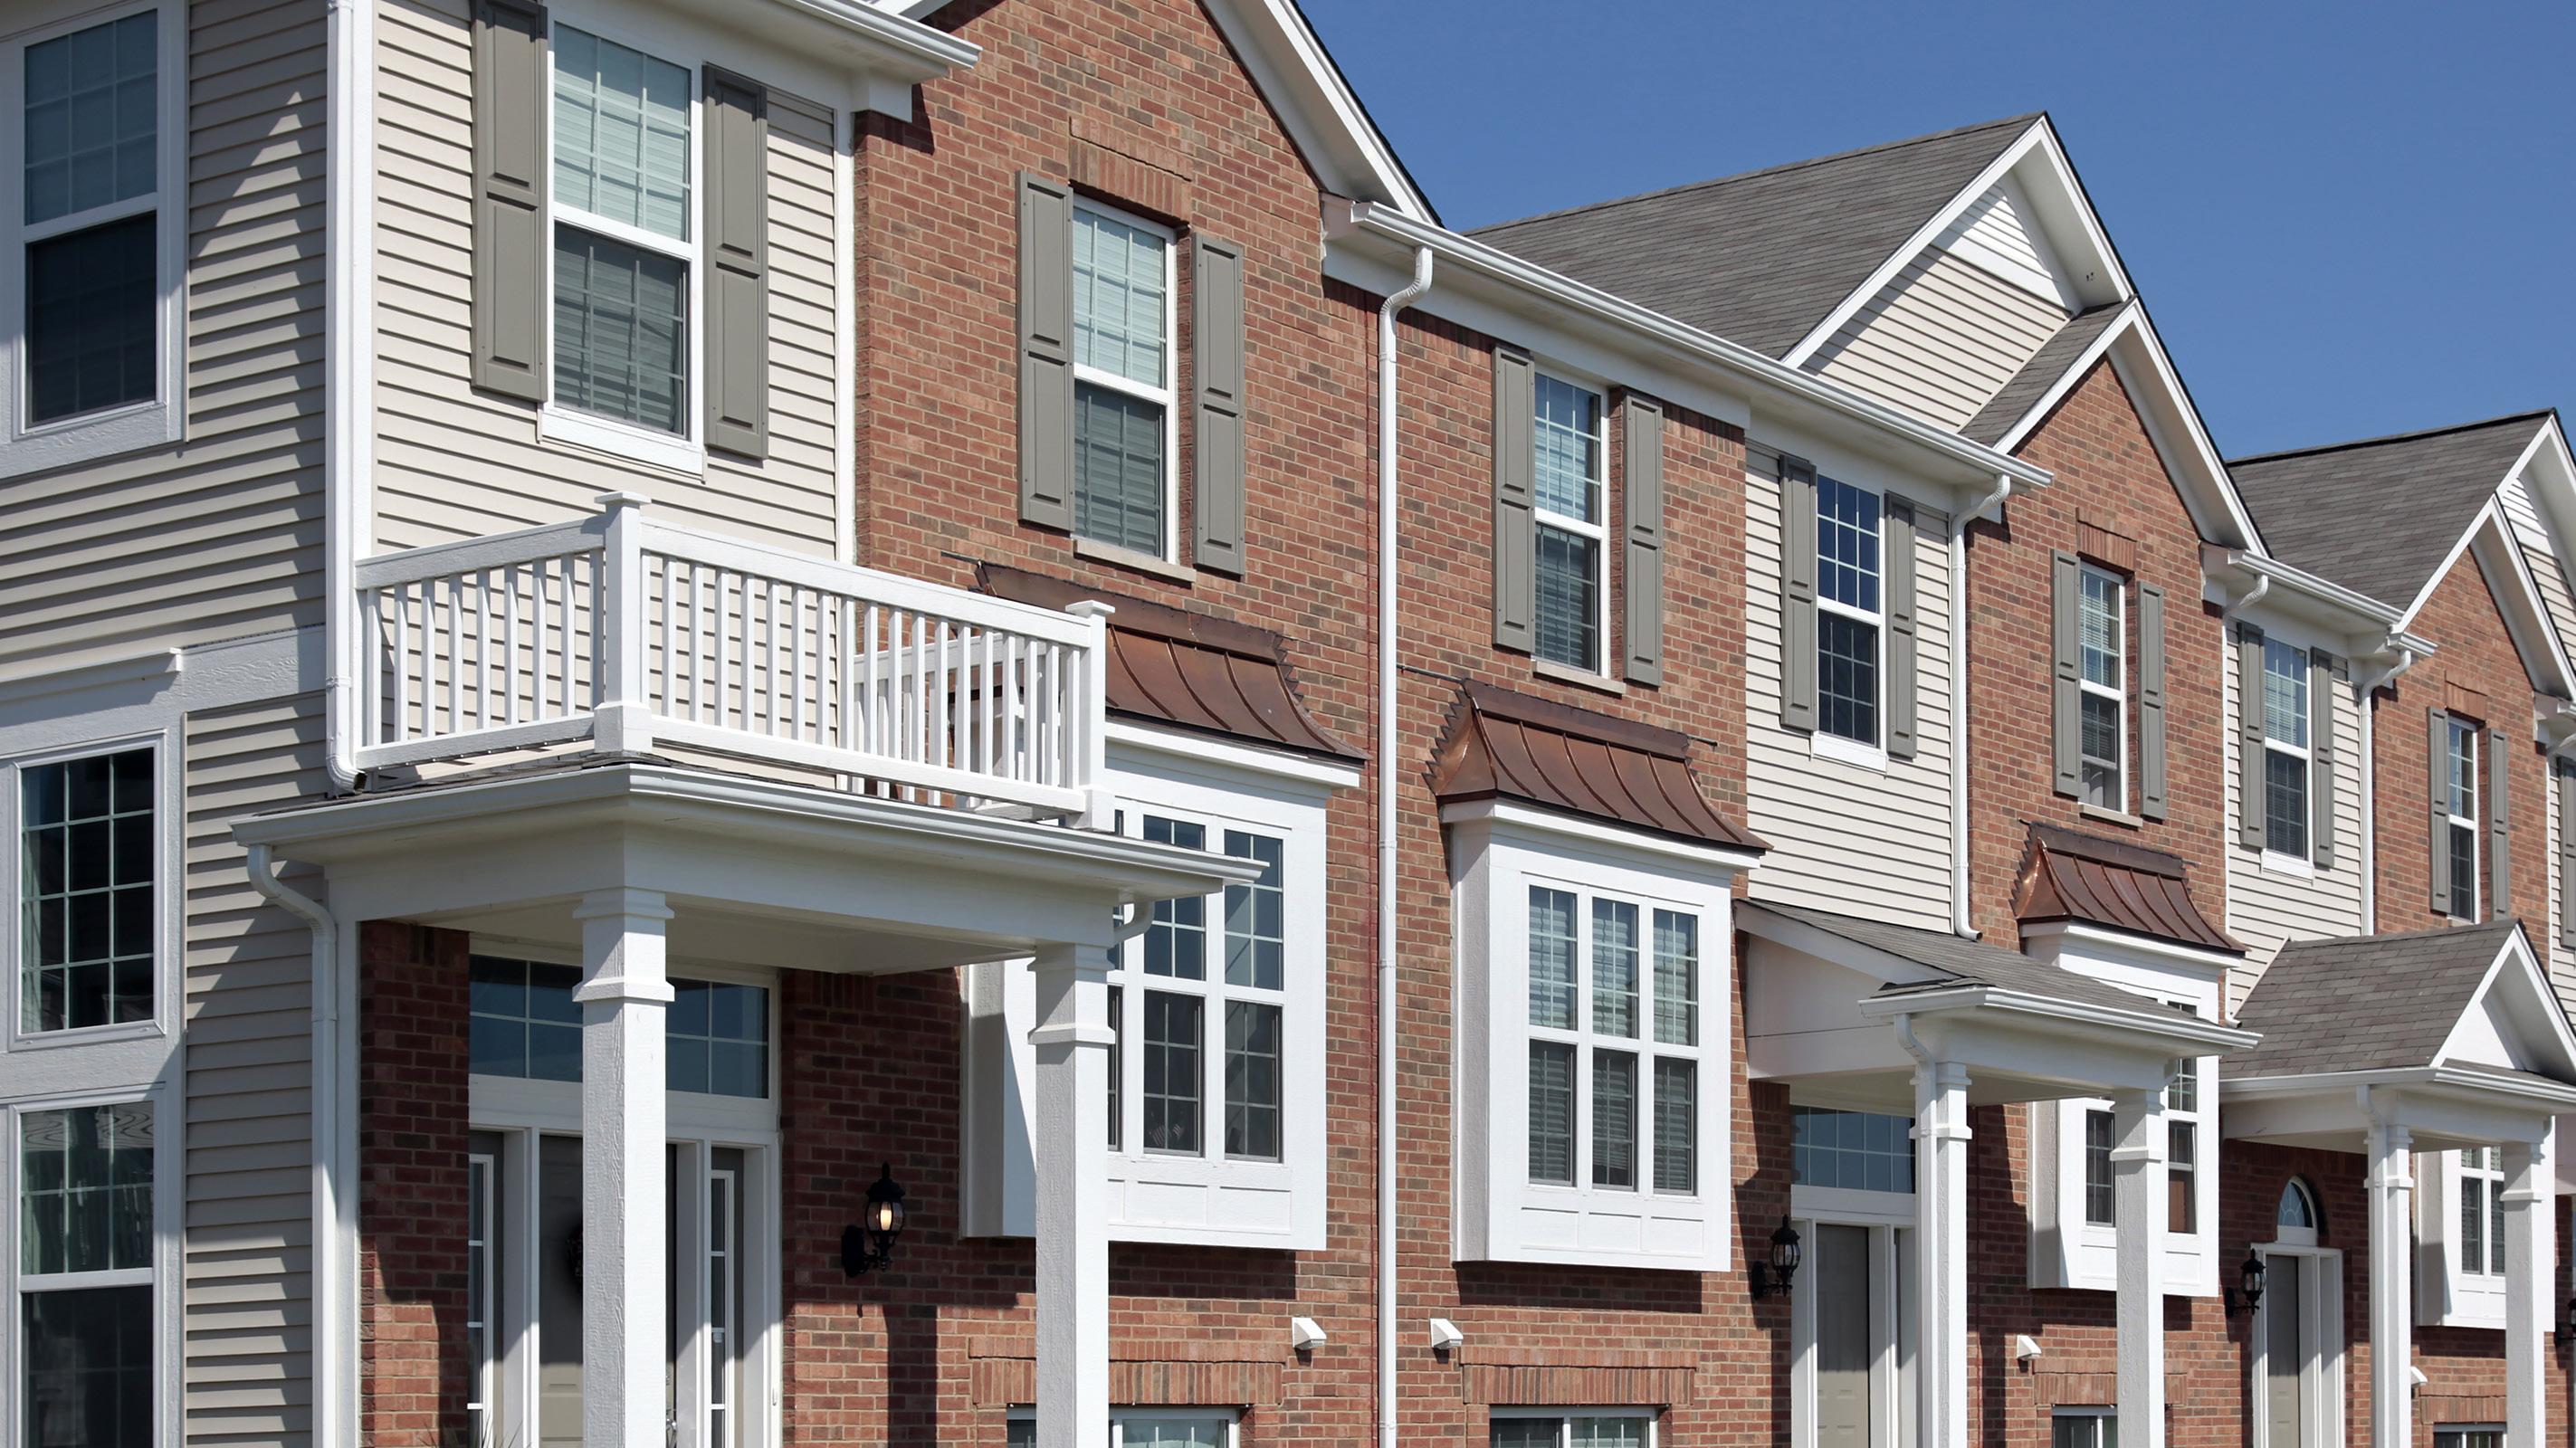
Across The Greater Atlanta Area

Source:
15,559 Homes Sold
$552,270 Average Sale Price
38 Average Days on Market 4.4 Months of Inventory

Across The Greater Atlanta Area
Source:
15,559 Homes Sold
$552,270 Average Sale Price
38 Average Days on Market 4.4 Months of Inventory
We entered Q2 2025 (2Q 25) expecting seasonal spring market dynamics and, experienced a spring market that was almost identical to Q2 2024 (2Q 24). While 2Q 25 delivered a 41.6% quarter-over-quarter improvement in Closed Sales (15,559) over Q1 2025 (1Q 25), the year-over-year comparison (YoY) shows continued market compression with 14,886 Pending Sales in 2Q 25 vs 15,556 in 2Q 24 and 15,547 Closed Sales in 2Q 25 vs 15,772 in 2Q 24.
2Q 25 over 1Q 25 data shows seasonal improvement within a compressed market environment. Closed Sales increased 41.6% (15,559 vs 10,988), while Pending Sales improved 15.6% (14,907 vs 12,899). However, Active Listings increased 22.8% (19,600 vs 15,963), indicating the accumulation of inventory is outpacing demand. New Listings increased 19.1% (28,125 vs 23,608), while Days on Market remained elevated at 49 days. Despite quarterly improvement, the underlying market stress persists as inventory builds faster than the absorption rate, creating extended marketing periods and increased competition among sellers for a limited buyer pool.
A look into the number of Expired, Withdrawn, and Closed listings shows us closed transaction volume declined 65.6% YoY, while inventory accumulation occurred with a 41.0% increase in active listings. The Days on Market (DOM) extended by 25.6% and listing failure rates increased 40% in expired and withdrawn properties. Expired listings for townhomes and condominiums increased by 120% and Withdrawn listings increased by 80%, further demonstrating the low absorption and downward pressure on pricing, primarily for the condominium product type. The Months of Supply (MOS) continues to increase from 3.1 to 4.5 months YoY leading us closer to a Buyers market. While the Metro-Atlanta average remains stable, there are a number of submarkets (submarkets can be defined by the limits of a city, zip code, neighborhood or community) that have increased beyond 6-8 MOS which tips them into a Buyers market.
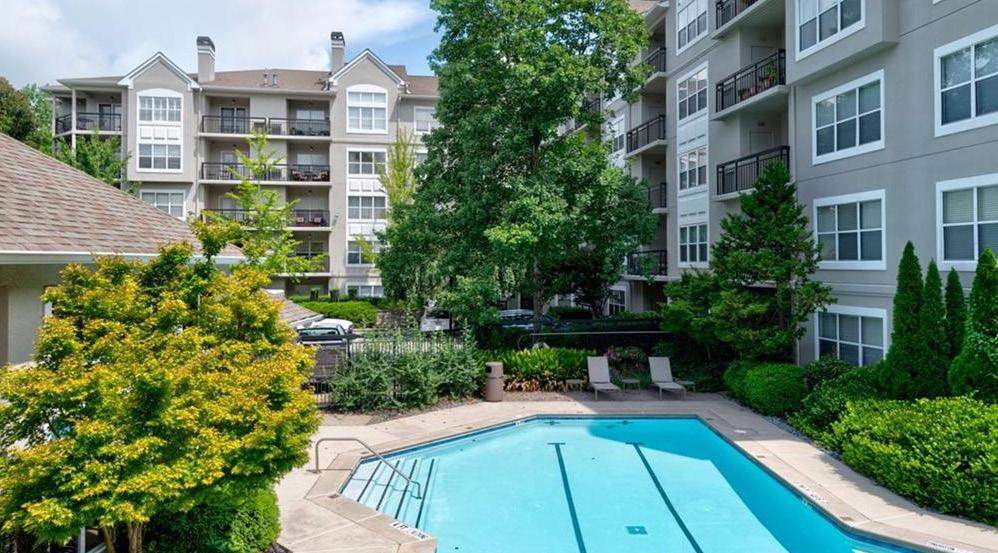
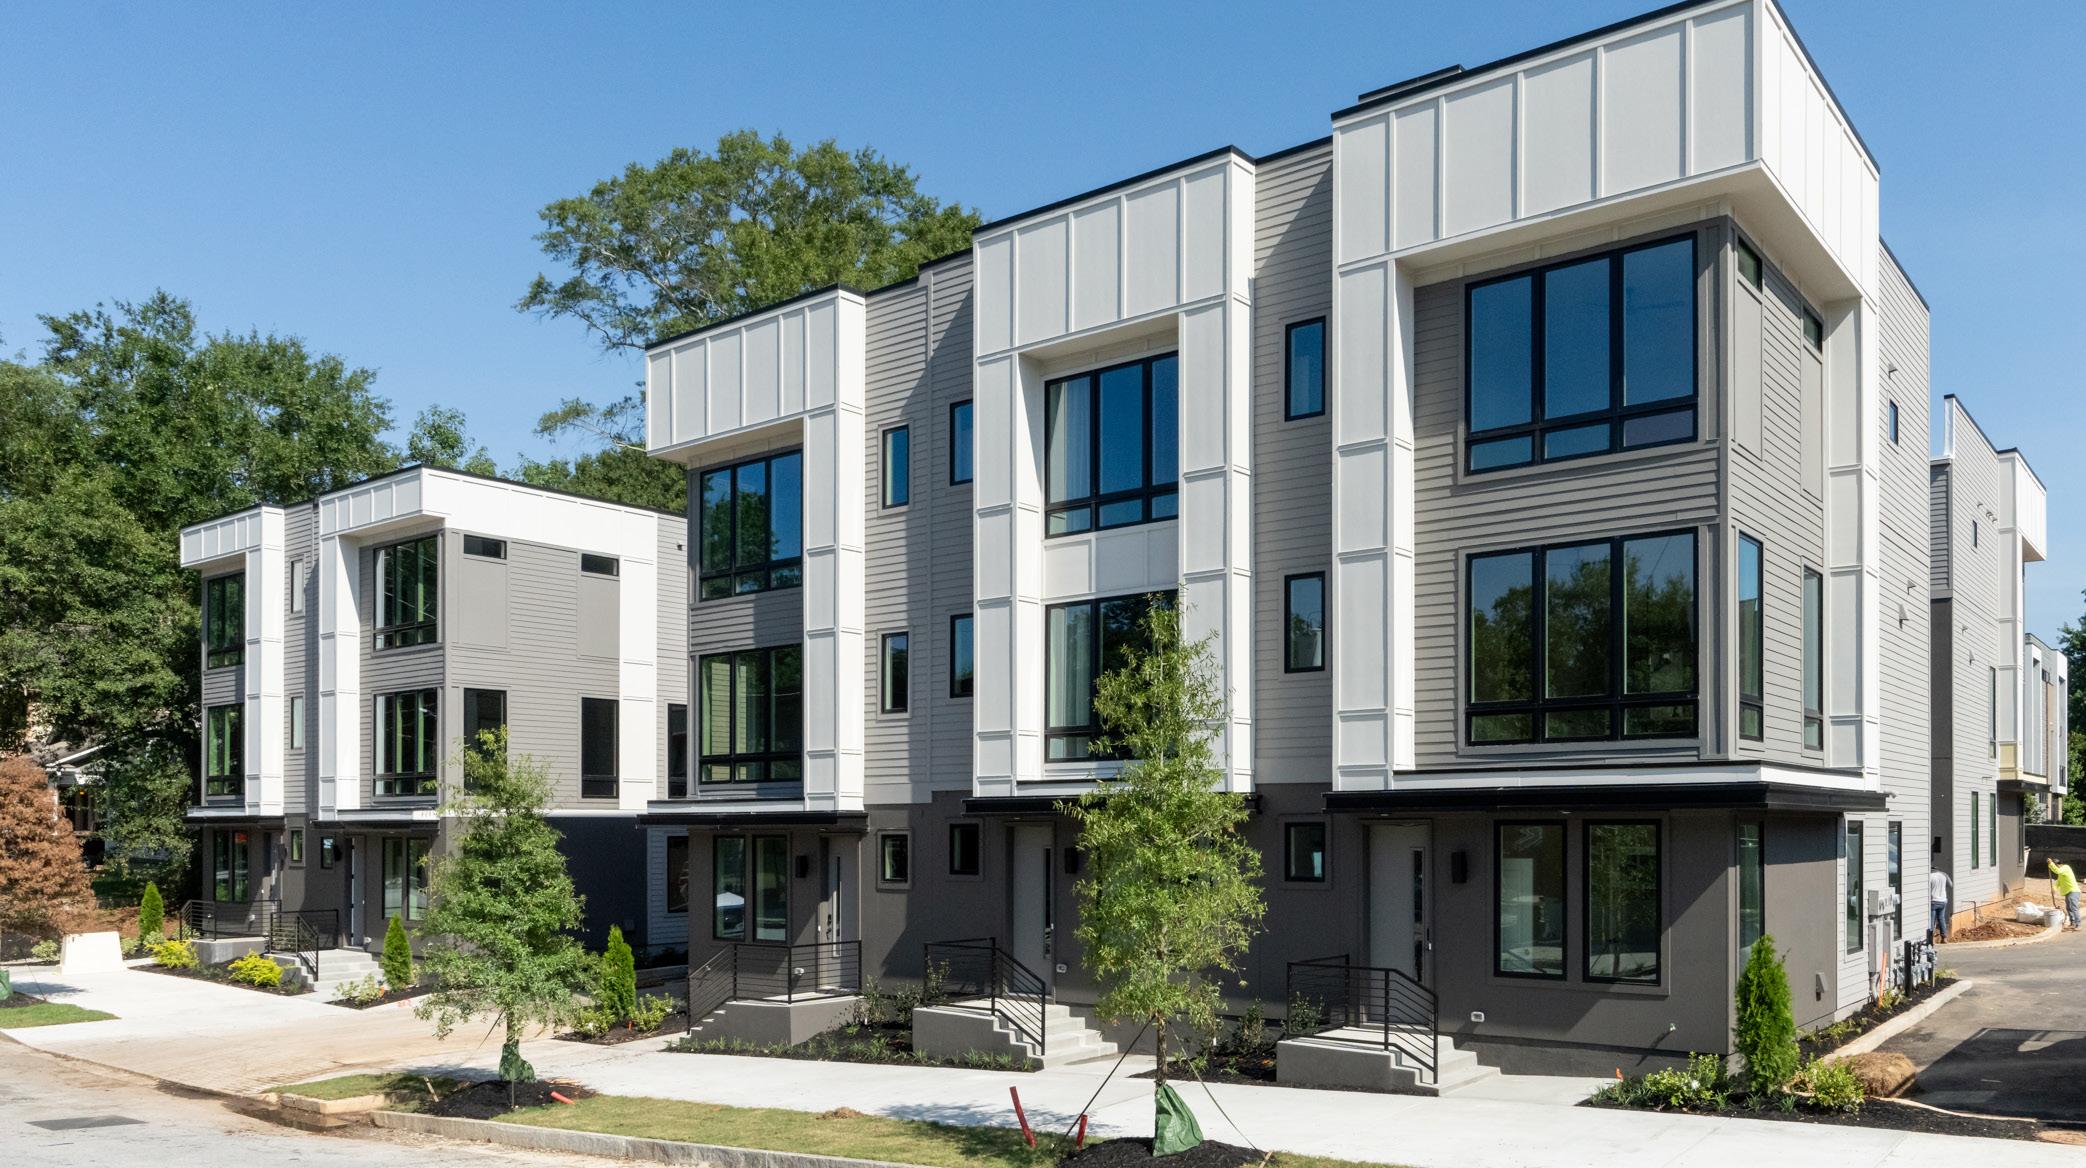
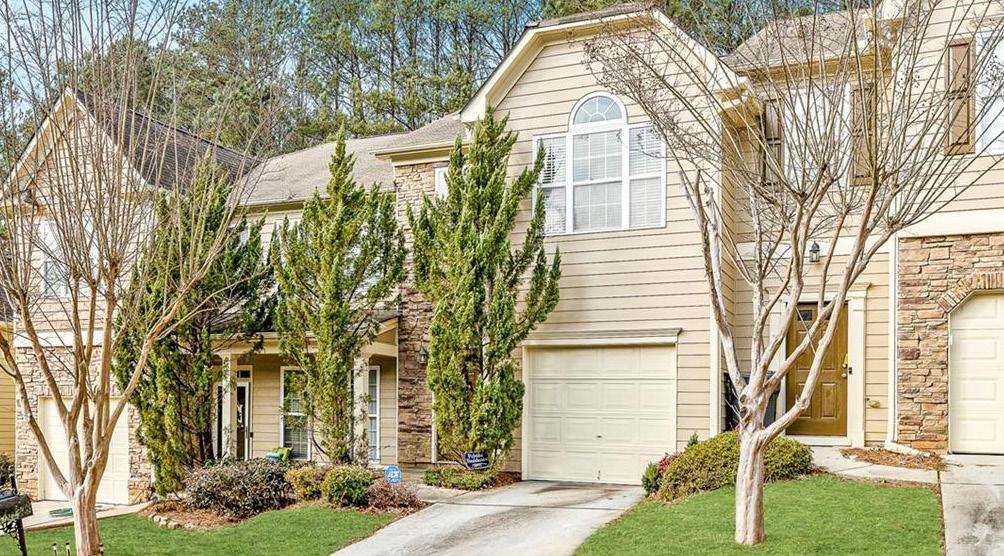
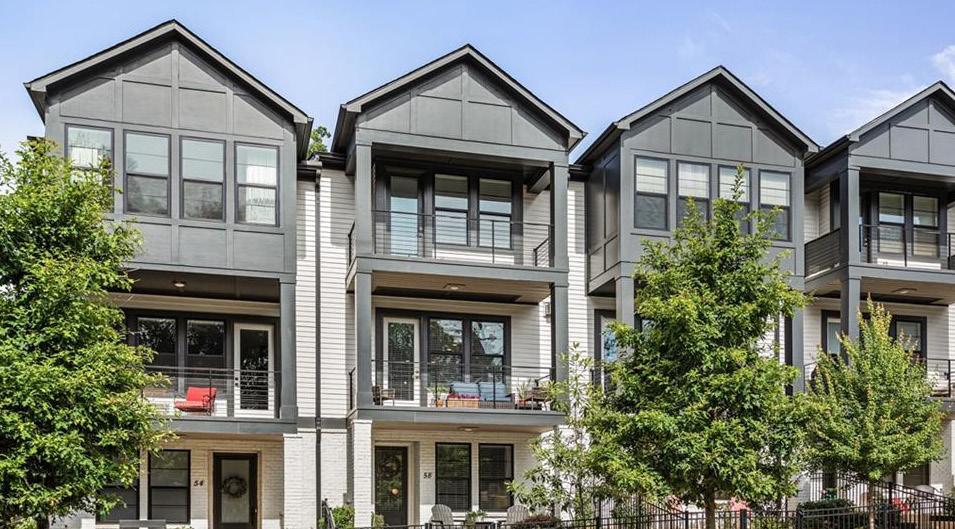
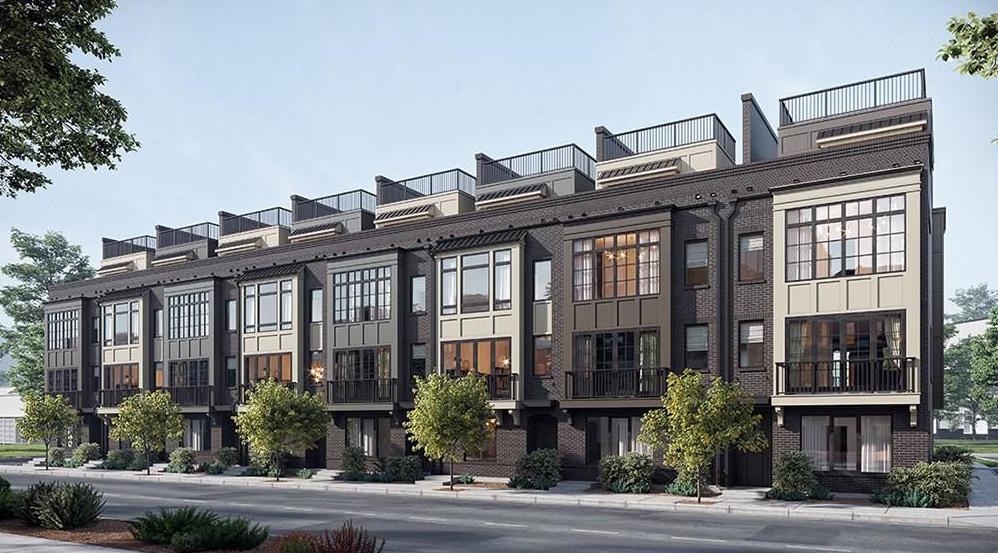
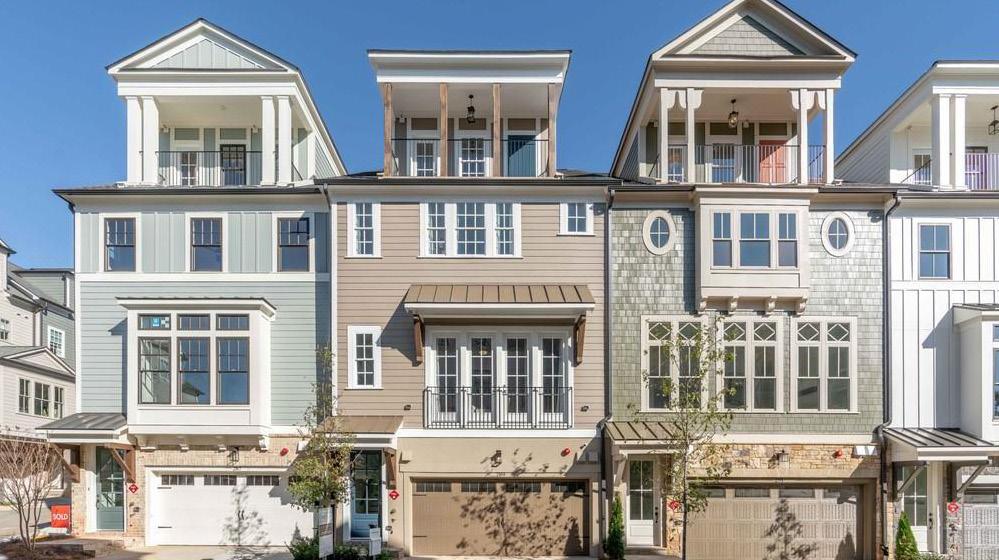
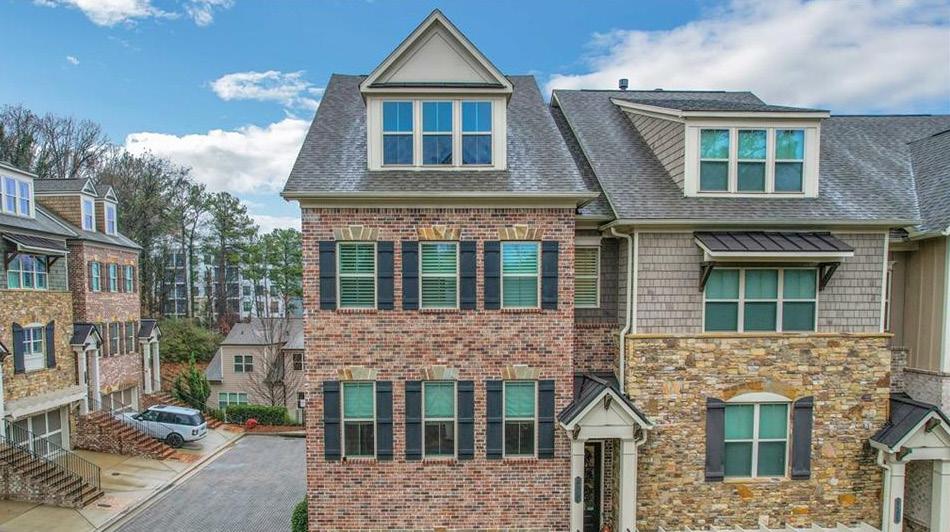
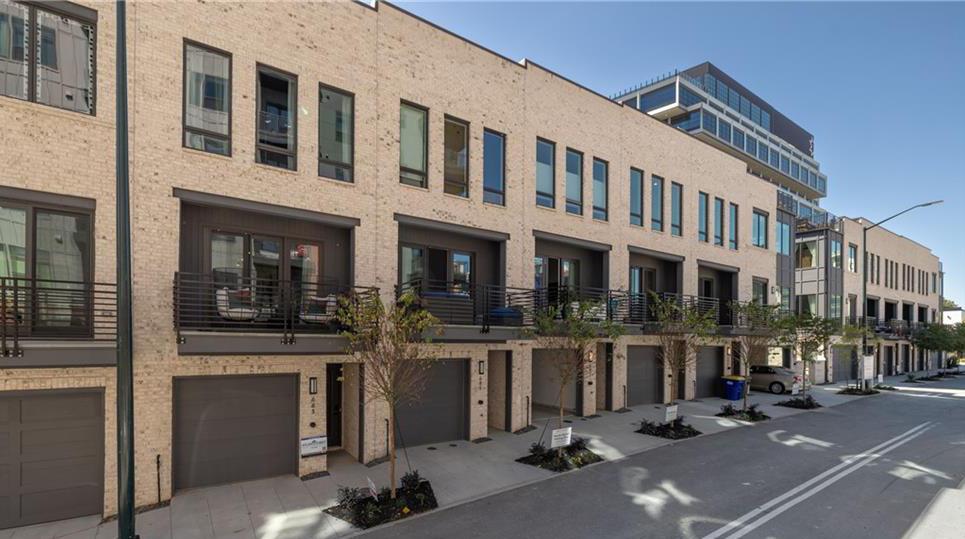
Single-Family Homes continue to lead the market with 79.2% of the transactions (12,326 sales), showing +45.0% quarter-overquarter recovery but absorbing most of the market pressure due to the volume leadership position. Townhomes represented 14.4% (2,238 sales) with 31.7% quarterly improvement, showing relative stability in the middle-market price segment. Condominiums at 6.4% (995 sales) exhibit notable stress indicators. An analysis of 17 tracked submarkets revealed price inversions in 8 submarkets where median sales prices exceeded average sales prices. These inversions indicate that lower-priced or motivated sales are pulling down averages below the median price, signaling pricing pressure within the urban core markets.
The majority of market activity was concentrated in lower price segments, with 60% of all transactions remaining sub-$500K (average price $338,215). Condominiums showed 84% of sales were under $500K (average price $281,576). This reflects constrained buyer capacity and limited buyer engagement in higher price ranges, particularly in condominiums.
As we have shared in previous reports, Metro-Atlanta cannot be analyzed as a single market. The 8 condominium submarkets showing median-to-average price inversions warrant attention as indicators point to softening submarkets. Conversely, certain Single-Family segments, particularly $800K-$999K properties, continue to show healthy absorption and pricing stability.
Current data indicates that we will see continued market compression with several leading factors. Transaction velocity suggests sales volumes will likely remain well below historical peaks as current patterns will require extended absorption periods for market normalization. Inventory dynamics show the 41% increase in active listings provides Buyers more inventory to choose from. This also causes Sellers to compete more aggressively on pricing and presentation of their home. The discovery of the 8 condominium submarket inversions suggests pricing pressure could expand to additional segments without demand recovery in this submarket. Our analysis of the absorption timeline suggests historical cycles typically require 18-24 months to clear excess market inventory, indicating we should expect continued downward pressure through 2025 and into 2026.
For Buyers, in many submarkets, conditions favor choices and negotiation leverage. With 40% more listings expiring, being withdrawn, relisted and the DOM increasing, buyers should work with a knowledgeable real estate Advisor to investigate market patterns and withdrawn property histories to identify motivated sellers and negotiation opportunities. Conversely, there are still submarkets and product types that are in high demand and require that a Buyer be prepared and competitive.
For Sellers, pricing must reflect current comparable sales data rather than historical peaks and they should be mindful that 65% of properties selling in recent quarters sold below list price. In many submarkets, marketing periods are exceed 45-60 days and, Sellers should bear in mind that historically, this is a normal marketing period. Success in selling their property will require competitive pricing, presentation, consideration of timing and professional guidance to navigate submarket-specific conditions.
The rest of this report provides detailed metrics by home type (single-family homes, townhomes and condominiums) and submarket, including neighborhoods and cities Inside the Perimeter (ITP) and Outside the Perimeter (OTP).
To learn more about homes selling in your neighborhood or dream location, reach out to your Engel & Völkers Advisor for detailed submarket analysis and strategic guidance for current market conditions.

Christa Huffstickler Founder and CEO, License Partner
q Down Quarter-Over-Quarter (QOQ) p Up Quarter-Over-Quarter (QOQ) Source: FMLS InfoSparks, Greater Atlanta Area, All Home Types, April 2025 - June 2025
Source: FMLS InfoSparks, Greater Atlanta Area, All Home Types, April 2025 - June 2025
Q2 2025 Metro-Atlanta Condo Statistics by Price Point vs Q1 2025 Metro-Atlanta Average $499,999 < $500,000 - $799,999
Q2 2025 Metro-Atlanta Single-Family Statistics by Price Point vs Q1 2025 Metro-Atlanta Average
$499,999 < $500,000 - $799,999
Q2 2025 Metro-Atlanta Townhome Statistics by Price Point vs Q1 2025 Metro-Atlanta Average
$499,999 < $500,000 -
Source: FMLS InfoSparks, Greater Atlanta Area, All Home Types, January 2025 - June 2025


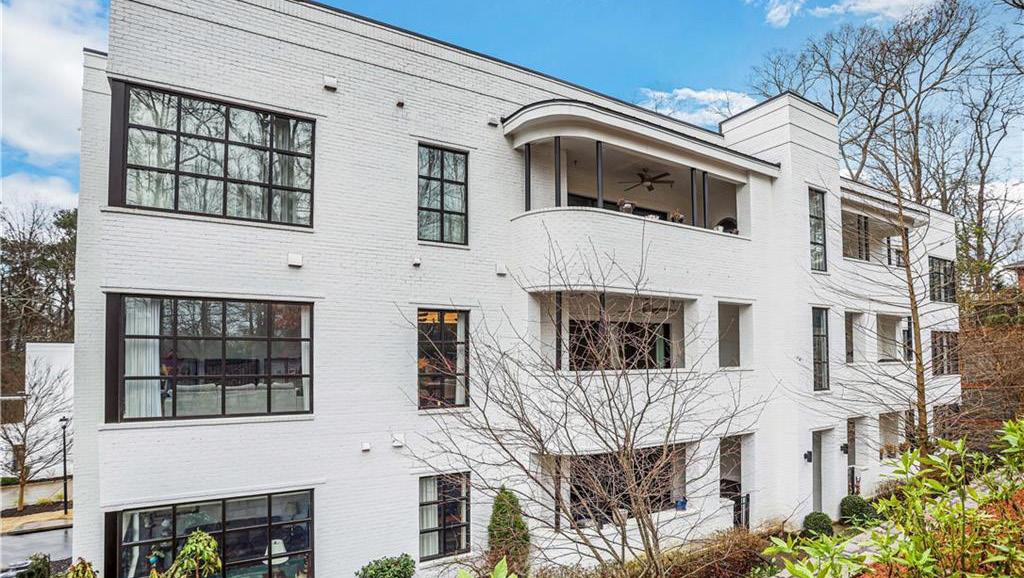
Inside The Perimeter


Source: FMLS, InfoSparks, Q2 2025 (4/1/25 to 6/31/25)

$599,000
Source: FMLS, InfoSparks, Q2 2025 (4/1/25 to 6/31/25)


Source: FMLS, InfoSparks, Q2 2025 (4/1/25 to 6/31/25)


Source: FMLS, InfoSparks, Q2 2025 (4/1/25 to 6/31/25)


Source: FMLS, InfoSparks, Q2 2025 (4/1/25 to 6/31/25)

Source: FMLS, InfoSparks, Q2 2025 (4/1/25 to 6/31/25)

Source: FMLS, InfoSparks, Q2 2025 (4/1/25 to 6/31/25)


Source: FMLS, InfoSparks, Q2 2025 (4/1/25 to 6/31/25)


Source: FMLS, InfoSparks, Q2 2025 (4/1/25 to 6/31/25)


Source: FMLS, InfoSparks, Q2 2025 (4/1/25 to 6/31/25)

Source: FMLS, InfoSparks, Q2 2025 (4/1/25 to 6/31/25)


Source: FMLS, InfoSparks, Q2 2025 (4/1/25 to 6/31/25)


Source: FMLS, InfoSparks, Q2 2025 (4/1/25 to 6/31/25)


Source: FMLS, InfoSparks, Q2 2025 (4/1/25 to 6/31/25)


Source: FMLS, InfoSparks, Q2 2025 (4/1/25 to 6/31/25)


Source: FMLS, InfoSparks, Q2 2025 (4/1/25 to 6/31/25)


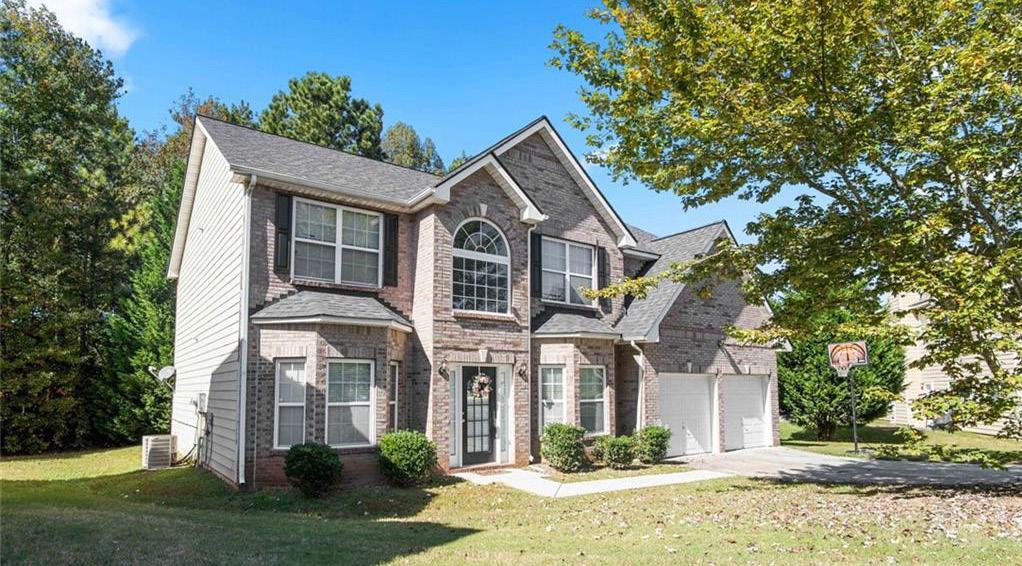
SINGLE-FAMILY
Source: FMLS, InfoSparks, Q2 2025 (4/1/25 to 6/31/25)


Source: FMLS, InfoSparks, Q2 2025 (4/1/25 to 6/31/25)


Source: FMLS, InfoSparks, Q2 2025 (4/1/25 to 6/31/25)


Source: FMLS, InfoSparks, Q2 2025 (4/1/25 to 6/31/25)


Source: FMLS, InfoSparks, Q2


Source: FMLS, InfoSparks, Q2 2025 (4/1/25 to 6/31/25)


Source: FMLS, InfoSparks, Q2 2025 (4/1/25 to 6/31/25)


Source: FMLS, InfoSparks, Q2


Source: FMLS, InfoSparks, Q2 2025 (4/1/25 to 6/31/25)

Source: FMLS, InfoSparks, Q2 2025 (4/1/25 to 6/31/25)


Source: FMLS, InfoSparks, Q2 2025 (4/1/25 to 6/31/25)


Source: FMLS, InfoSparks, Q2 2025 (4/1/25 to 6/31/25)

Source: FMLS, InfoSparks, Q2 2025 (4/1/25 to 6/31/25)

Source: FMLS, InfoSparks, Q2 2025 (4/1/25 to 6/31/25)

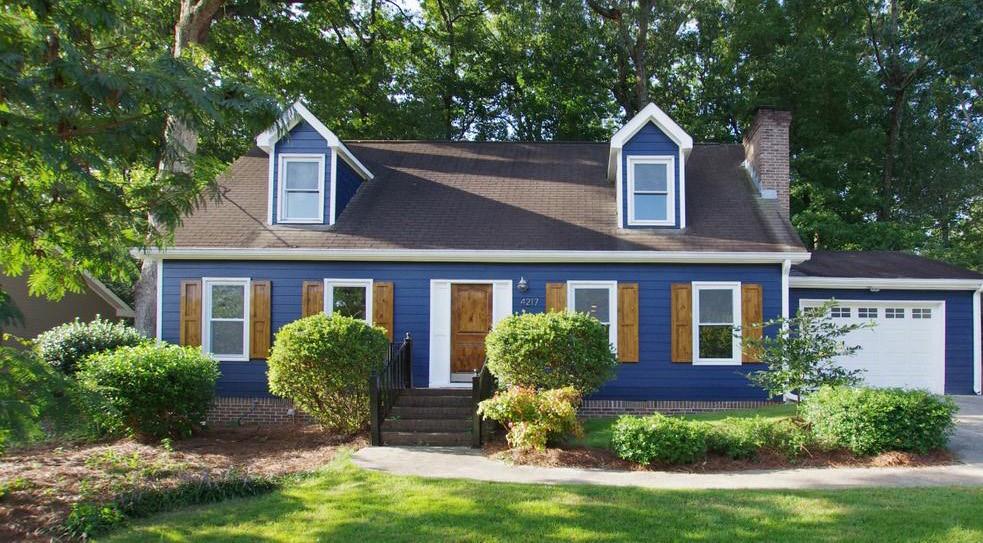
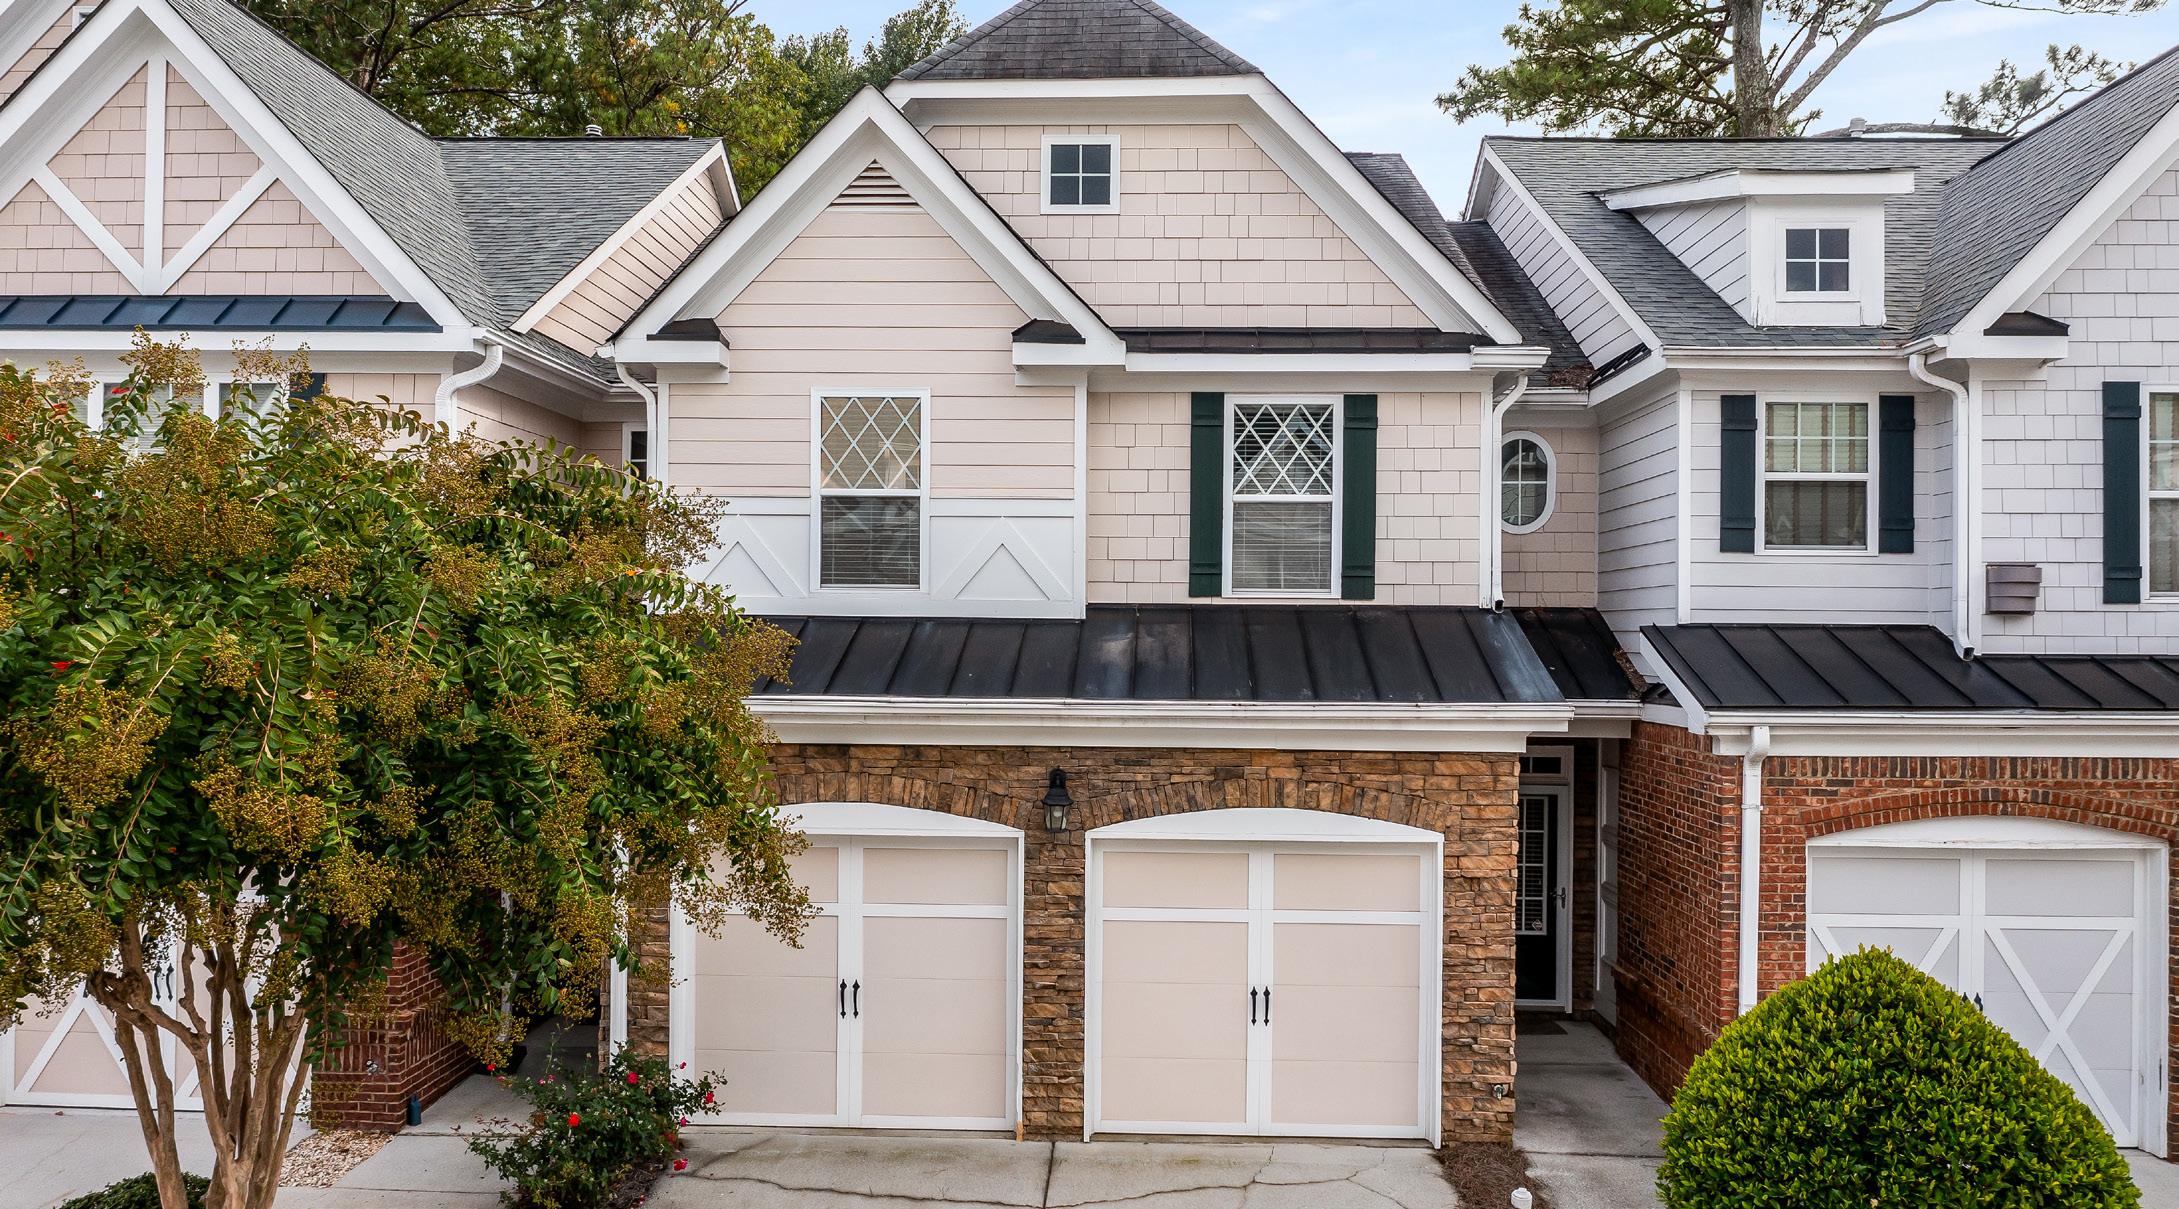
SINGLE-FAMILY HOMES
$446,900

Source: FMLS, InfoSparks, Q2 2025 (4/1/25 to 6/31/25)
$360,000

Source: FMLS, InfoSparks, Q2 2025 (4/1/25 to 6/31/25)


Source: FMLS, InfoSparks, Q2 2025 (4/1/25 to 6/31/25)


Source: FMLS, InfoSparks, Q2 2025 (4/1/25 to 6/31/25)

$395,000

Source: FMLS, InfoSparks, Q2 2025 (4/1/25 to 6/31/25)


Source: FMLS, InfoSparks, Q2 2025 (4/1/25 to 6/31/25)


Source: FMLS, InfoSparks, Q2 2025 (4/1/25 to 6/31/25)


Source: FMLS, InfoSparks, Q2 2025 (4/1/25 to 6/31/25)


Source: FMLS, InfoSparks, Q2 2025 (4/1/25 to 6/31/25)


$294,265
Source: FMLS, InfoSparks, Q2 2025 (4/1/25 to 6/31/25)


Source: FMLS, InfoSparks, Q2 2025 (4/1/25 to 6/31/25)


Source: FMLS, InfoSparks, Q2 2025 (4/1/25 to 6/31/25)

$655,000
Source: FMLS, InfoSparks, Q2 2025 (4/1/25 to 6/31/25)
$580,000
Source: FMLS, InfoSparks, Q2 2025 (4/1/25 to 6/31/25)


$516,500

Source: FMLS, InfoSparks, Q2 2025 (4/1/25 to 6/31/25)

$492,000
Source: FMLS, InfoSparks, Q2 2025 (4/1/25 to 6/31/25)

Source: FMLS, InfoSparks, Q2 2025 (4/1/25 to 6/31/25)


$529,990

Source: FMLS, InfoSparks, Q2 2025 (4/1/25 to 6/31/25)
Source: FMLS, InfoSparks, Q2 2025 (4/1/25 to 6/31/25)
$435,000
Source: FMLS, InfoSparks, Q2 2025 (4/1/25 to 6/31/25)

Source: FMLS, InfoSparks, Q2 2025 (4/1/25 to 6/31/25)


Source: FMLS, InfoSparks, Q2 2025 (4/1/25 to 6/31/25)

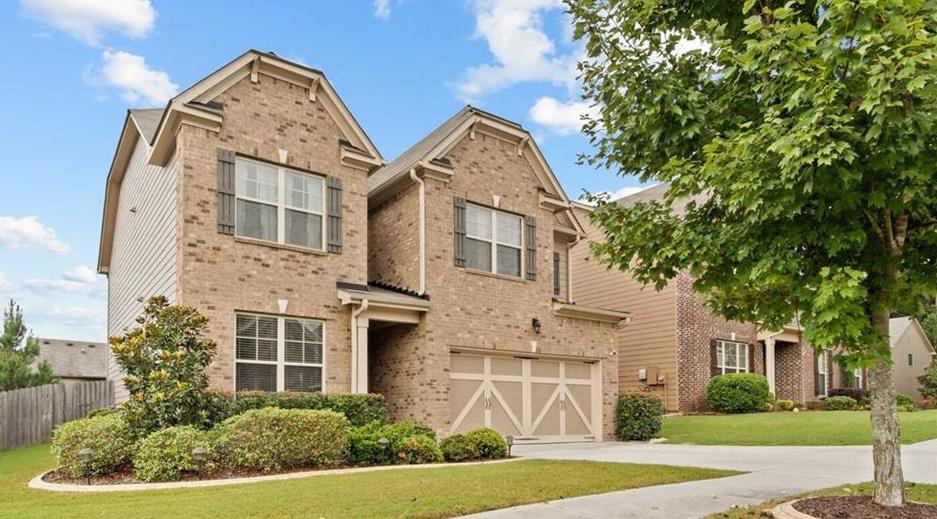
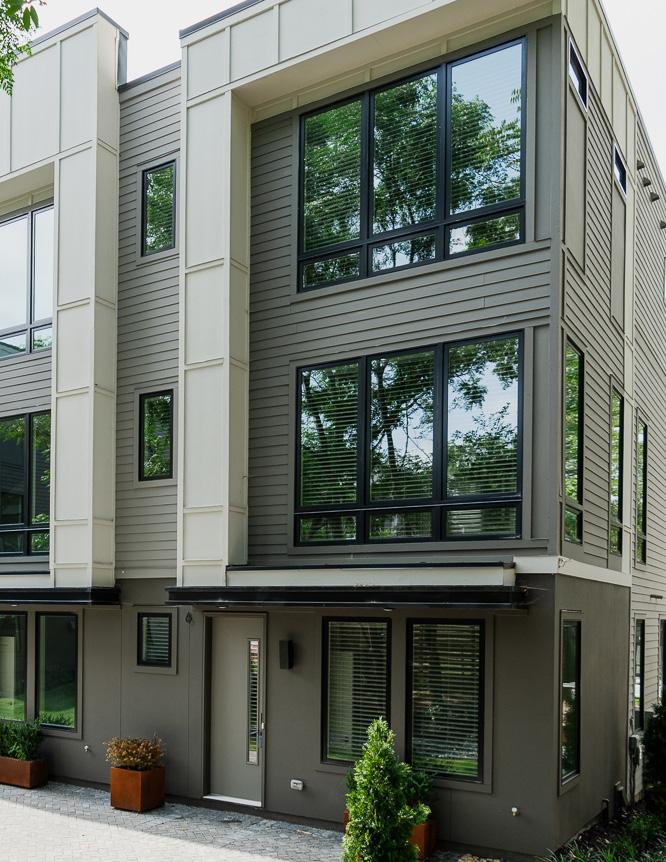
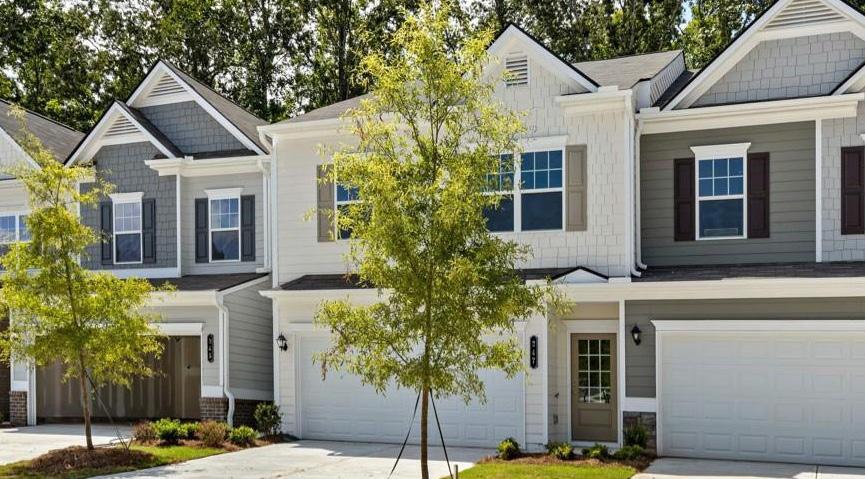
TOWNHOMES

$379,990
Source: FMLS, InfoSparks, Q2 2025 (4/1/25 to 6/31/25)

$856,575

Source: FMLS, InfoSparks, Q2 2025 (4/1/25 to 6/31/25)


37
$382,733
Source: FMLS, InfoSparks, Q2 2025 (4/1/25 to 6/31/25)
Source: FMLS, InfoSparks, Q2 2025 (4/1/25 to 6/31/25)

The following key indicators are used throughout this report to describe market trends:


Properties that are currently listed for sale on FMLS. Additional properties may be for sale at any given time— such as for-sale by owner homes or off-market listings— but are not included in the count of “active listings” in this report if they are not in the FMLS database.

New listings are those that have been added to FMLS in a given month. They do not include active listings that were entered in previous months.

Closed sales represent homes that have sold and transactions have been finalized. This indicator tends to lag market trends slightly because properties typically close one to two months after an offer has been accepted and buyers have locked their interest rates.

Pending sales are properties that have accepted an offer from a buyer and is in the due diligence period. The sales transaction has not happened yet. This is a leading indicator because it give us insight into how buyers and sellers are reacting to the most current market conditions.

The sale price is the final amount paid for a home. It is measured as either an average or a median, with the average price tending to be skewed higher by the highest priced homes. It does not reflect seller concessions, such as closing costs that may have been paid.


Days on market (DOM) measures how long it takes from the time a home is listed until the owner signs a contract for the sale of a property. This tends to vary based on the desirability of a given property, market conditions, and season.

The sale price to list price ratio (SP/LP) indicates if a home sold at (100%), above (>100%), or below (<100%) the listed asking price. The sale price to original list price ratio (SP/OLP) compares the sale price to the original asking price, as the current asking price may have reflected price changes.

Months of inventory indicates how long it would likely take to sell currently listed homes, if no new inventory were added. It is measured as a ratio of active listings to homes sold. 5 to 6 months of inventory is considered a balanced market. Less than 6 months supply tends to favor sellers, and more tends to favor buyers.