The data found within the ERA Shields Real Estate Stat Pack is based on information from the Pikes Peak REALTOR® Services Corporation (RSC) or its PPMLS. This content is deemed reliable; however RSC, PPMLS and ERA Shields Real Estate do not guarantee its accuracy. Data maintained by RSC does not reflect all real estate activity in the market. Additional sources include the Colorado Springs Business Alliance, El Paso County Assessor, El Paso County.
QUICK FACTS (SQLY = Same Quarter Last Year)
Data through 1st Quarter 2025
RESIDENTIAL REVIEW
El Paso County
Welcome to the ERA Shields Stat Pack. The intent for providing information to you is to educate you on the current local real estate market so you can better make decisions for you and your family. Real estate markets vary from city to city as well as neighborhood to neighborhood. When the national media reports how the real estate market is doing, it is reporting on national numbers and it is likely very different from how your neighborhood is performing. You will find factual data within this document from which you may draw your own
Mortgage rates improved about 1/4 point during the Quarter when compared to the SQLY
Average active listings for the quarter were 1818 , compared to 1246 from the SQLY (up 45%)
Total new listings for the quarter were 3206, compared to 2755 from the SQLY (up 16%)
Sales for the quarter were 1977 units, compared to 1896 from the SQLY (up 4%)
Average sales price for the Quarter was $552,813 up from $524,741 during the SQLY (up 5.3%)
Average median sales price for the Quarter was $486,667 up from $460,800 (up 5.6%)
Average days on market for sold homes was 65 for the quarter, up from 57 days from the SQLY
Single family permits YTD were 766 compared to 655 from the SQLY (up 16%)
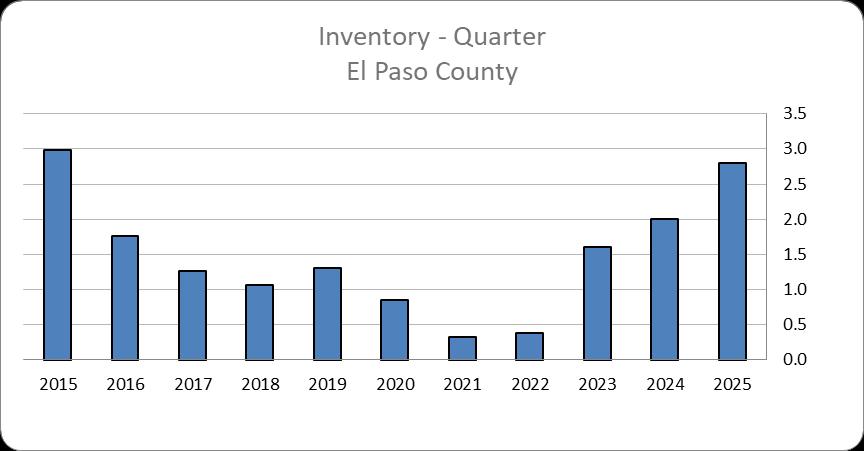
This graph compares the number of homes on the market (Active) to the number of homes Sold. It shows how many months it would take to sell through the current listing inventory. Most economists consider 5-6 months to be a balanced market.
PRICING TOOLS
SINGLE FAMILY/PATIO HOME - EL PASO COUNTY
Comparing data for the past 10 years
This graph shows the average number of active listings on the market for the same period over the past 10 years.
The blue line shows the number of new listings for the same 3-month period over the past 10 years. The red line is the total number of sales for that period.
www.ERAShields.com
www.ERAShields.com/pages/MarketConditions
QUARTERLY DATA
Comparing data for the past 10 years
The Average & Median Sales Prices for the same period over the past 10 years. This graph illustrates the current health of the local real estate market.
The price range a home is within dictates the odds of selling in the next 30 days. Generally the lower the price, the more likely it will sell.
MORTGAGE RATES
Mortgage rates during the 1st quarter of 2025 began a slow decline from a high just over 7% to a low of 6.6%. Buyers are becoming more comfortable with rates in the 6’s as activity this Spring has grown as demonstrated in the highest number of under contracts we have seen since last summer.
The historical average rate of a 30-year fixed rate mortgage
This chart shows mortgage rates back to 1971. The average mortgage rate over all of these years is 7.73%. It should also be known that the Federal Reserve began buying Mortgage Backed Securities in 2008 to artificially lower mortgage rates to help the economy recover from the financial crisis. The Fed stopped this practice in early 2022 and rates immediately increased.
www.ERAShields.com
HOUSING STARTS
This chart shows the total number of single family housing starts for the quarter in Colorado Springs and all other reporting jurisdictions for Pikes Peak Regional Building Department.
SUMMARY
The first quarter of 2025, the Colorado Springs real estate market experienced notable changes compared to the same period in 2024. The average home sold price in 2025 was $552,813, reflecting a 5.3% increase from 2024. This rise was a bit surprising as the market was rather lackluster, but continued strong demand in the higher price ranges seems to have been the likely culprit.
Market dynamics are continuing to shift away from a seller's market to a more balanced market thanks to an injection of nearly 2000 new listings coming on the market during the quarter. The slightly lower mortgage rates are attracting more first time home buyers as well as those in the under $500,000 prices range. The average number of homes on the market during the first quarter was about 1800, which was a jump of 45% and should help keep prices from increasing as much.