The data found within the Stat Pack is based on information from the Pikes Peak REALTOR® Services Corporation (RSC) or it’s PPMLS. This content is deemed reliable; however, RSC, PPMLS and ERA Shields Real Estate do not guarantee its accuracy. Data maintained by RSC does not reflect all real estate activity in the market. Additional sources include the Colorado Springs Business Alliance, El Paso County Assessor, and El Paso County.
QUICK FACTS
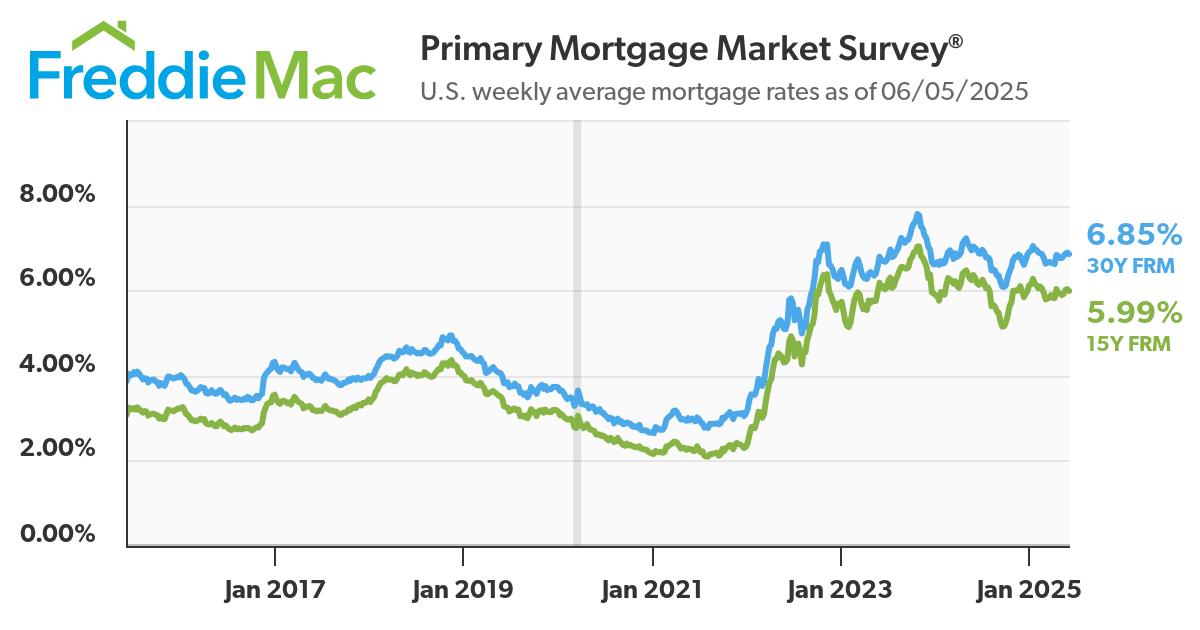
30-year mortgage rates remain relatively flat at 6.89%
Data through May 2025
RESIDENTIAL REVIEW
El Paso County
Welcome to the ERA Shields Stat Pack. The intent for providing information to you is to educate you on the current local real estate market so you can better make decisions for you and your family. Real estate markets vary from city to city as well as neighborhood to neighborhood. When the national media reports how the real estate market is doing, it is reporting on national numbers and it is likely very different from how your neighborhood is performing. You will find factual data within this document from which you may draw your own conclusions. We include a brief summary on the last page.
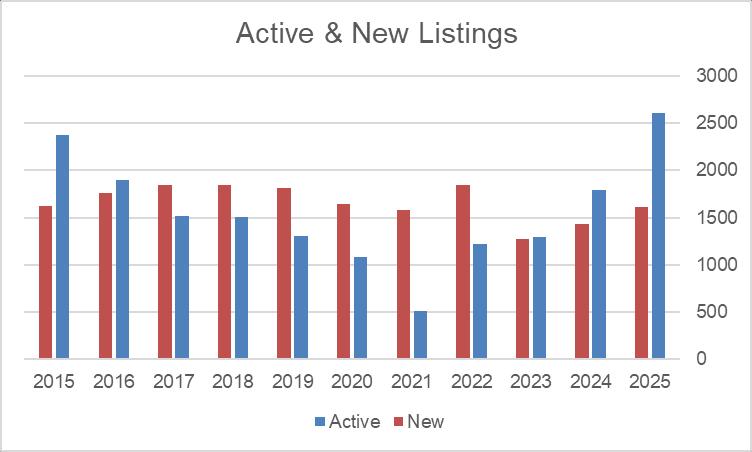
2,607 listings are on the market-this is up 45% from the same month last year (SMLY)
New listings for the month were 1612 -which is up just 12% from SMLY
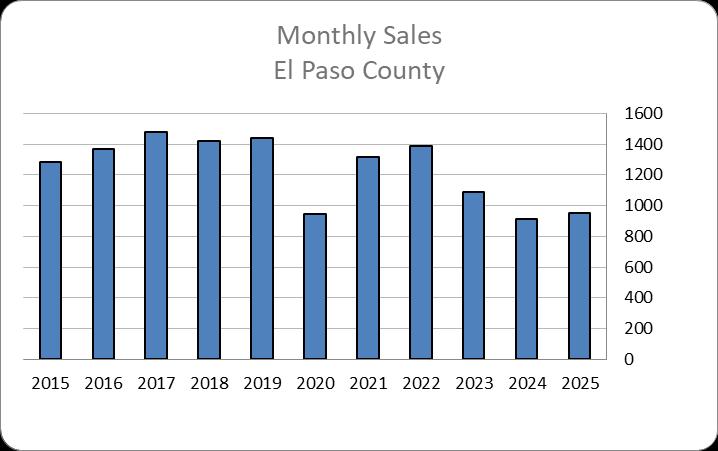
There were 949 sales for the month-which is up 3% from SMLY
The list price/sales price ratio was 99.5%
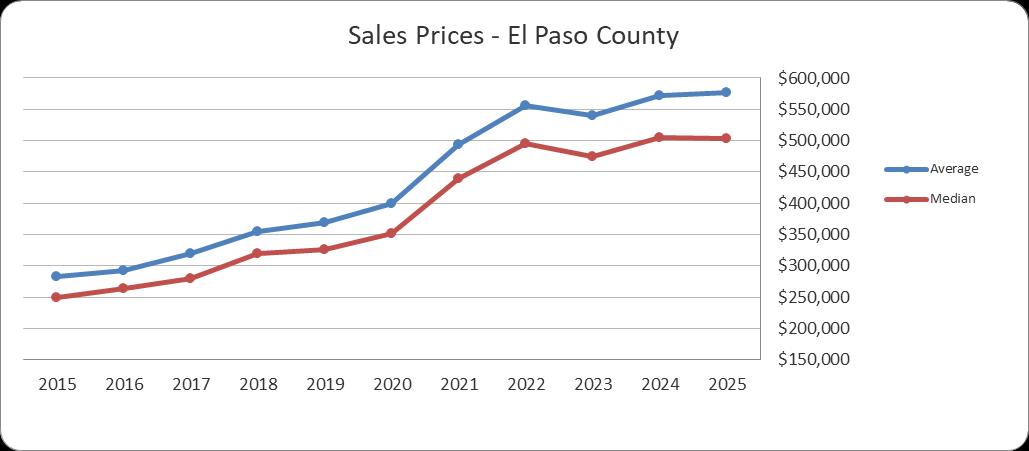
Average sales price for the month was flat $576,872 up .8% from SMLY
Median sales price for the month was also flat at $503,000—up .4% from SMLY
Median days on market for sold homes was 42 compared to 34 for the SMLY
Single family permits YTD are at 1,291 which is down from the 1,462 units from the SMLY
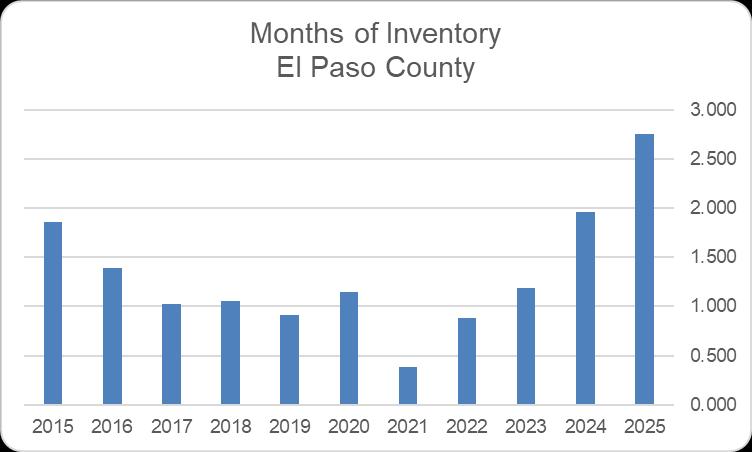
This graph compares the number of Active homes on the market to the number of homes Sold. It shows how many months it would take to sell through the current listing inventory. Most economists consider 5-6 months to be a balanced market.
PRICING TOOLS
Comparing data for the past 10 years
This graph shows the total number of active listings on the market and new listings coming on the market for the same period.
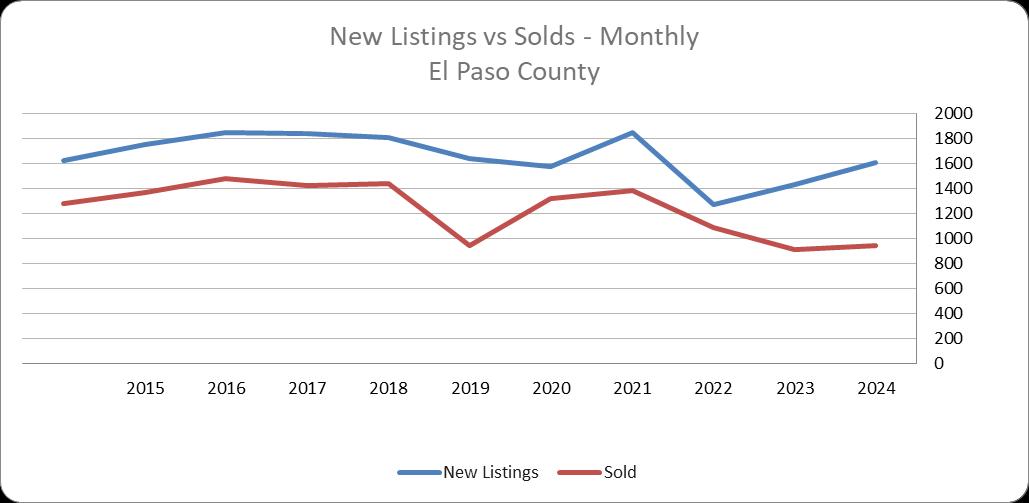
The correlation between new listings and solds helps assess the health of the market. A large gap between the two lines indicates an imbalanced market.
www.ERAShields.com
www.ERAShields.com/pages/MarketConditions
QUARTERLY DATA
Comparing data for the past 10 years
This graph shows the Average & Median Sales Prices for the same period over the past 10 years. Sales prices are the true “score” of the market.
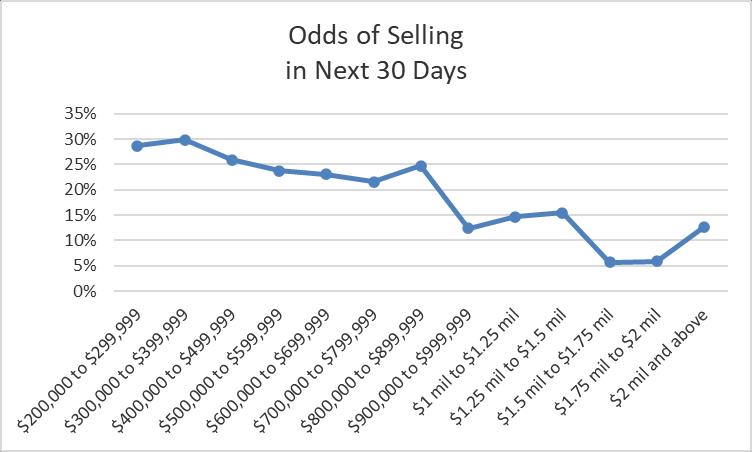
The price range a home is within dictates the odds of selling in the next 30 days. Generally the lower the price, the more likely it will sell.
SUMMARY
Colorado
Springs Real Estate Market Update – May 2025
While the stats suggest a relatively balanced market with a slight edge to sellers, the reality on the ground tells a different story. It feels a lot like the 2008–2009 market when many properties were vacant, and showings were unusually quiet.
That said, there are still homes that buyers are jumping on typically the ones that are priced competitively, show beautifully, and are in great locations. These are the properties getting multiple offers, and even selling above asking price sometimes.
Relying on online estimates for your home’s value can be risky. Many sites openly admit they are within 10% of the final sales price 95% of the time. For a $500,000 home, that’s a potential $50,000 difference—in either direction. If you overprice your home, it will sit on the market and eventually you will have to lower the price and as the days on market increase, your home’s value decreases. If you underprice your home, you stand to lose some of your valuable equity.
If you want to protect your equity and position your home to sell for top dollar, you need a pricing strategy based on real data and local expertise. That’s where an experienced agent with a proven track record makes all the difference.
The average rate of a 30-year mortgage since 1971 is 7.72%