
Understanding Our Visitors
Multi-Institutional
Museum Study
July 2024–June 2025
COVES was established as a grant-funded project in October 2014 through the generous support of the Institute of Museum and Library Services. The project has been an independent, membership-supported entity since October 2018. Generous support is provided by the Art Bridges Foundation for 72 art museums participating in COVES this year.
The core COVES team is housed at the Museum of Science, Boston, with additional staff support from the Crystal Bridges Museum of American Art, the Association of Science and Technology Centers (ASTC), and Aurora Consulting.
During the 2025 fiscal year, the collaboration had 116 participating sites across two cohorts: Science+ and Art. Institutions in the Science+ cohort include science centers, natural history museums, children’s museums, and history museums, while the Art cohort includes all art-focused institutions.
We would like to thank our members, whose staff worked hard every day to collect the data shared in this report. Without you, there would be no COVES.

Report designed by Colorbox Industries
Cover image © National WWI Museum and Memorial
Image on this page © Bell Museum | Sarah Karnas
© 2025 Collaboration for Ongoing Visitor Experience Studies
WHAT IS COVES?
The Collaboration for Ongoing Visitor Experience Studies (COVES) unites museums of all types to systematically collect, analyze, and report on visitor experience data. We represent a collaborative museum community seeking to better understand and improve our visitors’ experiences. Our members learn about their visitors and we share aggregate data about who visits a particular museum, why they visit, what they experience during their visit, and how they react to different aspects of their experience. Participating members vary in size and represent art museums, children’s museums, history museums, natural history museums, and science centers across the United States.
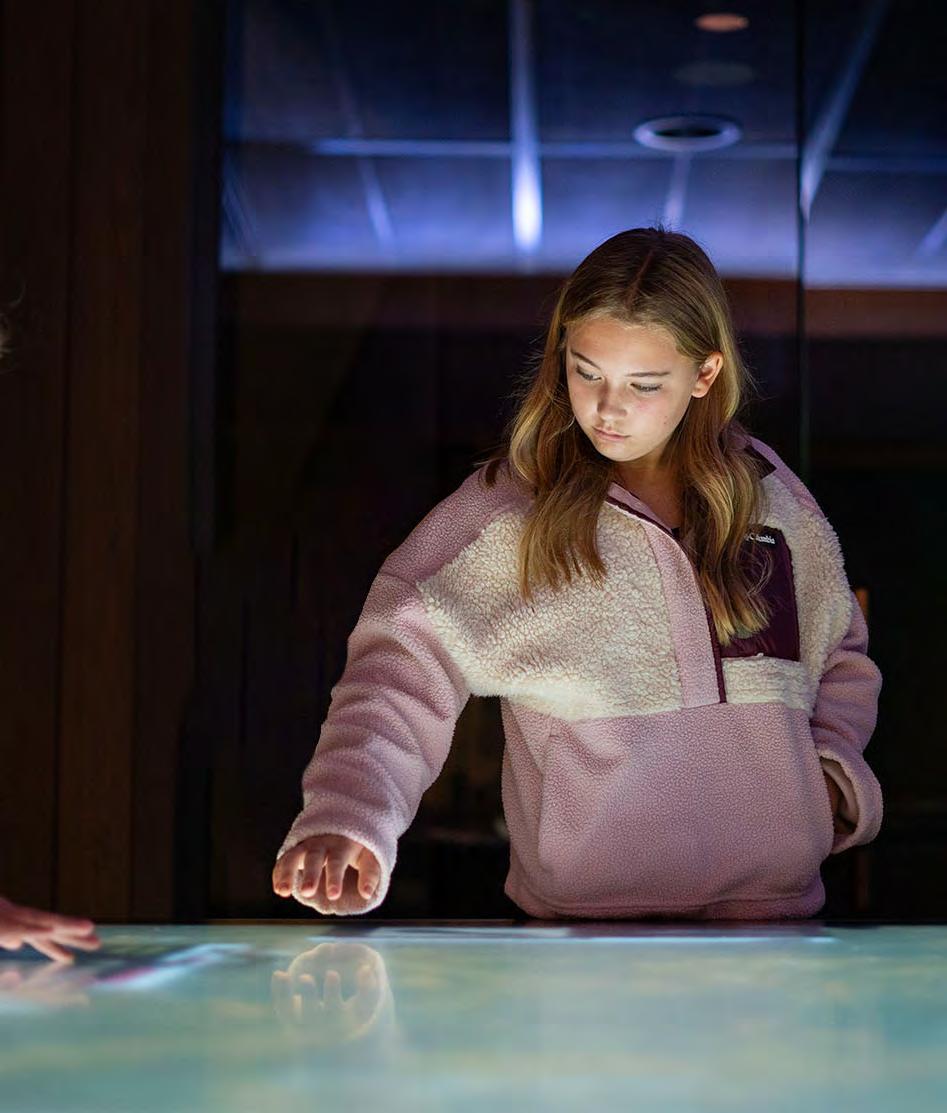
Who are our visitors?


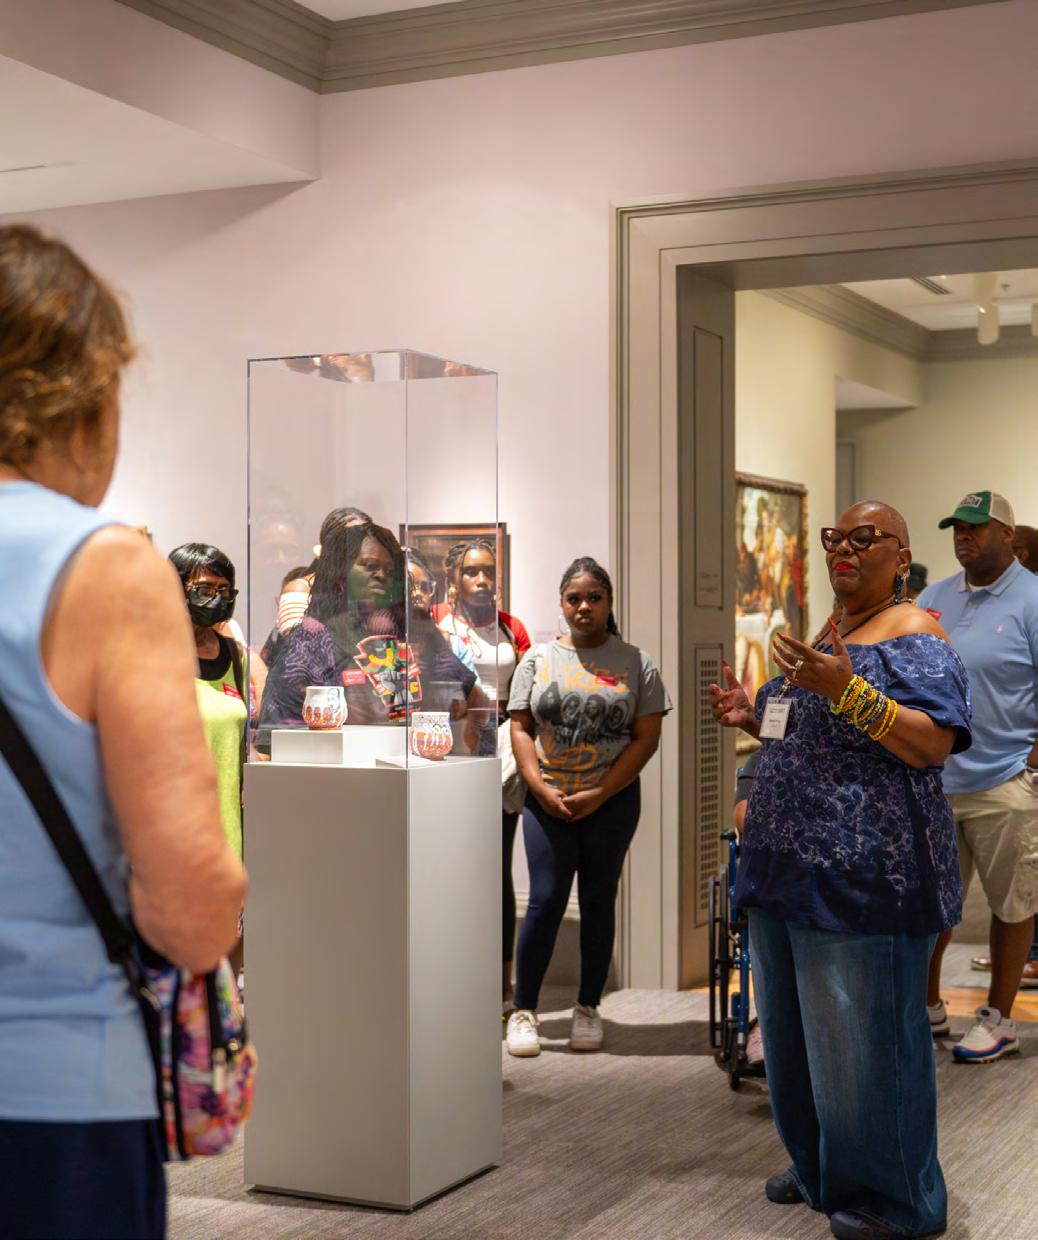
Why do they visit?
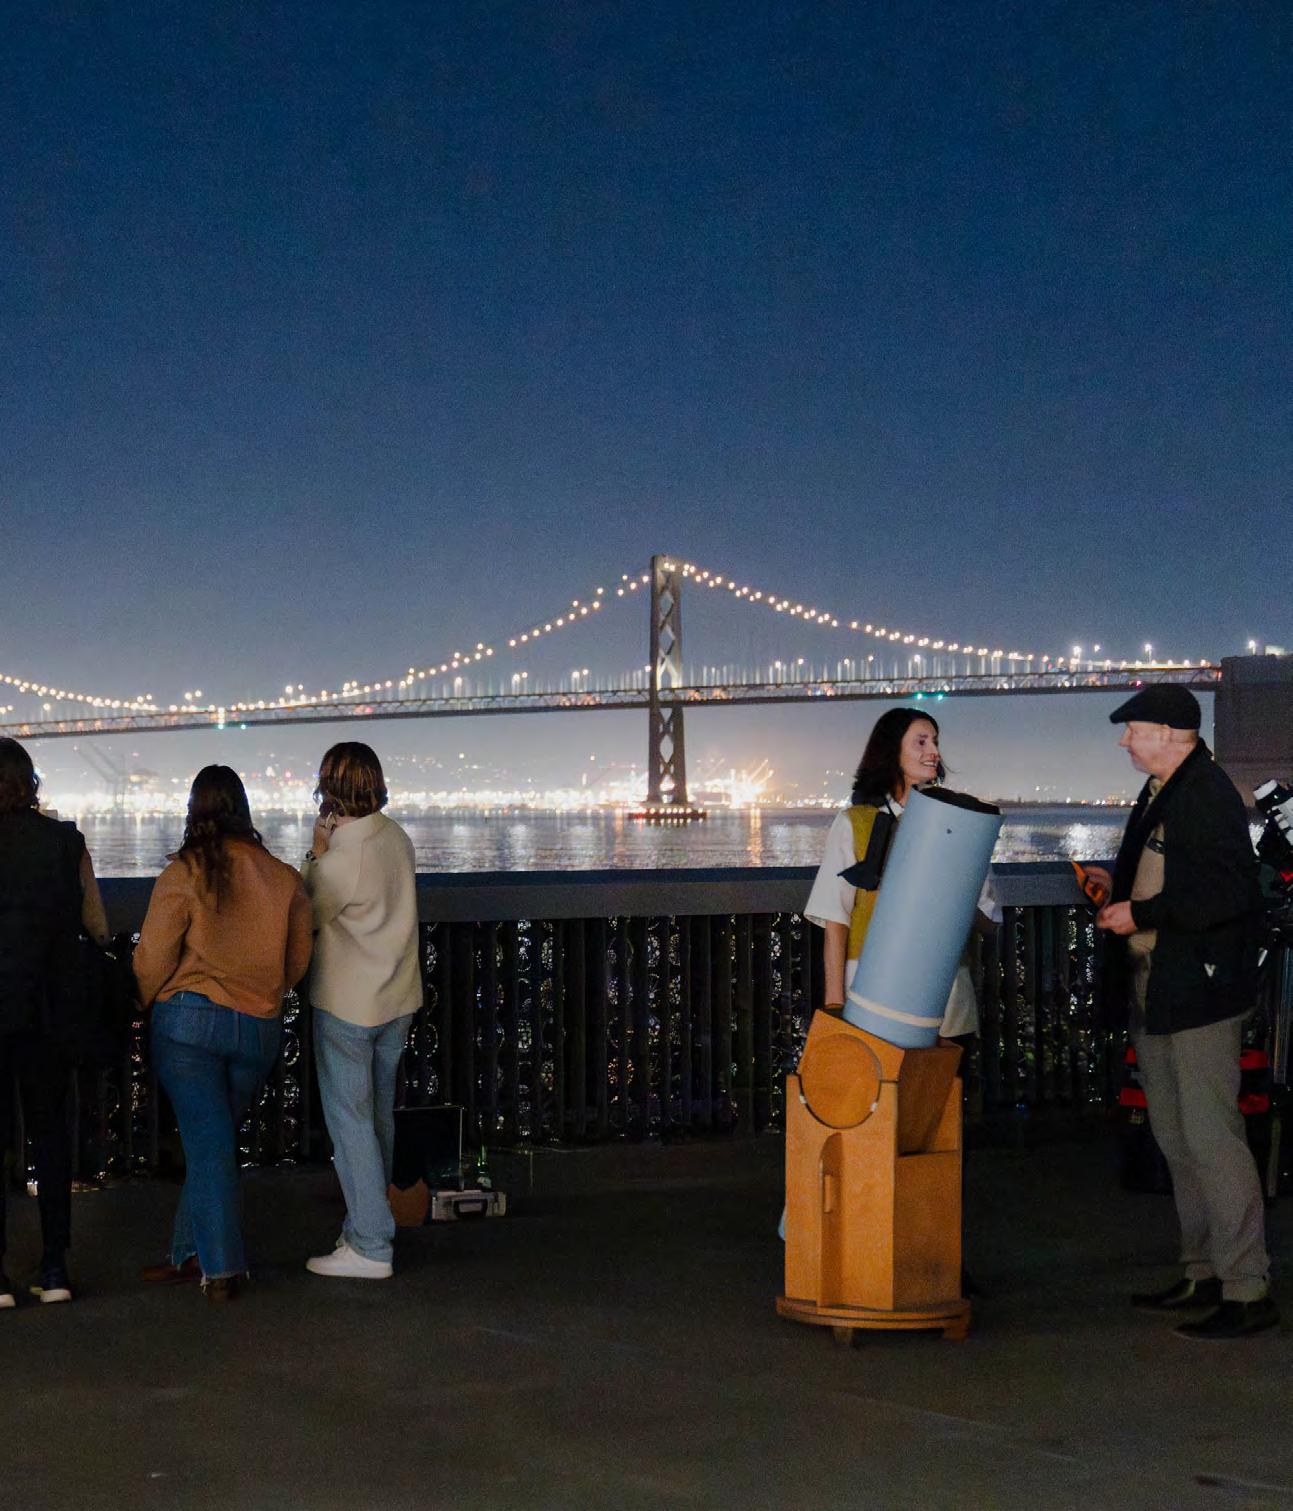
How do they react?
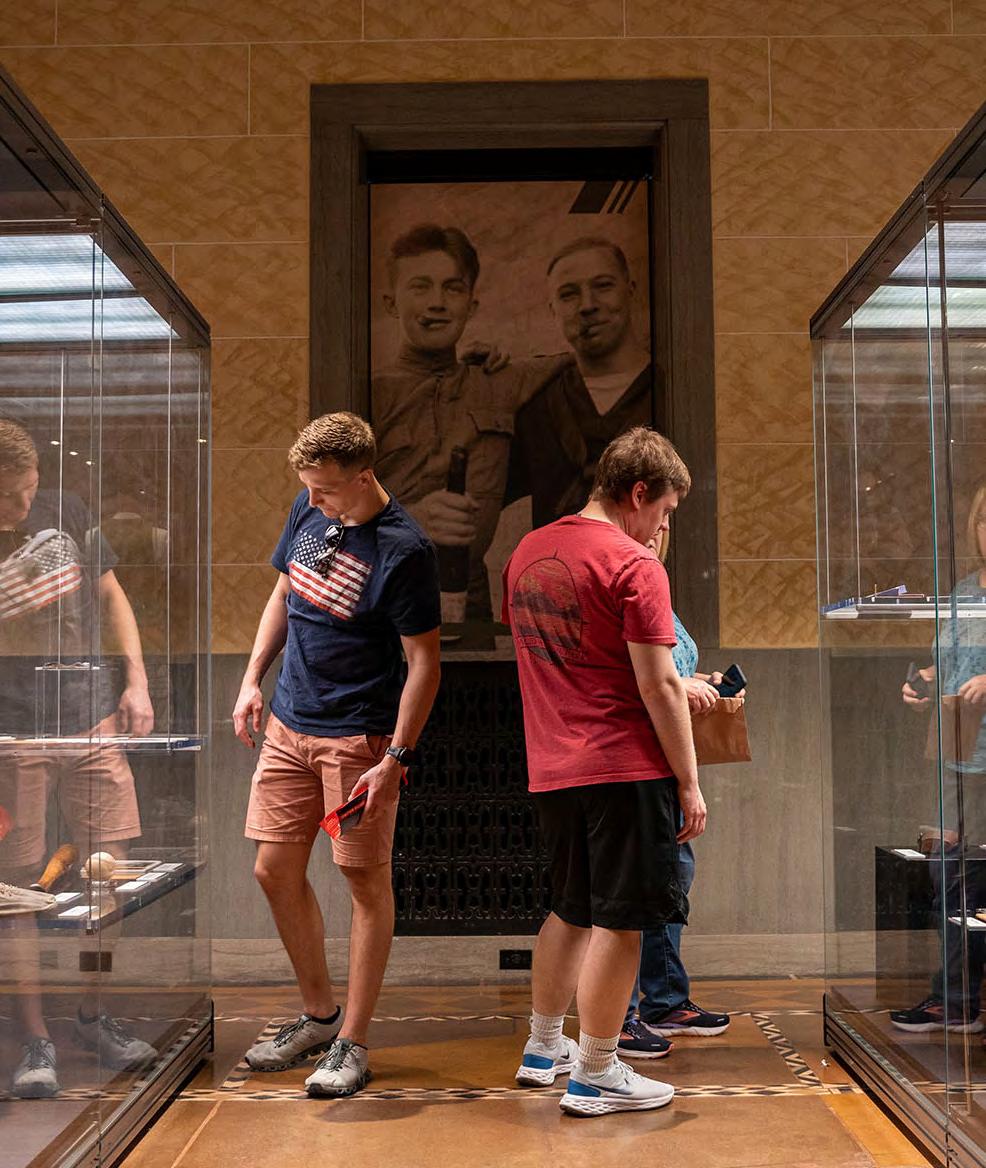
What do they experience?
Image Credit: Bell Museum | Sarah Karnas
Image credit: Connecticut Science Center
Image credit: Exploratorium | Shengfeng Chien
Image credit: WWI Museum and Memorial
ABOUT THIS REPORT
COVES collects, analyzes, and reports data about museum visitors.
Who are our visitors?
Participating intitutions can make evidencebased decisions.
How do they react?
MUSEUM VISITORS
Why do they visit?
What do they experience?
Aggregate data (shown in this report) can inform the museum field as a whole.
In this report we present data collected by our member museums between July 2024 and June 2025 to provide insights about broad trends in museum visitors. Because the data were collected using a common method and survey instrument, they can be combined—or aggregated—together. The data presented in this report do not typify any particular institution, instead they represent the collaboration as a whole.
The COVES data set has more information than can be shared in a single report.
The data that follow have been selected because:
ɠ They represent areas of interest for our community of member museums or
ɠ They represent distinct stories between comparison groups
Our analyses are exploratory and are more suggestive of trends to be aware of rather than declarative in nature. Therefore, the comparisons presented are descriptive and do not indicate statistical findings from inferential analyses.
In addition to sharing a comprehensive overview of the aggregate data, this year we are exploring different types of visitor groups. These include groups with or without children, members or non-members, local or out-of-town non-members, and first-time or recent visitors.
WHEN READING THIS REPORT, CONSIDER THE FOLLOWING QUESTIONS:
Do any of these findings confirm or challenge your assumptions or expectations?
What do these data suggest about trends among museum visitors?
What types of actions might we take as a field based on these data?
We share the questions and explain why we ask them in the COVES Instrument Explained:
understandingvisitors.org/ COVES_Exit_Survey
PARTICIPATING INSTITUTIONS
included in this report
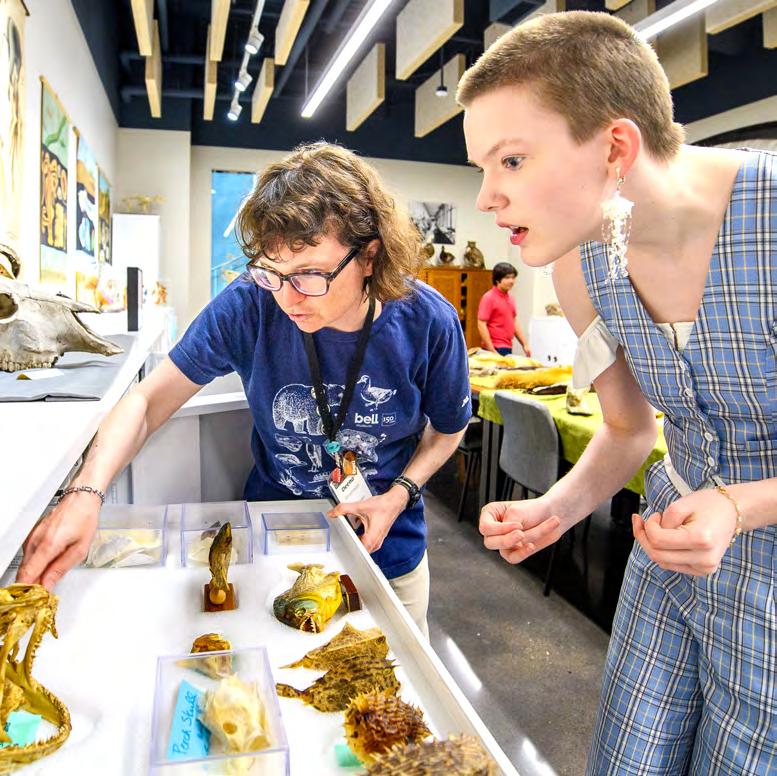
Image credit: Bell Museum Joe Szurszewski
Science+ museums
Art museums
Science+ Museums
The Bakken Museum | MN
Bell Museum | MN
California Science Center | CA
Children’s Discovery Museum of San Jose | CA
Connecticut Science Center | CT
Discovery Center Museum | IL
Discovery Museum | MA
Discovery Place Science | NC
Exploratorium | CA
Great Lakes Science Center | OH
Imagination Station | OH
Kiewit Luminarium | NE
La Brea Tar Pits | CA
Lawrence Hall of Science | CA
Marbles | NC
Mayborn Museum | TX
Museum of Science | MA
Mystic Seaport Museum | CT
National WWI Museum and Memorial | MO
Natural History Museum of Los Angeles County | CA
New York Hall of Science | NY
Putnam | IA
Saint Louis Science Center | MO
Science Center of Iowa | IA
Science Museum of Minnesota | MN
Scott Family Amazeum | AR
Space Center Houston | TX
Art Museums
Akron Art Museum | OH
Allentown Art Museum | PA
Barnes Foundation | PA
The Bass | FL
Beach Museum | KS
Birmingham Museum of Art | AL
Boise Art Museum | ID
Bruce Museum | CT
Cahoon Museum | MA
Chazen Museum of Art | WI
Cincinnati Art Museum | OH
Colby College Museum of Art | ME
Columbia Museum of Art | SC
Columbus Museum of Art | OH
Contemporary Art Museum St. Louis | MO
Corning Museum of Glass | NY
Crystal Bridges Museum of American Art | AR
Cummer Museum of Art & Gardens | FL
Dixon Gallery and Gardens | TN
Eiteljorg Museum | IN
Erie Art Museum | PA
Farnsworth Art Museum | ME
Frost Art Museum | FL
Gibbes Museum of Art | SC
Gregory Allicar Museum of Art | CO
Harn Museum of Art | FL
Harwood Museum of Art | NM
Hudson River Museum | NY
Hunter Museum of American Art | TN
The Huntington Library, Art Museum, and Botanical Gardens | CA
Kalamazoo Institute of Arts | MI
Memorial Art Gallery | NY
Museum of Fine Arts | FL
Mia | MN
The Mint Museum | NC
Mobile Museum of Art | AL
MoMA PS1 | NY
The Momentary | AR
Montgomery Museum of Fine Arts | AL
National Museum of Asian Art | DC
Nelson-Atkins Museum of Art | MO
Oklahoma Contemporary Arts Center | OK
Palmer Museum of Art | PA
Peabody Essex Museum | MA
Peoria Riverfront Museum | IL
Philbrook Museum of Art | OK
Portland Art Museum | OR
Portland Museum of Art | ME
Sarasota Art Museum | FL
Sheldon Museum of Art | NE
Southern Vermont Arts Center | VT
Speed Art Museum | KY
Springfield Museums | MA
Taft Museum of Art | OH
Walker Art Center | MN
Walters Art Museum | MD
Zimmerli Art Museum | NJ
DATA COLLECTION METHODS
COVES completed a pilot study during its first year (October 2015–March 2016) to test and select a standardized data collection method. From that study we saw that in-person exit surveys introduced the least amount of response bias, had the highest response rates, and took the least amount of time to collect data. Since that initial study, we have seen that alternative methods of data collection negatively impact data quality. All COVES institutions collect data using an onsite, electronic exit survey.
Data collectors approach general visitor groups (i.e., not school field trips) at the museum exit(s) and ask them to complete the survey.
Groups are chosen at random using a sampling protocol.
One adult in their group completes the survey on a tablet at the end of their group’s time in the museum.
If they are more comfortable using their own device (e.g., for personalized accessibility features), the individual may scan a QR code instead of using the offered tablet.
KEY ASPECTS OF THE DATA COLLECTION AND SURVEY
ONSITE SURVEY
Respondents take the survey using an electronic tablet.
BILINGUAL
Visitors may complete the survey in either English or Spanish.
GENERAL PUBLIC ONLY
No school, camp, or tour groups are included in the sample.
DATA COLLECTION IS ONGOING
Surveys are collected during every month of the year, on weekdays and weekends.
AVERAGE SURVEY DURATION
5:09 min | sec 49%
AVERAGE RESPONSE RATE ACROSS SITES
SAMPLE INFORMATION
The COVES team sets annual data collection targets for museums using their historical attendance data. Participating sites aim to collect between 500 and 1,400 surveys per year, which are distributed across the year to reflect typical visitation patterns. Most often, museums collect the most surveys in July when attendance is highest and collect the fewest surveys in September when visitation tends to be lower.
ANNUAL INSTITUTION TARGETS
ABOUT THE DATA IN THIS REPORT
ɠ Includes data from the COVES 2025 fiscal year (July 1, 2024 to June 30, 2025)
ɠ Represents 41,381 surveys across 84 sites
ɠ For data to be included in this report, institutions needed to collect at least 100 surveys, with less than 33% of the sample collected through their unique QR code.
STATISTICAL WEIGHT FORMULA
To account for differences in sample sizes across institutions and avoid over-representing large institutions, statistical weights were applied to the data prior to analysis.
DEMOGRAPHICS
The COVES protocol involves selecting one adult from a visitor group to be the primary respondent. The survey asks for some information that describes the entire visiting group (this page), along with some information from the primary respondent only (next page).
We acknowledge that no visitor can be reduced to a single demographic, and that the intersectional nature of identity and experience means that variation exists within each demographic group. We present each of these demographics to broadly understand patterns in who visits, while considering multiple characteristics together in the pages that follow.
GROUP DEMOGRAPHICS
n=24,761 (adults) | n=24,142 (children)
ADULT AGE AND GENDER BREAKDOWNS
n=24,758 (adults) | n=24,143 (children)
n=40,605 (age), n=38,806 (gender) CHILD
not to say Locals-only Out-of-towners only Mixed group
About half of all visitors perceive their entire group to be “local” to the museum’s area.
Visitors tend to report more women than men in their group, and equal proportions of boys and girls.
n=9,646 (gender)
INDIVIDUAL RESPONDENT DEMOGRAPHICS
MEMBERSHIP
n=24,864
19+81
EDUCATION
n=23,688
Less than college
College degree
Graduate degree
Prefer not to say
HOUSEHOLD INCOME
n=23,069
Under $25K
$25–49.9K
$50–74.9K
$75–99.9K
$100–149.9K
$150–199.9K
$200K+
Not say/Not sure
6+9+11+11+15+10+13+26
RACE/ETHNICITY
n=25,616
Asian/Asian Am.
Hispanic/Latino/a/x
Black/African Am. Am. Indian/Alaskan
Middle Eastern/N. African
Hawaiian/Pac. Isl.
Multiple races
Prefer not to say / Missing
Self-describe
15+77+2+7 21+39+36+3
This year, we added Middle Eastern or North African as a response option in anticipation of future U.S. Census changes.
RESIDENCE
n=24,991
U.S. International
96+4
LGBTQ+ IDENTIFICATION
n=22,796
Yes No
Not sure
Prefer not to say
TYPES OF VISITOR GROUPS
GROUP COMPOSITION
AVERAGE GROUP SIZE
n=15,524 | n=5,876
Avg. number of adults
Avg. number of children
Adult-only groups and groups with children are likely to experience museums differently, and we observe that survey respondents in these groups have slightly different demographic profiles.
Adults only (64% of total)
Groups with Children (36% of total)
EDUCATION
n=14,529 | n=8,272
Less than college
College degree
Graduate degree
Prefer not to say
VISIT HISTORY
| n=9,160
Avg. number of adults
Avg. number of children
First-time visitors report never having visited the museum before, and here we define “recent visitors” as those who have visited sometime within the last two years.
EDUCATION
First-time visitors (43% of total)
Recent visitors (40% of total)
| n=9,123
Less than college
College degree
Graduate degree
Prefer not to say
| n=8,049
|
Museum staff often think about characteristics that can be used to define visitor groups and understand the varied experiences they might have. We picked four types of visitors groups to explore in this report that we would expect to have different motivations, visitation behaviors, and perceptions of their visit. In this section, we introduce the groups that we will highlight in the following pages. While people in these visitor groups may overlap—for example, out-of-towners are also likely to be first time visitors—the categories are worth considering individually.
MEMBERSHIP
AVERAGE GROUP SIZE
n=3,641 | n=20,051
Avg. number of adults
Avg. number of children
Memberships signify stronger relationships with a museum, and are often viewed as a measure of visitor loyalty. We observe that those with and without memberships differ slightly in terms of their demographics and experiences.
GROUP LOCALITY
AVERAGE GROUP SIZE
n=8,046 | n=6,799
Avg.
Visitors self-identify their group as locals-only, out-of-towners-only, or a combination of both. Here, we look at non-members who are exclusively local or from out-of-town, while omitting groups that are mixed.
Members (15% of total)
Non-members (85% of total)
Locals (36% of total)
Out-of-towners (31% of total)
MOTIVATIONS
Visitors may have several reasons for deciding to come to a museum. On the COVES survey, they are able to select the two most important reasons for visiting that day, with response options randomized to prevent an order effect. Options differ for Science+ and Art museums, based on insights from research and professional experience. Art museum motivations are also topically grouped to reflect prior research into visitor behaviors.1
Only slightly more than half of respondents select two motivation responses (55% for Science+ visitors, 57% for Art visitors). Across both science+ and art museums, visitors most commonly indicate that they were motivated for social reasons, either to spend time together or for entertainment for their group. When we look more closely at the different types of visitor groups, we observe different patterns of motivations.
SCIENCE+ MOTIVATIONS (TOP 6)
n=9,465
To spend time together as a group or family
For fun/entertainment for group members
For an educational experience for group members
Something to do while visiting the area
For fun/entertainment for myself
For an educational experience for myself
44+30+17+16+16+11
Science+ Motivations given as options but chosen less frequently
• Something to do while visiting the area
• To support [Institution name]
• To relax or relieve stress
n=15,746
Social enjoyment
Learning & pursuing interests
Popularity
Relaxation & recuperation
Social learning
Social contacts
38+36+29+23+11+8
Social Enjoyment
ɠ To spend time together as a group/family
ɠ For fun/entertainment as a group Learning & Pursing Interests
ɠ To learn something new
ɠ To deepen my areas of interest
Popularity
ɠ Something to do while visiting the area
ɠ It was recommended to me by others
Relaxations & Recuperation
ɠ To relax
ɠ To find peace
Social Learning
ɠ To support my family/friends with their learning
ɠ To discover new things as a group
Social Contacts
ɠ To interact with others
ɠ To feel connected to my community
PATTERNS OF MOTIVATION BY GROUP TYPE
Adult-only groups are more likely to select personal motivations, suggesting they may be more likely to make decisions based on their own interests rather than their companions’ interests. Members and repeat visitors at science+ museums see the museum they visited as a place to gather with others. Whereas recent visitors to art museums are there to relax, and both members and non-members at art museums do not particularly prioritize social learning. Reputation appears to attract out-of-towners for both science+ and art museums.
GROUP COMPOSITION
SCIENCE+ For fun/entertainment for myself
n= 2,558 | n=5,936
MEMBERSHIP
SCIENCE+ For fun/entertainment for group members
n= 2,034 | n= 7,199
Learning & pursuing interests
n= 12,678 | n= 2,639
n=1,692 | n= 13,688
Something to do while visiting the area n= 3,117 | n= 2,326
3,142 | n= 3,729
n= 7,225 | n=5,655
n=5,159 | n=4,704
PATTERNS OF VISITATION
The COVES survey asks visitors what time they arrived at the museum, and we then calculate their length of stay using the exit survey’s timestamp. Stay time may be influenced by the types of experiences offered, size of the museum, visitor motivations, or other factors. We also ask visitors to tell us more about their visit history, including when they last visited and how frequently they visit.
STAY TIME
Median stay time was 1 hour, 43 minutes
DATE OF LAST VISIT
n=24,071
n=22,514 NUMBER OF VISITS IN THE LAST YEAR
Visitors who select “Never” are our “Firsttime visitors” segment.
PATTERNS OF VISITATION BY GROUP TYPE
Below, we share the median stay time for each group type, along with the percentage of each that are firsttime visitors. Groups with children tend to stay longer during museum visits and are more likely to be repeat visitors than their adult-only counterparts. While it is unsurprising that non-members are more likely to be first-time visitors than members, it is interesting to note that half of non-members have visited at least once before. More than half (59%) of recent visitors report having visited sometime in the last six months.
GROUP COMPOSITION
MEMBERSHIP
n=13,439 | n=7,929
Adults only
Groups with Children
Adults only
Groups with Children
VISIT HISTORY
n=9,226 | n=8,386
First-time visitors
Recent visitors
n=3,414 | n=18,646
Members Non-members Locals Out-of-towners
Members Non-members Locals Out-of-towners Stay time
GROUP LOCALITY
| n=7,025
OVERALL EXPERIENCE RATING (OER)
The Overall Experience Rating (OER) is a holistic measure of the quality of the experience. Because visitors tend to rate their experiences highly, “there is a need to identify a point above Excellent that will capture the responses of those who are not just satisfied and uncritical, but truly excited about their experience.” 2 When reporting, we tend to focus on percent “Outstanding” and “Excellent," while collapsing together “Poor,” “Fair,” and “Good” to “Less than Excellent” due to the small number of responses in these categories.
OVERALL EXPERIENCE RATING
n=25,438
OER “OUTSTANDING” PERCENTAGES
Each colored dot represents the percentage of visitors at one institution who rated their overall experience as Outstanding.
The aggregate rating is shown here in the dark gray circle.
QUESTION ASKED TO RESPONDENTS:
“Please rate your overall experience at [Institution Name] today.”
Options are:
Poor, Fair, Good, Excellent, and Outstanding
The observed 49% Outstanding rating and 90% collective “E+” (Excellent + Outstanding) ratings are remarkably high, and unprecedented for COVES; last year we reported 46% Outstanding. Early benchmarks for OER use in museums showed roughly 25% Outstanding and 50% Excellent, with the remaining 25% LTE— but these statistics largely summarized individual exhibitions rather than the entire museum experience.
It is important to highlight here that the aggregate data we share are influenced by the composition of our museum members, including the type and size of the institutions, which have been shown to correlate with visitors’ perceptions of the overall experience (see COVES FY24’s report as an example). Therefore, the trends we observe over time are better articulated for specific subgroups of museum participants, as simply showing the aggregate change over time may more accurately reflect our changing cohort of museums, rather than a changing perception of museum visitors’ experiences.
OER BY GROUP TYPE
When looking at Overall Experience Rating by group type, we see that there are not huge differences from the pattern described by the aggregate: roughly 50% Outstanding and a very high E+ across visitors. In fact, LTE does not exceed 10% for any group! Members and recent visitors have the highest proportion of Outstanding ratings (54% and 53%, respectively), indicating that those most loyal and most frequent to museums are also most impressed by the quality of experiences, which further reinforces the importance of ensuring high quality experiences to incentivize repeat visitation.
GROUP COMPOSITION
MEMBERSHIP
Groups with Children
n=8,591
Non-members
n=21,037
Out-of-towners
NET PROMOTER SCORE (NPS)
The Net Promoter Score (NPS) system was developed roughly 20 years ago by Bain & Company, with many big businesses like Apple and American Express as early adopters. It intends to measure an individual's willingness to recommend a company, place, or experience, and distills this information into a simplified “net score”. NPS is often associated with business loyalty, with higher scores implying more free advertising through word-of-mouth promotion.
QUESTION ASKED TO RESPONDENTS:
“On a scale from 0 to 10, how likely are you to recommend [Institution Name] to a friend or colleague?”
Net Promoter Score is calculated by subtracting the percentage of “Detractors” (ratings of 0-6) from the percentage of “Promoters” (ratings of 9-10).
The NPS scores in this report are shown on a dial representing a range of -100 to 100.
Conceptually, Net Promoter Score offers an intuitive measure of museum performance: higher scores indicate more positive visitor perceptions. Many people like the numeric score, which accounts for nuances in percentages across the three groups (Promoters, Passives, Detractors), while others find fault with the net score for omitting Passives in the calculation and the unbalanced rating category of Detractors (seven scale points, while Passive and Promoter each only have two). Remembering that plausible values can range from -100 (all Detractors) to +100 (all Promoters), what is considered “good” varies dramatically by industry. Some argue that anything above zero is acceptable, as Promoters outnumber Detractors, but scores above 50 are generally considered “excellent” and scores above 70 are thought to be “world class.” This year’s mark of 74.5 is notably higher than the NPS we reported in last year’s aggregate (71.0), but again, the composition of member organization is important to consider when evaluating the COVES benchmark. The following pages comparing visitors’ OER and NPS ratings should illuminate differences between the two.
NPS BY GROUP TYPE
For Net Promoter Scores, differences between group types follow similar patterns that are observed with Overall Experience Ratings: members and recent visitors have the highest scores across all segments, and local non-members rate their likelihood to recommend slightly higher than out-of-town non-members. Similar to OER, first-time visitors are the lowest of the group, and the only segment to score below 70. While this may feel problematic against a backdrop of impressively high scores elsewhere on the page, an NPS of nearly 69 is still quite high!
Adults only
n=15,407
Groups with Children
n=8,590
Members n=3,776
Non-members
n=21,029
First-time visitors
n=10,418
Recent visitors
n=9,474
n=8,336
Out-of-towners
n=7,067
OER AND NPS COMPARISON
Both OER and NPS are considered to be industry standard and highly regarded experience measures, but each has benefits and drawbacks. Although it is most common for visitors who respond positively to NPS to likewise respond positively to OER, there are cases when a visitor may have a positive experience but be unlikely to recommend the museum to others, or vice versa. The example quotes below illustrate what may be influencing these seemingly contradictory responses.
PROMOTER / GOOD
Visitors may have problems with a specific amenity or experience during their visit, but look past these temporary problems to recommend the institution to others.
QUOTES
"More seating in the rooms, definitely better (increased) parking”
“If we had known about reservations for the tours.”
“I couldn’t figure out to use the locks for the storage spaces”
“Signage to help guide to exhibitions”
“Temperature of the gallery, gets a bit stuffy and crowded”
DETRACTOR / EXCELLENT
Visitors may have a great visit but state that they would not recommend the experience to others because their social circles live far away or are not interested in the topic.
QUOTES
“Far away from our home”
“...my friends aren’t into art.”
“Would recommend only if someone asked me about the museum”
“Most of my friends and relatives live out of the area and are working…”
EXPERIENCE RATINGS
In addition to describing their experience holistically through OER and NPS, the COVES survey also asks respondents to rate their agreement with several statements about specific aspects of their visit. Staff helpfulness and amenities like restroom cleanliness and the experience with the museum gift shop continue to impress visitors, while the average rating for cafés/restaurants (when applicable) continues to lag behind others. However, all of these ratings are markedly high on our 0-10 agreement scale.
EXPERIENCE RATINGS
Average rating, scale from 0 to 10 where 10 is highest n varies
Staff member helpfulness
Restroom cleanliness
Educational experience
Gift shop experience
Value for cost
Entertainment experience
Exhibits in working order
Café/restaurant experience
GROUP COMPOSITION
Staff member helpfulness
Adults only
Groups with Children
Adult-only groups typically rate staff helpfulness more highly than group with children.
VISIT HISTORY
Gift shop experience
First-time visitors
MEMBERSHIP
Members tend to rate experiences higher than non-members, except the restrooms. This may be an area to pay attention to.
Restroom cleanliness Café/restaurant experience
Recent visitors Members Non-members
GROUP LOCALITY
Out-of-towners
SCIENCE+ AND ART COMPARED
In 2022, COVES officially began including art museums as members. This page highlights some key differences between the COVES Science+ and Art cohorts.
The starkest difference between museum types is in group composition, with art museums drawing a much higher proportion of adult-only visitor groups than science+ museums. Typical visitor ages differ as well, with children at science+ museums skewing younger than those visiting art museums. Differences extend to the museum experience as well: the median science+ museum visitor stays almost an hour longer than the median art museum visitor, and art museum visitors give higher ratings to museum amenities such as restrooms and the gift shop.
| n=13,564
SCIENCE+ AND ART COMPARISON TO CENSUS
Museums visitors come from all over, but every museum has a local community. Museums can use publicly available data to compare visitor demographics to surrounding communities to understand who is and is not visiting. Here we compare the COVES aggregate data to national data, but individual museums can use Census data to look at their own region or neighborhood.3
Compared to the national census, museum visitors are less likely to identify as Hispanic or Latino/a/x, Black or African American, and slightly less likely to have a disability. Museum visitors also skew toward higher incomes and education levels. While we do not expect museum visitor data from a non-random selection of museums to be representative of the US population, the trends below are suggestive of patterns to be investigated at the individual museum level.
FINAL THOUGHTS
In this, COVES’ fourth Fiscal Year Aggregate Report, we are reporting on more data than ever before: over 40,000 survey responses representing close to 120,000 visitors at 84 museums in 33 states. The data were all collected in the 12-month period spanning July 1, 2024 through June 30, 2025. The information we share here is one of the most comprehensive pictures of visitor experience data available to the cultural sector, and leverages methodologies in collection and reporting that we believe offer the most reliable and trustworthy data to help our field better understand who visits museums, why they come, what they see and do, and how they feel about their experiences.
What we see in our aggregate analyses strongly suggests that museums are collectively offering amazing experiences to those who choose to visit: 90% rate their overall experience as Excellent or Outstanding, and 79% are highly likely to recommend the museum to a friend or colleague (NPS Promoters). As we have observed in previous aggregate analyses, visitors continue to agree that many aspects of their visit are high quality, especially the helpfulness of staff members and the cleanliness of specific amenities like restrooms. However, some patterns in our data have persisted over the better part of the last decade and signal room for improvement. We continue to serve a disproportionately affluent segment of the larger population, reaching visitors who have higher levels of education and household income than non-visitors. Unsurprisingly, these more affluent visitors are subsequently more likely to be museum members, and we observe that membership—along with the locality of non-members, recent visitation, and having children in the group—affects various aspects of the experience. For COVES member museums and other institutions conducting their own visitor experience studies, it is important to continue using these visitor segments and other demographic characteristics for subgroup analyses to identify different patterns in visit experiences or behaviors.
Check out our reports from previous years! understandingvisitors.org/ articles
END NOTES
1. Phelan, S., Bauer, J., & Lewalter, D. (2017). Visit motivations: Development of a short scale for comparison across sites. Museum Management and Curatorship. doi: 10.1080/09647775.2017.1389617.
2. Pekarik, A.J., Schreiber, J.B., & Visscher, N. (2018). Overall Experience Rating – Measuring Visitor Response in Museums. Curator, 61(2), 535-365. https://doi.org/10.1111/cura.12256
3. Data used to compare visitors to national data were drawn from the following sources: Erickson, W., Lee, C., & von Schrader, S. (2025). Disability Statistics from the American Community Survey (ACS) Ithaca, NY: Cornell University Yang-Tan Institute (YTI). www.disabilitystatistics.org Jones, J. (2025). LGBTQ+ Identification in U.S. Rises to 9.3%. Gallup Poll Social Series. https://news.gallup.com/poll/656708/lgbtq-identification-rises.aspx.
U.S. Census Bureau (2023). American Community Survey 1-Year Estimates Data Profiles. U.S. Department of Commerce. https://data.census.gov/.
GET INVOLVED IN COVES
Join COVES to learn from your visitors and contribute to the robust aggregate data set that informs our field! If you are interested in this report, we know that you are interested in understanding visitors. And if you are interested in learning about your visitors and think that COVES is right for you, we want you to be involved. Currently, we have museums that engage their visitors in a variety of topics or experiences, including art museums, children’s museums, history museums, natural history museums, and science centers—and we hope to have even more types of cultural institutions involved. Don’t see your institution type represented? Talk to us—we’d love to figure out what that means for participation!

If you are interested in joining our collaboration or just want to learn more, please contact us at info@understandingvisitors.org, or visit our website at understandingvisitors.org.
Image credit: Columbia Museum of Art
Image Credit: Discovery Museum Jessica Cronin Photography
Image credit: Saint Louis Science Center
Image credit: Bell Museum
| Sarah Karnas
