INVESTIGATIVE REPORT
Analysis of Anomalous Voting Patterns in Wisconsin’s 2025 Supreme Court Election between Susan Crawford and Brad Schimel April 1, 2025 election for the Wisconsin State Supreme Court.
Prepared by: Peter Bernegger, June 2025
Data Analyzed by: Data Engineer Draza Smith, Data Analyst Peter Bernegger
Based Upon Findings by: Mathematician Ed Solomon, from other elections across the nation
I. Executive Summary
The math shows Susan Crawford obtained votes by using a computer program that took votes away from Brad Schimel and gave them to her instead, while keeping the total number of votes the same. This made it look like voters changed their minds, but they didn't. The report, although condensed, shows how.
II. Report
We investigated unusual voting patterns identified in Cast Vote Records (CVRs) from the Wisconsin 2025 Supreme Court election between conservative Brad Schimel and liberal Susan Crawford. Analyses indicate algorithmic manipulation consistent with a technique called the "Arapahoe Twist," involving sophisticated mathematical modeling to artificially engineer election outcomes.
III. Background: What is the Arapahoe Twist?
The Arapahoe Twist, identified by analysts @KingSolomon006 and @DrazaS, involves resorting votes among existing ballots based on partisan signals from other races, creating an appearance of voter shifts without altering total ballot counts. This method utilizes advanced mathematical modeling to assign ballots to predetermined outcome ratios rather than easily detectable direct vote swaps.
IV. Analysis Method
Cast Vote Records (“CVRs”) from 25 Wisconsin counties were analyzed (representing ~60% of the ballots cast), categorizing voters based on their choices in the State Superintendent race: Deborah Kinser voters classified as Republican-aligned and Jill Underly voters as Democrataligned. Acknowledging Kinser ran as an Independent. The state does not provide party affiliation in its historical voting data. The analysis tracked Schimel-to-Crawford vote ratios throughout ballot counting.
Page 1 of 5
V. Key Findings
Significant anomalies were identified:
1. Mirrored Vote Ratios: Republican-aligned and Democrat-aligned voter groups showed synchronized changes in their Schimel/Crawford vote ratios, indicating external coordination.
2. Anchoring Effect: Initial ballot counts favored Crawford. Although Schimel temporarily approached parity, the final ratio precisely reverted to early ballot ratios, suggesting predetermined outcomes.
VI. Charts Analysis
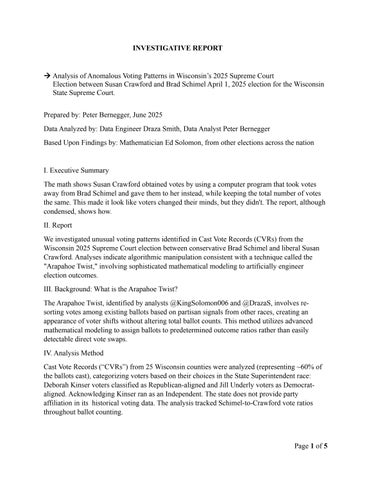
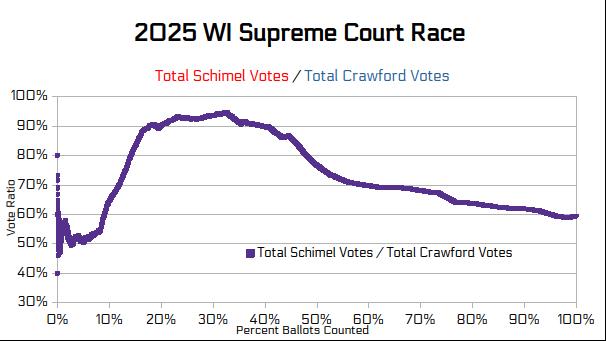
1. First chart – is only of Eau Claire County’s CVR’s of the April 1st race. You can see that once Shimel almost becomes equal, (1:1 ratio of votes), the cumulative ratio is just dragged back down to almost the exact ratio that was set by the first 10% of the votes counted. This is the cumulative ratio of all of those county’s voters over the course of the election. We divided the voters into implied Republican and implied Democrat, based on with State Superintendent vote, and we get this split. Schimel is hugely popular with those that also voted Kinser. The two had to be plotted on separate Y-axis because the ratio is so different. Nonetheless it shows they have the same shape through the progression of the election. When the Democrats are voting more Shimel, the Republicans are voting more Shimel.
This is the structure. It doesn't matter about the actual stance of Kisner (she ran as an Independent for State School Superintendent). It’s the opposition to the staunch Democrat Susan
Page 2 of 5
Crawford and the ratio that the election was planned against. This is a reversible mathematical feature we are finding in countless elections.
Second chart (Statewide Aggregate Vote Ratios, of CVR’s obtained): Early volatility settled quickly at approximately 0.9 (Schimel receiving roughly 90% of Crawford’s votes, but a low quantity). Ratios briefly increased but ultimately reverted exactly to initial levels, indicating artificial control. Despite political differences, both groups' vote ratios moved synchronously, suggesting unnatural, algorithm-driven assignment rather than genuine independent voter decisions. Second chart:
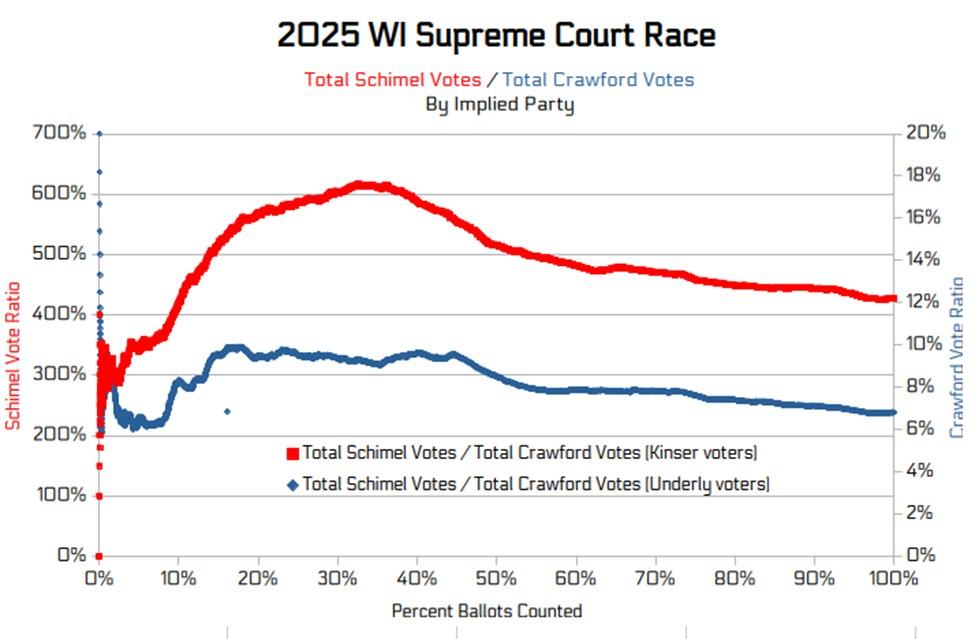
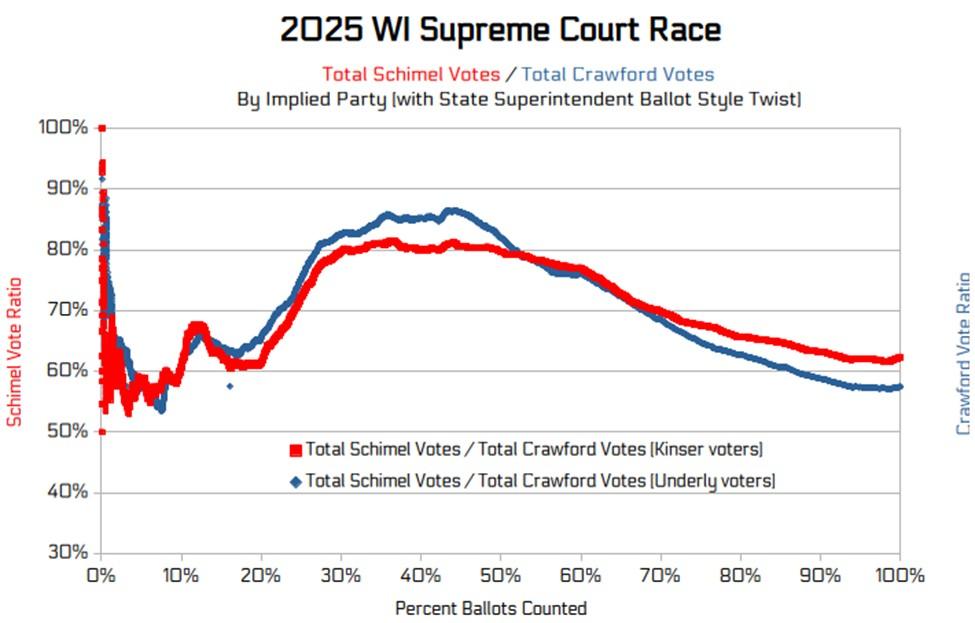
Third Chart - The "Twist" in Action
This chart shows continuous mirroring of vote ratios between opposing political groups throughout the ballot-counting process, reinforcing the evidence of artificial, predetermined vote assignments. When applying the Arapahoe Twist method to the State Superintendent votes, the Schimel and Crawford vote trends precisely align on the same scale, revealing how votes intended for the Republican candidate were systematically reassigned to the Democrat, creating a false appearance of Republicans switching sides, rather than adding extra Democrat ballots. Third chart:
Page 3 of 5
VII. Technical Explanation from Data Engineer Smith, who created a simulation model replicating these anomalies. The model features:
1) Initial Artificial Ballots: Introduction of substantial artificial mail-in ballots to fulfill predetermined vote distribution slots.
2) Mathematical Ballot Assignment: Systematic mathematical allocation of ballots based on partisan local distributions.
3) Weighted-Average Methodology: Employing techniques from nuclear physics calculations to precisely control vote outcomes.
4) The parallel movements observed between partisan groups are identified as mathematical artifacts naturally arising from this systematic ballot assignment method.
VIII. Statistical Validation by Data Analyst Bernegger:
Chi-Square Test: Produced a chi-square statistic of 1.70 with a p-value of 0.995, approximately 1890.70% higher than expected, indicating unnatural uniformity and coordination.
Kullback-Leibler Divergence: Resulted in a value of 0.00035, roughly 96.48% lower than expected natural election scenarios, suggesting minimal natural variability and strong evidence of manipulation.
Page 4 of 5
These two statistical tests confirm these findings. The evidence demonstrates systematic manipulation using advanced mathematical modeling to predetermine and artificially engineer election outcomes, not simply vote-switching post-election. The statistical outcomes show strong evidence that Smith’s CVR analysis is correct.
Conclusion
We believe Susan Crawford did not win the April 1st 2025 election. Ballots cast for Schimel were replaced with ones for Crawford. Where the Wisconsin’s 2025 Supreme Court election outcomes were artificially predetermined through sophisticated mathematical manipulation and artificially introduced mail-in ballots. Math, based on the counties’ own election data, backs up these statements. Immediate, detailed audits and full transparency of election data must be conducted to safeguard our elections and restore public trust.
Notes per Ballotpedia:
Brad Schimel obtained 1,062,330 votes or 44.9%
Susan Crawford obtained 1,301,137 votes or 55%
For the Wisconsin Supreme Court race held April 1, 2025
We strongly suggest reading the works of mathematician Ed Solomon on X, @KingSolomon006. Along with additional findings @DrazaS and @PeterBernegger Page 5 of 5