Chanting Mantras : A Timeless Antidote to Anxiety, Stress and Depression
Mental health concerns such as anxiety, stress, and depression have become pervasive in contemporary society, affecting individuals across age groups and socioeconomic strata. According to the World Health Organization, depression is a leading cause of disability worldwide, and the global prevalence of anxiety disorders continues to rise alarmingly¹. While pharmacological and psychotherapeutic interventions remain mainstays of management, there is increasing recognition of the role of complementary and integrative therapies in promoting psychological resilience. Among these, the practice of mantra chanting – a centuries-old spiritual tradition in India – has drawn growing scientific interest for its potential neuropsychological benefits.
Mantra as Medicine : The Ancient Science of Sound
The Sanskrit term “mantra” derives from “man” (mind) and “tra” (tool or instrument), implying an instrument to train or liberate the mind. Across Vedic, Buddhist, and other spiritual traditions, rhythmic repetition of sacred syllables or phrases is believed to harmonize mental and physical energies. In modern neuroscientific terms, chanting may modulate neural circuits involved in attention, emotion regulation, and self-referential processing².
Studies using functional Magnetic Resonance Imaging (fMRI) have shown that repetitive chanting reduces activity in the brain’s Default Mode Network (DMN) – a neural system linked to rumination and anxiety³. This aligns with the subjective sense of calm and focused awareness often reported during mantra practice.
Physiological and Psychological Benefits
Mantra chanting induces a parasympathetic response, slowing respiration, lowering heart rate, and stabilizing blood pressure4. The rhythmic breathing and auditoryvibrational feedback promote coherence between mind and body.
Clinical research supports these findings. Bernardi et al. demonstrated that the rhythmic recitation of the Ave Maria or Om Mani Padme Hum produced a consistent six breaths per minute pattern, leading to enhanced baroreflex sensitivity and autonomic balance5. Similarly, a randomized controlled trial by Bormann, et al found that veterans who practiced mantram repetition therapy experienced significant reductions in stress, anger, and depressive symptoms compared to controls 6
A 2020 study published in the Journal of Behavioral Medicine further reported that 15 minutes of daily Om chanting over four weeks led to reduced cortisol levels and improved mood scores among healthcare workers7. A recent systematic review and metaanalysis by Bormann and colleagues (2022) concluded that mantra-based meditation interventions are safe, cost-effective, and beneficial as adjunctive therapies for anxiety and depression8.
Integrating Chanting into Holistic Health Practice
Mantra chanting offers several advantages: it is noninvasive, inexpensive, culturally adaptable, and requires no special equipment. As a form of soundbased mindfulness, it can easily be incorporated into community health programs, workplace wellness initiatives, and medical education to promote stress resilience.
However, standardization remains a challenge. The choice of mantra, frequency, and duration of practice vary across studies, complicating comparison. More longitudinal research with physiological, biochemical, and neuroimaging markers is needed to establish robust causal evidence.
CONCLUSION
In the pursuit of modern mental well-being, we may be rediscovering what ancient traditions have long understood – that sound and rhythm can heal. Mantra chanting harmonizes the breath, stills the mind, and connects individuals to a sense of inner stability and peace. As evidence mounts, it is time that healthcare professionals and policymakers recognize chanting not merely as a ritual, but as a science of resonance with demonstrable therapeutic potential.
Integrating mantra-based interventions into preventive and promotive mental health strategies could serve as a bridge between ancient wisdom and contemporary neuroscience, helping restore balance in an increasingly turbulent world.
REFERENCES
1World Health Organization. Depression and Other Common Mental Disorders: Global Health Estimates. Geneva: WHO; 2017.
2Tomasino B, Fregona S, Skrap M, Fabbro F. Meditation-related activations are modulated by the practices needed to control the focus of attention. J Cogn Neurosci 2013; 25(5): 626-41.
3Brewer JA, Worhunsky PD, Gray JR, et al. Meditation experience is associated with differences in default mode network activity and connectivity. Proc Natl Acad Sci USA 2011; 108(50): 20254-9.
4Streeter CC, Gerbarg PL, Saper RB, Ciraulo DA, Brown RP — Effects of yoga on the autonomic nervous system, gammaaminobutyric-acid, and allostasis in epilepsy, depression, and post-traumatic stress disorder. Med Hypotheses 2012; 78(5): 571-9.
5Bernardi L, Sleight P, Bandinelli G, et al. Effect of rosary prayer and yoga mantras on autonomic cardiovascular rhythms: Comparative study. BMJ 2001; 323(7327): 1446-9.
6Bormann JE, Oman D, Kemppainen JK — Mantram repetition for stress management in veterans and employees: A randomized trial. J Altern Complement Med 2006; 12(8): 95160.
7Telles S, Singh N, Joshi M, Balkrishna A — Effects of chanting and breath awareness on anxiety and stress: A randomized controlled trial. J Behav Med 2020; 43(6): 1089-99.
8Bormann JE, Thorp SR, Wetherell JL — Mantram repetition: A review of its psychophysiological and clinical effects. Front Psychol 2022; 13: 826585.
Hony Editor, JIMA
Kakali Sen
Original Article
A
Stitch in Time Saves Nine : Lens induced Glaucoma in COVID Era
Anshuman Mahapatra1, Kumar Guru Mishra2, Kanhei Charan Tudu3
Abstract
Background : To determine the clinical profile of lens induced glaucoma, reasons for delayed presentation and outcome of management in COVID era.
Materials and Methods : It was a hospital based prospective observational study from May, 2020 to August, 2021. Patients with lens induced glaucoma were clinically examined, visual acuity and IOP were assessed preoperatively and postoperatively. Data for delayed presentation was collected using structured questionnaire and were analysed. Result : Out of 39 patients examined, 41.02% were males and 58.97% were females, the mean age of presentation was 64.1 years and mean IOP at presentation was 46.2 mm Hg. 64.1% patients had phacomorphic and 35.9% had phacolytic glaucoma. Major causes of delayed presentation were COVID-19 lockdown and good vision of fellow eye. Conclusion : This study shows lack of awareness among the patients and the need to educate them about the risks of lens induced glaucoma. Early intervention shows better visual outcome.
Key words : Lens induced Glaucoma, COVID-19, Delayed Presentation.
Vision is one of the most important special senses required for daily activities and all-round personality development. Nearly 2.2 billion people worldwide are visually impaired, of which at least half suffer from preventable causes which is yet to be addressed 1 . Amongst all diseases uncorrected refractive error and cataract are leading causes of visual impairment2. In India, cataract (66.2%) is the major cause of blindness in elderly population (age >50) 3 . India not only has a huge and diverse population to cater to but also many patients who do not have easy access to eye care services which has led to a large back log of cataract.
Lens Induced Glaucoma (LIG) was first described independently by Von Reuss and Gifford4,5. It is a form of secondary glaucoma in which the crystalline lens incites the rise of Intraocular Pressure (IOP). Its various presentations include phacolytic, phacomorphic, lens particle and phacoantigenic. Phacolytic glaucoma is often seen in patients with senile hypermature or Morgagnian cataract due to leakage of lenticular high molecular weight soluble
Department of Ophthalmology, Veer Surendra Sai Institute of Medical Sciences and Research (VIMSAR), Sambalpur, Odisha 768017
1MBBS, MS, Senior Resident
2MBBS, MD, Assistant Professor, Department of Community Medicine, Apollo Institute of Medical Sciences and Research, Hyderabad, Telangana 500090
3MBBS, MS, Associate Professor and Corresponding Author
Received on : 27/03/2023
Accepted on : 11/07/2024
Editor's Comment :
Early cataract surgery ensures good vision and IOP control in patients of lens induced glaucoma.
Delayed presentation—exacerbated in the COVID era—lead to poor outcomes. Patient education and timely intervention are the key to prevention.
proteins. On the other hand, phacomorphic glaucoma occurs in person with intumescent cataract due to iridolenticular apposition and thus pupillary block6. Cataract extraction is the definitive treatment which causes rapid resolution of symptoms7
COVID-19 brought strict rules, regulations and travel restrictions which adversely affected eyecare. Elective procedures were abandoned and emergency surgeries were only undertaken. Our institute in the western part of Odisha caters to 10 districts of the state which includes the underprivileged areas like the KBK (Kalahandi-Balangir-Koraput) Districts and neighbouring Districts of Chhattisgarh and Jharkhand. A sharp decline in footfall at the OPD was noted from 694480 in 2019-2020 to 328022 in 2020-2021. The impact was also seen in OT procedures which dropped from 12685 in 2019-2020 to 9335 in the COVID period 2020-20218
This study was done to determine the clinical profile, outcome of management and to know the reasons of delayed presentation in patients with lens induced glaucoma during the COVID pandemic. Though there
How to cite this article : A Stitch in Time Saves Nine : Lens induced Glaucoma in COVID Era. Mahapatra A, Mishra KG, Tudu KC. J Indian Med Assoc 2025; 123(10): 14-8.
123, No 10, October 2025Journal
are several studies evaluating treatment outcome in LIG but only a few have studied causes of late presentation. Out of them two studies have been done in India and two studies evaluating the same were done in Nepal9-12 . This study is our effort to find out the reasons of delayed presentation during the pandemic in western Odisha.
MATERIALS AND METHODS
This prospective study was conducted in the Department of Ophthalmology VIMSAR, Burla during the COVID pandemic from May, 2020 to August, 2021 after taking approval of institutional ethical committee. All patients attending the OPD were enquired for travel and contact history, COVID symptoms and were advised Rapid Antigen Test (RAT) on suspicion. Adequate precautions were taken by the examiners and each patient was educated about COVID-19 appropriate behaviour. In 39 patients presenting with pain, redness, watering and loss of vision were diagnosed as LIG based on clinical findings and raised IOP. Informed consent was obtained from all participants. The study included patients presenting with phacomorphic and phacolytic glaucoma. Patients with pain, redness, corneal edema, shallow anterior chamber, intumescent cataract and IOP more than 21 were classified as phacomorphic whereas those presenting with pain, corneal edema, normal or deep anterior chamber with white hypermature Morgagnian cataract and IOP more than 21 were called phacolytic glaucoma. Patients with history of surgery, laser procedures, trauma, complicated cataract, subluxation and dislocation of lens, known cases of glaucoma and vitreoretinal disorders were excluded in the study.
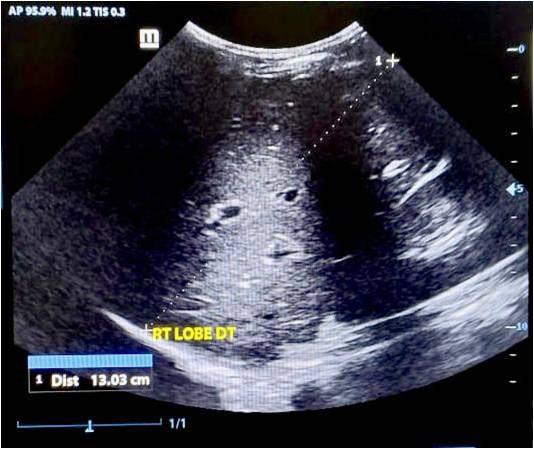
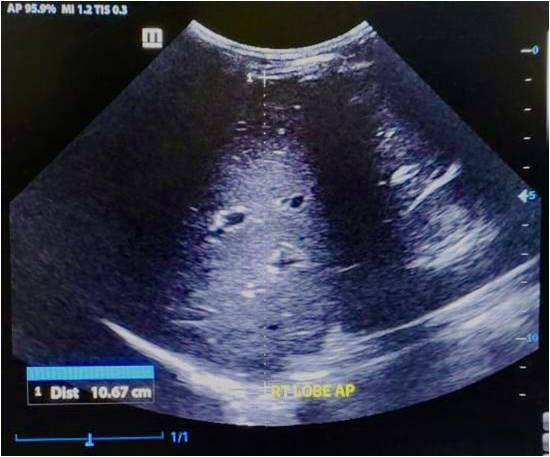
Detailed ophthalmic examination was done under slit lamp and gonioscopy was done with Goldmann two mirror gonioscopy lens. In order to rule out posterior segment pathology B scan was done in the affected eye. Ultrasound biomicroscopy was performed to image the anterior segment. Pre- and postoperative Best Corrected Visual Acuity (BCVA) were recorded using Snellens charts and E charts (for illiterate). IOP was recorded with Goldmann applanation tonometry and Schiotz tonometry wherever needed. Data regarding age, gender, income, distance from hospital, duration of symptoms and reasons for delayed presentation were collected with the help of a questionnaire. Socio economic status was assessed using Modified BG Prasad scale13
Medical management with oral acetazolamide 250mg, mannitol 20%, topical timolol maleate 0.5% and topical prednisolone eye drops was done to control IOP, uveal inflammation and pain relief. Parenteral ondansetron was given to patients with complaints of nausea. Acetazolamide was avoided in one patient who had sickle cell disease.
Nasopharyngeal swabs were taken for COVID-19 RTPCR test from all patients irrespective of signs and symptoms before their admission into Inpatient Department. After control of IOP all patients underwent manual small incision cataract surgery with posterior chamber IOL placement. Two patients who had inadequate capsular support with vitreous loss were planned for scleral fixated IOL. All the procedures were performed by a single well experienced surgeon to maintain uniformity of treatment standard.
All patients received topical antibiotic steroid combination (moxifloxacin 0.5% with prednisolone 1%) 6 times per day on tapering dose and a short acting cycloplegic (cyclopentolate 1%) for one week. All patients were examined on day 1, followed up day 7 and day 30. IOP was recorded on day 1, 7 and 30 and BCVA was assessed on day 30. BCVA at last follow up was graded as good [6/6-<6/18], useful [6/ 18-6/60] and poor [<6/60]. Fundus examination was performed with 90D lens. The data collected was analysed using SPSS software.
OBSERVATIONS AND RESULTS
39 patients were part of the study of which 23(58.79%) were female and 16(41.02%) male. Age of patients ranged from 45 to 86 years with a mean of 64.10 years and Standard Deviation (SD) of 9.34. Phacomorphic glaucoma was seen in 25(64.1%) and phacolytic glaucoma in 14(35.9%) eyes. According to Modified BG Prasad scale, 21(53.84%) patients belonged to class IV, 10(25.64%) to class III and only 1(2.56%) was from upper class
Day one revealed symptoms of pain, photophobia, headache, watering and lacrimation in all patients and nausea and vomiting in 27 patients.
Slit lamp showed signs of ciliary congestion and mid dilated pupil in all patients. Other signs were corneal edema (87.17%), shallow anterior chamber (64.1%) and iris atrophy (5.1%). On preoperative assessment of Visual Acuity (VA), 15(38.46%) had hand
Mahapatra A, et al. A Stitch in Time Saves Nine : Lens induced Glaucoma in COVID Era.
123, No 10, October 2025Journal
movement, 11(28.2%) had Perception of Light (PL) with accurate Projection of Rays (PR) in all quadrants, 6(15.38%) had PL with inaccurate PR and best VA recorded was 1/60. Mean IOP was 46.28 mmHg and SD of 12.94. 30(76.92%) were pseudophakic, 3(7.69%) had clear lens and 6(15.38%) had already developed cataractous changes in fellow eye.
All patients underwent manual small incision cataract surgery with Posterior Chamber Intraocular Lens (PCIOL) except 2 where scleral fixated IOL was placed due to inadequate capsular support.
On postoperative day one, the common complications were striate keratopathy 23(58.97%), post operative uveitis 18(46.15%), corneal edema 16(41.02%) and descemet membrane folds 9(23.07%). Statistically significant decline in IOP (p<0.01) was observed from pre and post procedure (Table 1).
Assessment of vision on day 30 revealed good grade VA in 16(41.02%), useful VA in 13(33.33%) and poor vision in 10(25.64%) patients. The relationship of BCVA on last follow up with duration of symptoms was found to be statistically significant (p<0.01)(Table 2).
The distance travelled by the patient was compared with the duration of symptoms and was found to be statistically significant (p<0.01)(Table 3).
On investigating the reasons of delayed presentation, COVID-19 was found to be most common followed by other non-COVID reasons (Table 4)
5(12.82%) patients with inadequate IOP control were prescribed antiglaucoma medications and rest 34(87.17%) remained drug free at the last day of
Table 1 — Comparison of IOP pre- and post procedure MeanSDSETp-value difference
Pre-op IOP versus Post-op IOP day 1-23.073.552.15-10.74<0.01*
Pre-op IOP versus Post-op IOP day 30-28.0810.341.65-16.96<0.01*
Pre-op IOP versus Post-op IOP Day 07-27.1610.531.68-16.10<0.01*
Table 2 — Binary Logistic Regression Analysis of Visual Acuity Grade and Duration of Symptoms
Table 3 — Binary Logistic Regression Analysis of Distance and Duration of symptoms
Duration of SymptomsChi-squarep-value
Distance <78 – 14> 14
< 100 kms27178279.39 <0.01 >100 kms120111
Table 4 — Reasons of delayed presentation COVID reasons
follow up. Amongst patients with poor grade VA the most common causes were optic atrophy and uveitis.
DISCUSSION
One amongst few and the first in eastern India to study the reasons of delayed presentation during COVID era this study was conducted in VIMSAR, Burla, Odisha. In our study on 39 patients the mean age was 64.10 years with a standard deviation of 9.34. The mean age of presentation in similar studies were 63 years (Sitoula, et al), 63.85 years (Ayub, et al), 61.5 years (Shrestha, et al ), 60.68 years (Sharanabasamma, et al), 68.84 years (Kothari, et al), 70.2 years (Yaakub, et al )9,10,11,14-16 Ayub, et al, Pradhan, et al, Rijal, et al, Prajna, et al, Sitoula, et al, Shrestha, et al and Patra, et al found female predominance similar to our study9,11,12,14,17-19 . This shows females are still the neglected gender.
In our study, Phacomorphic glaucoma (64.1%) was more common than phacolytic glaucoma (35.9%). Similar other studies like those of Pradhan, et al (72%), Shrestha, et al (71.7%), Rijal, et al (65%), Sitoula, et al (57.5%) and Jarwal, et al (64%) reported higher cases of phacomorphic glaucoma11,12,14,17,20 . In contrast, Sharanabasamma, et al and Ayub, et al had higher cases of phacolytic than phacomorphic glaucoma 15,9 . 30(76.92%) were pseudophakic in fellow eye in the present study. Similar findings were recorded by Ayub, et al (72.1%) and Sitoula, et al (57.5%)9,11. This explains why patients reported late as they had better vision in fellow eye.
We found a significant decrease in IOP after cataract
Vol 123, No 10, October 2025Journal
extraction with manual small incision cataract surgery. Pre-operative IOP was 46.28 ± 12.94 mmHg while postoperative IOP was 18.21 ± 3.93 mmHg. In the study by Pradhan, et al, IOP at presentation was more than 30 mm Hg in 79% eyes and IOP at discharge was 21 mm Hg or less in 80.7%12 . Shrestha. et al reported pre-operative IOP of more than 40 mmHg in all patients which after surgery reduced to a mean of 13.9 mmHg14 . Kothari, et al found mean IOP of 44 mmHg (pre-operative) and 30 mmHg (postoperative)10. Most of the patients had a preoperative IOP ranging between 30-39 mmHg preoperatively in a study by Patra, et al, while most were corrected to 10-19 mmHg postoperatively19 Similar to study by Ayub, et al and Kothari, et al the most common postoperative complication seen in our study was striate keratopathy and post operative uveitis9,10 .
We found significant association between final visual acuity and symptom duration where as many as 29(74.35%) patients had vision better than 6/60 at last follow up presented within 2 weeks. Poor visual outcome was achieved in patients who presented late (>14 days). Similar results were also found by Ayub, et al, Shrestha R, et al, Bhuyan, et al and Sujatha, et al 9,14,21,22 . This signifies the importance of early diagnosis and intervention in cases of LIG.
Our study being conducted in the COVID times, COVID was both directly and indirectly found to be the main reason for delayed presentation. We found patients avoided coming to hospital due to fear of getting infected with COVID. Most patients also cited the COVID-19 lockdown as a factor for delayed arrival. Among the non-COVID reasons, most common cause was better vision in the fellow eye. All others studies have assessed reasons other than COVID as the cause for late reporting. Ayub et al found good vision in the unaffected eye and no escort to hospital as the major reasons9. Sitoula, et al in a study in Nepal found lack of finances and distance to hospital as reasons of late presentation11. No escort and financial burden were the main reasons in the study by Pradhan, et al12 . Shrestha, et al in their study found that most patients were illiterate and belonged to low socioeconomic background 14. In addition to these reasons, Bhuyan, et al found distance from the medical centre to be an important factor21 . Kothari, et al reported poor health education, acceptance of poor vision as part of aging, fear of operation, lesser expectations and low socioeconomic status as the common reasons for delayed reporting10 . Patra, et al
stated socio-economical and gender based constraints as the causes of delayed reporting19
CONCLUSION
LIG often precipitates in elderly population with longstanding and untreated cataract. Amongst the affected, females are the more neglected gender. Timely intervention with cataract surgery in these patients helps control the IOP significantly and only few require further antiglaucoma medication. Despite having vision disabling cataract many patients arrived late for which they cited various reasons. Most of them avoided visiting hospital during the pandemic due to fear of infection, this may be due to ignorance among them regarding the segregation of COVID and nonCOVID patients. Suspension of public transport further impeded the access to healthcare for patients who had to travel long distance to reach hospital. Patients presenting early with less duration of symptoms had better visual outcome as compared to those who reported late (>14 days). Patients and general public should be educated about risks of LIG and its dreaded effect on vision. There is a lack of awareness in the community about various government sponsored eyecare benefits. As eye care providers the doctors after each cataract surgery should advise the patient to treat the fellow eye timely as good vision in one eye leads to negligence for cataract in affected eye. Early diagnosis and treatment of senile cataract would not only help decrease the cataract burden but also diminish the occurrence of LIG. However, the limitation of the study is its small sample size and lack of comparison between preCOVID and COVID data.
Financial Support and Sponsorship : Nil
Conflicts of interest : There are no conflicts of interest
7Epstein DL — Diagnosis and management of lens-induced glaucoma. Ophthalmology 1982; 89(3): 227-30. doi: 10.1016/ s0161-6420(82)34802-2. PMID: 7088506.
8http://www.vimsar.ac.in/vimsar-at-a-galance.php
9Ayub, Ruksana & Tom, Lisa & Venkatesh, Rengaraj & Kavitha, Srinivasan — Lens Induced Glaucoma: Outcomes and Reasons for Late Presentation- Prospective Study. Ophthalmology Glaucoma 2021; 4: 10.1016/j.ogla.2021.01.005.
10Kothari R, Tathe S, Gogri P, Bhandari A — Lens-Induced Glaucoma: The Need to Spread Awareness about Early Management of Cataract among Rural Population. ISRN Ophthalmol 2013; 581727. doi: 10.1155/2013/581727. PMID: 24555131; PMCID: PMC3910671.
11Sitoula RP, Sarkar I, Nayak D, Singh SK. Lens induced glaucoma: An experience in tertiary eye care center in eastern Nepal. Nepal J Ophthalmol 2016; 8: 161-6. [PubMed] [Google Scholar]
12Pradhan D, Hennig A, Kumar J, Foster A — A prospective study of 413 cases of lens-induced glaucoma in Nepal. Indian J Ophthalmol 2001; 49: 103-7
13Majhi MM, Bhatnagar N — Updated B.G Prasad’s classification for the year 2021: consideration for new base year 2016. J Family Med Prim Care 2021; 10(11): 4318-9. doi: 10.4103/ jfmpc.jfmpc_987_21. Epub 2021 Nov 29. PMID: 35136812; PMCID: PMC8797132.
14Shrestha R, Godar MS, Gurung S, Devkota P, Manandhar LD, Shrestha N — Lens induced glaucoma in a tertiary eye care centre in Western Nepal. Nepalese Journal of Ophthalmology 2019; 11(2): 145-51.
15Sharanabasamma M, Vaibhav K — Management and Visual Outcome in Patients of Lens-induced Glaucomas at a Tertiary Eye Care Hospital in South India. Journal of Current Glaucoma Practice 2016; 10(2): 68-75.
16Yaakub A, Abdullah N, Siti Raihan I, Ahmad Tajudin LS — Lens-induced glaucoma in a tertiary centre in northeast of Malaysia. Malays Fam Physician 2014; 9(2): 48-52.
17Rijal AP, Karki DB — Visual outcome and IOP control after cataract surgery in lens induced glaucomas. Kathmandu University Medical Journal 2006; 4(1): 30-3.
18Prajna NV, Ramakrishnan R, Krishnadas R, Manoharan N — Lens induced glaucomas—visual results and risk factors for final visual acuity. Indian J Ophthalmol 1996; 44: 149-55. [PubMed] [Google Scholar]
19Patra R, Mallireddy S — A Clinical Study on Lens Induced Glaucoma and Its Visual Outcome in Patients Visiting RIMS, Srikakulam. Journal of Evolution of Medical and Dental Sciences 2015; 4(59): 10294-300, DOI: 10.14260/jemds/2015/ 1483
20Jarwal PN — Clinical study of lens-induced glaucoma at community health center in India. TNOA J Ophthalmic Sci Res 2020; 58: 162-8
21Bhuyan J, Baishyakh P. A Clinical Study on the Incidence and Visual Outcome after Surgical Management of Lens-Induced Glaucoma. Galore International Journal of Health Sciences and Research 2021; 6(4): 42-53
22Sujatha R, Prashanth CN, Patil PK — Visual outcome and intraocular pressure control after cataract surgery in lens induced glaucoma. Journal of Evolution of Medical and Dental Sciences 2013; 2(26): 4763-77.
Mahapatra A, et al. A Stitch in Time Saves Nine : Lens induced Glaucoma in COVID Era.
Original Article
Clinical Profile and Risk Factors for Hyperbilirubinemia in Newborns — A Prospective Cohort Study
Background : Neonatal hyperbilirubinemia is a common and usually benign problem in neonates during the first week of life. Present study aimed to assess the clinical profile and risk factors for predicting the hyperbilirubinemia among the newborn infants.
Material and Method : The present prospective cohort study was conducted in the newborn unit of AVMC College. The newborn expired during first 24 hours of life, having life threatening malformation were excluded from the study. Cord blood of 4 ml was collected after the delivery of the newborn and in EDTA and plain tube. The samples were processed for bilirubin, hemoglobin and reticulocyte counts. The values were correlated with the sample drawn after 48 hours of birth to assess the changes and prediction of the newborn developing hyperbilirubinemia requiring phototherapy.
Results : Total of 142 newborns fulfilling inclusion criteria were included in the study. Among them 53.5% were females and 46.5% were males. At the cut off of 1.8mg/dl of cord blood bilirubin to predict the need for phototherapy, the study found sensitivity of 94.29%, specificity of 64.72%, NPV of 86.21% and PPV of 58.41 with overall accuracy of 64.08%.
Conclusion : There was a significant positive correlation of the cord blood parameters like serum bilirubin and reticulocyte count with later development of hyperbilirubinemia.
Key words : Hyperbilirubinemia, Phototherapy, Prediction, Birthweight, Newborn.
Jaundice is a common disorder that occurs in the newborn1-2 . Both physiological and pathological jaundice cause distress to parents 2. Jaundice is observed during the first week of life in approximately 60% of term and 80% of preterm infants. Lower gestational age, bilirubin level at phototherapy initiation and early termination of therapy are some of the risk factors for hyperbilirubinemia and readmission. Very few studies are available which looked at the problem of predicting the risk for hyperbilirubinemia3
This study aims to find the prevalence, risk factors for hyperbilirubinemia and the usefulness of cord blood bilirubin and reticulocyte count in predicting its occurrence among inborn neonates. Studying the usefulness of cord blood parameters and after 48hours of life for predicting hyperbilirubinemia will help taking early steps for reducing readmission rates and prevent complications of hyperbilirubinemia.
Department of Paediatrics, Aarupadai Veedu Medical College and Hospital, Tuticorin, Tamil Nadu 607403 1MD, Postgraduate Trainee and Corresponding Author 2MD, Professor
Received on : 27/05/2023
Accepted on : 13/11/2023
Editor's Comment :
Present study will contribute to predict the factors leading to rebound post phototherapy which help us manage babies with jaundice better.
It will help in taking necessary steps for preventing rebound hyperbilirubinemia in local population.
MATERIAL AND METHOD
This Prospective cohort studywas conducted after getting institutional ethical committee clearance from November, 2020 to August, 2022. This study included all inborn neonates. Neonates expired during first 24 hours of life and neonates presented with life threatening malformation were excluded. After delivery of the baby and clamping of umbilical cord, prior to expulsion of placenta cord blood sample about 4ml was collected in EDTA and plain tube. An automated analyzer was used for estimation of bilirubin, haemoglobin and reticulocyte count. Babies followed up for development of significant icterus. At 48 hours, venous blood sampling was done for serum bilirubin, reticulocyte count and haemoglobin.The level of cord blood and 48 hours of serum bilirubin, reticulocyte count and haemoglobin were correlated with development of neonatal jaundice.
How to cite this article : Clinical Profile and Risk Factors for Hyperbilirubinemia in Newborns — A Prospective Cohort Study. Panguraj A, Ballambattu VA, Mathivanan M. J Indian Med Assoc 2025; 123(10): 19-21.
RESULTS
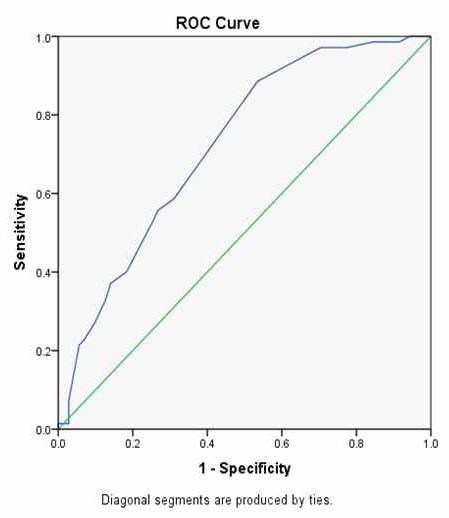
In present study, total of 142 neonates fulfilling inclusion criteria were included with 53.5% females and 46.5% males. Among neonates included in this study, 9.2% were preterm. Out of 142, 70 babies required phototherapy. Predominant blood groups among recruited mothers were B+ve -35.2%, O+ve31.7%, A+ve -25.4% respectively. Rh negative blood group was observed among 5.6% of mothers. Most of the preterm babies were late preterms and there was no significant increase among them for phototherapy requirement. Among the newborns 38% had O+ve, 35.2% B+ve and 12.7% A+ve blood groups (Table 1). Female babies required phototherapy significantly more often than male babies (p<0.01). Mode of delivery did not affect the requirement of phototherapy (Table 2). Correlation of cord blood bilirubin with after 48 hours venous blood bilirubin showed r value of 0.469*(Table 3). ROC curve drawn for cord blood bilirubin to predict requirement of phototherapy the Area Under Curve (AUC) of .723 showing significant association (Fig 1). There was a positive correlation between reticulocyte count and cord blood bilirubin of <0.03* and also with 48 hours venous blood bilirubin of <0.001*(Table 4).
DISCUSSION
Neonatal hyperbilirubinemia is a common and usually benign problem in neonates during the first week of
Table 3 — Correlation of cord blood bilirubin with after 48 hours venous bilirubin levels among newborn Venous Blood Bilirubin Total (mg/dL) after 48 hours
Cord blood Bilirubin Total (mg/dl)r0.469 Sig.0.001
Fig 1 — ROC analysis to determine the cut off and AUC to predict requirement of phototherapy
Table 4 — Correlation of cord blood bilirubin with reticulocyte count and correlation of after 48 hours venous blood bilirbin and reticulocyte count
life3. Most common cause of hyperbilirubinemia in neonates is physiological jaundice. About 97% of full term and preterm neonates demonstrate a biochemical hyperbilirubinemia (serum bilirubin >1mg/ dl) and about 65% appear clinically jaundiced [Total Serum Bilirubin (TSB)>5mg/dl].
Table 2 — Comparison of mode of delivery and gender of newborn with requirement of phototherapy
Most of the earlier studies showed ABO and Rh incompatibility, male sex, previous affected siblings10-11, gestational age less than 35 weeks, very low birth weight babies, polycythaemia, sepsis as risk factors12. G-6PD deficiency, rapid decline in TSB and shorter duration of phototherapy were some of the risk factors for rebound bilirubin reported by another study1-4 Breastfeeding and physiological jaundice were found to be protective factor for significant bilirubin toxicity13 . Present study aimed to assess the
Table 1 — Distribution of newborn blood group among the study subjects
123, No 10, October 2025Journal
clinical profile and risk factors for predicting the hyperbilirubinemia among the newborn infants. Total of 142 newborn’s fulfilling inclusion criteria were included in our study. By gestational age, 9.2% were preterm and 60.6% were delivered by LSCS. Garg, et al, documented marginal male predominance with 58% of infants7
Phototherapy was required among 49.3% of infants. In newborn, majority were with the O+ blood group (38%). The present study showed a significant association of the presence positive correlation of cord blood bilirubin with the venous blood bilirubin done later, showing the importance of the cord blood parameters in predicting later development of hyperbilirubinemia.
Kumar, et al , documented that neonate with Unconjugated Hyperbilirubinemia caused by haemolytic causes had considerably higher initial bilirubin levels and decreased Haemoglobinlevels at admission. Hemoglobin was considerably lower at 3 months, necessitating further transfusions. As a result, anaemia should be a major concern for such newborns not only upon admission but also during follow-up17. Thakkar, et al, documented that aberrant neurological findings on the seventh day of birth, when APGAR score of <6 at 10 minutes, and HIE grade II or above they were associated (p = 0.01).
In present study ROC curve was derived for the cord blood bilirubin to predict the requirement of phototherapy, it was found with Area Under Curve (AUC) of 0.723. At the cutoff level of 1.8mg/dl of cord blood bilirubin to predict the requirement of phototherapy, the study found sensitivity of 94.29%, specificity of 64.72%, NPV of 86.21% and PPV of 58.41 with overall accuracy of 64.08%.
CONCLUSION
Hyperbilirubinemia requiring phototherapy was detected in 49.3% of the newborns. There was a significant positive correlation of the cord blood parameters with the venous blood parameters estimated after 48 hours and positive correlation between cord blood bilirubin and reticulocyte count. There was no significant correlation between haemoglobin and bilirubin estimated after 24 hours of birth in predicting development of hyperbilirubinemia requiring phototherapy. This study had no neonates with exchange transfusion and there were not much preterm deliveries happened.
Compliance with Ethical Standards.
Funding : None
Conflict of Interest : None
REFERENCES
1Hamad IA, Chalabi DA — Rebound hyperbilirubinemia in a sample of newborns with jaundice. J Kurdistan Board Med Spec 2019; 5: 97.
2Elhawary IM, Abdel Ghany EAG, Aboelhamed WA, Ibrahim SGE — Incidence and risk factors of post-phototherapy neonatal rebound hyperbilirubinemia. World J Pediatr 2018; 14(4): 350-6.
3Houshmandi M mehdi, Goodarzi R, Hamedi Y, Khamesan B, Yousefi F — Comparison of Two phototherapy Methods for Reducing Bilirubin of Neonates: Continuous verss Intermittent. American Journal of life Science Researches 2015; 3: 260-5.
4Woodgate P, Jardine LA — Neonatal jaundice. BMJ Clin Evid 2015 May 22: 2015:0319.
5A. K. Comparison of continuous with intermittent phototherapy in the treatment of neonatal jaundice. J Postgrad Med Inst 2016; 30(2): 173-6.
6Boskabadi H, Maamouri G, Zadeh HM, Shakeri MT, GhayourMobarhan M, Mohammadi S, et al — Comparison of serum zinc level between neonates with jaundice and healthy neonates. Shiraz E Med J 2015; 16(10): 4.
7Chandrakant VA, Patil VS, Ingleshwar DG, Patil VP — Neonatal Hyperbilirubinemia- Evaluation of Total Calcium , Ionised Calcium , Magnesium, Lactate and Electrolytes. Natl jounal Lab Med 2017; 6: 1-6.
8Fevery J — Bilirubin in clinical practice: a review. Liver Int 2008; 28(5): 592-605.
9Burtis CA, Ashwood ER, Bruns DE (eds): Tietz Textbook of Clinical Chemistry and Molecular Diagnosis (5th edition): Elsevier, St. Louis, USA, 2012, 2238.
11Cohen RS, Wong RJ, Stevenson DK — Understanding neonatal jaundice: a perspective on causation. Pediatr Neonatol 2010; 51(3): 143-8.
12Bishop M, Fody E, Schoeff L — Clinical Chemistry - Techniques, Principles, Correlations. Techniques, Principles, Correlations. 2014; 8: 522.
13Singh SN, Tripathi S, Kumar M, Bhreguvanshi A, Chandra T — Serum bilirubin trend, hematological and clinical profile of late preterm and term neonates with unconjugated hyperbilirubinemia-A prospective observational study. Clinical Epidemiology and Global Health 2021; 10: 100680.
14Abbas H, ul Hassan S, Arif K, Zameer S, Ahmed N, Haq AA — Neonatal Hyperbilirubinemia: A Retrospective Study. Journal of Saidu Medical College Swat 2020; 10(1): 52-5. DOI:10.52206/jsmc.2020.10.1.281
15Rithanya S, Sheela D — A Treatment Profile of Neonatal Hyper-Bilirubinemia in a Tertiary Health Care Hospital. Biomedical and Pharmacology Journal 2019; 35(4): 1235-9.
16Kumar A, Shankar M — A Prospective Cohort Study to Evaluate the Early Indicator of Significant Hyperbilirubinemia in Healthy Full-term Infants at 72 hrs of Age 2022; 14(1): 437-44
17Kafle SP, Bhatta M, Shrestha R, Sitaula S, Koirala N, Koirala A — Outcome of Neonatal Hyperbilirubinemia from a Tertiary Care Hospital in Eastern Nepal: A Cross-sectional Study. Journal of BP Koirala Institute of Health Sciences 2021; 4(1): 37-42.
Panguraj A, et al. Clinical Profile and Risk Factors for Hyperbilirubinemia in Newborns — A Prospective Cohort Study.
Original Article
Isometric
Hand
Grip Exercise : Can It be Beneficial for Cardiovascular Health ?
Subhendu Bag1, Sangita Sen2
Abstract
Background : For individuals who are unable to perform conventional aerobic exercises, Isometric Handgrip (IHG) training may help maintain appropriate levels of capillary Blood Pressure (BP), Blood Glucose (CBG) and Heart Rate (HR). Evidence suggests that IHG exercise can support the regulation of cardiovascular parameters, challenging the common perception that it imposes undue strain on the heart. Thus, the goal of this research is to ascertain if static exercise improves or worsens the cardiovascular parameters mentioned above.
Aims and Objective : This study’s objective was to evaluate the immediate consequences of graded exercises for isometric handgrips on the systolic, diastolic blood pressure, capillary blood glucose levels, and heart rates in young, healthy individuals.
Materials and Methods : 82 healthy persons of both sexes, ages 18 to 25, participated in the current study. This study excludes participants with any type of hypertension, other cardiovascular co-morbidities, and conditions affecting the wrist joints or palmar surfaces. A single investigator measured capillary heart rate, blood sugar, and blood pressure, both diastolic and systolic, and muscle contractions at 30% Maximal Voluntary Contraction (MVC) under three conditions: at rest, immediately following a sham intervention, and one hour after the sham.
Result : It is shown that SBP, DBP are much higher after 30% MVC and after high load than they are during rest, although they are significantly lower in both sexes during post-sham. After an hour, there is no discernible difference in the sham state.
The 30% MVC and post-highload conditions cause an increase in heart rate, while the post-sham and one-hour postsham conditions do not cause a substantial drop in heart rate.
During the 30% MVC and post-high-load conditions, Capillary Blood Glucose (CBG) showed a non-significant increase, whereas in the one-hour post-sham condition, CBG decreased markedly
Conclusion: Isometric Handgrip (IHG) exercise plays a significant role in regulating blood pressure among young individuals with normal tension, yet it may have limited effects on controlling blood glucose levels and heart rate.
Key words : Heart Rate (HR), Capillary Blood Glucose (CBG), Isometric Hand Grip (IHG) exercise, both the Systolic and Diastolic Blood Pressures (DBP and SBP).
CEditor's Comment :
Isometric exercise is a simple low-cost and feasible intervention which can reduce Blood Pressure in borderline and mildly hypertensive patients. This exercise shows minimal effect on Heart rate and Blood Glucose but improves cardiovascular risk profile. This can be easily implemented in routine practice and even in patients with restricted mobility.
1MBBS, MD, Senior Resident, Department of Physiology, Midnapore Medical College and Hospital, Midnapore, West Bengal 721101 and Corresponding Author
2MD, PhD, Professor, Department of Physiology, Institute of Postgraduate Medical Education & Research, Kolkata, West Bengal 700071
Received on : 21/12/2021
Accepted on : 02/06/2022
ardiovascular illnesses are currently the world’s biggest worry. Aerobic activities are accepted as a tool for cardiovascular health lifestyle adjustment. However, because aerobic workouts require a specific time, location, and willingness to perform, many individuals in our busy environment do not embrace them. IHG Exercise is a very basic type of exercise that only takes minor changes to daily schedule and time.It has been demonstrated that this kind of exercise has beneficial effects on blood pressure regulation through the autonomic nervous system and can reduce arterial blood pressure at rest that is equally effective as traditional aerobic treatment. During isometric exercise, only a specific group of muscles remains contracted, unlike isotonic exercises causing blood arteries to constrict and less blood to reach the working muscles3. Several studies have
How to cite this article : Isometric Hand Grip Exercise : Can It be Beneficial for Cardiovascular Health ? Bag S, Sen S. J Indian Med Assoc 2025; 123(10): 22-6.
123, No 10, October 2025Journal
shown that Isometric Handgrip (IHG) exercises can decrease heart rate, Capillary Blood Glucose (CBG), and blood pressure parameters that typically rise after aerobic exercise due to sympathetic nervous system activation. IHG exercises may therefore help maintain normal blood pressure in individuals who are unable to perform isotonic activities. Although commonly thought to place excessive strain on the heart, evidence suggests that CBG, heart rate and blood pressure can all being safely lowered with IHG training. Therefore, this study sought to analyse the favourable and unfavourable effects of IHG exercises on both blood pressures (SBP & DBP), Heart Rate and Capillary Blood Glucose levels.
MATERIALS AND METHODS
For an interventional cross-sectional study, Between December, 2019 and July, 2021, 82 healthy undergraduate students were enrolled in the SSKM Hospital’s (IPGME&R), Physiology Department.
Heart Rate (HR), Capillary Blood Glucose (CBG), Both the Diastolic and Systolic Blood Pressures (DBP, SBP) were tracked at rest prior to the Isometric Handgrip (IHG) exercise. MVCs, or maximum voluntary contractions were then determined for each individual were recorded three times during the unilateral handgrip exercise, allowing a one-minute rest interval between each attempt, and the average of these values was calculated to determine the mean MVC.The study parameters were subsequently assessed using the Unilateral Handgrip Protocol, which involved four Participants performed 30% MVC isometric contractions for two minutes, separated by a one-minute rest period. At high load, which entails 8x2 minute contractions at 30% MVC, we measured the same data. Following a 4-by-2-minute contraction at 3% MVC (Sham), measurements were made. Finally, the same data were measured an hour after the workout. This protocol was adopted as the results of Alexander Skedd14, van Assche, et al13’s technique were statistically significant for lowering blood pressure.
Inclusion criteria :
(1) A blood pressure measurement <120/80 mm Hg is classified as normal.
(2) Both men and women
(3) Properly nourished
(4) Age range : 18-25 years
Exclusion Criteria :
(1) Any type of Hypertension
(2) Illnesses affecting the palm and wrist joints
(3) Any coexisting conditions that cause cardiovascular instability.
Prior to and following a graded isometric hand grip exercise, these parameters were noted for every participant.
A Microsoft Excel spreadsheet containing the gathered data was examined utilizing statistical evaluations using GraphPad Prism (v5.0) and SPSS (v27.0). Quantitative results were presented as percentages and frequencies, while mean ± SD was used to represent qualitative data. A one-way ANOVA was utilized for group comparisons, and statistical significance was defined as a p-value of less than 0.05.
RESULT & ANALYSIS
ANOVA-based intergroup statistical analysis for SBP is shown in Table 1.
In our study systolic blood pressure, or SBP, was discovered to be considerably higher following highload exercise and at 30% Maximum Voluntary Contraction (MVC) compared to pre-exercise values. Systolic Blood Pressure (SBP) increased significantly five minutes after exercise at 30% MVC, according to Ogbutor GU, et al 16 (2019). Similarly, during isometric handgrip exercise, mean Diastolic Blood Pressure (DBP) and SBP were considerably higher than baseline values, according to Karthikkeyan K, et al8 (2020). Our results are consistent with these observations.However, Locke BC, et al5 (2016) noted that, under both conventional and high-load conditions, mean arterial pressure, DBP and SBP decreased significantly over time, while remaining unchanged values showed no discernible variations between the high-load and ordinary groups in the sham condition.Since our results demonstrated higher SBP at both conventional 30% MVC and high-load conditions, they are inconsistent with Locke’s findings. Furthermore, in our study, both male and female participants showed significantly lower mean SBP immediately post-sham and an hour after the hoax as opposed to resting SBP, supporting the observations of Ogbutor GU, et al 16 (2019). Additionally, we noted a sharp increase in both SBP
Table 1 — Intergroup Statistical analysis by ANOVA for SBP
Dependent VariableComparison between Mean Difference ±SEMp-value Significance other groups
SBPResting SBP30% MVC-5.488* ± 1.1340.000 Highly Significant Post High load-5.098* ± 1.1340.000 Highly Significant Post SHAM2.976 ± 1.1340.068Not Significant 1 hour Post SHAM2.951 ± 1.1340.072Not Significant
and DBP within five minutes of exercise at 30% MVC; however, by ten minutes post-exercise, these values returned toward baseline, whereas post-sham and one-hour post-sham measurements exhibited a notable decline.
ANOVA-based intergroup statistical analysis for DBP is shown in Table 2.
The mean pre-exercise Diastolic Blood Pressure (DBP) in our study did not differ significantly in between men and women. Das SK, et al15 (2005) reported that women experienced a progressive rise in blood pressure, both diastolic and systolic compared to men, with the prevalence of hypertension varying according to age and sex. Although all participants in our study were normotensive, males did not exhibit a significantly higher resting DBP than females. In our findings, DBP dropped both immediately after the sham and an hour later whereas it is increased during 30% MVC and following highload exercise. Similarly, Ogbutor GU, et al16 (2019) reported significant increases in both SBP and DBP within five minutes of work out at 30% MVC; nevertheless, according to Karthikkeyan K, et al8 (2020), during isometric handgrip exercise, however, Karthikkeyan K, et al8 (2020) discovered that exercise at 30% MVC, SBP and DBP were considerably higher than baseline values. In contrast, Locke BC, et al5 (2016) reported significant drops in blood pressure over time, both systolic and diastolic, under both normal and high-load settings, which largely aligns using our results.
According to Locke BC, et al5 (2016), in the fictitious circumstance, DBP remained unchanged. The conventional and high-load circumstances did not differ much from one another. Our findings diverged
from his, as we observed that DBP was significantly lower in the post-sham and one-hour post-sham conditions, while it was elevated during conventional 30% MVC and high-load scenarios.
Ogbutor GU, et al16 (2019) reported results consistent with ours, demonstrating that Diastolic Blood Pressure (DBP) increased during the post-sham and 60-minute post-sham, but in the 30% MVC and post-high-load circumstances dropped and returned to baseline within 10 minutes.
Garg R, et al6 (2014) found after 10 weeks of exercise training, the resting blood pressure significantly decreased. Significant drops were seen in both diastolic and systolic blood pressure. However, our study is irrelevant to comment on this conclusion because we did not train our subjects before the IHG exercise.
Our observations can be explained by a number of explanations. Group IV (metaboreceptor) or C afferent fibers release more metabolites, such as lactic acid and adenosine, when skeletal muscle metabolitesensitive nerve terminals detect an increase in these compounds during exercise. This triggers a strong response that enhances sympathetic nerve activity, originating in the skeletal muscle and relayed through the spinal cord to the medullary cardiovascular control centers. Vasoconstriction brought on by this workout eventually raises blood pressure. This increase has been observed right after exercise.
Moreover, exercise training has been shown to enhance local endothelium-dependent vasodilatation in hypertensives on antihypertensive medications.
Vasodilation, which lowers blood pressure, may be primarily caused by endothelium-derived chemicals
Table 2 — Intergroup Statistical analysis by ANOVA for DBP
Dependent VariableComparison between Mean Difference ±SEMp-value Significance other groups
DBPResting State DBP30% MVC-3.829* ± 0.9620.001 Significant Post High load-4.390* ± 0.962 0.000Significant Post SHAM2.049 ± 0.9620.209Not Significant 1 hour Post SHAM1.976 ± 0.9620.242Not Significant Bag S, et
Table 3 — Intergroup Statistical analysis by ANOVA for HR
Dependent VariableComparison betweenMean Difference ± SEMp-value Significance other groups
HRResting State HR30% MVC-6.256* ± 1.331 0.000Significant Post High load-7.988* ± 1.331 0.000Significant Post SHAM0.110 ± 1.3311.000Not Significant 1 hour Post SHAM2.366 ± 1.3310.388Not Significant
Table 4 — Intergroup Statistical analysis by ANOVA for RBS
Dependent VariableComparison betweenMean Difference ± SEMp-value Significance other groups
RBSResting State RBS30% MVC-1.098 ± 2.2560.989Not Significant
Post High load-3.805 ± 2.2560.444Not Significant Post SHAM-7.183* ± 2.256 0.014Significant 1 hour Post SHAM6.768* ± 2.256 0.024Significant
that act as vasodilators both immediately after the sham and an hour later.
Nevertheless, the exact mechanism through which IHG exercise reduces blood pressure remains unclear.
ANOVA-based HR intergroup statistical analysis is shown in Table 3.
We found that, relative to exercise conditions, Heart Rate (HR) gradually declined during the post-sham and one-hour post-sham periods; however, these reductions were not statistically significant.When compared to resting settings, HR rises noticeably in both sexes during exercise conditions at 30% MVC and after high load.
According to Gandhi S, et al17 (2016) both at rest and after two minutes of IHG exercise, a notable drop in heart rate was noted. Following training, there was a considerable increase in heart rate recovery at 1 minute.
Although parasympathetic reactivation occurs after four weeks of isometric exercise training, the autonomic nervous system’s effect on the heart causes an increase in HR (Heart Rate) during exercise. Thus, parasympathetic activity causes an immediate vasodilatation that is followed by a decrease in arterial distending pressure. However, our investigation revealed that HR considerably increased under exercise circumstances and did not significantly drop under sham conditions and one hour later. Our study cannot remark on HR reduction because we did not conduct any pre-exercise training sessions and did not use any control group.
ANOVA-based statistical study of the RBS intergroup is shown in Table 4.
Within what as research, Random Blood Sugar (RBS) levels showed an increase during 30% MVC and after high-load exercise; however, this rise was not statistically significant when compared with resting RBS values.In contrast to one hour after resting state RBS or sham RBS, the continuing decline following activity condition is noteworthy.
Normal young individuals maintain a balance between the skeletal muscles’ (GLUT 4) and the liver’s (neurohumoral mechanism) glucose disposal, therefore a blood glucose drop during mild to moderate exercise is not to be expected. Only intense physical activity has the potential to cause moderate hypoglycemia. Thus, we similarly noticed an initial rise in blood glucose levels following IHG exercise.
The non-significant decrease we have seen here could be the result of muscle cells’ absorption of glucose via contraction-stimulated GLUT 4. According to Colberg, Sheri R, et al18 , the length and intensity of the workout, along with the participant’s nutritional health, affect how Isometric Handgrip (IHG) exercise affects insulin sensitivity and blood glucose levels. The current study’s findings may have been different because we had no control over the subjects’ diet.
CONCLUSION
IHG exercise gear is easy to use and lightweight. As a result, IHG exercise might be a good option for managing blood pressure in the short and long run. Although both the Systolic and Diastolic Blood Pressures (DBP and SBP) rise sharply during conventional and high-load conditions, both show a significant decline after 3% MVC (post-sham) and 1 hour post-sham in normotensive men and women. For individuals with borderline or moderate
Vol 123, No 10, October 2025Journal of the Indian Medical Association
hypertension, Isometric Handgrip (IHG) exercise especially when conducted under supervised training may represent as an successful lifestyle modification to lower blood pressure.
Therefore, supervised IHG exercise may serve as a feasible lifestyle intervention for borderline or moderately hypertensive patients. This simple protocol can be performed multiple times daily, even by bed-bound or less motivated individuals, and may facilitate acute blood pressure reduction while attenuating cardiovascular reactivity to stress.
However, the differences we discovered between HR and CBG are not statistically significant. Therefore, our study does not allow us to remark on sustaining HR and CBG.
We come to the conclusion that more research on the possible benefits of IHG exercise for hypertensive people is necessary.
Funding : None.
Conflict of Interest : None.
REFERENCES
1Guyton AC, Hall JE — Overview of the circulation: medical physics of pressure, flow and resistance. Textbook of medical physiology. 11th ed. Elsevier; 2008. p.166.
2Suganthi V, Anu S, Vijaybabu K — Evaluation of blood glucose levels in healthy young adults following a single bout of hand muscle exercise. J Evid Based Med Healthc 2015; 2(56): 8838-41. DOI: 10.18410/jebmh/2015/1239
3Ganong WF — Systemic circulatory changes to exercise. Review of Medical Physiology. 23rd ed. New York: McGraw Hill: Appleton Lange; 2003: 635-7.
4McGowan CL, Levy AS, Millar PJ, Guzman JC, Morillo CA, McCartney N, et al — Acute vascular responses to isometric handgrip exercise and effects of training in persons medicated for hypertension. Heart and Circulatory Physiology 2006; 29(4): 1797-802. [PubMed] [Google Scholar]
5Locke BC — Acute effects of isometric handgrip exercise on blood pressure and autonomic control (Doctoral dissertation, San Francisco State University) 2016.
6Garg R, Malhotra V, Kumar A, Dhar U, Tripathi Y — Effect of isometric handgrip exercise training on resting blood pressure in normal healthy adults. Journal of clinical and diagnostic research: JCDR 2014; 8(9): BC08.
7Gandhi S — Effect of isometric hand grip exercise training on cardiovascular and echocardiographic parameters among healthy young males. J Evid Based Med Healthc 2016; 3(1): 24-9.
8Karthikkeyan K, Gokulnathan V — Effects of Isometric Handgrip Exercise on Blood Pressure and its Role in Identifying Hypertensive Risk Individuals 2020.
9Silva IM, Leonardo Sobrinho MF, Ritti-Dias RM, Sobral BP, Pirauá AL, Oliveira LM, et al — Cardiovascular responses after isometric handgrip exercise at different intensities in healthy men. Journal of Physical Education 2019; 30.
10Champaneri VI, Kathrotia RG — Study of evaluation of hemodynamic response during isometric handgrip exercise in young adult males. National Journal of Physiology, Pharmacy and Pharmacology 2019; 9(6): 566-70.
11Millar PJ, MacDonald MJ, Bray SR, McCartney N — Isometric handgrip exercise improves acute neurocardiac regulation. European Journal of Applied Physiology 2009; 107(5): 50915.
12McGowan CL, Levy AS, Millar PJ, Guzman JC, Morillo CA, McCartney N, et al — Acute vascular responses to isometric handgrip exercise and effects of training in persons medicated for hypertension. American Journal of Physiology-Heart and Circulatory Physiology 2006; 291(4): H1797-802.
13vanAssche T, Buys R, de Jaeger M, Coeckelberghs E, Cornelissen VA — One single bout of low-intensity isometric handgrip exercise reduces blood pressure in healthy pre-and hypertensive individuals. The Journal of Sports Medicine and Physical Fitness 2016; 57(4): 469-75.
14Alexander skedd. Acute Effect Of Handgrip Exercise on Blood Pressure in Normotensive Young people: Can it evoke postexercise hypotension? Reseach Gate. Apr 2019.
15Das SK, Sanyal K, Basu A — Study of urban community survey in India: growing trend of high prevalence of hypertension in a developing country. International Journal of Medical Sciences 2005; 2(2): 70.
16Ogbutor GU, Nwangwa EK, Uyagu DD — Isometric handgrip exercise training attenuates blood pressure in prehypertensive subjects at 30% maximum voluntary contraction. Nigerian Journal of Clinical Practice 2019; 22(12): 1765.
17Gandhi S — Effect of isometric hand grip exercise training on cardiovascular and echocardiographic parameters among healthy young males. J Evid Based Med Healthc 2016; 3(1): 24-9.
18Colberg SR,Sigol RJ, Ferhall Bo — Exercise and Type 2 Diabetes mellitus. Diabetes Care 2010; 33(12): e147-67. doi: 10.2337/dc10-9990.
Original Article
Association of Coronary Artery Calcification with Aortic Calcification Detected on Thoracoabdominal Computed Tomography
Rajul Rastogi1, Amit Aggarwal2, Tanya Jain2, Lakshay Khajuria2, Vijai Pratap3
Abstract
Background : Mural calcification in arteries is a strong predictor of atherosclerosis. Hence, Coronary Artery Calcification (CAC) is a reflector of coronary artery disease which carries significant morbidity & mortality. In the era of modern medicine with multiple indications of Computed Tomography (CT) of thorax & abdomen, detection of aortic calcification (AoC), hence a reflector of atherosclerosis is seen frequently in routine studies. Hence, in this study we made an attempt to determine its association of AoC with CAC.
Material and Methods : This is a retrospective study performed on 797 patients fulfilling the inclusion & exclusion criteria following approval from Institutional Review Board. The patients were above 30 years with aortic (AoC) or coronary artery calcification on CT thorax and/or CT abdomen performed on 128-slice CT scanner. Patients with history of revascularization procedures & stent/grafts were excluded.
Results : In our study, males outnumbered females (62% versus 38%). AoC was commonest in 6th decade with mean age of 61.55±9.67 years. AoC has a significant association with CAC, 47/78 – 60% AoC patients had CAC. Though AoC in any part of aorta revealed statistically significant association with CAC but calcification in arch of aorta had the least association.
Conclusion : The results of our study on Indian population suggest a significant association of CAC and AoC, signifying active screening & intervention in patients detected with AoC detected on routine CT thorax & abdomen for other indications.
Key words : Aortic Calcification, Coronary Artery Calcification, Atherosclerosis
Mural calcification whether in coronary arteries or aorta is a strong predictor of subclinical atherosclerosis1. Both Coronary Artery Calcification (CAC) and Aortic Calcifications (AoC) especially thoracic AoC have been linked to significant cardiovascular morbidity & mortality, but CAC is a direct predictor of coronary artery disease1,2. In the era of modern medicine with multiple scans on Multislice Computed Tomography (CT) of thorax & abdomen, detection of CAC & AoC is common especially the latter. Due to the above facts, we planned to conduct this study with the following Aims & Objectives.
AIMS AND OBJECTIVES
Aim : To determine the association of CAC with AoC.
Department of Radiodiagnosis, Teerthanker Mahaveer Medical College & Research Centre, Moradabad, Uttar Pradesh 244001 1MD, Professor and Corresponding Author 2MBBS, Postgradute Resident 3MD, Professor
Received on : 10/12/2023
Accepted on : 26/12/2023
Editor's Comment :
Coronary artery calcification is the surrogate marker of coronary artery disease & atherosclerosis and has been used to predict the future risk of acute cardiovascular events. But coronary artery calcification calculation requires dedicated software with ECG-gated CT-Based protocol. However, routine CT thorax & abdomen are a common day-to-day examinations which may show calcification in the aortic wall representing atherosclerosis. Hence, the association of aortic calcification with coronary artery calcification may yield insights into coronary artery disease during routine CT thorax and abdominal imaging
Objectives of the Study :
(1) To determine the association of CAC with thoracic AoC.
(2) To determine the association of CAC with abdominal AoC.
(3) To determine the association of CAC with thoracic & abdominal AoC.
MATERIAL AND METHODS
This retrospective study included CT scans of 797
How to cite this article : Association of Coronary Artery Calcification with Aortic Calcification Detected on Thoracoabdominal Computed Tomography. Rastogi R, Aggarwal A, Jain T, Khajuria L, Pratap V. J Indian Med Assoc 2025; 123(10): 27-30.
123, No 10, October 2025Journal
patients performed in our institution. The data was collected following approval of Institutional Review Board (IRB). The CT scans were included in our study using the following strict criteria:
Inclusion criteria :
• Patients above age 30 years.
• Patient having AoC or CAC on CT thorax and/or CT abdomen.
Exclusion criteria :
• Patients with history of revascularization procedures in coronary arteries and aorta including stent/grafts.
OBSERVATIONS AND RESULTS
Table 1 shows that the majority of patients in our study were in 6th decade followed by 7th & 5th decades with small number in 4th decade. Also, males outnumbered females in our study with M:F ratio of 1.6:1.
Table 2 shows presence of aortic calcification in more than 72% of our study population. A significant number ie, 65.5% (379 of 579) of those with aortic calcification had both thoracic & abdominal aortic calcifications followed by those with calcification in arch of aorta (24.6% - 137 of 579). Fewer number of patients had calcifications only in abdominal aorta or descending thoracic aorta.
Table 3 shows that aortic calcification noted in our study population was either circumferential or spotty with significant number ie, 42.5% (246 of 579) had only spotty AoC while majority, 279 of 579 had both
Table 1 — Age and Gender Distribution in our Study
Table 2 — Distribution of Aortic Calcification in our Study Characteristic Frequency (n)Percentage (%) AorticAbsent
Table 3 — Distribution of Types of Aortic Calcification & Stenosis in our Study
Characteristic
(n)Percentage
spotty & circumferential calcification with fewer number ie, 54 of 579 showing only circumferential calcification. Half of the study population ie, 291 of 579 had some degree of aortic stenosis associated with mural calcification.
Table 4 shows that a significant number of patients ie, 44.7% in our study were detected with coronary artery calcification.
Table 5 shows that a significant number of patients with coronary artery calcification ie, 337 of 356 revealed aortic calcification while only 19 of 356 patients with CAC did not reveal AoC. However, a significant number, ie, 244 of 581 patients with AoC did not reveal signs of CAC. Statistical evaluation of the above data was significant with p value less than 0.001.
Table 6 shows the association of CAC with AoC in different parts of aorta. From the table, it is evident that CAC is strongly associated with AoC, both in
Table 4 — Distribution of Coronary Artery Calcification in our Study
Table 5 — Distribution of Coronary Artery Calcification in our Study
Aortic CalcificationCACTotalp value PresentAbsent Absent19197 216< 0.001 Present337244581 Total356441797
Table 6 — Association of CAC with AoC in our Study
Aortic Segment involvedCACTotalp value (AOA/Thoracic/Abdominal)PresentAbsent
No Calcification seen21197218
Only AOA4790137< 0.001
Only DSN Aorta513180.018
Only ASN Aorta000NA
Only ABD153045< 0.001
TH & ABD268111379< 0.001 Total356441797
thoracic and abdominal aorta. Though the association of CAC with isolated descending thoracic aortic calcification was statistically significant but the p value was higher being 0.018. No patient with isolated ascending aorta calcification was noted in our study group.
Table 7 shows that irrespective of the type of AoC, circumferential or spotty, CAC was significantly associated with it with p-value of less than 0.001.
Table 8 shows the sensitivity, specificity, Positive Predictive Value (PPV) and negative predictive value of AoC in predicting CAC. It is evident from the table that though the sensitivity of arch of aorta calcification in predicting CAC detecting is higher than any other part of aorta, but presence of both thoracic & abdominal aorta is 92.7% sensitive in predicting CAC. In contrast, the specificity is highest with descending thoracic aorta being 93.8%. Though the highest PPV of 70.7% was achieved with combined thoracic & abdominal AoC but the NPV of all parts of aorta is equal & higher ie, 90.4%. The overall accuracy of AoC for predicting CAC was with descending (DSN) AoC being 85.6% followed by abdominal AoC being 80.6% (Fig 1).
DISCUSSION
Though both coronary artery calcification as well as aortic calcification are independently associated with similar cardiovascular factors risk factors, their pathophysiology differs with differences in strength of association1-3. CAC & AoC are also associated with major cardiovascular events 1,4,5 . AoC has been described as a highly specific predictor of severe coronary atherosclerosis in the general population6
Type of calcification involvedCACTotalp value (Circumferential/Spotty)PresentAbsent No Calcification seen22198220< 0.001 Only CMF223254 CMF & SPT22354277 Only SPT89157246 Total356441797
Table 8 — Statistical Association of CAC with AoC in our Study
TestOnly AOAOnly DSN AortaOnly ABDTH & ABD Sensitivity69.119.241.792.7
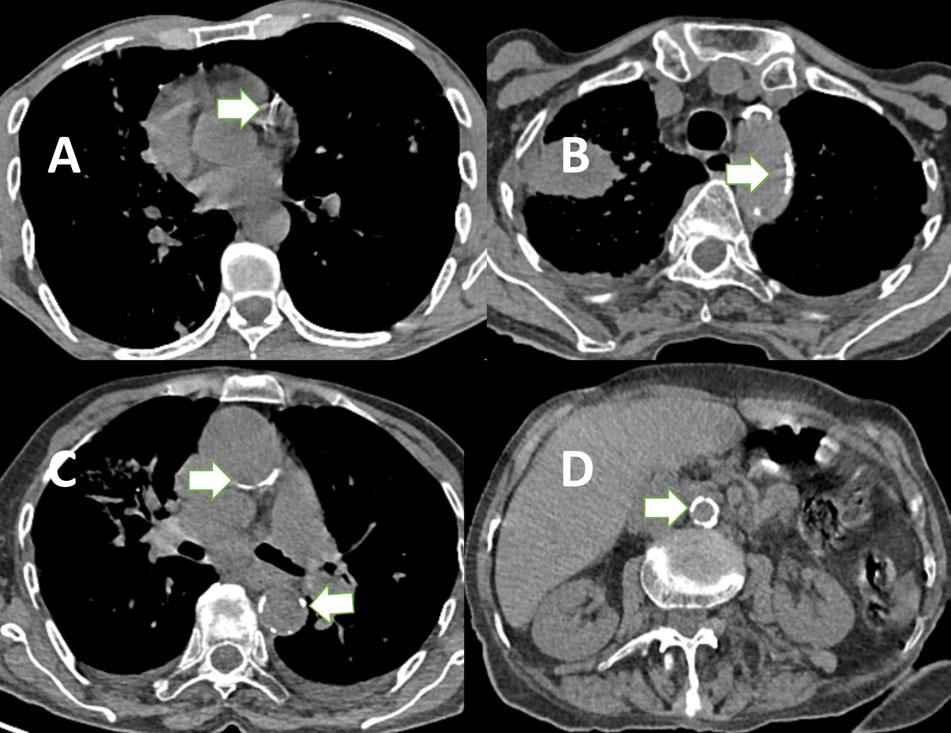
Fig 1(A-D) — Axial Noncontrast Computed Tomography (NCCT) Images of Thorax (A-C) and Abdomen (D) show Coronary Artery Calcification (A), Aortic Arch Calcification (B), Ascending & Descending Thoracic Aorta Calcification (C), & Abdominal Aorta Calcification (D) in different patients (arrows).
The risk of CAC associated with ascending AoC is higher than descending thoracic AoC1. As AoC occurs earlier and is more prevalent than CAC, some studies have advocated AoC as a better predictor of coronary artery atherosclerosis than CAC7,8. Absence of CAC is associated with excellent cardiovascular prognosis9 Our study showed a statistically significant association between CAC and AoC with sensitivity, specificity & accuracy reaching up to 92.7%, 93.8% & 85.6% respectively. The sensitivity was highest with combined thoracic & abdominal AoC with highest specificity & accuracy with descending thoracic AoC. The association of CAC with AoC is much higher in our study than studies conducted by Bannas P, et al & Kalsch H, et al showing 70% and 74.0% prevalence of CAC in patients with AoC which was similar to the accuracy of arch of aorta calcification in our study being 68.7%9,10
In contrast to Kalsch H, et al our study has shown descending AoC as a better predictor of CAC1. Also, abdominal AoC has shown results equivalent to descending AoC for predicting CAC in our study. These results may reflect demographic differences as well as poor representation of descending AoC in our study.
Strengths of Our Study
All the previous studies have included dedicated computed tomography of coronary arteries or electron bean computed tomography with calcium scoring done for cardiac indications. In contrast, our study
Rastogi R, et al. Association of Coronary Artery Calcification with Aortic Calcification Detected on Thoracoabdominal CT.
Table 7 — Association of CAC with AoC in our Study
123, No 10, October 2025Journal of
has utilized the data from routine CT thorax and abdomen done for variety of clinical indications. Hence, our study is a better predictor of prevalence as well as extends the utility of routine CT examinations for predicting coronary artery disease. Our study is unique in including the abdominal AoC as a parameter to predict CAC as none of the studies in existing medical literature has done so to the best of our knowledge.
Limitations of the Study
All patients included in our study did not have CT thorax and abdomen. Patients with only CT thorax or CT abdomen were also included in our study.
Though coronary artery calcification is marker of coronary artery disease, our study did not include the degree & length of stenosis and the coronary artery involved.
Our study is a retrospective study.
CONCLUSIONS
AoC is noted in more than two-thirds of patients undergoing routine CT thorax and abdomen while CAC in nearly half of patients undergoing these examinations.
AoC is commonest in arch of aorta followed by abdominal aorta probably due to combination effect of turbulent flow secondary to directional change in blood flow from ascending to descending thoracic aorta as well as atherosclerotic changes.
AoC is commonly spotty but coexistent circumferential calcification is equally seen. AoC associated stenosis is noted in more than one-third of patients.
Statistically strong significant association exists between CAC & AoC including all parts of aorta, strongest with descending thoracic aorta followed by abdominal aorta as it predominantly secondary to atherosclerotic changes in presence of laminar blood flow due to straight course of the aorta in these segments.
Descending thoracic followed by abdominal AoC are strong predictors of CAC in the study.
SUMMARY
Significant association of CAC and AoC exists including thoracic as well as abdominal, signifying
active screening & intervention in patients detected with AoC on routine CT thorax & abdomen for other indications. This will help in predicting as well as reducing the associated morbidity & mortality related to cardiovascular diseases by early detection and management.
Funding : None
Conflict of Interest : None
REFERENCES
1Kalsch H, Lehmann N, Moebus S, Hoffman B, Stang A, Jockel KH, et al — Aortic Calcification Onset and Progression: Association with the Development of Coronary Atherosclerosis. J Am Heart Assoc 2017; 6: e005093.
2Kimani C, Kadota A, Miura K, Fujiyoshi A, Zaid M, Kadowaki S, et al — SESSA Research Group. Differences Between Coronary Artery Calcification and Aortic Artery Calcification in Relation to Cardiovascular Disease Risk Factors in Japanese Men. J Atheroscler Thromb 2019; 26(5): 452-64.
3Post W, Bielak LF, Ryan KA, Cheng YC, Shen H, Rumberger JA, et al — Determinants of Coronary Artery and Aortic Calcification in the Old Order Amish. Circulation 2007; 115: 71724.
4Okada H, Tada H, Hayashi K, Kawashima H, Takata T, Sakata K, et al — Aortic Root Calcification Score as an Independent Factor for Predicting Major Adverse Cardiac Events in Familial Hypercholesterolemia. J Atheroscler Thromb 2018; 25: 63442.
5Takamura K, Fujimoto S, Kondo T, Hiki M, Kawaguchi Y, Kato E, et al — Incremental Prognostic Value of Coronary Computed Tomography Angiography: High-Risk Plaque Characteristics in Asymptomatic Patients. J Atheroscler Thromb 2017; 24: 1174-85.
6Nicoll R, Henein MY — The predictive value of arterial and valvular calcification for mortality and cardiovascular events. Int J Cardiol Heart Vessel 2014; 3: 1-5.
7Criqui MH, Denenberg JO, McClelland RL, Allison MA, Ix JH, Guerci A, et al — Abdominal aortic calcium, coronary artery calcium, and cardiovascular morbidity and mortality in the Multi-Ethnic Study of Atherosclerosis. Arterioscler Thromb Vasc Biol 2014; 34: 1574-9.
8Blaha M, Budoff MJ, Shaw LJ, Khosa F, Rumberger JA, Berman D, et al — Absence of coronary artery calcification and all-cause mortality. JACC Cardiovasc Imaging 2009; 2: 692-700.
9Kalsch H, Lehmann N, Mohlenkamp S, Hammer C, Mahabadi AA, Moebus S, et al — Investigator Group of the Heinz Nixdorf Recall Study. Prevalence of thoracic aortic calcification and its relationship to cardiovascular risk factors and coronary calcification in an unselected population-based cohort: the Heinz Nixdorf Recall Study. Int J Cardiovasc Imaging 2013; 29(1): 207-16.
10Bannas P, Jung C, Blanke P — Severe aortic arch calcification depicted on chest radiography strongly suggests coronary artery calcification. European Radiology 2013; 23(10): 2652-7.
Original Article
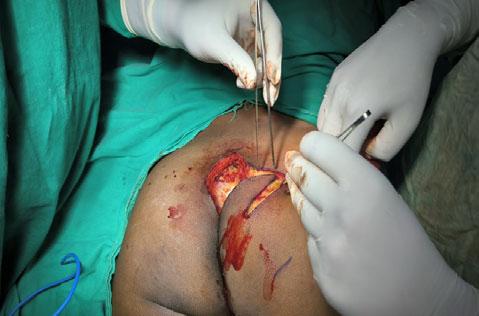
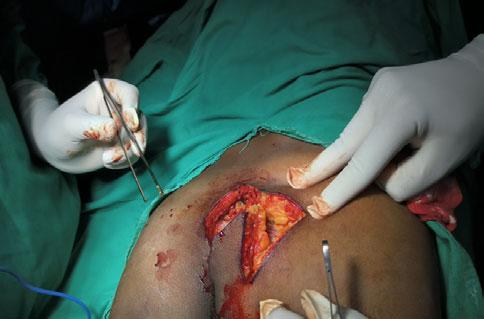
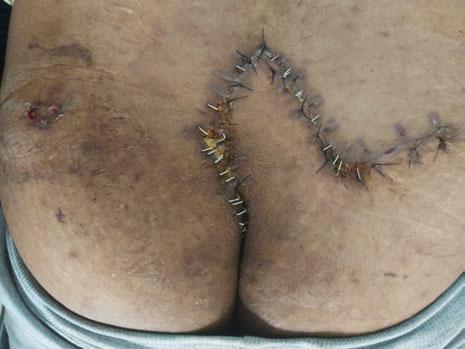
A Study on the Clinical Spectrum and Management of Pseudopancreatic Cyst in a Tertiary Care Hospital
Aman Kumar Singh1, Bhaswati Bharadwaj2, David Pegu3, Dilip Kiling3
Abstract
Background : Pancreatic pseudocyst is a localized collection of pancreatic secretions surrounded by fibrous tissue, commonly arising after acute or chronic pancreatitis, trauma, or ductal obstruction. It often presents with abdominal pain, lump, or gastrointestinal symptoms. Advances in imaging and drainage techniques have improved diagnosis and management outcomes.
Materials and Methods : This prospective hospital-based study was conducted in the Department of General Surgery, Assam Medical College and Hospital, from January to August 2022. Twenty-five patients diagnosed clinically and radiologically with pancreatic pseudocyst were enrolled. Data on demographics, clinical presentation, etiology, imaging findings, management, and outcomes were collected and analyzed using SPSS v20. Patients were followed up for four months.
Results : Most patients were males (88%) with a mean age of 44.8 years. Alcohol was the predominant etiological factor (72%), and pain abdomen was the universal symptom (100%). Imaging with ultrasonography and CECT abdomen aided diagnosis. Internal drainage was the most common management (40%), followed by external drainage (32%) and conservative treatment (28%). Infection (24%) was the main complication. Recurrence was highest after conservative management.
Discussion : Pancreatic pseudocyst commonly affects middle-aged males with alcohol-induced pancreatitis. Early diagnosis and individualized treatment—particularly internal drainage—offer excellent outcomes and minimal recurrence.
Hidden by its retroperitoneal location, the pancreas has in the past been a somewhat mysterious organ. It is one of the most unforgiving organs in the human body, hence most surgeons avoid palpating it until absolutely essential. The development of noninvasive imaging techniques have led to a much better understanding of pancreatic diseases and pathologies1
Pseudo-pancreatic cyst, commonly known as pseudocyst of pancreas or pancreatic pseudocyst, is a localised collection of pancreatic secretions, surrounded by a wall of fibrous or granulation tissue that arises as a result of acute or chronic pancreatitis, pancreatic trauma or obstruction of the pancreatic duct by a neoplasm2
Pseudo pancreatic cyst was originally described by Morgagni in 1761. The first drainage procedure was undertaken by Gussenbauer in 1883, who marsupialized a pseudocyst to provide external drainage. Transgastric pseudocystogastrostomy was
1MBBS, MS, Senior Resident, Department of Neurosurgery, All India Institute of Medical Sciences, Patna, Bihar 801507
2MBBS, MS, Senior Resident, Department of Paediatric Surgery, Pt B D Sharma PGIMS, Rohtak, Haryana 124001 and Corresponding
Author
3MBBS, MS, Associate Professor, Department of General Surgery, Assam Medical College and Hospital, Dibrugarh, Assam 786002
Received on : 04/03/2023
Accepted on : 25/07/2024
Editor's Comment : Pancreatic pseudocyst commonly arises after acute or chronic pancreatitis, particularly in middle-aged males with a history of alcohol use. Diagnosis requires strong clinical suspicion supported by imaging like CECT for confirmation and treatment planning. Internal drainage offers the best outcomes with minimal recurrence, while prevention through alcohol-reduction awareness and early intervention reduces disease burden.
described in 1921 by Rudolf Jedlicka & Koning in 1946 first performed roux-en-y cystojejunostomy3
Investigations to define extent and characteristics of pseudocyst include USG abdomen, CECT abdomen, and MRI abdomen. ERCP is indicated to differentiate mechanical bile duct obstruction due to pseudocyst from stricture of bile duct. Angiography is indicated to detect vascular obstruction2
Treatment options include conservative management, external drainage (open or percutaneous, internal drainage (open, laparoscopic, endoscopic), pancreatic resection2.
AIMS AND OBJECTIVES
To find out the spectrum of clinical presentations and the various modes of management of pseudopancreatic cyst.
How to cite this article : A Study on the Clinical Spectrum and Management of Pseudopancreatic Cyst in a Tertiary Care Hospital. Singh AK, Bharadwaj B, Pegu D, Kiling D.. J Indian Med Assoc 2025; 123(10): 31-3.
123, No 10, October 2025Journal
MATERIALS AND METHODS
Place of Study : Department of General Surgery, Assam Medical College and Hospital.
Duration of Study : January, 2022 to August, 2022.
Type of Study : Hospital based prospective study.
Study Population : All patients diagnosed with clinically with pancreatic pseudocyst and confirmed by radiological investigation were included in study.
Sample size : 25
Selection of Case : All patients who fulfilled the inclusion criteria & exclusion criteria were enrolled after pancreatic pseudocyst was diagnosed clinically and confirmed by radiological investigation. Demographic data was collected including the age and sex of the patient, as well as etiology of pancreatitis. All patients were further evaluated, necessary investigation were done. They were offered individualized treatment and were followed for 4 months.
Inclusion Criteria :
(a) Patients aged 18 years and above. (b) All patients diagnosed with clinically with pancreatic pseudocyst and confirmed radiological investigations were included in study.
Exclusion Criteria :
(a) Acute fluid collections in acute pancreatitis. (b) All the true cyst of pancreas. (c) Neoplastic cystic swelling of pancreas. (d) Hydatid cyst of pancreas. (e) Congenital cysts of pancreas. (f) Patients who did not give consent to participate in study.
Statistical Analysis :
All relevant data was collected, sorted, categorised and analyzed with standard statistical tools using SPSS (Statistical Package for the Social Sciences) software (Version 20, SPSS Inc, Chicago, IL, USA).
RESULTS
In our study, total of 25 cases were taken who attended our institute OPD and emergency Department during the study period.
In our study population, pseudocyst was common in age 31-50 years of age group (68%) with mean age of 44.8 years with most of the patients were male (88%) with M:F ratio was 7:1, which is may be due to increased alcohol intake seen in males.
Most of patients suffered from pain abdomen (100%)
followed by lump abdomen (80%) in our study with abdominal distension was seen in 18 patients (72%) along with nausea and vomiting in 11 patients (44%).
Weight loss and fever was seen in 9 patients each (36%) and least common symptom was jaundice seen in 2 patients (8%).
Most of the patients in our study belonged to socioeconomic class 5 (56%) followed by class 4 and 3 (28% and 16%) respectively.
The most common causative factor in our study was alcohol (72%), followed by biliary disease (16%), trauma (8%) and idiopathic (4%) and most of the patients had acute pancreatitis (58%), followed by chronic pancreatitis (32%) and acute on chronic pancreatitis (10%).
Alcohol intake was maximum seen in male (91%) while only 66% in female.
Ultrasound was the first imaging modality in our study for confirmation of the diagnosis and done successfully in almost all cases. CECT was subsequently done for better delineation of anatomy, location and characteristic of pseudocyst. Upper Gastro-intestinal (UGI) endoscopy was done to assess the degree of compression of stomach.
In our study, most common complication in pseudocyst was infection (24%) followed by ascites (4%).
Most of the patients were managed by internal drainage (40%), followed by external drainage (32%) and conservatively (28%). Of those patients who underwent internal drainage, most of them had cystogastrostomy (90%), cystojejunostomy (10%) sometimes (Tables 1& 2, Figs 1 & 2).
DISCUSSION
In our present study, mean age was 44.8 years with male preponderance (88%) which was comparable to study done by V Usatoff, et al4 and Zdanyte E, et al5. Pain is the most common symptom seen in all patients (100%) with similar findings by V Usatoff, et al4 and Zdanyte E, et al5, followed by lump in abdomen (80%) also suggested by V Usatoff, et al4
Most of the patients belonged to low socio-economic status working as daily wages workers having moderate to severe alcohol addiction.
In most patients causative factor of pseudocyst due to pancreatitis was alcohol intake followed by biliary disease, trauma and idiopathic. Similar findings were
Table 1 — Findings of Clinical Examination
ParametersFrequency
SiteEpigastrium22
Others (extending away from epigastrium)3
Size< 6 cm3
6-10 cm8
> 10 cm14
ConsistencyCystic25
Others0
Table 2 — Findings of Radiological Examination
ParametersFrequency Number122
> 13
LocationHead & Neck8
Body & Tail17
Size< 6 cm3
6-10 cm8
> 10 cm14
Wall< 6 mm8
Thickness6-10 mm10
> 10 mm7
noted by D B Adams, et al6 in his study. Thus most of the patients had episode of acute pancreatitis (58%) followed by chronic pancreatitis (32%). Similar findings were noted by RW Parks, et al7 .
In our study, patients were examined clinically and radiologically with both having comparable findings thus clinical acumen is paramount in pseudocyst diagnosis with radiological investigation like CECT abdomen confirms and supports the diagnosis and management.
Most common complication was infection (24%), which is higher compared to V Usatoff, et al 4 (8%), possibly due to poor nutrition, negligence, heavy alcohol consumption as well as delayed contact to health centre.
Most patients underwent internal drainage (40%), followed by external drainage (32%) and conservative (28%) comparable to Cheruvu, et al 8
On follow up of patients afterwards, recurrence rate in conservative management was 28.57% (Kim ko, et al9- 22.1%), external drainage 12.5% (Cheruvu, et al8 - 16.67%) and internal drainage 0% (R W Parks, et al7 - 0% & V Usatoff, et al4 - 3%).
CONCLUSION
Pseudocyst is a common complication of both acute and chronic pancreatitis. As alcohol is one the most common precipitating factor, its use, if decreased by counselling or social awareness, can decrease its prevalence. Its management depends on various factors like patients factors and characteristic of pseudocyst as well expertise present in the treating hospital.
Various treatment modality is available for its management like internal drainage or external drainage or if needed by conservative route. Thus, it is necessary to have an algorithm for the clinical
setting and of such patients for prompt diagnosis and managements.
Funding : None
Conflict of Interest : None
REFERENCES
1Brunicardi FC, Andersen DK, Billiar TR, Dunn DL, Hunter JG, Kano LS — Schwartz’s Principles of Surgery. 11th ed. New York: Mc Graw Hill. 2019. 1429-34
2Williams N, O’Connell PR, Mccaskie AW — Bailey & Love’s Short Practice of Surgery. 28th ed. Boca Raton, FL: CRC Press. 2017. 1260-87
3Navarro S — El arte de la cirugía pancreática. Pasado, presente y futuro. GastroenterolHepatol 2017; 40: 648e1-648e11.
4Usatof V, Brancatisano R, Wiliams RCN — Operative treatment of pseudocysts in patients with chronic pancreatitis. Br J Surg 2000; 87: 1494-9.
5Zdanyte E, Strupas K, Bubnys A, Stratilatovas E — Difficulties of differential diagnosis of pancreatic pseudocysts and cystic neoplasms. Medicina (Kaunas). 2004; 40(12): 1180-8.
6Adams DB, Anderson MC — Percutaneous catheter drainage compared with internal drainage in the management of pancreatic pseudocyst. Ann Surg 1992; 215(6): 572-57.
7Parks RW, Tzovaras G, Diamond T, Rowlands BJ — Management of pancreatic pseudocysts. Ann R Coll Surg Engl 2000; 82: 383-7.
8Cheruvu CVN, Clarke MG, Prentice M, Eyre-Brook IA — Conservative treatment as an option in the management of pancreatic pseudocyst. Ann R Coll Surg Engl 2003; 85: 313-6.
9Kim KO, Kim TN — Acute pancreatic pseudocyst: incidence, risk factors, and clinical outcomes. Pancreas 2012; 41(4): 577-81.
Fig 1 — CT Scan of Pseudocyst (red arrow)
Fig 2 — Intra-operative view of Cystogastrostomy Singh
Original Article
Clinical Profile of Strabismus among Children Attending a Tertiary Care Hospital in Eastern India
Background : Strabismus is misalignment of visual axis of the two eyes when looking at an object of regard. Apart from visual morbidity, strabismus has got both cosmetic and psychosocial impact. Our study aimed at estimation of prevalence of different types of childhood strabismus, assess the visual status and determine the factors associated with childhood strabismus.
Materials and Methods : It was a cross-sectional, observational study conducted from February, 2020 to January, 2021 among children <18 years of age having strabismus who attended the Outpatient Department (OPD) of Ophthalmology of a Tertiary Care Hospital in West Bengal, India. Proper history taking, meticulous ophthalmological examinations and necessary laboratory investigations were done in all the cases.
Results : A total of 96 patients were included in our study. Hospital prevalence of childhood strabismus was 1.88%. Majority of the patients (39.6%) were of 5-10 years age group. The mean and median age at presentation was 7.5±4.9 and 7 years respectively. Males (58.3%) were more than females (41.7%). Majority of the patients belonged to the lower middle socioeconomic class (59.4%). Esotropia (55.2%) was the most common type of strabismus, followed by exotropia (35.4%). Most common refractive error was myopia (31.2%) and strabismic amblyopia (8.3%) was the most common type of amblyopia. Birth asphyxia (13.5%) was the most common factor associated with strabismus.
Conclusion : Strabismus is an important treatable cause of ocular morbidity in children. If left untreated, it may cause visual impairment and psychosocial problem. Hence early detection and treatment is needed.
Strabismus is a common eye condition among children attending Ophthalmology Outpatient Department (OPD). Prevalence of strabismus ranges from 0.6 to 6.9% worldwide 1-4 . Several factors including prematurity, birth asphyxia, birth trauma, Neonatal Intensive Care Unit (NICU)/Sick Neonatal Care Unit (SNCU) admission, Low Birth Weight (LBW), maternal smoking during pregnancy, Intrauterine Growth Retardation (IUGR), family history of strabismus and consanguineous marriage have been postulated to be associated with childhood strabismus. Ocular factors such as hyperopia, myopia, anisometropia, astigmatism and amblyopia are also associated with strabismus2,3,5-9
1MS (Ophthalmology), Senior Resident, Basirhat Health District Hospital, 24 Parganas (N), West Begal 743292
2MS (Ophthalmology), Department of Ophthalmology, Burdwan Medical College & Hospital, Purba Bardhaman 713104 and Corresponding Author
3MD (Paediatrics), Senior Resident, NRS Medical College & Hospital, Kolkata 700014
4MS (Ophthalmology), PhD, Professor, Burdwan Medical College & Hospital, Purba Bardhaman 713104
Received on : 24/01/2025
Accepted on : 20/02/2025
Editor's Comment :
Strabismus is an important cause of childhood ocular morbidity and cosmetic deformity. Early detection and treatment can prevent irreversible vision loss and psychological impact on children. This can be achieved by creating awareness regarding the disease and importance of seeking early medical attention.
Strabismus causes cosmetic problem by affecting the normal appearance that has psychosocial impact (social phobia, anxiety) on children and their parents. So, the quality of life gets affected10-12 Ignorance and illiteracy are the main factors for delay in seeking medical attention and higher incidence of strabismus in our country10
MATERIALS AND METHODS
It was a cross-sectional, observational, hospital-based study conducted between February, 2020 - January, 2021 to estimate the prevalence of different types of childhood strabismus and determine the factors associated with strabismus. Children <18 years of age having strabismus were recruited from
How to cite this article : Clinical Profile of Strabismus among Children Attending a Tertiary Care Hospital in Eastern India. Mandal A, Biswas J, Pattanayak P, Bandyopadhyay M. J Indian Med Assoc 2025; 123(10): 34-9.
123, No 10, October 2025Journal
Ophthalmology OPD of a tertiary care hospital of West Bengal, India. Institute ethics approval was obtained and informed consent from legally acceptable representative was taken from all recruited study subjects. The data were collected in a predesigned pretested proforma. Patients having pseudostrabismus, unco-operative patients and those unwilling to give informed consent were excluded from the study. A total number of 96 patients participated in the study. All the eligible patients were recruited serially throughout the duration of the study.
Visual acuity test, refraction test with cycloplegic, slit lamp examination and fundus examination was performed for all the participants.
Visual Acuity (VA) was assessed by using fixation preference test, Teller’s acuity cards, pictorial vision charts, visual evoked potential (VEP) in <3 years children; Tumbling E chart for 3-5 years children and Snellen’s chart for 5 – <18 years old children. Visual acuity in <3 years old children were classified as good & poor vision; VA in children 3 – <18 years were classified into four groups. Group1: having VA 6/6, Group 2: VA 6/9-6/18, Group 3: VA 6/24-6/60 & Group 4: VA <6/60.
Strabismus evaluation was done by cover-uncover test, prism bar cover test, measurement of deviation and Binocular Single Vision (BSV) with synoptophore, Hirschberg test, modified Krimsky corneal reflex test, diplopia charting with Hess chart, Force Duction Test (FDT). Accommodative Convergence-toAccommodation (AC/A) ratio was calculated using heterophoria method.
We classified the patients into 4 groups according to age (Group1 : 0-5 years, Group 2 : 5-10 years, Group 3 : 10-15 years & Group 4 : 15 – <18 years).
Amblyopia among children <3 years was detected based on fixation preference. Good fixation or poor fixation by one eye or failure for maintaining fixation for more than 2 seconds when fellow eye was uncovered13. Although it may not be a perfect method for diagnosis of amblyopia, it is most widely accepted method now a days for deciding the need for amblyopia treatment in children <3 years with strabismus and/or anisometropia13-15
Modified Kuppuswamy Scale was used for evaluation of socio-economic status, (parameters used: education of the head of the family, occupation of head of family and family income per month)16 . Serological
investigations, Chest X-ray, ECG, CT scan, MRI scan were done when needed.
The data was collected in a case record format and analyzed using SPSS software. P-value <0.05 was considered statistically significant.
RESULTS
During the study period, a total of 5746 patients below 18 years of age attended our OPD with various ophthalmological ailments. Among them 108 patients presented with strabismus. Thus, prevalence of childhood strabismus was estimated to be 1.88%. Applying the exclusion criteria, a total of 96 patients with 192 eyes were included in our study. Majority of the patients were of 5-10 years of age (39.6%). The mean and median age at presentation was 7.5±4.9 (range: 6 months - 17 years) and 7 years respectively. The total number of male (M) patients was 56 (58.3%) and female (F) was 40 (41.7%) with M:F ratio = 1.4:1. Hindus (62.5%) were more in number than Muslims (37.5%). Majority of the patients belonged to lower middle class of socioeconomic status (59.4%)(Table 1).
Abnormal head posture was observed in 25% patients; among them face turn was most common (22.9%). Mean angle of deviation was 39.5±17.7 Prism Diopter (PD). In our study population, 84.4% patients had normal gaze. Among the restricted gaze, abduction defect (13.6%) was most common gaze abnormality. AC/A ratio was normal in 93.7% patients and 6.3% had high AC/A ratio (Table 2).
Among children <3 years, 13 (13.5%) patients had good vision and 8 (8.3%) patients had poor vision. In children between 3-<18 years of age, 37 (38.5%) patients had 6/6 best corrected VA (BCVA), 15
Table 1 — Demographic Profile
CharacteristicsNumber (Percentage)
Age : 0 - 5 years34 (35.4%)
5 - 10 years38 (39.6%)
10 - 15 years15 (15.6%)
15 - <18 years9 (9.4%)
Sex : Male56 (58.3%)
Female40 (41.7%)
Religion : Hindu60 (62.5%)
Muslim36 (37.5%)
Socio-economic Status : Upper1 (1.0%)
Upper middle5 (5.2%)
Lower middle57 (59.4%)
Upper lower29 (30.2%)
Lower4 (4.2%)
Characteristics
Head Posture :
Table 2 — Strabismus Profile
Number (Percentage)
Normal72 (75%)
Face turn22 (22.92%)
Head tilt1 (1.04%)
Chin lift1 (1.04%)
Laterality of Strabismus :
Unilateral (right)31 (32.3%)
Unilateral (left)38 (39.6%)
Bilateral (alternate)26 (27.1%)
Bilateral (fixed)1 (1.0%)
Gaze Restriction :
No gaze restriction81(84.4%)
In Abduction13 (13.6%)
In Adduction1 (1.0%)
In elevation1 (1.0%)
Refractive Status :
Emmetropia
40 (41.7%)
Hypermetropia (with Astigmatism)2 (2.1%)
Hypermetropia (without Astigmatism)24 (25%)
Myopia (with Astigmatism)4 (4.1%)
Myopia (without Astigmatism)26 (27.1%)
AC/A Ratio :
Normal90 (93.7%)
High6 (6.3%)
(15.6%) patients had 6/9-6/18 BCVA, 8 (8.3%) had BCVA of 6/24-6/60 and 15 (15.6%) had <6/60 BCVA. Out of 96 cases, 41.7% patients were emmetropic. Most common refractive error was myopia (31.3%) followed by hypermetropia (27.1%). Among the myopic children, exotropia was most common (46.7%); whereas among hyperopic children, esotropia was most commonly found (57.7%). Esotropia (60%) was more common than exotropia (32.5%) among children having emmetropia. Majority of the strabismic children having hypotropia, myopia was most common refractive error (60%).
Concomitant strabismus (85.4%) was more in number than incomitant strabismus (14.6%). Esotropia (55.2%) was the most common variety, followed by exotropia (35.4%), hypotropia (5.2%) and hypertropia (4.2%). Among esotropia variant, we found that sensory esotropia was the most common variety (12.5%). Among exotropia, the most common variety was sensory exotropia (14.6%)(Table 3).
Amblyopia was found in 15.6% of strabismic children. Among them, strabismic amblyopia (8.3%) was the most common type, followed by stimulus deprivation amblyopia (4.2%) and anisometropic amblyopia (3.1%). Strabismic amblyopic was more commonly found among exotropic children. All 3 children of anisometropic amblyopia had esotropia and stimulus
Table 3 — Types of Strabismus
Type of strabismusFrequency (Percentage)
Esotropia :
Essential infantile esotropiav4 (4.2%)
Acute concomitant esotropia (ACE)4 (4.2%)
Refractive normo-accommodative6 (6.3%)
Refractive hyper-accommodativev2 (2.1%)
Non-refractive hyper-accommodative4 (4.2%)
Non-refractive hypo-accommodative8 (8.3%)
Partially accommodative3 (3.1%)
Sensory esotropia12 (12.5%)
Paralytic esotropia
(a) 6th CN palsy6 (6.3%)
(b) Myasthenia gravis1 (1.0%)
Esotropia associated with Nystagmus
Blockade Syndrome (NBS)1 (1.0%)
Microtropia1 (1.0%)
Strabismus fixus (Convergent Variant)1 (1.0%)
Exotropia :
Infantile exotropia12 (12.5%)
Intermittent exotropia3 (3.1%)
‘V’ pattern exotropia1 (1.0%)
Sensory exotropia14 (14.6%)
Restrictive exotropia3 (3.1%)
Paralytic exotropia1 (1.0%)
Hypertropia4 (4.2%)
Hypotropia5 (5.2%)
TOTAL96 (100%)
deprivation amblyopia was also common among esotropic children.
In our study, 25% strabismic patients had no associated factors. Birth asphyxia (13.5%) was the most common factor associated with, followed by Delayed Developmental Milestone (DDM) (12.5%). Both birth asphyxia and DDM was more common among esotropic children. History of SNCU/NICU admission was present in 21.9% patients and 11.3% patients had recent history of (h/o) fever (Table 4).
DISCUSSION
In our study, males (58.3%) were more commonly affected with M : F ratio 1.4 : 1. Males had greater mean age at presentation (7 years 3 months) than females (6 years 10 months), which was contrary to the study conducted by Choudhry TA, et al17 Hindus (62.5%) were more in number than Muslims (37.5%) in the present study. Majority of the patients belonged to the lower middle socioeconomic class (59.4%), followed by upper lower class (30.2%). This lower socioeconomic status might be responsible for unawareness of disease, delayed presentation and late treatment.
than incomitant strabismus. Esotropia (55.2%) was the most common variety of strabismus. Similar result was found in the study conducted by Robaei D, et al (2006) and Mohney BG, et al (2007)6,18. But, exotropia was more common than esotropia variant among comitant horizontal strabismus in a study by Chia A, et al19
Among esotropia variant, sensory esotropia (12.5%) was the most common variety. This result was contrary to the study by Mohney BG, et al where the most common type was accommodative esotropia18 In another study by Greenberg AE, et al , fully accommodative esotropia was most frequent type20 . Among exotropia variant, the most common variety was sensory exotropia (14.6%) in our study, whereas in a study by Govindan M, et al , intermittent exotropia and convergence insufficiency was the most frequent type of exotropia21
The underlying causes of sensory esotropia were congenital/developmental cataract and retinoblastoma. The causes of sensory exotropia were congenital/developmental cataract, traumatic cataract, complicated (uvitic) cataract, retinal detachment, Persistent Hyperplastic Primary Vitreous (PHPV), retinoblastoma, unilateral pathological myopia, ocular cysticercosis and secondary optic atrophy.
In our study 4.2% patients had acute Acquired Comitant Esotropia (ACES) and their mean age at
presentation was 4.5 years and most of the children had history of recent onset fever. In a study by Buch H, et al, the mean age of presentation was 4.7 years among ACES patients22 . Hypertropia was 4.2 % in our study sample. Whereas low prevalence of hypertropia (approximately 0.26%) was found in the study by Tollefson, et al23
Abnormal head posture like face turn (22.9%) was seen in paralytic strabismus (due to 6th cranial nerve palsy), acute comitant esotropia, A-V pattern strabismus, nystagmus cases with a null position and restrictive strabismus.
Visual acuity assessment was challenging in preschool children (<3 years) & children having mental retardation/ Cerebral Palsy (CP). Decreased vision in strabismic children were due to anisometropia, amblyopia or organic causes (congenital/traumatic cataract, retinal detachment, retinoblastoma, long standing papilledema, optic atrophy and ocular cysticercosis).
In our study, myopia (31.2%) was the most common refractive error among the strabismic children. Similar result was found in a study done by Han KE, et al 1 whereas in a north Indian study done by Singh A, et al, hypermetropia was the most common refractive error among strabismic children24 In present study, myopia was more common among exotropia, whereas hypertropia was more common among esotropia. Prolonged suboptimal convergence for near vision and blurred distant vision in myopes may cause breakdown of fusional control and subsequent exotropia development.
Abduction defect (13.6%) was the most common defect of extraocular muscle movement, which was due to 6th cranial nerve palsy, restriction of movement by tumor or thickened muscles due to thyroid ophthalmopathy. Adduction defect (1.0%) was due to 3rd cranial nerve palsy; and elevation defect (1.0%) was due to congenital superior rectus palsy.
Few strabismic children had systemic associations of Hypoxic Ischemic Encephalopathy (HIE) (3.1%), craniofacial dysostosis (1.0%) and arachnoid cysts (1.0%). These systemic associations suggest that neurological insult at the cerebral level might be responsible for strabismus. Further studies are needed to rule out the exact cause of association.
In the present study, strabismic amblyopia (8.3%) was the most common type of amblyopia and was most
123, No 10, October 2025Journal
commonly found among exotropic children. Anisometropic amblyopia was most commonly found among esotropic children. Whereas in a study by Chen X, et al among 36-72 months aged children in eastern China, anisometropic amblyopia was the most common type of amblyopia and amblyopia was most common among comitant esotropia group 25
Anisometropic amblyopia was also the most common form of amblyopia among children of untreated infantile esotropia in a study by Calcutt C26
In the present study, birth asphyxia (13.5%) was the most common factors associated with strabismic children. Family history of strabismus was most commonly found among hyperopic exotropia group in our study, whereas Ziakas NG, et al found that family history of strabismus was more common in hypermetropic accommodative esotropia group27
Prematurity (2.1%) was more common among children having esotropia than exotropia. This result is similar to the previous published literature 28 Prematurity and birth asphyxia may cause maldevelopment of central oculomotor control.
Positive family history of squint was more common among children having esotropia, which was contrary to the prior reported literature1,28. History of parenteral consanguinity was found among strabismic children in our study (1.0%). There was significant association found between consanguineous marriage and development of strabismus in studies conducted by Bagheri M and Doctor MB 9,28 This suggests that inheritance play important role in development of strabismus. Hence early screening and counselling may play important role among partners of consanguineous marriages.
We have found 5.2% strabismic children had history of seizure disorders. This association between seizure and strabismus may be due to impairment of normal cortical development and ocular fusion29
CONCLUSION
Strabismus is a common treatable cause of ocular morbidity in children. Untreated strabismus left for long period may result in Binocular Single Vision (BSV) defect, amblyopia and psychosocial impact on children. Hence early detection and treatment is important. This can be done by creating awareness among the parents regarding the disease and importance of early presentation and treatment. Very few studies on clinical profile of strabismus among
children have been conducted in this region. Our study may help in estimation of magnitude of problem, planning for early detection and management strategies for this potentially treatable ocular morbidity.
Funding : None
Conflict of Interest : None
REFERENCES
1Han KE, Baek SH, Kim SH, Lim KH — Epidemiologic Survey Committee of the Korean Ophthalmological Society. Prevalence and risk factors of strabismus in children and adolescents in South Korea: Korea National Health and Nutrition Examination Survey, 2008–2011. Plos one 2018; 13(2): e0191857.
2Qanat AS, Alsuheili A, Alzahrani AM, Faydhi AA, Albadri A, Alhibshi N — Assessment of Different Types of Strabismus Among Pediatric Patients in a Tertiary Hospital in Jeddah. Cureus 2020; 12(12): e11978. doi: 10.7759/cureus.11978..
3Attada TR, Deepika M, Laxmi S — Strabismus in paediatric age (3-16 year): a clinical study. Int J Res Med Sci 2016; 4(6): 1903-9.
4Saxena R, Singh D, Gantyala SP, Aggarwal S, Sachdeva MM, Sharma P — Burden of ocular motility disorders at a tertiary care institution: A case to enhance secondary level eye care. Indian Journal of Community Medicine: Official Publication of Indian Association of Preventive & Social Medicine 2016; 41(2): 103.
5Cotter SA, Varma R, Tarczy-Hornoch K, McKean-Cowdin R, Lin J, Wen G, et al — Risk factors associated with childhood strabismus: the multi-ethnic pediatric eye disease and Baltimore pediatric eye disease studies. Ophthalmology 2011; 118(11): 2251-61.
6Robaei D, Rose KA, Kifley A, Cosstick M, Ip JM, Mitchell P — Factors associated with childhood strabismus: findings from a population-based study. Ophthalmology 2006; 113(7): 114653.
7Williams C, Northstone K, Howard M, Harvey I, Harrad RA, Sparrow JM — Prevalence and risk factors for common vision problems in children: data from the ALSPAC study. Br J Ophthalmol 2008; 92: 959-64.
8VanderVeen DK, Coats DK, Dobson V, Fredrick D, Gordon RA, Hardy RJ, et al — Prevalence and course of strabismus in the first year of life for infants with prethreshold retinopathy of prematurity: findings from the Early Treatment for Retinopathy of Prematurity study. Archives of Ophthalmology 2006; 124(6): 766-73.
9Bagheri M, Farvardin M, Saadat M — A study of consanguineous marriage as a risk factor for developing comitant strabismus. Journal of Community Genetics 2015; 6: 177-80.
10Singh A, Rana V, Patyal S, Kumar S, Mishra SK, Sharma VK — To assess knowledge and attitude of parents toward children suffering from strabismus in Indian subcontinent. Indian J Ophthalmol 2017; 65(7): 603.
Vol 123, No 10, October 2025Journal
11Bez Y, Coºkun E, Erol K, Cingu AK, Eren Z, Topçuoðlu V, et al — Adult strabismus and social phobia: a case-controlled study. J AAPOS 2009; 13(3): 249-52. doi: 10.1016/j.jaapos.2009.02.010.
12Kothari M, Balankhe S, Gawade R, Toshnival S — Comparison of psychosocial and emotional consequences of childhood strabismus on the families from rural and urban India. Indian J Ophthalmol 2009; 57: 285-8.
13Birch EE, Holmes JM — The clinical profile of amblyopia in children younger than 3 years of age. J AAPOS 2010; 14(6): 494-7.
14Cotter SA, Tarczy-Hornoch K, Song E, Lin J, Borchert M, Azen SP, et al — Multi-Ethnic Pediatric Eye Disease Study Group. Fixation preference and visual acuity testing in a populationbased cohort of preschool children with amblyopia risk factors. Ophthalmology 2009; 116(1): 145-53.
15Friedman DS, Katz J, Repka MX, Giordano L, Ibironke J, Hawse P, et al — Lack of concordance between fixation preference and HOTV optotype visual acuity in preschool children: the Baltimore Pediatric Eye Disease Study. Ophthalmology 2008; 115(10): 1796-9.
16Wani RT — Socioeconomic status scales-modified Kuppuswamy and Udai Pareekh’s scale updated for 2019. Journal of Family Medicine and Primary Care 2019; 8(6): 1846.
17Chaudhry TA, Khan A, Khan MB, Ahmad K — Gender differences and delay in presentation of childhood squint. Journal of the Pakistan Medical Association 2009; 59(4): 229.
18Mohney BG — Common forms of childhood strabismus in an incidence cohort. Am J Ophthalmol 2007; 14: 465-7
19Chia A, Roy L, Seenyen L — Comitant horizontal strabismus: an Asian perspective. British Journal of Ophthalmology 2007; 91(10): 1337-40.
20Greenberg AE, Mohney BG, Diehl NN, Burke JP — Incidence and types of childhood esotropia: a population-based study. Ophthalmology 2007; 114(1): 170-4.
21Govindan M, Mohney BG, Diehl NN, Burke JP — Incidence and types of childhood exotropia: a population-based study. Ophthalmology 2005; 112(1): 104-8.
22Buch H, Vinding T — Acute acquired comitant esotropia of childhood: a classification based on 48 children. Acta Ophthalmologica 2015; 93(6): 568-74.
23Tollefson MM, Mohney BG, Diehl NN, Burke JP — Incidence and types of childhood hypertropia: a population-based study. Ophthalmology 2006; 113(7): 1142-5.
24Singh A, Chawla O, Verma R, Saxena V, Kumari R, Patnaik N, Kumar B, et al — Refractive Errors and Concomitant Strabismus in Children and Adolescents. A Hospital Based observational Study. Delhi J Ophthalmol 2022; 32: 24-9.
25Chen X, Fu Z, Yu J, ding H, Bai J, Gong Y, et al — Prevalence of amblyopia and strabismus in Eastern China: results from screening of preschool children aged 36-72 months. British Journal of Ophthalmology 2016; 100(4): 515-9
26Calcutt C, Murray AD — Untreated essential infantile esotropia: factors affecting the development of amblyopia. Eye 1998; 12(2): 167-72.
27Ziakas NG, Woodruff G, Smith LK, Thompson JR — A study of heredity as a risk factor in strabismus. Eye 2002; 16(5): 519-21.
28Doctor MB, Sachadeva V, Kekunnaya R — Profile of infantile strabismus at a tertiary eye care center in India. Indian Journal of Ophthalmology 2022; 70(8): 3056-60.
29Das VE — Strabismus and the oculomotor system: insights from macaque models. Annual Review of Vision Science 2016; 2: 37-59.
If you want to send your queries and receive the response on any subject from JIMA, please use the E-mail or Mobile facility.
Know Your JIMA
Website:https://onlinejima.com www.ejima.in For Reception:Mobile : +919477493033 For Editorial :jima1930@rediffmail.com
Mobile : +919477493027 For Circulation :jimacir@gmail.com Mobile : +919477493037 For Marketing:jimamkt@gmail.com
Mobile : +919477493036 For Accounts:journalaccts@gmail.com Mobile : +919432211112 For Guideline:https://onlinejima.com
Original Article
Ionic Calcium Measurement in Blood : A Comparative Analysis of Direct Ion-Selective Electrode Method and Formula-based Predictions
Background : Free ionic calcium, the biologically active component of Total Calcium (TCa) in blood, reflects the actual calcium status in health and disease.
Materials and Methods: This study analyzed 200 heparinized arterial blood gas samples for free calcium using the direct Ion-selective Electrode (ISE) method and total calcium and plasma albumin using Arsenazo III and Bromocresol Green (BCG) methods, respectively. Our study categorized patients into three groups based on plasma pH: acidosis (pH<7), normal (pH=7), and alkalosis (pH>7). The results revealed that the calculated ionic calcium was lower than the measured ionic calcium, indicating the superior reliability of the direct Ion Selective Electrode (ISE) method for ionic calcium measurement.
Result : In the acidosis and normal pH groups, measured ionic calcium showed a significant positive correlation with both total calcium and calculated free calcium (acidosis: r=0.42, p=0.026 and r=0.49, p=0.008; normal: r=0.54, p<0.0001 and r=0.44, p<0.0001). However, no significant correlation was observed in the alkalosis group.
In the hypoalbuminemia group, there was a positive correlation between total calcium and both measured free calcium (r=0.481, p<0.0001) and calculated free calcium (r=0.800, p<0.0001). Additionally, calculated free calcium was positively correlated with measured free calcium (r=0.508, p<0.0001). The Bland-Altman method revealed a lack of agreement between measured free calcium and calculated free calcium across different pH levels and albumin concentrations. Conclusion : The direct ISE method proves to be a more reliable approach compared to formula-based predictions. Key words : Total calcium, calculated free calcium, pH, Measured Free calcium, ISE.
CEditor's Comment :
Direct ion-selective Electrode (ISE) measurement of free ionic calcium provides a more reliable assessment of calcium status than formula-based calculations, across varying pH and albumin concentrations.
Measured ionic calcium shows significant positive correlations with total calcium and calculated free calcium in acidosis and normal pH states, but not in alkalosis, highlighting pH-dependent variations.
Bland-Altman analysis confirms poor agreement between measured and calculated free calcium, underscoring the importance of direct measurement for clinical decision-making.
Department of Biochemistry, Dr Ram Manohar Lohia Institute of Medical Sciences, Lucknow, Uttar Pradesh 226010
1MD, Assistant Professor, Department of Biochemistry, King George's Medical University, Lucknow, Uttar Pradesh 226003
2PhD, Senior Resident
3MS, DNB, Assistant Professor, Department of Obstetrics and Gynaecology and Corresponding author
4MD, Additional Professor, Department of General Medicine
5MD, Additional Professor 6PhD, Professor
Received on : 21/11/2023
alcium, the most abundant cation in the body, is often referred to as the “king of minerals” due to its critical role in numerous physiological processes such as blood clotting, neuromuscular conduction, maintaining normal skeletal and cardiac muscle tone and excitability, stimulating exocrine gland secretion, and maintaining cell membrane integrity and permeability1. In the bloodstream, calcium exists in three forms: anion-bound, protein-bound, and free or “ionized” calcium. The concentration of these fractions is influenced by hydrogen ions, anions, and plasma proteins 2 . While total calcium measurement accurately represents overall calcium homeostasis in healthy individuals, ionized calcium is the preferred test in patients with abnormal pH or aberrant protein or anion concentrations. Although approximately 50% of the calcium in the blood is in free form (ionized), 40% is bound to proteins and 10% is complexed with other anions (bicarbonate, lactate, and citrate), it is the ionized calcium that is biologically active 3 Equations and nomograms have been developed to connect total calcium to ionized calcium, primarily to correct total calcium values for the impact of protein
Accepted on : 21/12/2023
How to cite this article : Ionic Calcium Measurement in Blood : A Comparative Analysis of Direct Ion-Selective Electrode Method and Formula-based Predictions. Nigam V, Singh S, Kulshrestha R, Singh V, Kulshrestha MR5, Tiwari V. J Indian Med Assoc 2025; 123(10): 40-4.
123, No 10, October 2025Journal
binding4-6. However, the accuracy of these corrections has been disputed, and direct measurement of ionized calcium was previously unfeasible due to methodological challenges7. With advancements in technology resolving these challenges over time, the measurement of ionized calcium is now anticipated to become a standard test.
Despite these advancements, resource-limited settings may still face challenges in implementing direct measurement of ionized calcium. This study aims to address this gap by comparing measured ionic calcium using the Ion Selective Electrode (ISE) method with derived values through total corrected calcium using formulas. This comparison could provide valuable insights for healthcare settings with limited resources and contribute to improving patient care.
Study Design and Methodology :
This study is a prospective analysis of 200 patient samples from the Maternal ICU, Department of Obstetrics and Gynecology at Ram Prakash Gupta Mother and Child State Referral Hospital. The samples were received in the Department of Biochemistry at Dr Ram Manohar Lohia Institute of Medical Sciences from December, 2021 to May, 2022.
Sample Collection and Analysis :
Blood samples were collected using a heparinized syringe and centrifuged at 3500 rpm for 15 minutes to separate the plasma. The plasma was then analyzed for ionic calcium and total calcium levels. Total calcium was measured using a commercially available kit (based on the Arsenazo II method) on an automated analyzer (Beckman Coulter AU480). Ionic calcium was measured using an ion-selective electrode method on a Combiline Eschweiler automated analyzer. Calibration and quality control samples were processed before each experiment according to the manufacturer’s instructions.
Calculation of Free Calcium :
Total protein, albumin, and globulin were estimated to derive calculated free calcium. The following formulas were used8 :
Adjusted total Calcium was calculated by using Payne’s formula as follows9 :
(1) Adjusted total calcium (mg/dl) = total calcium(mg/ dl) + 0.8(4-albumin(gm/dl)
(2) Adjusted total calcium (mmol/L) = adjusted total calcium (mg/dL) × 0.25
Data Analysis :
Data analysis was performed using SPSS Statistics for Windows, version 21.0 (IBM, USA). Median and quartile ranges were used for normal data distribution. Pearson correlation coefficient was used to calculate the correlations between variables, and Bland-Altman Plot analysis was used to assess the agreement between variables. A p<0.05 was considered statistically significant.
RESULT
Patients were categorized into three groups based on plasma pH: acidosis (pH<7), normal (pH=7) and alkalosis (pH>7). Tables 1 and 2 reveals that the calculated ionic calcium was lower than the measured ionic calcium, indicating the superior reliability of the direct Ion Selective Electrode (ISE) method for ionic calcium measurement. In the hypoalbuminemia group, there was a significant decrease in total calcium and calculated free calcium compared to the normal albuminemia group (p<0.0001). However, no significant differences were observed across different pH groups.
Correlation among the Calcium Values in Acidosis (pH<7), Normal (pH=7) and Alkalosis (pH>7) Groups
As shown in Table 3, measured ionic calcium in the acidosis group showed a positive correlation with total calcium and calculated free calcium (r=0.42, p=0.026 and r=0.49, p=0.008, respectively). Similarly, in the normal pH group, measured ionic calcium was positively correlated with total calcium and calculated free calcium (r=0.54, p<0.0001 and r=0.44, p<0.0001 respectively). However, no significant correlation was observed in the alkalosis group.
Correlation Analysis of Calcium Variables Based on Albumin Levels
In the hypoalbuminemia group, there was a positive correlation between total calcium and both measured free calcium (r=0.481, p<0.0001) and calculated free calcium (r=0.800, p<0.0001). Additionally, calculated free calcium was positively correlated with measured free calcium (r=0.508, p<0.0001). In the normal
Table 1 — Comparative description of ionic and calculated calcium along with total calcium among different categories based on plasma pH
VariablesAcidosis; n=31Normal; n=93Alkalosis; n=76P1P2P3 Median (Q1-Q3)Median (Q1-Q3)Median (Q1-Q3)
Acidosis: pH<7.35, Normal: pH- 7.35 to 7.45, Alkalosis: pH>7.45, FCC: Free calcium (calculated), FCM: Free calcium (measured), TC: Total calcium The Mann-Whitney test was used to calculate the p-value. *p-value <0.05 was considered as statistically significant. P1: p-value between acidosis and normal, P2: p value between acidosis and alkalosis, P3: p-value between normal and alkalosis.
Table 2 — Comparative description of ionic and calculated calcium along with total calcium among different categories based on plasma albumin
VariablesHypoalbuminemia Normal albuminemiap-value (n=120)(n=80)
FCC: Free calcium (calculated), FCM: Free calcium (measured), TC: Total calcium, TCC: Total calcium calculated. The Mann-Whitney test was used to calculate the p-value. *p-value <0.05 was considered as statistically significant.
Table 3 — Correlation of Free calcium and Ionic calcium based on pH
FCC: Free calcium (calculated), FCM: Free calcium (measured), TC: Total calcium, r=Pearson correlation. The Pearson correlation coefficient was used to analyze the correlation between the biochemical variables *p-value <0.05, which was considered statistically significant.
albuminemia group, total calcium showed a positive correlation with calculated free calcium (r=0.417, p<0.0001), but no significant correlation was found with measured free calcium (Table 4).
Agreement analysis (Bland-Altman plot) for Calculated and Measured Ca++ ion
The Bland-Altman method (extensively used to evaluate agreement among two different instruments or measurement techniques) was used to calculate the mean difference (bias) between measured free calcium and calculated free calcium. The analysis revealed a lack of agreement between the two variables across different pH levels and albumin
Table 4 — Correlation of Ionic calcium with total and free calcium on the bases of albumin
FCC: Free calcium (calculated), FCM: Free calcium (measured), TC: Total calcium, TCC: Total calcium calculated, r=Pearson correlation. The Pearson correlation coefficient was used to analyze the correlation between the biochemical variables*p-value <0.05, which was considered statistically significant.
concentrations. However, no significant difference was observed between measured and calculated free calcium in all the groups.
Concordance (Measured and Calculated) in Ionic Calcium Level
A concordance study was conducted to categorize patients based on the reference range of ionic calcium levels using Cohen’s Kappa statistic, a quantitative measure used to evaluate the level of agreement between two raters or judges who each classify items into mutually exclusive categories. Ionic calcium levels below 1.10 mmol/L were classified as decreased, while levels above 1.10 mmol/L were considered normal. The study found substantial agreement between both methods, with a Cohen’s kappa ( κ ) value of 0.353, indicating statistical significance (p<0.0001) as shown in Table 5.
DISCUSSION
Calcium, the most abundant mineral in the human body, is found in three forms in the bloodstream: free calcium, calcium ions bound to albumin, and calcium associated with organic anions such as phosphate, bicarbonate, and citrate. Free calcium is the physiologically active form and plays a crucial role in
Table 5 — Concordance of Ionic calcium between measured and calculated
FCCFCM
<1.10 mmol/L>1.10 mmol/L
<1.10 mmol/L18708
>1.10 mmol/L0203
Cohen’s kappa (κ)0.353 p-value<0.0001*
FCC: Free calcium (calculated), FCM: Free calcium (measured). Cohen’s Kappa values range between 0 and 1. A value of 0 indicates no agreement between the two raters, while a value of 1 indicates perfect agreement. The interpretation of different values for Cohen’s Kappa can vary, but generally, a higher value indicates a higher level of agreement between the two raters.
various metabolic and physiological processes10,11
Our study revealed a positive relationship between calculated free calcium and measured free calcium in acidic and normal pH conditions. This relationship was not observed in alkalotic conditions, indicating that pH plays a significant role in calcium homeostasis. This is consistent with previous literature that has reported changes in ionized calcium with impairments of calcium homeostasis due to variations in pH11-13
The mean of ionic calcium was found to be reduced to the reference range (0.84±0.59), indicating a discrepancy between measured and calculated values. This discrepancy becomes more pronounced in patients with hypoalbuminemia due to fluctuations in ionized calcium14.
The Bland-Altman method revealed poor agreement between measured free calcium and calculated free calcium at different pH levels. This finding underscores the need for more accurate methods for measuring ionized calcium, especially in resourcelimited settings.
The study findings highlight the complexities involved in accurately measuring ionic calcium levels, particularly in the context of varying pH and albumin concentrations. Patients with aberrant protein or anion concentrations are likely to have erroneous corrections due to fluctuations in ionized calcium. This is particularly evident in patients undergoing hemodialysis, where changes in pH, albumin, phosphate, and other anions due to therapeutic interventions can lead to incorrect pH of ionized calcium.
Our study aligns with the findings of Mir, et al15 who found significant differences between predicted free calcium generated by formulas and measured free calcium, both in the hypoalbuminemia group and
when all samples were considered combined. The Bland-Altman plots also failed to demonstrate agreement between the measured and calculated free calcium levels within the permissible range for any groups. When comparing calculated free calcium from Orrell’s and Berry, et al’s formulas to measured free calcium in normal albuminemia and hyperalbuminemia, respectively, no significant differences were found between the two sets of conditions. However, none of the formulas were found to be universally applicable to all albumin values16,17
In our study, the Bland-Altman method revealed a poor agreement between measured free calcium and calculated free calcium at different pH levels. This finding underscores the need for more accurate methods for measuring ionized calcium, especially in resource-limited settings.
Accurately estimating free calcium is crucial, particularly in managing critically ill patients with calcium metabolism disorders, specifically in the context of cardiac or renal conditions. Our study revealed substantial agreement between measured and calculated ionic calcium, with patients classified into two categories according to reference range: Ionic calcium <1.10 mmol/L was considered as decreased and Ionic calcium >1.10 mmol/L as normal.
However, it’s important to note that the formulas used to calculate ionic calcium have certain inherent flaws. They fail to account for all variables that affect the complex calcium equilibria, and there is a variance in the analytical parameters used in each formula. Additionally, varying reference ranges for the same parameters can affect the results. Studies have observed that these formulas do not correlate with directly measured free calcium in patients who are critically ill, have chronic kidney disease hyperparathyroidism, or receiving transfusions, or undergo hemodialysis18-20
The importance of estimating free calcium in managing critically ill patients, particularly those with cardiac or renal conditions, cannot be overstated. Abnormalities in calcium metabolism in these patients can have significant implications for their prognosis and treatment outcomes. However, the current formulas used for estimating free calcium have several limitations that need to be addressed 21 Firstly, these formulas do not account for all the factors influencing the complex calcium equilibria. Calcium homeostasis is a multifaceted process involving various physiological mechanisms and pathways. By
123, No 10, October 2025Journal
not considering all these factors, the formulas may not accurately estimate free calcium levels22
Secondly, variations in the analytical parameters involved in these formulas can affect the calculations. This introduces a degree of uncertainty and potential error in the estimation process. It is crucial to standardize these parameters to ensure consistent and reliable results.
Lastly, different reference ranges for the same parameters can also impact the results. This can lead to discrepancies in the estimated free calcium levels, making comparing results across different settings or populations challenging.
In light of these issues, there is a pressing need for more accurate and comprehensive methods for estimating free calcium. Future research should address these limitations and develop improved formulas that consider all relevant factors influencing calcium equilibria. This will enhance our ability to effectively manage patients with abnormalities in calcium metabolism, ultimately improving patient outcomes.
CONCLUSION
Despite the challenges associated with ion-selective electrode measurement of free calcium, such as cost, low throughput, and the need for strict anaerobic conditions, it remains a quick, easy, and reliable method for assessing calcium levels. If samples are carefully collected under anaerobic conditions, free calcium may reflect more accurately serum calcium status than total calcium.
However, in emergencies, formulas for estimating free calcium can be considered provided their limitations and the influence of albumin concentrations are considered. This balanced approach effectively manages patients’ calcium levels while acknowledging the inherent complexities of calcium measurement. Future research should continue to explore more accurate and efficient methods for estimating free calcium to improve patient care.
Funding : None
Conflict of Interest : None
REFERENCES
1Sava L, Pillai S, More U, Sontakke A — Serum calcium measurement: total versus free (ionized) calcium. Indian Journal of Clinical Biochemistry 2005; 20: 158-61.
2Rosol TJ, Capen CC — Calcium-regulating hormones and diseases of abnormal mineral (calcium, phosphorus, magnesium) metabolism. In Clinical Biochemistry of Domestic Ani-
mals 1997; 1: 619-702.
3Slomp J, van der Voort PH, Gerritsen RT, Berk JA, Bakker AJ — Albumin-adjusted calcium is not suitable for diagnosis of hyper-and hypocalcemia in the critically ill. Critical Care Medicine 2003; 31(5): 1389-93.
4Moore EW — Ionized calcium in normal serum, ultrafiltrates, and whole blood was determined by ion-exchange electrodes. The Journal of Clinical Investigation 1970; 49(2): 318-34.
5Hamroun A, Pekar JD, Lionet A, Ghulam A, Maboudou P, Mercier A, et al — Ionized calcium: analytical challenges and clinical relevance. J Lab Precis Med 2020; 5: 22.
7Johnson PC, Ware JA, Cliveden PB, Smith M, Dvorak AM, Salzman EW — Measurement of ionized calcium in blood platelets with the photoprotein aequorin. Comparison with Quin 2. Journal of Biological Chemistry 1985; 260(4): 2069-76.
9Payne RB, Little AJ, Williams RB, Milner JR — Interpretation of serum calcium in patients with abnormal serum proteins. Br Med J 1973; 4(5893): 643-6.
10Berchtold MW, Brinkmeier H, Muntener M — Calcium ion in skeletal muscle: its crucial role for muscle function, plasticity, and disease. Physiological Reviews 2000; 80(3): 1215-65.
11Fogh-Andersen N, Christiansen TF, Komarmy L, SiggaardAndersen O — Measurement of free calcium ion in capillary blood and serum. Clin Chem 1978; 24, 9: 1545-52.
12Fogh-Andersen N — Ionized calcium analyzer with a built-in pH correction. Clin Chem 1981; 27, 7: 1264-67.
13Thode J, Holmegaard SN, Transbøl I, Fogh-Andersen N, Siggaard-Andersen O — Adjusted ionized calcium (at pH 7.4) and actual ionized calcium (at actual pH) in capillary blood compared for clinical evaluation of patients with disorders of calcium metabolism. Clin Chem 1990; 36, 3: 541-44.
14Schwartz HD — New techniques for ion-selective measurements of Ca24 in serum after pH adjustment of aerobically sera. Clin Chem 1977; 23: 611.
15Mir AA, Goyal B, Datta SK, Ikkurthi S, Pal A — Comparison between measured and calculated free calcium values at different serum albumin concentrations. Journal of Laboratory Physicians 2016; 8(02): 071-6.
16Orrell DH — Albumin as an aid to the interpretation of serum calcium. Clin Chim Acta 1971; 35: 483 9.
17Berry EM, Gupta MM, Turner SJ, Burns RR — Variation in plasma calcium with induced changes in plasma specific gravity, total protein, and albumin. Br Med J 1973; 4: 640 3.
18Clase CM, Norman GL, Beecroft ML, Churchill DN — Albumin corrected calcium and ionized calcium in stable haemodialysis patients. Nephrology Dialysis Transplantation 2000; 15(11): 1841-6.
19Moore EW — Ionized calcium in normal serum, ultrafiltrates, and whole blood determined by ion-exchange electrodes. The Journal of Clinical Investigation 1970; 49(2): 318-34.
20Kihara Y, Grossman W, Morgan JP — Direct measurement of changes in intracellular calcium transients during hypoxia, ischemia, and reperfusion of the intact mammalian heart. Circulation Research 1989; 65(4): 1029-44.
21Ong GS, Walsh JP, Stuckey BG, Brown SJ, Rossi E, Ng JL, et al — The importance of measuring ionized calcium in characterizing calcium status and diagnosing primary hyperparathyroidism. The Journal of Clinical Endocrinology & Metabolism 2012; 97(9): 3138-45.
22Smaili S, Hirata H, Ureshino R, Monteforte PT, Morales AP, Muler ML, et al — Calcium and cell death signaling in neurodegeneration and aging. Anais da Academia Brasileira de Ciências 2009; 81: 467-75. Nigam V, et al.
Original Article
Normative Data of Liver Volume in Indian Adult Population
Background : Aim of this study is to establish normative data for the liver volume in healthy Indian adult population. Materials and Methods : 517 healthy adults age ranging from 20-75 years, 267 males and 250 females underwent ultrasonographic assessment of liver volume. Liver volume was correlated with age, gender, Body Surface Area (BSA) and Body Mass Index (BMI) of the participants.
Results : The overall mean liver volume was 913 cc. The liver volume increases with increasing age up to 50 years and decreases after that. Mean liver volume in male was slightly more than in female (936.84 cc versus 882.70cc). Mean Liver volume increases with increasing BMI and was found to be statistically significant below 40 years of age. BSA has positive correlation with liver volume up to 50 years of age.
Conclusion : Normative data on the liver volume in Indian adult population correlates with age, gender, BMI and BSA and all the factors correlate significantly except BSA.
Key words : Adult, Liver, Measurements, Ultrasonography, Normal Volume, Indian.
Liver size varies amongst normal individuals according to age, gender, Body Mass Index (BMI), ethnicity and various conditions affecting the liver. Estimation of liver size has critical implications for assessment of liver disorders, major hepatic resection and also in liver transplant surgery especially to avoid donor-recipient graft mismatch1-4 . Size of liver can be assessed clinically by estimating liver span by percussion; but may not be accurate5. Liver size can be determined using the ultrasound measurements of the right lobe of liver. However, it does not provide dimensional information of whole liver therefore calculation of liver volume gives a more accurate measurement of liver size6. As the available literature is scarce, we aimed to establish standards of liver volume by ultrasonography in healthy Indian adults.
MATERIALS AND METHODS
Institutional ethical committee clearance and written informed consent from all participants was taken
Netaji Subhash Chandra Bose Medical College, Jabalpur, Madhya Pradesh 48200
1MS, MCh, (Plastic Surgery) FRCS (Glasgow), DNB, MNAMS, PhD, FICS, Professor and Head, Department of Plastic Surgery and Corresponding Author
2MS, Senior Resident, Department of General Surgery
3MD, Senior Resident, Department of Radiology
4MS, PhD, FRCS, Professor and Head, Department of General Surgery
5MSc, Tutor, Department of Community Medicine
Received on : 18/04/2024
Accepted on : 21/10/2024
Editor's Comment :
The overall mean liver volume was 913cc and increases with increasing age and BMI. Mean liver volume in male was slightly more than in female.
Normative data on the liver volume in Indian adult population correlate with age, weight, height, BMI and BSA and all the factors were correlated significantly except BSA.
before initiating the study.
We enrolled 517 asymptomatic adults age ranging from 20-75 years, visiting the outpatient department accompanying their relatives for treatment, between January, 2023 - March, 2023. Those having any condition which could affect the size of the liver such as liver disease, malaria, hemolytic anemia, enteric fever, congestive heart failure were excluded. Written /informed, consent was obtained from all participants. Baseline data including the age, sex, height and weight were recorded. Ultrasonography was used to assess the volume of liver by a single radiologist. AlpinioneCUBE i7 USG machine (BPL Medical Technologies equipment Manufacturing company, Bangalore- India) was used with C16CT Curvilinear probe and frequency range 1-6 MHz. Liver volume was calculated using the formula6 Liver volume (cc) = 343.71+(0.84x ABC) where A=Left lobe AP, B (right lobe DT) and C (right lobe AP) (Figs 1-3) Statistical analysis was done using SPSS version 22.
RESULTS
517 healthy individual age ranging from 20-75 years,
How to cite this article : Normative Data of Liver Volume in Indian Adult Population. Agarwal P, Bharath S, Dixit A, Sharma D, Singh Dhakar JM. J Indian Med Assoc 2025; 123(10): 45-8.
267 males and 250 females were included in this study. Their demographics are shown in Table 1. The overall mean liver volume was 913 cc (range- 5101607 cc) and mean liver span was 12.9 cm (range9.3- 15.4 cm). Mean weight of individuals was 58.1 kg (range-32-89 kg), mean height of individuals was 1.61 m (range-1.24-1.93 m) and mean BMI of individuals was 22.4 (range-13.7-36.9).
Mean Liver volume increased till the age of 50 years and then decreased (Table 2). Mean liver volume in male was 936.84 cc and in female 882.70cc. Mean Liver volume was overall less in females but statistical significance was found only at 20-30 years of age (p=0.003)(Table 3).
Mean liver volume in normal weight, overweight and obese subjects was 905.87cc, 944.80 cc and 1081.72 cc respectively. Mean Liver volume increases with BMI and is statistically significant below 40 years of age (p-0.005)(Table 4). Body Surface Area (BSA) has positive correlation with liver volume up to 50 years meaning with increasing BSA liver volume increases and after that it has no correlation. Liver volume correlated significantly (Pearson Correlation) with age, weight, height, gender, and BMI and not with BSA (Tables 5,6).
DISCUSSION
The normal size of liver according to age, gender, BSA and BMI has not been specified in the standard textbooks. Such normative data on liver volume can be useful for clinicians to diagnose liver disease, track
Table 2 — Mean Liver volume according to the Age Age (in years)Mean Liver volume (cc)p value
Table 3 — Mean Liver volume according to the Gender Age (in years)Mean Liver volume (cc) MaleFemalep value 20-30922.43859.960.003 31-40965.76921.090.195
Table 4 — Mean Liver volume according to BMI Age (inMean Liver volume (cc) years) Under weightNormalOverweightObesep value 20-30863.95876.72 918.941102.670.005 31-40919.62916.18996.491113.390.031 41-50900.08946.06946.56943.840.862 51-60912.82892.33 917.221166.980.209 >60895.25898.08NANA0.981
disease progress and response to treatment7. In liver transplantation liver volume is an independent determinant of the prognosis of liver graft as overestimation of the donor’s liver volume may result in excessive hepatic resection leading to liver failure while underestimation of the recipient’s liver volume may result in small-for-size graft syndrome8,9. In major hepatic resection the safety and efficacy of the procedures depends on the accurate calculation of
Table 1 — Showing Frequency distribution of population Age in yearsGenderBMI 20-3031-4041-5051-60>60MaleFemaleUnder WeightNormalOver weightObese 216123945826267250533688016 41.8%23.8%18.2%11.2%5%51.648.410.3%71.2%15.5%3.1%
Fig 1 — USG measurement of left lobe
APFig 3 — USG measurement of right lobe AP
Fig 2 — USG measurement of right lobe DT
Agarwal P, et al. Normative Data of Liver Volume in Indian Adult Population.
Table 5 — Correlations between Liver Volume and BSA
Parameters Age Group
Correlation between BSA20-3031-4041-5051-60>60 and Meanr = 0.07r = 0.066r = 0.129r = -0.076r = -0.30
Liver volume (r)
Table 6 — Correlations between Liver Volume and Demographic variables
Liver VolumeAgeWeightHeightBMIBSA (in years)(in kg)(in M)
existing and remnant liver volume10 . The normative chart also has implications for clinical practice as using the available reference charts, frequency of hepatomegaly in the absence of other findings of liver disease may lead to unnecessary consultations, laboratory tests, with associated unnecessary cost and uncertainty for the affected families 1,11 .
There is no perfect way to measure liver volume as this cannot be done with the organ in-situ. Liver diameters can be measured by CT/MRI scans12 , however; these imaging modalities are expensive, less mobile/accessible; moreover, radiation exposure associated with CT and claustrophobia associated with MRI are additional disadvantages13,14. It should also be noted that the volume measurements determined by the liver segmentation and analysis software has not been compared to actual liver volumes with the error of the CT volumetry is ~ 5%10% 15,16 . Ultrasonography is a non-invasive, inexpensive, safe, quick, radiation-free and accurate method for measurement of liver size17. Only a limited number of studies of normative liver size have been published and there are few Indian studies which have been done in paediatric population1,3
There is evidence to prove that there is a direct correlation between the body indices and the liver volume as it reflects the individual’s hepatic metabolic demands18 . Body habitus such as BSA and BMI are the most important factors associated with the liver dimensions though age and gender also to a lesser degree influence the size of the liver19-21
Exact correlation of liver volume with age is not known; in children liver volume increases with age22. In adults the liver volume would decrease with aging. However, decrease in liver volume may not produce a decrease in liver function 23 . Some studies did not find a significant difference between the two genders in liver
dimensions 11,20. but other studies demonstrated significantly larger liver in men24 . Our study showed that liver volume is less in females may be due to their shorter stature, less weight and less BMI. The liver volume became smaller in both male and females along with aging. Females have decreased in liver volume at least a decade later as compared to male due to hormonal differences between the genders. Oestrogen was found to be a hepatotropic factor, which could facilitate liver regeneration 25 Some studies show liver volume significantly correlated with BSA but weak correlation with BMI indicates that liver volume increases proportionally with BSA not obesity status per se26 . However, in our study liver volume significantly correlated with BMI and not with BSA. Liver size also differs between ethnic groups possibly due to different BMI and body size11,20,21
Our study provides a standard set of normal range of liver volume according to age, gender, BMI and BSA of adults determined by ultrasonography. We recommend measuring the liver volume and comparing it with the reference charts in cases of liver disease. Limitation of study include all measurements were obtained by a single radiologist hence inter-observer variation could not be accounted for. On the other hand by having all measurements performed by one radiologist, we have achieved a high level of standardization.
CONCLUSION
Normative data on the liver volume in Indian adult population correlate with age, weight, height, BMI and BSA and all the factors were correlated significantly except BSA.
Funding : Nil
Conflict of Interest : The authors declare no competing interests.
REFERENCES
1Amatya P, Shah D, Gupta N, Bhatta NK — Clinical and ultrasonographic measurement of liver size in normal children. Indian J Pediatr 2014; 81(5): 441-5.
2da Rocha APSF SMS, de Oliveira IRS, Widman A, Chammas MC, de Oliveira LAN, Cerri GG — Sonographic determination of liver size in healthy newborns, infants and children under 7 years of age. Radiol Bras 2009; 42(1): 7-13.
3Dhingra B, Sharma S, Mishra D, Kumari R, Pandey RM, Aggarwal S — Normal values of liver and spleen size by ultra-
Agarwal P, et al. Normative Data of Liver Volume in Indian Adult Population.
Vol 123, No 10, October 2025Journal of the Indian Medical Association
sonography in Indian children. Indian Pediatr 2010; 47(6): 48792.
4Tutar UN, Irba, Ozt R, Sevmi S, Ayahan Ulu EM, Co Un M, et al — Computed tomography volumetric follow-up of graft volume in living related liver recipients. Transplant Proc 2007; 39(4): 1175-7.
5Joshi R, Singh A, Jajoo N, Pai M, Kalantri SP — Accuracy and reliability of palpation and percussion for detecting hepatomegaly: a rural hospital based study. Indian J Gastroenterol 2004; 23: 171-4.
6Jessie TC, Kerry AT, Adrian JE — The development of a practical and uncomplicated predictive equation to determine liver volume from simple linear ultrasound measurements of the liver. Radiography 2016, 22(2): 125-30.
7Hausken T, Leotta DF, Helton S, Kowdley KV, Goldman B, Vaezy S, et al — Estimation of the human liver volume and configuration using three-dimensional ultrasonography; effect of a high-caloric liquid meal. Ultrasound Med Biol 1998; 24: 1357-67.
8Nakayama Y, Li Q, Katsuragawa S, Ikeda R, Hiai Y, Awai K, et al — Automated hepatic volumetry for living related liver transplantation at multisection CT. Radiology 2006; 240(3): 743-8.
9Singh V, Singh K, Singh D, Nain CK, Sodhi L — Liver span and weight in health and disease. Trop Gastroenterol 1999; 20(2): 73-4.
10Starzl TE — History of liver and other splanchnic organ transplantation. In: Busutill RW, Klintmalm GB, eds. (1996) Transplantation of the Liver:3-22. Philadelphia.
11Thapa NB, Shah S, Pradhan A, Rijal K, Pradhan A, Basnet S — Sonographic assessment of the Normal dimensions of liver, spleen, and kidney in healthy children at tertiary care hospital. Kathmandu Univ Med J (KUMJ) 2015; 13(52): 286-91.
12D’Onofrio M, De Robertis R, Demozzi E, Crosara S, Cannestrini S, Mucelli RP — Liver volumetry: Is imaging reliable? Personal experience and review of the literature. World J Radiol 2014; 6(4): 62-71.
13McCollough CH, Primak AN, Braun N, Kofler J, Yu L, Christner J — Strategies for reducing radiation dose in CT. Radiol Clin North Am 2009; 47(1): 27-40.
14Spouse E, Gedroyc WM — MRI of the claustrophobic patient; interventionally configured magnets. Br J Radiol 2014; 73(866): 146-51.
16Schiano TD, Bodian C, Schwartz ME, Glajchen N, Min AD — Accuracy and significance of computed tomographic scan assessment of hepatic volume in patients undergoing liver transplantation. Transplantation 2000; 69(4): 545-50.
17Megremis SD, Vlachonikolis LG, Tsilimigaki AM — Spleen length in childhood with US: Normal values based on age, sex and somatometric parameters. Radiology 2004; 23: 12934.
18Lewis RC, Duval A, Iliff A — Standards for the basal metabolism of children from 2 to 15 years of age, inclusive. J Pediatr 1943; 23: 1-18.
19Kratzer W, Fritz V, Mason RA, Haenle MM, Kaechele V — Roemerstein study group. (2003) Factors affecting liver size: a sonographic survey of 2080 subjects. J Ultrasound Med 2003; 22 (11): 1155-61.
20Konus OL, Ozdemir A, Akkaya A, Erbas G, Celik H, Isik S — Normal liver, spleen, and kidney dimensions in neonates, infants, and children: evaluation with sonography. AJR Am J Roentgenol 1998; 171(6): 1693-8.
21Dittrich M, Milde S, Dinkel E, Baumann W, Weitzel D — Sonographic biometry of liver and spleen size in childhood. Pediatr Radiol 1983; 13(4): 206-11.
22Yang X, Wang H, Dong B, Hu B, Hao X, Chen X, et al — Standard Liver Volume-Predicting Formulae Derived From Normal Liver Volume in Children Under 18 Years of Age. Front Pediatr 2021; 19(2): 9:629645. doi: 10.3389/ fped.2021.629645.
23Wynne HA, Cope LH, Mutch E, Rawlins MD, Woodhouse KW, James OF — The effect of age upon liver volume and apparent liver blood flow in healthy man. Hepatology 1989; 9(2): 297-301. doi: 10.1002/hep.1840090222. PMID: 2643548.
24Waelti S, Fischer T, Wildermuth S, Leschka S, Dietrich T, Guesewell S, et al — Normal sonographic liver and spleen dimensions in a central European pediatric population. BMC Pediatr 2021; 21(1): 276. doi: 10.1186/s12887-021-02756-3. PMID: 34116649; PMCID: PMC8194166.
25Biondo-Simoes MLP, Erdmann TR, Ioshii SO, Matias JE, Calixto HL, Schebelski DJ — The influence of estrogen on liver regeneration: an experimental study in rats. Acta Cirurgica Brasileira 2009; 24(1): 3-6. https://doi.org/10.1590/s010286502009000100002 PMID: 19169534.
26Hosey-Cojocari C, Chan SS, Friesen CS, Robinson A, Williams V, Swanson E, et al — Are body surface area based estimates of liver volume applicable to children with overweight or obesity? An in vivo validation study. Clin Transl Sci 2021; 14(5): 2008-16. doi: 10.1111/cts.13059.
Original Article
Understanding Hesitancy in HPV Vaccine Uptake among Young Adults : A Delphi Study
Background : Human Papillomavirus (HPV) vaccines play a crucial role in preventing HPV-related diseases, including cervical cancer. Despite proven efficacy, vaccine uptake among young adults remains suboptimal. This study employs the Delphi technique to explore factors contributing to hesitancy in HPV vaccine uptake among young adults. By engaging a panel of experts from diverse fields, we aim to identify key barriers and propose strategies to enhance vaccine acceptance. The panel proposed several strategies to increase HPV vaccine uptake like Educational Campaigns, Enhanced Healthcare Provider Training, Community Engagement, Policy Interventions, Peer-Led Initiatives.
Key words : Delphi Technique, Human Papillomavirus Vaccine, Vaccine Hesitancy, Health Policy, Health Administration.
Human Papillomavirus (HPV) is one of the most common sexually transmitted infections globally, with significant health implications including cervical, anal, oropharyngeal, and other genital cancers, as well as genital warts. The development of HPV vaccines marks a major advancement in public health, offering a safe and effective means to prevent HPVrelated diseases. Despite the vaccine’s availability and the compelling evidence supporting its efficacy, vaccination rates among young adults remain disappointingly low in many regions1
The significance of improving HPV vaccine uptake cannot be overstated. Higher vaccination rates can lead to substantial reductions in the incidence of HPVrelated cancers, thereby decreasing healthcare costs and improving quality of life2. Moreover, achieving high vaccination coverage is critical for herd immunity, which provides indirect protection to those who are unvaccinated or unable to mount an immune response.
Department of Community Medicine, Diamond Harbour Government Medical College and Hospital, Diamond Harbour, West Bengal 743331
1MD (Community Medicine), Assistant Professor
2MD (Community Medicine), Assistant Professor and Corresponding Author
3MD (Community Medicine), Assistant Professor, PKG Medical College & Hospital, Kolkata 700060
4MD (Community Medicine), Assistant Professor 5MD (Community Medicine), Associate Professor 6MBBS, Consultant Physician and Intenvist, Belle Vue Clinic, Kolkata 700105
Received on : 10/01/2025
Accepted on : 11/04/2025
Editor's Comment :
Expert Consensus: Delphi method gathers anonymous expert opinions to identify common themes on HPV vaccine hesitancy.
Key Hesitancy Factors: Misinformation, safety concerns, cultural beliefs, and low awareness are major contributors. Healthcare Providers’ Role: Clear communication and trusted recommendations from healthcare providers are crucial.
Demographic Influence: Hesitancy varies by age, education, and socio-economic status, requiring tailored strategies. Mitigation Strategies: Public health campaigns, education, and community engagement help address hesitancy and build trust.
Understanding the reasons behind vaccine hesitancy among young adults is essential for public health professionals and policymakers. Vaccine hesitancy— a delay in acceptance or refusal of vaccines despite availability of vaccination services – is a complex phenomenon influenced by a myriad of factors including individual beliefs, social influences and systemic barriers. Addressing this hesitancy is crucial for the success of vaccination programs and the longterm control of HPV1
The Delphi technique, with its structured method of achieving consensus among experts, is particularly well-suited for exploring the multifaceted issue of vaccine hesitancy. This study employs the Delphi technique to gather insights from a diverse panel of experts, aiming to identify the key barriers to HPV vaccine uptake among young adults and to propose effective strategies to overcome these barriers.
How to cite this article : Understanding Hesitancy in HPV Vaccine Uptake among Young Adults : A Delphi Study. Haldar D, Chakraborty S, Pal A, Chatterjee A, Naskar S, Kole S. J Indian Med Assoc 2025; 123(10): 49-52.
MATERIALS AND METHODS
The Delphi technique involves multiple rounds of surveys to gather insights from a panel of experts. This study included three rounds of surveys, each designed to refine the understanding of hesitancy factors and potential solutions.
(1) Panel Selection : Experts in public health, epidemiology, psychology, healthcare communication, and young adult health were selected. The panel comprised 20 participants, ensuring diverse perspectives.
(2) Round One : Open-ended questions were used to identify initial themes related to HPV vaccine hesitancy. Experts were asked to share their insights on the main reasons for low vaccine uptake and suggest strategies to address these issues.
(3) Round Two : Responses from Round One were analyzed to identify common themes. These themes were then presented to the panel in a structured questionnaire. Experts rated the importance of each factor and the feasibility of proposed strategies on a Likert scale.
(4) Round Three : The results from Round Two were shared with the panel for further refinement. Experts were asked to re-evaluate their ratings in light of the group’s feedback to reach a consensus.
RESULTS
The Delphi process revealed several key factors contributing to HPV vaccine hesitancy among young adults (Table 1) :
(1) Lack of Awareness and Knowledge: Many young adults are unaware of the HPV vaccine and its benefits. Misconceptions about the vaccine, such as concerns about safety and side effects, are prevalent.
(2) Perceived Risk: Young adults often underestimate their risk of contracting HPV, believing it to be irrelevant to their personal health.
(3) Cultural and Social Influences: Cultural beliefs and social norms significantly influence vaccine acceptance. In some communities, discussing sexual health openly is taboo, leading to lower vaccine uptake.
(4) Healthcare Provider Recommendations: The role of healthcare providers is crucial. Lack of strong recommendations from providers contributes to hesitancy.
Table 1 — Responses from the panel of experts Participating in the Delphi study
Factors Influencing Responses
HPV Vaccine Hesitancy
Lack of Awareness and Knowledge
Many young adults are unaware of the HPV vaccine and its benefits.
Misconceptions about the vaccine, such as concerns about safety and side effects are prevalent.
Perceived Risk
Cultural and Social Influences
Healthcare Provider Recommendations
Accessibility and Convenience
Peer Influence
Young adults often underestimate their risk of contracting HPV, believing it to be irrelevant to their personal health.
Cultural beliefs and social norms significantly influence vaccine acceptance. In some communities, discussing sexual health openly is taboo, leading to lower vaccine uptake.
The role of healthcare providers is crucial. Lack of strong recommendations from providers contributes to hesitancy.
Barriers such as cost, availability and convenience of vaccination services affect uptake.
Social circles and peer opinions play a significant role in shaping attitudes towards vaccination.
(5) Accessibility and Convenience: Barriers such as cost, availability, and convenience of vaccination services affect uptake.
(6) Peer Influence: Social circles and peer opinions play a significant role in shaping attitudes towards vaccination.
Based on these findings, the panel proposed several strategies to increase HPV vaccine uptake:
(1) Educational Campaigns: Targeted campaigns to raise awareness and educate young adults about the importance and safety of the HPV vaccine.
(2) Enhanced Healthcare Provider Training : Training for healthcare providers to effectively communicate the benefits of the vaccine and address concerns.
(3) Community Engagement: Involving community leaders and influencers to promote positive attitudes towards the vaccine.
(4) Policy Interventions : Policies to make the vaccine more accessible, such as school-based vaccination programs and subsidized vaccine costs.
(5) Peer-Led Initiatives : Encouraging peer-led
Lack of Awareness and Knowledge
Perceived Risk
Cultural and Social Influences
Healthcare Provider
Recommendations
Accessibility and Convenience
Peer Influence
Importance Rating (1-5)
discussions and testimonials to normalize the conversation around HPV vaccination.
Here are the graphical representations of the results from the Delphi study on HPV vaccine hesitancy among young adults:
Fig 2 bar chart displays the average importance rating for each identified factor contributing to vaccine hesitancy.
Fig 3 pie chart shows the distribution of the proposed strategies, highlighting the relative emphasis on each strategy.
Fig 4 flowchart outlines the steps involved in the Delphi study process.
These visualizations help in understanding the key factors and proposed strategies for addressing HPV vaccine hesitancy among young adults, providing a clear and concise overview of the study’s findings.
Panel Selection (Experts diverse fields)
Round One : Open-ended Questions (Identify reasons for low vaccine uptake and suggest strategies)
Analysis of Responses (Identify common themes)
Round Two : Structured Questionnaire (Rate importance and feasibility of identified factors and strategies)
Consensus on Key Factors and Strategies (Refine list based on expert input)
Round Three : Re-evaluation
(Re-evaluate ratings to reach final consensus)
Fig 3 — Flowchart of Delphi Study Process
DISCUSSION
The Delphi study highlights the multifaceted nature of HPV vaccine hesitancy among young adults. Addressing this issue requires a comprehensive approach that includes education, healthcare provider involvement, and community engagement. Tailored interventions that consider cultural and social contexts are essential for improving vaccine acceptance. HPV vaccine hesitancy poses a significant public health challenge worldwide, influencing vaccination rates and potentially impacting future cancer prevention efforts. The Delphi study discussed here sheds light on the multifaceted nature of HPV vaccine hesitancy among young adults, advocating for a comprehensive approach involving education, healthcare provider involvement, and community engagement. This discussion will compare insights from the Delphi study with findings from other global studies, highlighting common themes and regional variations in vaccine hesitancy.
Insights from the Delphi Study
The Delphi study emphasizes several critical points:
(1) Multifaceted Nature: It identifies diverse factors contributing to HPV vaccine hesitancy, including safety concerns, misinformation, and cultural beliefs. Understanding these factors is essential for designing targeted interventions.
(2) Comprehensive Approach : The study underscores the need for a multifaceted strategy that includes education to dispel myths, healthcare
Fig 2 — Bar Chart depicting Key Factors Contributing to HPV Vaccine Hesitancy
Fig 3 — Pie Chart of Proposed Strategies to Increase HPV Vaccine Uptake
Haldar D, et al. Understanding Hesitancy in HPV Vaccine Uptake among Young Adults : A Delphi Study.
123, No 10, October 2025Journal
provider engagement to build trust, and community involvement to address cultural concerns.
(3) Tailored Interventions: Recognizing cultural and social contexts, the study advocates for tailored interventions that resonate with different populations, enhancing vaccine acceptance.
Comparative Insights from Global Studies Research conducted worldwide provides additional insights into HPV vaccine hesitancy:
United States: Studies have highlighted concerns over vaccine safety and efficacy among parents, influenced by misinformation spread through social media (Smith, et al 2020)3.
Europe : Research in various European countries shows differences in vaccine uptake rates influenced by healthcare system factors and varying levels of public trust in vaccines (Larson, et al 2018) 4
Asia-Pacific Region: Studies in this region often cite traditional beliefs and lack of awareness about HPVrelated diseases as barriers to vaccination (Wong, et al 2019) 5
Africa and Latin America : Challenges in these regions include accessibility issues, healthcare infrastructure limitations, and cultural beliefs affecting vaccine acceptance (Pathak, et al 2021)6.
Common Themes and Regional Variations
While factors contributing to vaccine hesitancy may vary by region, several common themes emerge:
Safety Concerns : Misinformation about vaccine safety is prevalent across different regions.
Cultural Influences: Cultural beliefs and norms significantly impact vaccine acceptance.
Healthcare System Factors: Variations in healthcare infrastructure and accessibility affect vaccine uptake.
CONCLUSION
HPV vaccine hesitancy among young adults is a complex issue influenced by various factors. Through the Delphi technique, this study has identified key barriers and proposed strategies to enhance vaccine uptake. Implementing these recommendations can contribute to higher vaccination rates, ultimately reducing the burden of HPV-related diseases.
FUTURE RESEARCH
Further research should focus on evaluating the effectiveness of the proposed strategies in real-world settings. Longitudinal studies could also provide insights into the long-term impact of these interventions on vaccine uptake and HPV-related health outcomes. In conclusion, addressing HPV vaccine hesitancy requires a nuanced understanding of regional dynamics and tailored interventions that consider cultural, social and healthcare system contexts. The Delphi study’s emphasis on a comprehensive approach aligns with findings from global research, highlighting the universal need for education, healthcare provider engagement, and community involvement to improve HPV vaccine acceptance. Future research should continue to explore regional differences and identify effective strategies to enhance vaccine confidence and uptake globally.
Funding : None
Conflict of Interest : None
REFERENCES
1World Health Organization. (2021). Human papillomavirus (HPV) and cervical cancer. WHO.
2Centers for Disease Control and Prevention. (2021). HPV Vaccine Recommendations. CDC.
3Larson HJ, Jarrett C, Schulz WS — Measuring vaccine hesitancy: The development of a survey tool. Vaccine 2018; 36(38): 5271-7. doi:10.1016/j.vaccine.2017.08.069.
4Pathak N, Chawla S, Sheth U — COVID-19 vaccine hesitancy - how can the healthcare sector respond? Front Public Health 2021; 9: 730436. doi:10.3389/fpubh.2021.730436.
5Smith LE, Amlôt R, Weinman J, Yiend J, Rubin GJ — A systematic review of factors affecting vaccine uptake in young children. Vaccine 2020; 38(45): 7149-59. doi:10.1016/ j.vaccine.2020.09.047.
6Wong LP, Alias H, Wong PF, Lee HY, AbuBakar S — The use of the health belief model to assess predictors of intent to receive the COVID-19 vaccine and willingness to pay. Hum Vaccin Immunother 2019; 15(12): 2835-45. doi:10.1080/ 21645515.2019.1630146.
Haldar D, et al. Understanding Hesitancy in HPV Vaccine Uptake among Young Adults : A Delphi Study.
Original Article
Assessment of Safety and Efficacy of Curkey® Pastille when Administered as a Standalone in Children with Viral Upper Respiratory Tract Infection and as an Adjuvant with Antibiotic Treatment
in Bacterial Upper Respiratory Tract Infection : A Randomized, Open-Label Study
Background : Upper Respiratory Tract Infections (URTIs) are caused by a myriad of viruses and bacteria, and commonly affect children. Overuse of antibiotics in children can result in serious side effects. Therefore, it is important to establish a child-friendly formulation that can offer quick and targeted symptomatic relief with minimum side effects. This study evaluated the safety and efficacy of Curkey® pastille (100 mg curcumin) as monotherapy for viral URTI and as an adjuvant with standard care with or without antibiotic therapy in children with bacterial URTI.
Materials and Methods : This was an open-labelled, multi-center, randomized study including 69 children aged 7-12 years. A total of 65 subjects completed the study and were randomized into 3 groups, wherein group A with viral infection received only Curkey® pastille, group B1 (bacterial infection) received only antibiotics, and group B2 (bacterial infection) received Curkey® pastille with antibiotics for 5 days. The outcomes of management after 5±1 day were analyzed in terms of Tonsillopharyngitis Severity Score (TSS), Tonsillopharyngitis Assessment (TPA), Global Assessment of Efficacy and Visual Analogue Scale (VAS).
Results : All three treatments were effective against viral and bacterial infections. The viral sub-group showed significant response within five days of monotherapy with Curkey® pastille. In the bacterial sub-groups, subjects receiving the combination of Curkey® with antibiotics exhibited comparatively quicker improvement of all symptoms than those receiving antibiotics alone. There were no side effects or complications due to Curkey® pastille.
Conclusion : Curkey® pastille effectively alleviated symptoms of viral and bacterial URTIs by delivering active curcumin via buccal mucosal absorption, enhancing the bioavailability of curcumin and making it an excellent adjuvant therapy. Key words : Curkey® Pastille, URTI, Antibiotics, Curcumin.
Upper Respiratory Tract Infections (URTIs) present as self-limited irritation and swelling of the upper airways with associated cough, runny nose, no signs of pneumonia, or a history of chronic obstructive pulmonary disease, chronic bronchitis, emphysema, or any other condition that would account for the symptoms 1 . URTIs are a primary factor in mild morbidity and are frequently seen in both children and adults2, and are one of the leading causes of pediatric visits to hospitals. They have an exorbitant cost to
1MBBS, General Physician, Department of Medicine, Neighbour Care Multispecialty Clinic, Ahmedabad 382481 and Corresponding
Author
2DNB (Pediatrics), Additional Associate Professor, Department of Pediatric Medicine, Bai Jerbai Wadia Hospital for Children, Mumbai 400012
3DNB (Pediatrics), Assistant Professor, Department of Pediatric Medicine, Bai Jerbai Wadia Hospital for Children, Mumbai 400012 4MBA and MHA, Chief Executive Officer, Department of General Medicine, Bai Jerbai Wadia Hospital for Children, Mumbai 400012
Received on : 26/06/2024
Accepted on : 08/09/2024
Editor's Comment :
The buccal absorption technology of Curkey® pastille (100 mg curcumin) enables optimal absorption of curcumin through buccal cavity into the systemic circulation, leading to enhanced bioavailability. It effectively reduces symptoms of viral URTI (when used as monotherapy) and bacterial URTI (when used in combination with antibiotics) among pediatric patients.
society3, Young children are more susceptible to URTIs as their immune systems are developing 4
Antibiotics are often prescribed for URTIs due to the risk of secondary bacterial infections and the uncertainty regarding diagnosis 5. Antibiotics deplete the healthy bacteria in the gut, thus weakening immunity and increasing susceptibility to secondary bacterial infection. Natural antibiotic alternatives can interrupt this cycle6. Curcumin is a naturally-occurring active compound extracted from the rhizome of Curcuma longa, which has been used in traditional
How to cite this article : Assessment of Safety and Efficacy of Curkey® Pastille when Administered Standalone in Children with Viral Upper Respiratory Tract Infection and as an Adjuvant with Antibiotic Treatment in Bacterial Upper Respiratory Tract Infection : A Randomized, Open-Label Study. Patel N, Venkatesh S, Kalelkar R, Bodhanwala M. J Indian Med Assoc 2025; 123(10): 53-8.
123, No 10, October 2025Journal
Asian medicine based on the range of molecular targets involved in oxidation, bacterial and parasite activity, inflammation, etc7-11
Curcumin exhibits antiviral properties by altering the surface protein of viruses, preventing viral entrance and virus budding. Curcumin has rapid metabolism, low intestinal absorption, and lower toxicity at high dosages in humans (up to 12 g/day) 12 . When curcumin is administered orally, it undergoes firstpass metabolism before entering systemic circulation at substantially lower concentrations. Curcumin absorption can be improved by administering it through the buccal mucosa. Since curcumin is lipophilic in nature, its principal transport method is passive translocation through the buccal mucosal lipid membrane. Carrier proteins and channel proteins can assist curcumin to diffuse through the membrane to achieve maximum absorption11.
A child-friendly product that is both safe to use and provides targeted delivery of ingredients is beneficial in the management of URTI. Curkey® is a novel curcumin preparation with improved bioavailability from a unique pastille formulation comprising of a curcumin-protein conjugate, which is intended to dissolve or disintegrate slowly in the mouth. The bioavailability of curcumin in pastille form in the buccal mucosa is reported to be 9 times higher than curcumin in hard gelatin capsules ingested orally. Curkey® pastille remains in contact with the buccal mucosa for a prolonged period of time to provide its desired effect and hence it is the best alternative for traditional remedies which are not child-friendly and cause unnecessary adverse effects. Because the medication does not enter through the digestive system, it avoids first-pass metabolism and boosts the bioavailability of the medication, thus accelerating the onset of action as compared to oral treatment13
The present study evaluated the comparative safety and efficacy of Curkey® pastille when used as a standalone remedy for viral URTI and as an adjuvant with standard care with and without antibiotic treatment in children with bacterial URTIs.
MATERIALS AND METHODS
Study Design :
The present study was an open-label, multi-center, comparative, randomized clinical study to evaluate the efficacy and safety of Curkey® pastille when administered with standard treatment, in acute, viral,
uncomplicated URTIs and in combination with standard antibiotics in acute uncomplicated bacterial URTIs in comparison with standard antibiotic treatment alone in children. The multi-centric study was conducted at Bai Jerbai Wadia Hospital, Mumbai, and Neighbour Care Multispeciality Outpatient Department (OPD) clinic, Ahmedabad as per the clinical trial protocol, reviewed and approved by Institutional Review Board (IRB) and Institutional Ethics Committee (IEC) IEC constituted and functioning in accordance with section 3 of ICH E6 regulation and was registered at the Clinical Trials Registry, India (https://www.ctri.nic.in/) with the unique identifier CTRI/2022/05/042564. The IEC approval was received for protocol IEC-BJWHC/SP/2018/07V4 (Mumbai center) and AZ-C-RMA-17-102 (Ahmedabad center).
Subject Selection :
Eligibility criteria were age between 7 to 12 years; tonsillopharyngitis severity score <5; sore throat pain rated >66 mm on the sore throat pain intensity scale; fever >98.6°F, the onset of first symptoms of uncomplicated infection and inflammatory disease of the pharynx; willing to sign the informed consent (given by the parent/legal guardian) and participate in the study.
Cases with the following conditions were excluded: history of bronchitis; severe pharyngitis; severe tonsillitis; highly infected and inflamed tonsillitis; gastrointestinal, hepatic, or renal dysfunction; hypersensitivity to aspirin or other nonsteroidal antiinflammatory drugs and components of Curkey®. Subjects were not enrolled if they exhibited confounding features of URTI such as mouth breathing, dry throat, or coughing. This included cases who had used antibiotics for acute illness in the previous week, or quinolone antibiotics or inhaled therapy in the previous week.
Sample Size Calculation :
A total of 84 subjects was planned to be included in the study to get evaluable for Group A- 12 patients and Group B- 56 patients. For group A, assuming an improvement of 5 points in Tonsillopharyngitis Severity Score (TSS), a sample size of 12 subjects will be required to be recruited for 80% power at the 5% level of significance. Assuming that 20% of the randomized subjects may not be evaluable due to dropout, a total of 20 subjects will be enrolled for this arm. For group B, at a power of 80%, significance level of 5%, SD=4, meaningful clinical difference between groups for the Patel N, et al. Assessment of Safety and Efficacy of Curkey® Pastille.
change in TSS score from baseline to be 3, sample size per arm will be 28, The total number of subjects required across both arms would be 56.
Randomization and Treatment
Screening and randomization were done on Visit 1 (day 1). A total of 69 patients were enrolled, out of which 65 subjects completed the study. Categorization of viral and bacterial infection was made on the basis of symptoms and case history, as per defined criteria14 . Study groups were group A (viral infection) including 11 subjects and group B (bacterial infection) including 56 subjects. Group B was further grouped into two treatment arms, wherein group B1 was randomized with 28 subjects and group B2 was randomized with 26 subjects. Physical examination, prior concomitant medication, vital signs like pulse rate, respiratory rate were recorded.
Group A was administered with test formulation (one Curkey® pastille of 100 mg curcumin), three times a day for the first 2 days followed by one pastille two times for the next 2 days. Group B1 was given amoxicillin 20 mg/kg twice daily for 5 days. Group B2 was given amoxicillin 20 mg/kg twice daily for 5 days and one Curkey® pastille, three times a day for the first 2 days followed by one pastille two times for the next 2 days.
Study Endpoints :
Efficacy endpoints were evaluated on visit 1 (day 1), visit 2 (3±1 day), and visit 3 (5 ±1 day). Visual Analog Scale (VAS) scoring for throat infection, TonsilloPharyngitis Assessment (TPA), and Tonsillopharyngitis Severity Score (TSS) were recorded. The TPA assessed oral temperature, oropharyngeal color, tonsil size, number of oropharyngeal exanthems, number of anterior cervical lymph nodes, maximum tenderness of a few anterior cervical lymph nodes, size of the largest anterior cervical lymph nodes, and size of the anterior cervical lymph nodes. The TSS evaluated sore throat, difficulty in swallowing, increased salivation, and redness of the throat.
The URTI questionnaire, TPA, Sore Throat Pain Intensity Scale (STPIS), Difficulty Swallowing Scale (DSS), and Swollen Throat Scale (SwoTS) were used to assess sore throat discomfort. At presentation, patients were assessed using the URTI questionnaire (nasal congestion, sneezing, runny nose, fever, cough and sore throat). Global Efficacy assessment was carried out using a 5-point scale (1- very good improvement; 2- good improvement; 3- moderate
improvement, 4- negligible improvement; 5- worse). All outcomes were reported by parent/legal guardian in patient diary. All outcomes were reported by principal investigator in case report form.
Global Tolerability assessment was evaluated based on 4 point scale having a rating of 1 as excellent tolerability (No adverse event reported), rating of 2 as good tolerability (Mild adverse event), 3 rating as satisfactory or fair tolerability (Moderate to severe adverse event) and 4 as poor tolerability with severe or serious adverse events. A diary was maintained by the parent/legal guardian to record compliance, and was evaluated on visit 2 (day 3±1) and visit 3 (day 5±1).
Evaluation parameters included a proportion of subjects with a reduction of TSS of 50%, global assessment of efficacy, VAS, and TPA.
Statistical Analysis :
Data was analyzed using SPSS. Randomization was done by using seed 29063 randomization plan such that the design was balanced. For comparison with a group, paired sample t-test was used whereas for comparison between groups, ANOVA test was carried out. Continuous variables were expressed as mean ± Standard Deviation (SD).
RESULTS
Patient Population :
A total of 69 patients with viral and bacterial URTIs were enrolled (44 from the Ahmedabad center and 25 from the Mumbai center), of whom 65 patients completed the study (44 from the Ahmedabad center and 21 from the Mumbai center [two subjects dropped out and two were lost to follow-up]). Group A included 11 children (mean age 8.636 ± 1.748 years), group B1 included 28 children (mean age 8.308 ± 1.258 years), and group B2 included 26 children (mean age 8.615 ± 1.499 years). Table 1 depicts the demographic characteristics of group A and group B subjects on visit 1 and visit 2. Pulse rate, respiratory rate, weight, BMI, and temperature were within the normal range.
Safety Parameters :
The treatment was well tolerated by the patients of all groups. There were no side effects or complications due to Curkey® pastille.
Clinical Condition Based on Symptoms :
Participants in Group A experienced a significant reduction in URTI symptoms such as sore throat,
N, et al. Assessment of Safety and Efficacy of Curkey® Pastille.
Table 1 — Demographic characteristics of patients
DemographicGroup A Group B1Group B2 characteristics (Mean ± SD)(Mean ± SD)(Mean ± SD) (no of visit)
dysphagia, erythema, common cold, sinusitis, and laryngitis at visit 3. URTI symptoms were significantly reduced after 5 days of treatment with Curkey® pastille. Compared with group B1, there was a statistically significant reduction in sore throat, dysphagia, erythema, common cold, sinusitis, and laryngitis in favour of combination therapy in group B2.
Tonsillopharyngitis Severity Score :
Group A treated with Curkey® pastille showed a statistically significant (P=0.00) reduction in total TSS by 96.3% on visit 3 from the baseline. Groups B1 and B2 showed reduction in TSS at the end of the treatment. Group B2, treated with Curkey® and antibiotics, showed a statistically significant reduction in TSS by 99.49% on visit 3, whereas group B1 (treated only with antibiotics) showed a reduction in TSS by 97.26% from the baseline (p=0.806).
Visual Analogue Scale Analysis : STPIS, DSS and SwoTS
After 5 days of treatment with Curkey® pastille, Group A showed a significant reduction of 95.20% (P=0.00), 96.40% (P=0.00) and 95.45% (P=0.00) in STPIS, DSS and SwoTS, respectively, from the baseline scores. Reduction of STPIS, DSS and SwoTS values from baseline in group B1 were 97.92%, 99.40%, and 97.50%, respectively. Group B2 showed 100% reduction from the baseline to visit 3 in STPIS, DSS and SwoTS (significant improvement as compared with group B1; Table 2).
Tonsillo-Pharyngitis Assessment (TPA) :
After 5 days of treatment with Curkey® pastille, the TPA scores of group A were reduced. There was a 100% reduction in TPA score at visit 3 for Group B2 (Table 3).
Global Assessment :
For group A, the global assessment of the efficacy of treatment was rated 1 ± 0 and 1.09 ± 0.302 by the investigator and patient, respectively, while the global assessment of tolerability was 1.82 ± 0.751 and 1.64 ± 0.505 by investigator and patient, respectively. Global assessment of efficacy treatment was found to be 1.12±0.326 and 1.15±0.464 for group B2, whereas for group B1 it was found to be 1.11±0.315 and 1.11±0.315 as given by investigator and patient respectively. Tolerability of the treatment for group B1 was found to be highest with 1.14±0.356 and 1.18±0. 390, whereas for group B2 it was found to be the 1.12±0.326 and 1.15±0.368, by investigator and patient respectively.
DISCUSSION
This prospective, randomized study was intended to investigate the safety and efficacy of Curkey® pastille in children suffering from viral and bacterial URTI’s.
Table 2 — Improvement in STPIS, DSS and SwoTS for the three treatment groups
VASNo of visitsGroup AP valueGroup B1Group B2P value (for group B [B1 and B2]
Parameter (Mean ± SD)(Mean ± SD)(Mean ± SD) between visit 3 and baseline)
Note : Data is provided as Mean ± SD; DSS: Difficulty Swallowing Scale; SD: Standard Deviation; STPIS: Sore Throat Pain Intensity Scale; SwoTS : Swollen Throat Scale; VAS : Visual Analog Scale.
Patel N, et al. Assessment of Safety and Efficacy of Curkey® Pastille.
Table
3 — Tonsillo-Pharyngitis Assessment
TPANo of visitsGroup AP valueGroup B1Group B2P value (for group B [B1 and B2] (Mean ± SD)(Mean ± SD)(Mean ± SD)between visit 3 and baseline)
Note : Data is provided as Mean ± SD; SD: Standard Deviation; TPA : Tonsillo-Pharyngitis Assessment.
The most remarkable outcome from the study is that Curkey® pastille is effective at reducing the symptoms of URTI with no adverse reactions. Prior research suggests that, antibiotic usage to treat acute URTI in children has recently increased which weakens their developing immune system, and hence it is important to minimize the frequency of antibiotic use in children. The indiscriminate use of antibiotics has resulted in extensive resistance among microorganisms and reemergence of old infectious diseases. Therefore, nonsynthetic alternatives can be employed in treating infectious ailments independently for viral URTIs or in combination with antibiotics for bacterial URTIs15
When an antibiotic is no longer effective as a therapeutic drug, synergistic action becomes even more important 16 . Curcumin in novel pastille formulations is proven to offer an effective and costfriendly method of fighting antibiotic-resistant bacteria.
The treatment formulation (Curkey®) of a soft pastille containing 100 mg of curcumin, a potent antiinflammatory extracted from turmeric, is a concentrated dose with 30× power, since the natural turmeric powder contains only 3-4% curcumin. Furthermore, conventional curcumin exhibits poor bioavailability when consumed orally due to poor gastrointestinal absorption and rapid metabolism. In order to overcome these limitations, Curkey® pastille was formulated with curcumin-protein conjugate that
ensured sustained release of curcumin through the buccal mucosa. Curkey® pastille offers quick relief from soreness, itchiness, swelling, and irritation of the throat, and also builds respiratory immunity to fight viral and bacterial infections. Our study showed improvement in all groups after administration of Curkey® pastille with significant decrease in TSS score at the end of the study.
The TPA, a measure of characteristic clinical symptoms of pharyngitis, affirmed the homogeneity of the diagnosis. The severity of the physical condition causing the sore throat was also validated by measurements on the TPA in the subjects of treatment groups17-19 . Evaluation of TPA was performed at all visits and a significant reduction was observed for all treatment groups after visit 3. The subjects from group A showed significant improvement from the baseline, and group B2 showed rapid improvement in comparison with group B1 for all parameters of TPA. Furthermore, STPIS, DSS, and SwoTS were performed by using VAS to measure discomfort of sore throat. Based on the results, it was demonstrated that Curkey® pastille along with antibiotics provided significant relief from throat discomfort, inflammation, and swelling in comparison to treatment with antibiotics alone. Another important parameter evaluated was the Global Assessment of the efficacy
123, No 10, October 2025Journal
of the treatment and tolerability, which demonstrated that Curkey® pastille led to symptomatic relief without adverse reactions in any of the treatment groups, indicating a good tolerability.
Based on the questionnaire analysis, we found that all three treatments administered to subjects were effective. The viral sub-group showed significant response within five days of standalone therapy with Curkey® pastille. In the bacterial sub-groups, subjects receiving the combination therapy of Curkey® pastille with antibiotics exhibited significantly quicker improvement of all symptoms of URTI than the bacterial sub-group receiving antibiotics alone.
Our research study confirms that Curkey® pastille is an effective alternative as monotherapy for viral URTI and an excellent adjuvant with antibiotics for bacterial URTIs. The efficacy in reducing symptoms associated with viral and bacterial-infected URTIs can be attributed to its proprietary technology that delivers active curcumin via buccal mucosal absorption, which enhances the bioavailability of curcumin. The compliance to Curkey® pastille was 100%, indicating that the flavor is palatable and acceptable by the pediatric population. One limitation of this study is that data and conclusions were based on a limited population particular to a specific region.
In summary, Curkey® pastille with its proprietary technology enables optimal absorption of curcumin not just in the throat but also through the systemic circulation via buccal absorption. As curcumin only makes up 3% of turmeric, 30 glasses of turmeric milk would be needed to achieve the same results as one Curkey® pastille. Curkey® pastille is an excellent choice in treating viral URTIs independently or in combination with antibiotics for bacterial URTIs. This study provides clinical evidence of significant reduction in viral URTI symptoms within five days of monotherapy with Curkey® pastille that could reduce the irrational usage of antibiotics. In the bacterial subgroups, the combination therapy of Curkey® pastille with antibiotics exhibited comparatively quicker improvement of all symptoms of URTI than antibiotics alone, making it an effective adjuvant with antibiotics for managing bacterial URTI. The enhanced bioavailability and consumer-friendly formulation makes Curkey® pastille an excellent choice for quicker symptomatic relief in viral and bacterial URTI.
Funding : None
Conflict of Interest : None
REFERENCES
1Thomas M, Bomar PA — Upper Respiratory Tract Infection. In: StatPearls . Treasure Island (FL): StatPearls Publishing; June 27, 2022.
2Cotton M, Innes S, Jaspan H, Madide A, Rabie H Management of upper respiratory tract infections in children. S Afr Fam Pract (2004) 2008; 50: 6-12.
3Korppi M, Heikkilä P, Palmu S, Huhtala H, Csonka P — Antibiotic prescribing for children with upper respiratory tract infection: A Finnish nationwide 7-year observational study. Eur J Pediatr 2022; 181: 2981-90.
4Wang Y, Eccles R, Bell J, Chua AH, Salvi S, Schellack N, et al — Management of acute upper respiratory tract infection: the role of early intervention. Expert Rev Respir Med 2021; 15: 1517-15.
5Ogal M, Johnston SL, Klein P, Schoop R — Echinacea reduces antibiotic usage in children through respiratory tract infection prevention: A randomized, blinded, controlled clinical trial. Eur J Med Res 2021; 26: 33.
6Gaash B — Irrational use of antibiotics. Indian J Practising Doctor 2008; 5: 3-4.
7Jassim SAA, MA Naji — Novel antiviral agents: A medicinal plant perspective. J Appl Microbiol 2003; 95: 412-27.
8Ukil A, Maity S, Karmakar S, Datta N, Vedasiromoni JR, Das PK — Curcumin, the major component of food flavor turmeric, reduces mucosal injury in trinitrobenzene sulphonic acid-induced colitis. Br J Pharmacol 2003; 139: 209-18.
9Sahebkar A, Serban MC, Ursoniu S, Banach M — Effect of curcuminoids on oxidative stress: A systematic review and meta-analysis of randomized controlled trials. J Funct Foods 2015; 18: 898-909.
10Shakeri A, Panahi Y, Johnston TP, Sahebkar A — Biological properties of metal complexes of curcumin. Biofactors 2019; 45: 304-17.
11Chattopadhyay I, Biswas K, Bandyopadhyay U, Banerjee RK — Turmeric and curcumin: Biological actions and medicinal applications. Curr Sci 2004; 87: 44-50.
12Shakeri, A. Sahebkar A — Optimized curcumin formulations for the treatment of Alzheimer’s aisease: A patent evaluation. J Neurosci Res 2016; 94: 111-3.
13Menon S, Mhatre M, Rajarshi M, Thakkar J — Bioavailability of curcumin from a novel mouth dissolving lozenge. Int J Basic Clin Pharmacol 2018; 7: 561-8.
14DeMuri GP, Wald ER — Acute bacterial sinusitis in children. N Engl J Med 2012; 367(12): 1128-34.
15Chanda S, Rakholiya K — Combination therapy: Synergism between natural plant extracts and antibiotics against infectious diseases. Science against Microbial Pathogens: Communicating Current Research and Technological Advances. 2011.
16Bhardwaj M, Singh BR, Sinha DK, Kumar V, Prasanna Vadhana OR, Singh V, et al — Potential of herbal drug and antibiotic combination therapy: A new approach to treat multidrug resistant bacteria. Pharm Anal Acta 2016; 7: 1000523.
17Aspley S, Schachtel BP, Berry P, Shephard A, Shea T, Smith G, et al — Flurbiprofen lozenges in patients with a “bad sore throat”. J Pain 2013; 14: S59.
18Schachtel BP, Pan S, Kohles JD, Sanner KM, Schachtel EP, Bey M — Utility and sensitivity of the sore throat pain model: results of a randomized controlled trial on the COX-2 selective inhibitor valdecoxib. J Clin Pharmacol 2007, 47: 860-70.
19Schachtel BP, McCabe D, Berger M, Zhang R, Sanner KM, Savino L, et al — Efficacy of low-dose celecoxib in patients with acute pain. J Pain 2011; 12: 756-63.
Patel N, et al. Assessment of Safety and Efficacy of Curkey® Pastille.
Case Series
Limberg Transposition Flap in Treatment of Sacro-coccygeal Pilonidal Sinus : A series of 14 Cases
Background : Sacro-coccygeal pilonidal sinus is a condition most commonly seen among young adult male population. There are several treatment options, mainstay being surgery. Conventional surgical method of simple excision of the sinus with midline primary closure results in high rates of recurrences, so discontinued. Thus, flap reconstruction is preferred.
Materials and Methods : Study design : A case series – a prospective, longitudinal, interventional study. Study period: March, 2019 to February, 2024 (5 years). Sample Size : 14 cases. Methodology : Limberg Transposition Flap was done in all 14 cases. They were discharged from the hospital with drain in-situ which was removed on following visits once collection was <10 ml in 24 hours. They were followed up for 6-12 months.
Results : 21.4% (n=3) patients presented with multiple tracts whereas 78.6% (n=11) patients presented with single sinus tract in the sacrococcygeal region. There was no case of Wound Infection or Flap Necrosis. 14.28% (n=2) patients had cut through of sutures. The Mean Postoperative Stay (Mean ± SD) (Days) was 5.43 ± 0.938. The Mean Postoperative Day of Drain Removal (Mean ± SD) (Days) was 19.36 ± 2.170. The Mean Number of Days to Return to Normal Activity (Mean ± SD) (Days) was 23.36 ± 2.205. There were no Recurrences.
Conclusion : Limberg Transposition Flap is an effective surgical procedure to treat patients with pilonidal sinus disease. By this flap, we can escape scarring in the midline. This is cosmetically good and there have been no cases of recurrence in our study.
Apilonidal sinus (PNS) is a small passageway beneath the skin that is commonly present in the sacrococcygeal region1. SC-PSD is an acquired condition usually seen in young adults especially males2. Damaged hair follicles and imprisoned hair are thought to be the cause, leading to folliculitis, infection and rupture into the surrounding subcutaneous tissue leading to a painful, persistent condition1
The pilonidal disease was once assumed to be a congenital ailment produced by aberrant skin in the gluteal cleft, but it is now thought to be an acquired syndrome caused by hair in the cleft. The hair triggers an inflammatory response, resulting in persistent sinus and tract drainage, as well as secondary
Department of General Surgery, Ramakrishna Mission Seva Pratishthan, Vivekananda Institute of Medical Sciences, Kolkata 700026
1MBBS, DNB (General Surgery), FIAGES, FMAS, EFIAGES, Assistant Professor and Corresponding Author
2MBBS, DNB, Associate Professor
3MBBS, MS, Assistant Professor, Department of General Surgery, College of Medicine and Sagore Dutta Hospital, Kolkata
Received on : 16/07/2024
Accepted on : 02/11/2024
Editor's Comment :
Limberg transposition Flap is one of the several effective ways to treat complex pilonidal sinuses that are primary and recurrent both. Still it is rarely carried out as a treatment of pilonidal sinus by general surgeons. This article will guide surgeons to perform more and more flap reconstruction surgeries for pilonidal sinuses.
infection and abscess formation3. Causes are by local trauma, poor hygiene, extreme hairiness, or the existence of a deep natal cleft. This is a benign condition acquired most likely by males, young age group, overweight, and hirsute individuals, as well as those with a positive family history4
There is a visible external opening or pit in the midline of natal cleft. The expansion is induced by the stretching of the follicular openings caused by gravity pulling on the buttocks. Sweating excessively might also lead to the development of PNS. Moisture can fill a stretched hair follicle, creating a low oxygen environment that encourages anaerobic bacterial growth. Bacterial growth and low oxygen levels impede wound healing and hasten the formation of the PNS5
PNS disease can be asymptomatic, acute, chronic,
How to cite this article : Limberg Transposition Flap in Treatment of Sacro-coccygeal Pilonidal Sinus : A series of 14 Cases. Chowdhury D, Mukherjee KA, Rakshit K. J Indian Med Assoc 2025; 123(10): 59-63.
123, No 10, October 2025Journal
or recurrent. The common presenting symptoms are pain (84%), discharge (78%) and localized edema6
A thorough clinical examination, history taking, and radiological investigations like MRI may be necessary for diagnosis and delineation of the tract7.
The main concern for SCC-PSD treatment is the recurrence; the literature review shows that it ranges from 20-40% regardless of the technique used8. Many reasons were attributed to recurrence, such as leaving behind some tracts, sutures in midline causing more trauma with repeated infection accumulation of perspiration and friction with tendency of the hair getting incorporated into the wound9
Several surgical options have been explained in literature for treatment of SC-PSD. Limberg rhomboid flap for sacrococcygeal pilonidal sinus was designed by Limberg in 1946, who described a technique for closing a 60° rhombus-shaped defect with a transposition flap10 . This prospective study has been performed to determine effects of the Limberg flap rotation surgery for sacrococcygeal pilonidal sinus, its feasibility to the patients, their compliance, and outcomes such as wound infection, postoperative pain relief, recurrence rates, and return to work.
CASE PRESENTATIONS
Patients presented with pain, swelling or chronic discharging sinus from the intergluteal cleft.
Swelling was due to small localised abscess arising from the sinus itself. Diagnosis of pilonidal sinus was clinical owing to their position in the sacro-coccygeal region.
MATERIALS AND METHODS
Study design : This is a case series – a prospective, longitudinal, interventional study.
Study area : Patients coming to OPD of Ramakrishna Mission Seva Pratishthan Hospital with pilonidal sinus.
Study period : July, 2019 to June, 2024 (5 years).
Sample Size : 14 cases.
Investigation : All patients were pre-operatively assessed with MRI (Magnetic Resonance Imaging) of the sacro-coccygeal region to delineate the tract/ tracts or any foci of abscess.
Procedure Methodology : Under spinal anaesthesia,
the patient was put in prone position with buttocks strapped apart and surgical site exposed. External opening of the sinus noted. With a 20 Fr IV canula, Hydrogen peroxide and methylene blue was injected into the sinus tract (Fig 1).
Probing of the tract done with a metallic probe to identify the distal extent of the sinus tract.
Multiple openings signified multiple sinus tracts which may be separate or interconnected. Each of the tracts were probed to delineate the exact anatomy and the distal extent of the tracts. Extent was determined by palpation of the tip of the probe after full insertion and marking of the overlying skin (Fig 2).
Then, a rhomboid was marked over the skin with a skin-marking pen, taking all the external openings and the distal ends of the tracts within it (cranio-caudal or lateral extents).
The long axis of the rhomboid in the midline (Craniocaudal) is marked A (above) and C (below). Point A lies beyond the distal extent of the tract. Point C lies in the gluteal cleft adjacent to the perianal skin. This, AC is the cranio-caudal diagonal of the rhombus. The line B-D transects line A-C at their mid-point at right angles and B-D is 60% of the length of A-C. Point B and D are chosen such that they lie beyond the lateral extents of the tracts. D-E is direct continuation of B-D and is equal in length to A-B. E-F is parallel to A-B and is equal in length to A-D. Just like a rhombus, lines AB=BC=CD=AD=DE=EF (Fig 3).
Principle of the surgery is to excise the rhombus ABCD and to cover the area with DEF rotational flap as shown in the picture. Thus, D-E is sutures to B-A, E-F is sutures to A-D, C-D is sutured to C-B (Fig 4).
Painting of the area with 10% Povidone iodine done,
Fig 1 — Injection of hydrogen peroxide and methylene blue via 20 Fr cannula into the tracts
Fig 2 — Probing of the tracts
Chowdhury D, et al. Limberg Transposition Flap in Treatment of Sacro-coccygeal Pilonidal Sinus :
Postoperative Management and Discharge:
and draping of the operative field done. The rhombus ABCD was incised. Skin and subcutaneous fat of the rhombus ABCD with all extensions of the sinus tracts was excised down to the deep fascia and removed. Most of the time, removal had to be done upto the periosteum of the underlying bone (coccyx) (Figs 5&6).
Then, the DEF flap is raised including the skin, subcutaneous fat and the fascia overlying the right gluteus maximus muscle (Figs 7&8).
Then the DEF flap is rotated anticlockwise to cover the midline rhomboidal defect. The defect thus created by the elevation of the DEF flap is closed in linear fashion. Deep absorbable 2-0 polyglactin sutures (vicryl) to appose the fascia and subcutaneous fat were taken over a 16 Fr suction drain (Romovac) (Figs 9&10).
Finally, skin apposed with interrupted mattress sutures with 2-0 monofilament polyamide (Ethilon). By this flap, we can escape scarring in the midline, which prevents recurrences.
The patient was put on IV antibiotic (Amoxicillinclavulanic acid 1.2gm IV TDS) postoperatively that was changed to oral antibiotics after 3 days (Amoxicillin-clavulanic acid 625mg TDPC). Antibiotic was given for 7 days in total. Appropriate analgesics were given. The patient was advised to avoid putting pressure over the operative area for 3 weeks. Drain output type and amount was noted and was emptied every 24 hours. All the patients were discharged with the suction drain in-situ, with advice to empty the drain regularly and measure the amount with maintenance of a chart. Drains were removed when output was <10ml/day. Alternate stitch was removed after 2 weeks and remaining stitched were removed after another 1 week (ie, at 3 weeks).
Follow-up : Patients were advised to review at 1 week, 2 weeks, 3 weeks, 3, 6, 9, 12, 18 months, after surgery (Fig 11).
Statistical Analysis:
Analysis was done using SPSS software version 25.0. Pearson’s Chi-square Test was used to test the significance between the variables of the two groups.
RESULTS
In our study, the Mean Age (Mean ± SD) (Years) was 28.79 ± 6.339. The Age distribution ranged from 20 to 41 years.
In our study, there were 14.3% (n=2) Females and 85.7% (n=12) Males.
21.4% (n=3) patients presented with multiple tracts in sacrococcygeal region as evident in MRI whereas 78.6% (n=11) patients presented with single sinus tract in the sacrococcygeal region.
The Mean Operative Time (Mean ± SD) (Mins) was 56.00 ± 5.684. Operative Time for Limberg Flap Reconstruction ranged from 49-68 mins.
Fig 3 — Mapping of the operative area with superimposed letters
Fig 4 — Demonstration of the rotational flap
Fig 5 — Incision of the rhombus ABCD and dissection of subcutaneous fat
Fig 6 — Removal of rhombus ABCD
Fig 7 — Raising of the DEF flap
Fig 8 — Rotating the DEP flap over the defect
Fig 9 — DEF flap rotated and fixed to cover the rhomboidal defect
Fig 10 — Skin suturing and final outcome
Chowdhury D, et al. Limberg
There was no case of Wound Infection in our study. There was no case of Flap Necrosis in our study.
14.28% (n=2) patients had cut through of sutures during the period of wound healing, that was managed conservatively. Out of those patients who had cut through of sutures, one had single sinus tract and the other had multiple tracts (Fig 12).
The Mean Postoperative Stay (Mean ± SD) (Days) was 5.43 ± 0.938. The post-operative number of days of stay ranged from 4 days to 7 days in the patients.
The Mean Postoperative Day of Drain Removal (Mean±SD) (Days) was 19.36±2.170. The Postoperative Day of Drain Removal ranged from 16 days to 24 days in the patients.
The Mean Wound Healing Time (Mean ± SD) (Days) was 24.64 ± 3.225. Wound Healing Time ranged from 21-28 days.
The Mean Number of Days to Return to Normal Activity (Mean ± SD) (Days) was 23.36 ± 2.205. The Number of Days to Return to Normal Activity ranged from 21 days to 28 days in the patients.
The patients were followed up for 12 to 18 months in our study. The Mean Follow-up (Mean ± SD) (Months) was 15.43 ± 3.081.
There was no case of Recurrence in the follow-up period in our study (Table 1).
DISCUSSION
Our study comprises of a case series of 14 cases where we performed Limberg Transposition Flap for Sacro-coccygeal Pilonidal Sinus Treatment. Most patients were young with the mean age (Mean ± SD) being 28.79 ± 6.339 years in our study. The age distribution ranged from 20-41 years. In Jabbar, et al11 study the mean age of 27.9±5.96 years with young predominance. The age distribution ranged from 1741 years.
In a study by Gündoðdu E 12, 80.1%(n=149) were males and 19.9%(n=37) were females. In our study, there were 85.7% (n=12) Males and 14.3% (n=2) Females and There was a prominent male predominance in our study.
In a study by Karaca, et al13 the Mean Operative time for Limberg Flap Reconstruction 59.64 ± 7.76 mins. In our study, the Mean Operative Time was 56.00 ± 5.684 mins.
330MY-shaped tract 7cm in cranio-caudaldirection56NoNoNo519212412No 420MSingle tract 6cm62NoNoNo621282318No 522FSingle tract 5 cm with abscess54NoNoNo517212112No 624MSingle tract 3cm49NoNoNo619242218No 741MMultiple interconnected tracts with 3 external openings-Largest 8cm68NoNoYes624282818No 839MSingle tract 6cm51NoNoNo521282418No 931MSingle tract 5cm55NoNoNo418212212No 1029MMultiple interconnected tracts with 2 external openings-largest 6 cm65NoNoNo520282318No 1121MSingle tract 4cm52NoNoNo717242318No 1225FSingle tract 3cm with abscess58NoNoNo616212118No 1332MSingle tract 7cm52NoNoNo520282212No 1427MSingle tract 6cm50NoNoNo719242412No
Fig 11 — Follow-up at 3 months
Fig 12 — Cut through of suture noted at right angle of the wound
Chowdhury D, et al. Limberg Transposition Flap in Treatment of Sacro-coccygeal Pilonidal
123, No 10, October 2025Journal
In Chopade, et al14 study, no cases of wound infection were seen in participants who underwent Limberg flap reconstruction surgery. In our study also, there were no cases of wound infection.
In Gündoðdu E12 study, there were no flap necrosis or ischemia, but one patient had dermal ischemia at the corner where the flap was removed. In our study also there was no case of Flap Necrosis but 2 patients had cut through of sutures during the period of wound healing that was managed conservatively by dressing.
In Karaca, et al13 study, the Mean Hospital Stay was 2.69 ± 2.32 days while in our study, the Mean Postoperative Stay was 5.43 ± 0.938 days. We preferred dressing after 48 hours of surgery, then regular dressing.
In Arnous, et al 15 study, the Mean time of the patients’ suction drain removal was 17.5 ± 5.5 days. In our study, the Mean Postoperative Day of Drain Removal was 19.36 ± 2.170 days and the suction drain was only removed once the output was <10 ml in 24 hours.
In Chopade, et al14 study, the mean healing time was 20± 2 days for limber flap reconstruction patients. In our study, the Mean Wound Healing Time was 24.64 ± 3.225 days.
In Arnous, et al15 study, the Mean Number of Days to return to work was 20 ± 2.5 days. In our study, the Mean Number of Days to Return to Normal Activity was 23.36 ± 2.205 days.
In our study, patients were followed up for 12 to 18 months. The Mean Follow-up was for 15.43 ±3.081 months. In Arnous, et al15 study, the mean follow-up was for 16.4 ± 3.7 months.
There was no case of Recurrence in the follow-up period in our study which was similar to Gündoðdu E12 study.
CONCLUSION
Limberg Transposition Flap is an effective surgical procedure to treat patients with pilonidal sinus disease. By this flap, we can escape scarring in the midline. This is cosmetically good, and there have been no cases of recurrence in our study.
ACKNOWLEDGEMENT
The authors would like to acknowledge the contribution of Dr Kishore Chowdhury, Professor,
Department of General Surgery, Ramakrishna Mission Seva Pratishthan, VIMS for his immense help, constant guidance, patronage and procuring necessary permission for the conduct of this study.
Funding : None
Conflict of Interest : None REFERENCES
1Gendy AS, Glick RD, Hong AR, Dolgin SE, Soffer SZ, Landers H, et al — A comparison of the cleft lift procedure vs wide excision and packing for the treatment of pilonidal disease in adolescents. J Pediatr Surg 2011; 46(6): 1256-9.
2Aithal SK, Rajan CS, Reddy N — Limberg flap for sacrococcygeal pilonidal sinus a safe and sound procedure. Indian J Surg 2013; 75(4): 298-301.
3Karydakis GE — Easy and successful treatment of pilonidal sinus after explanation of its causative process. Aust N Z J Surg 1992; 62(5): 385-9.
4Datey S, Vashistha R, Gupta A, Gadodia M, Lazarus A, Verma P — Pilonidal sinus disease: a study of thirty six cases. J Evolution Med Dental Sci 2015; 4: 16254-7.
5Bascom J, Bascom T — Failed pilonidal surgery: new paradigm and new operation leading to cures. Arch Surg 2002; 137(10): 1146-50; discussion 1151.
6Kumar R, Hastir A, Walia RS, Goyal S, Kaur A — Prospective randomized study of surgical treatment of pilonidal sinus; primary midline closure after elliptical excision versus rhomboid excision with limberg flap reconstruction versus open excision and healing by secondary intention. Int Surg J 2017; 4: 3646-51.
7Tocchi A, Mazzoni G, Bononi M, Fornasari V, Miccini M, Drumo A, Colace L — Outcome of chronic pilonidal disease treatment after ambulatory plain midline excision and primary suture. Am J Surg 2008; 196(1): 28-33.
8Berger A, Frileux P — Sinus pilonidal [Pilonidal sinus]. Ann Chir 1995; 49(10): 889-901.
9Casetecker J, Mann BD, Castellanes AF, Strauss J — Pilonidal disease. 2006. http://emedicine.medscape.com/article192668. Accessed 11 Dec 2011
10Wolfe SA, Alexander A, Limberg, MD — 1894-1974. Plast Reconstr Surg 1975; 56(2): 239-40.
11Jabbar MS, Bhutta MM, Puri N — Comparison between primary closure with Limberg Flap versus open procedure in treatment of pilonidal sinus, in terms of frequency of postoperative wound infection. Pak J Med Sci 2018; 34(1): 49-53.
12Gündoðdu E — Fasciocutaneous Elliptical Rotation Flap for Pilonidal Sinus Disease and Its Outcomes. Turk J Surg 2020; 36(3): 310-6.
13Karaca AS, Ali R, Capar M, Karaca S — Comparison of Limberg flap and excision and primary closure of pilonidal sinus disease, in terms of quality of life and complications. J Korean Surg Soc 2013; 85(5): 236-9.
14Chopade SP, Adhikari GR — Comparative Study of Limberg Flap Reconstruction With Wide-Open Excision and Healing by Secondary Intention in the Management of Pilonidal Sinus: Our Experience at a Tertiary Care Center in India. Cureus 2022; 14(6): e26396.
15Arnous M, Elgendy H, Thabet W, Emile SH, Elbaz SA, Khafagy W — Excision with primary midline closure compared with Limberg flap in the treatment of sacrococcygeal pilonidal disease: a randomised clinical trial. Ann R Coll Surg Engl 2019; 101(1): 21-9.
Chowdhury D, et al. Limberg Transposition Flap in Treatment of Sacro-coccygeal Pilonidal Sinus : A series of 14 Cases.
Case Report
Bilateral Claude Syndrome — A Rare Paramedian Midbrain Hemorrhagic Stroke Presentation
Background : Brainstem strokes can have protean ophthalmological manifestations including pupillary and extraocular muscle paresis. Incomplete paresis of oculomotor function is more common than complete paresis owing to the selective involvement of subnuclei or fascicles of various extraocular muscles. Here, we report a case of paramedian midbrain hemorrhage who presented with symmetric bilateral ptosis, complete opthalmoplegia with ataxia. Also the anatomical as well as radiological correlation of this clinical presentation in relation to the structure of oculomotor nerve nuclei has been discussed.
Key words : Claude syndrome, Midbrain Hemorrhage, Bilateral Ptosis, 3rd Cranial Nerve, Ataxia.
The midbrain is the most cephalic portion of the brainstem, extending from the pontomesencephalic junction to join the diencephalon. Its anterior limits are given by the crus cerebri and the interpeduncular fossa, while the posterior limit is characterized by the presence of the superior and inferior colliculi1. Claude syndrome is a rare midbrain stroke syndrome characterized by ipsilateral third cranial nerve palsy and contralateral hemiataxia2. Although the red nucleus in midbrain has often been suggested as the site responsible for Claude’s syndrome, a lesion of the superior cerebellar peduncle just below and medial to the red nucleus could be responsible for this syndrome. This case demonstrates neurological heterogeneity of midbrain infarction3 . The most common causes of Claude’s syndrome are cerebrovascular disease and malignancy 4 . As with peripheral lesions, the prognosis for these patients is generally good, and ocular motor dysfunction tends to improve or resolve within several months5 Isolated third nerve palsy secondary to a hemorrhagic stroke is rare6. A case of bilateral trochlear nerve palsy following a midbrain brainstem hematoma has been described7. We report the case of bilateral third nerve palsy & Ataxia secondary to midbrain hemorrhage.
CASE REPORT
A 63-year-old man, presented with 3 days history of
Department of Neurology, Government Medical College, Kota, Rajasthan 324005
1MD (General Medicine), Senior Resident and Corresponding Author
2DM (Neurology), Senior Professor and Head
3DM (Neurology), Professor 4DM (Neurology), Assistant Professor
5MD (General Medicine), Senior Resident
Received on : 29/05/2023
Accepted on : 03/08/2023
Editor's Comment :
Bilateral Claude syndrome is a rare manifestation of midbrain stroke. Prompt neuroimaging and focused neurological assessment are essential for accurate diagnosis. Recognition of this entity aids in better understanding and management of brainstem vascular disorders.
sudden onset giddiness, drooping of both eyelids such that patient was not able to open his both upper eyelids without any diurnal variation or fatigability & had associated limb ataxia. Neurological examination revealed bilateral, symmetrical ptosis with normal size pupils, symmetrical & reacting to light, but with both eyes abducted ie, deviated laterally. Extraocular movements showed palsy of both eyes in adduction, elevation, depression & extorsion with bidirectional horizontal nystagmus evident on attempting adduction of either eye. Deep tendon reflexes were preserved in all limbs with bilateral plantar response were flexor & gait was wide based & ataxic. NCCT brain revealed a hyperdensity in paramedian midbrain with intraventricular extension in 4th ventricle (Fig 1). NCCT head was repeated after 48 hours, which showed resolving hematoma without any signs of hematoma expansion or hydrocephalus. The patient was managed conservatively with antihypertensive and other supportive therapy. patient was managed by antihypertensive medication and supportive measures.
DISCUSSION
The nuclei of the 3rd cranial nerve originate at the level of the superior colliculus. The oculomotor fascicles sweep ventrally and laterally through the oculomotor complex, pass medial to the red nucleus and exit the brainstem medial to the cerebral peduncles6
How to cite this article : Bilateral Claude Syndrome — A Rare Paramedian Midbrain Hemorrhagic Stroke Presentation. Meena P, Sardana V, Maheshwari D, Bhushan B, Quazi ZA. J Indian Med Assoc 2025; 123(10): 64-5.
To the best of our knowledge, no case of midbrain hemorrhagic stroke leading to bilateral third nerve palsy has been described in the literature. In our patient, the bilateral third nerve palsy can be explained by nuclear involvement and ataxia by involvement of superior cerebellar peduncle.
The sudden onset, preceded by high blood pressure (190/ 110mmHg), is suggestive of hemorrhagic stroke. The absence of an associated impairment of the descending and ascending tracts suggests a posterior bilateral midbrain lesion. This constellation of signs give a picture like bilateral claude’s syndrome.
CONCLUSION
Bilateral complete third nerve palsy & ataxia secondary to a midbrain hematoma is an exceptional situation that must be considered because of the morbidity and therapeutic implications of the underlying disease. Stroke should be included in the differential diagnosis of an isolated oculomotor paralysis even when it is bilateral especially
when the onset is sudden or when the onset is unknown. One has to be vigilant in brainstem bleed because of high likelihood of deterioration as a result of complications, so that an excellent functional outcome can be achieved by adopting appropriate strategies timely.
ACKNOWLEDGEMENT
We are thankful to staff of Neurology department for meticulous efforts towards patient care.
Support : No financial support.
Conflicts of interest : No conflict of interest.
REFERENCES
1Mihailoff GA, Haines DE — Fundamental Neuroscience for Basic and Clinical Applications E-Book. 5th ed. Philadelphia: Elsevier; 2018.
2Yavuz P, Solmaz I, Kaya UA, Akgoz A, Oguz KK, Aytac S, et al — Claude Syndrome in Childhood Associated with Probable Neuro-Behcet Disease. Neuropediatrics 2022; Dec 23.
4Song TJ, Suh SH, Cho H, Lee KY — Claude’s syndrome associated with neurocysticercosis. Yonsei Med J 2010; 51(6): 978-9. doi: 10.3349/ymj.2010.51.6.978. PMID: 20879071; PMCID: PMC2995972
5Kim JS, Kang JK, Lee SA, Lee MC — Isolated or predominant ocular motor nerve palsy as a manifestation of brain stem stroke. Stroke 1993; 24: 581-6.
6Shintani S, Tsuruoka S, Minato Y, Shiigai T — Radiologicclinical correlation, isolated third nerve palsy caused by midbrain hemorrhage. Am J Neuroradiol 1994; 15: 1508-11.
7Tachibana H, Mimura O, Shiomi M, Oono T — Bilateral trochlear nerve palsies from a brainstem hematoma. Clin Neuroophtalmol 1990, 10: 35-7.
Fig 1 — Showing midbrain hemorrhage and IVE
Letter to the Editor
[The Editor is not responsible for the views expressed by the correspondents]
Antibiotic-associated Gut Dysbiosis
SIR, — I am compelled to express our thoughts regarding the profound insights regarding Antibiotic-associated Gut Dysbiosis. The elucidation of the intricate relationship between antibiotics and gut microbiota underscores the critical importance of this topic in contemporary healthcare.
The human gut, home to a diverse community of trillions of microbes comprising the gut microbiota, serves as a cornerstone of physiological equilibrium within the body. However, the indiscriminate use of antibiotics has cast a shadow over this delicate microbial ecosystem, prompting a reevaluation of our approach to antibiotic therapy.
It is well known that how antibiotics, while indispensable in combating infections, disrupt the gut microbiota by targeting both harmful and beneficial microorganisms. This disruption culminates in dysbiosis – a state characterized by reduced microbial diversity, altered metabolite production, and compromised immune responses – a phenomenon with far-reaching implications for human health.
Of particular concern is the disproportionate impact of broad-spectrum antibiotics, which tend to induce more severe dysbiosis compared to their narrow-spectrum counterparts. Such disturbances in microbiota equilibrium not only predispose individuals to infections but also disrupt immune homeostasis, potentially contributing to a spectrum of disorders including allergies, inflammatory bowel disease, colorectal cancer, obesity, and asthma.
The implications of antibiotics-induced dysbiosis are especially poignant when considering vulnerable populations such as infants, whose developing microbiota are particularly susceptible to perturbations. It is imperative that healthcare practitioners exercise caution and judiciousness when prescribing antibiotics to such individuals, mindful of the potential long-term consequences on their gut health.
Despite these challenges, there is a glimmer of hope by highlighting promising strategies to mitigate the adverse effects of antibiotics on gut health. The advent of targeted anti-virulence agents, coupled with the revitalized exploration of probiotics, phage therapy, and fecal microbiota transplantation, holds tremendous potential in revolutionizing treatment paradigms for dysbiosis. We have been seeing good effect of oral bacteriophages suspensions that is virus killing pathogenic bacteria without
affecting other normal gut bacteria. Infact lot of study has been done in reducing obesity by killing bacteria promoting obesity in the affected individual.
Furthermore, we are heartened by the prospect of advancements in our understanding of antibiotics, which offer a pathway towards more nuanced and personalized approaches to antibiotic therapy. By leveraging this knowledge, we can navigate the delicate balance between combating disease-causing bacteria and preserving the integrity of the gut microbiota.
In conclusion, our thought serves as a poignant reminder of the symbiotic relationship between antibiotics and gut health, prompting us to reevaluate our practices and embrace innovative solutions to safeguard human health specially the use of bacteriophages and probiotics. We commend the publication of our thoughts on this crucial aspect for bringing attention to this critical issue, and we hope to see continued dialogue and action towards fostering a healthier future for all.
REFERENCES
1Kesavelu D, Jog P — Current understanding of antibiotic-associated dysbiosis and approaches for its management. Therapeutic Advances in Infectious Disease. 2023. 10, 204993612311544. http s://doi.org/10.1177/ 20499361231154443
2Dahiya D, Nigam P — Antibiotic-therapy-induced gut dysbiosis affecting gut microbiota—brain axis and cognition: restoration by intake of probiotics and synbiotics. International Journal of Molecular Sciences 2023. 24(4): 3074. https://doi.org/ 10.3390/ijms24043074
3Nath G, Singh S, Kumar R — Does Over-colonization of Klebsiella pneumoniae in the Gut Cause Obesity? 2022; 11(1): 1. 4Samajdar SS, Bhattacharya S — Rich with rupees or rich in good gut microbiota: what is more important for our metabolic health? Explor Anim Med Res 2019; 9(2): 105-07.