
Using the Dashboard to Identify Students At-Risk

Quick Start Guide
Utilize the Dashboard features built into the Buzz Agilix LMS to help identify at-risk students. The Dashboard provides an excellent high-level overview that will help teachers track information relevant to their daily tasks: graded items, items in need of grading, and the status of student progress and overall student success.
Once logged in to your teacher app, click the Dashboard tab within the navigation bar.

Scroll to the bottom of the Dashboard page.
Note: The following information will explain the Dashboard components and how to interpret available information.
The Course and Student summary cards
The Course Summary card summarizes information such as the number of active courses and which courses have students who need critical attention.
The Student Summary card summarizes information like the number of active students and how many students need critical attention. Click the summaries for details.
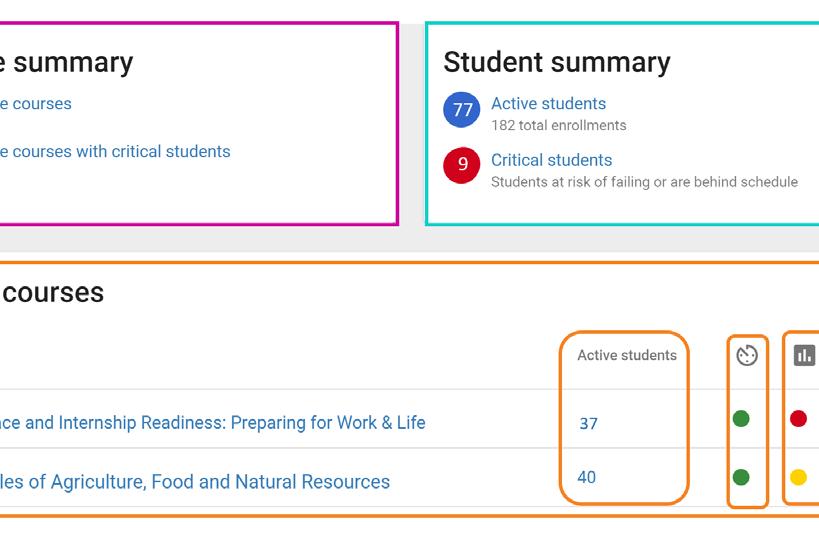
The Active courses card
The Active Courses card allows teachers to monitor student information broken down by course, in 4 key categories:
continued on next page...
Active students by course.
Teacher responsiveness measured by grading. The status indicators appear in one of three colors:
Green = all submitted, gradable assignments were graded in 2 days or less.
Yellow = one or more submitted, gradable assignments have gone graded for 3+ days.
Red = one or more submitted, gradable assignments have gone graded for 3+ days.
Student performance by course. The status indicators appear in one of three colors:
Green = as a group, your students are performing above 10% of the minimum grade for the course.
Yellow = as a group, your students have failed in 1 of their last five submissions and/or they are within 10% of failing the course.
Red = as a group, students have failed 2 of their last five submissions and/or they are failing the course.
Student pace by course. The status indicators appear in one of three colors:
Green = as a group, your students are submitting all gradable items on time or that less than 10% are past due.
Yellow = as a group, your students have 10% or more of gradable items past due.
Red = as a group, your students have 30% or more of gradable items past due.
For additional Quick Start Guides and helpful tutorials visit: www.edynamiclearning.com/support