WeatherAnalysis andForecasting
Thispageintentionallyleftblank
ApplyingSatelliteWaterVaporImagery andPotentialVorticityAnalysis
SecondEdition
ChristoG.Georgiev
NationalInstituteofMeteorology andHydrology
BulgarianAcademyofSciences
PatrickSanturette
ForecastingOperationsDepartment Me ´ te´o-France
KarineMaynard
ForecastLaboratory Me ´ te´o-France
AcademicPressisanimprintofElsevier
125LondonWall,LondonEC2Y5AS,UK
525BStreet,Suite1800,SanDiego,CA92101-4495,USA
50HampshireStreet,5thFloor,Cambridge,MA02139,USA
TheBoulevard,LangfordLane,Kidlington,OxfordOX51GB,UK
Copyright © 2016,2005ElsevierInc.Allrightsreserved.
Nopartofthispublicationmaybereproducedortransmittedinanyformorbyanymeans,electronicor mechanical,includingphotocopying,recording,oranyinformationstorageandretrievalsystem,without permissioninwritingfromthepublisher.Detailsonhowtoseekpermission,furtherinformationaboutthe Publisher’spermissionspoliciesandourarrangementswithorganizationssuchastheCopyrightClearance CenterandtheCopyrightLicensingAgency,canbefoundatourwebsite: www.elsevier.com/permissions.
ThisbookandtheindividualcontributionscontainedinitareprotectedundercopyrightbythePublisher(other thanasmaybenotedherein).
Notices
Knowledgeandbestpracticeinthisfieldareconstantlychanging.Asnewresearchandexperiencebroadenour understanding,changesinresearchmethods,professionalpractices,ormedicaltreatmentmaybecome necessary.
Practitionersandresearchersmustalwaysrelyontheirownexperienceandknowledgeinevaluatingandusing anyinformation,methods,compounds,orexperimentsdescribedherein.Inusingsuchinformationormethods theyshouldbemindfuloftheirownsafetyandthesafetyofothers,includingpartiesforwhomtheyhavea professionalresponsibility.
Tothefullestextentofthelaw,neitherthePublishernortheauthors,contributors,oreditors,assumeany liabilityforanyinjuryand/ordamagetopersonsorpropertyasamatterofproductsliability,negligenceor otherwise,orfromanyuseoroperationofanymethods,products,instructions,orideascontainedinthe materialherein.
BritishLibraryCataloguing-in-PublicationData
AcataloguerecordforthisbookisavailablefromtheBritishLibrary
LibraryofCongressCataloging-in-PublicationData
AcatalogrecordforthisbookisavailablefromtheLibraryofCongress
ISBN:978-0-12-800194-3
ForinformationonallAcademicPresspublications
visitourwebsiteat https://www.elsevier.com/
Publisher: CandiceJanco
AcquisitionEditor: SaraScott
EditorialProjectManager: TashaFrank
ProductionProjectManager: VijayarajPurushothaman
Designer: MarkRogers
TypesetbyTNQBooksandJournals
Thecoverillustrationismadebyoriginalimagesproducedforthepurposesofthisbookbytheauthorsusing dataavailableinMe ´ te ´ o-France.Thesearesatellitewatervaporimagesoverlaidbymeteorologicalfieldsfor analysisofcasesconsideredinthematerial:TopleftinChapter3,Section3.5.3.1;ToprightinChapter3, Section3.6;BottominChapter4,Section4.3.2.
PART1FUNDAMENTALS
CHAPTER1ADynamicalViewofSynopticDevelopment ....................................... 3
1.1 VorticityandPotentialVorticity.................................................................................3
1.2 TheConceptofPotentialVorticityThinking.............................................................6
1.2.1TheConservationPrinciple..............................................................................6
1.2.2TheInvertibilityPrinciple................................................................................7
1.2.3ClimatologicalDistributionofPotentialVorticity...........................................7
1.2.4PositivePotentialVorticityAnomaliesandTheirRemote Influence...........................................................................................................9
1.3 OperationalUseofPotentialVorticityFieldstoMonitorSynoptic Development.............................................................................................................10
1.3.1Upper-LevelDynamics,DynamicalTropopause,andDynamical TropopauseAnomaly.....................................................................................10
1.3.2JetStreamandJetStreaks..............................................................................12
1.3.3SynopticDevelopmentasSeenbyPotentialVorticityConcepts..................14
1.3.4AnalysisofaReal-AtmosphereStructure.....................................................15
CHAPTER2TheInterpretationProblemofSatelliteWaterVapor Imagery
2.1 InformationContentof6.2and7.3 mmChannels....................................................21
2.1.1OriginoftheRadiation,Radiance,BrightnessTemperature, andImageGrayShades..................................................................................22
2.1.2SensitivityRangeof6.2 mmand7.3 mmChannels........................................27
2.1.3EffectsofLayeredMoistureontheRadiance...............................................33
2.2 Abilityof6.2and7.3 mmImagestoReflectMoist/DryLayers,Clouds, andLandSurfaceFeatures.......................................................................................41
2.2.1Upper-LevelDryStructures(200 500hPa)..................................................42
2.2.2DeepMoistLayers(200 1000hPa)..............................................................44
2.2.3High-LevelMoistLayers(200 400hPa)......................................................45
2.2.4Mid-LevelMoistLayers(400 650hPa).......................................................46
2.2.5Low-LevelMoistLayers(650 800hPa).......................................................47
2.2.6Moisture/CloudinessintheBoundaryLayer(850 950hPa).......................47
2.2.7Earth’sSurfaceFeatures.................................................................................49
2.3 PotentialforOperationalUseofImagesin6.2and7.3 mmChannels ofMeteosatSecondGeneration...............................................................................51
PART2PRACTICALUSEOFWATERVAPORIMAGERY ANDTHERMODYNAMICFIELDS
CHAPTER3SignificantWaterVaporImageryFeaturesAssociated
3.1 OperationalUseofRadiationMeasurementsinWaterVaporChannels6.2 and7.3 mm.................................................................................................................56
3.2 InterpretationofSynoptic-ScaleImageryFeatures.................................................57
3.2.1Moist(Light)Featuresin6.2 mmImagery....................................................57
3.2.2Dry(Dark)Featuresin6.2 mmImagery........................................................59
3.2.3JetStreamMoistureBoundariesSeenin6.2and7.3 mmImagery...............68
3.3 Middle-toUpper-TroposphereWindFieldFeatures...............................................68
3.3.1SpecificUpper-LevelFlowPatternsSeenin6.2 mmImagery......................70
3.3.2InteractionofaJetStreamWithaDynamicalTropopauseAnomaly: JetStreakStructureEmergence.....................................................................74
3.3.3Upper-LevelDivergentFlowasaSignofAscendingMotions....................74
3.3.4Mid-LevelJetSeenin7.3 mmChannelImages.............................................83
3.4 BlockingRegime......................................................................................................91
3.4.1BlockingRegimeFormationinWhichEasterliesResultFrom Anticyclogenesis.............................................................................................94
3.4.2BlockingRegimeFormationinWhichEasterliesResultFrom Cyclogenesis...................................................................................................95
3.5 CyclogenesisandAtmosphericFronts.....................................................................97
3.5.1ExtratropicalandTropicalCyclones:EnergySourceandMain ThermodynamicCharacteristics.....................................................................97
3.5.2CyclogenesisWithinBaroclinicTroughs:LeafandBaroclinicLeaf FeaturesintheWaterVaporImagery............................................................97
3.5.3CyclogenesisWithUpper-LevelPrecursors................................................103
3.5.4UsefulnessofWaterVaporImagerytoIdentify“StingJet”and RelatedSurfaceWindGusts........................................................................116
3.5.5SplitColdFrontSeeninWaterVaporImagery..........................................122
3.6 InteractionofTropicalCyclonesWithUpper-LevelDynamicalStructures.........129
3.6.1EffectsofUpper-LevelFlowPatternintheSurroundingEnvironment ontheIntensityofTropicalStorms.............................................................131
3.6.2IntensificationofTropicalCyclonesontheAnticyclonicShearSide ofJetStreams...............................................................................................139
3.6.3EffectsofInteractionWithMidlatitudeUpper-LevelTroughs ontheIntensityofTropicalCyclones..........................................................142
3.6.4RoleoftheTropicalCycloneinanExtratropicalDevelopment AssociatedWithanUpstreamUpper-LevelCyclonicPotential VorticityAnomaly........................................................................................143
3.7 Summary.................................................................................................................152
3.7.1BasicPrinciplesinWaterVaporImageryInterpretation.............................152
3.7.2LightWaterVaporImageryPatterns:RelationtoDynamical Structures......................................................................................................153
3.7.3DarkWaterVaporImageryPatterns:RelationtoDynamical Structures......................................................................................................153
3.7.4BoundaryPatternsontheWaterVaporImagery:Relationto DynamicalStructures...................................................................................153
3.7.5Interaction/EvolutionofWaterVaporImageryFeatures:Relation toDynamicalProcesses................................................................................154
3.7.6Upper-TroposphericFlowPatternsAffectingTropicalCyclone Development.................................................................................................154
3.7.7SuperpositionofWaterVaporImageryandDynamicalFields: AToolforSynoptic-ScaleAnalysis.............................................................155
4.1 Introduction.............................................................................................................158
4.2 AtmosphericEnvironmentFavorableforDeepConvection..................................159
4.2.1TheConvectiveIngredients..........................................................................159
4.2.2ADynamicalTropopauseAnomaly(Upper-LevelCyclonicPotential VorticityMaximum)FavorsDeepConvection............................................161
4.2.3DryAirAloftIncreasesInstabilityandFavorsConvective Development.................................................................................................163
4.2.4Divergent/ConvergentUpper-LevelFlowasaPositive/Negative FactorforDeepConvection.........................................................................164
4.3 Upper-LevelDiagnosisofDeepConvection.........................................................170
4.3.1Upper-LevelDynamicsFavorableforDeepConvection inMidlatitudes..............................................................................................170
4.3.2ConvectionInitiationatDeformationZonesandUpper-Level DynamicalDryFeatures..............................................................................176
4.3.3ConvectiveEnvironmentsOvertheSubtropicalNorthPacific...................181
4.3.4DeepConvectioninBlockingRegimes.......................................................185
4.3.5Upper-LevelDynamicsandDeepConvectioninTropicalAreas...............190
4.4 UseofDataFromWaterVaporChannelsinDiagnosingPreconvective Environments..........................................................................................................194
4.4.1Upper-LevelForcing/InhibitionintheEnvironmentofMoist Convection....................................................................................................194
4.4.2Upper-LevelForcingandConvectiveInstabilityinSubtropical Areas:MiddleEastCaseStudy,December22,2009..................................199
5.5.1SensitivityAnalysesofUpper-LevelDynamicsinNumerical WeatherPredictionSimulations...................................................................260
5.5.2ImprovingNumericalForecastsbyPotentialVorticityInversion Adjustments..................................................................................................284
5.6 SummaryoftheConclusions..................................................................................296
5.6.1ComparisonBetweenWaterVaporImageryandDynamicalFields asanOperationalTool.................................................................................296
5.6.2ComparingSatelliteandSyntheticWaterVaporImageryWith PotentialVorticityFieldstoValidateNumericalWeather PredictionOutput.........................................................................................297
5.6.3UsingtheTechniqueofPotentialVorticityInversiontoAdjust NumericalWeatherPredictionInitialConditionstoBetterUnderstand theSynopticDevelopment...........................................................................298
5.6.4UsingSatelliteandSyntheticWaterVaporImagesandPotential VorticityConceptstoAdjustNumericalWeatherPredictionInitial ConditionsandtoGetanAlternativeNumericalForecast.........................298
AppendixA:RadiationMeasurementsinWaterVaporAbsorptionBand......................................301 AppendixB:PotentialVorticityModificationTechniqueandPotentialVorticityInversion toCorrecttheInitialStateoftheNumericalModel.........................................................................323
Thispageintentionallyleftblank
ADYNAMICALVIEWOF SYNOPTICDEVELOPMENT
CHAPTEROUTLINE
1.1VorticityandPotentialVorticity.........................................................................................................3
1.2TheConceptofPotentialVorticityThinking........................................................................................6
1.2.1TheConservationPrinciple............................................................................................6
1.2.2TheInvertibilityPrinciple..............................................................................................7
1.2.3ClimatologicalDistributionofPotentialVorticity..............................................................7
1.2.4PositivePotentialVorticityAnomaliesandTheirRemoteInfluence....................................9
1.3OperationalUseofPotentialVorticityFieldstoMonitorSynopticDevelopment...................................10
1.3.1Upper-LevelDynamics,DynamicalTropopause,andDynamicalTropopauseAnomaly.......10
1.3.2JetStreamandJetStreaks..........................................................................................12
1.3.3SynopticDevelopmentasSeenbyPotentialVorticityConcepts.......................................14
1.3.4AnalysisofaReal-AtmosphereStructure......................................................................15
1.1 VORTICITYANDPOTENTIALVORTICITY
Somemeteorologicalparametersaremoreeffectivethanothersforstudyingtheappearanceand evolutionofdynamicalstructuresatsynopticscale.Theconservativeparameters thosethatremain unchangedwhenonefollowsaparticleoffluidinmotion arebestsuitedtodetectandmonitorthe structuresthatplayvariouskeyrolesinameteorologicalscenario.Withtheassumptionofadiabatic motions,thepotentialtemperature q andwet-bulbpotentialtemperature qw arethermodynamictracers fortheairparticles.Theyallowustocomparethethermalpropertiesofairparticleswithouttakinginto accounttheeffectsduetothermaladvectionandpressurechanges.However,theyonlyrepresentafew oftheimportantpropertiesthatdeterminetheevolutionoftheatmosphere.Tobetterunderstandthe observedphenomena,dynamicalpropertiesmustalsobetakenintoaccount.
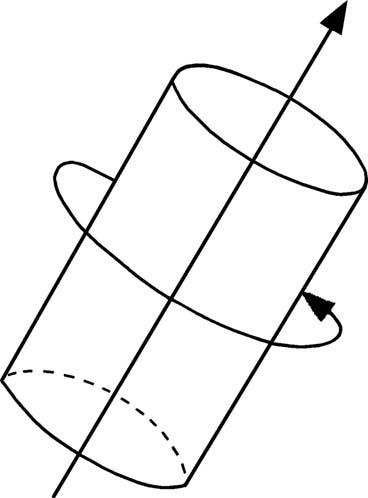
Inmidlatitudes,atsynopticscale,theimportantdynamicalpropertiesarethoserelatedtothe rotationofairparticles.ThisrotationislinkedbothtothemotionofEarthandtotherotation componentofthewind.Therotationoffluidparticlesisdescribedbythevariable vorticity.Vorticityis ameasureofthelocalrotationorspinoftheatmosphere:Itisthekeyvariableofsynopticdynamics. Asillustratedin Fig.1.1,thevorticityvectorgivesthedirectionofthespinaxis,anditsmagnitudeis proportionaltothelocalangularvelocityaboutthisaxis.Thefluidparticlesturnaroundtheirvorticity vector,andthe absolutevorticity isequaltotherelativespinaroundalocalcylinderplustherotationof thecoordinatesystem.
WeatherAnalysisandForecasting. http://dx.doi.org/10.1016/B978-0-12-800194-3.00001-7 Copyright © 2016ElsevierInc.Allrightsreserved.
FIGURE1.1
Avorticityvectorandthelocalrotationintheatmosphereindicatedbythecirculationaroundacylinderofair orientedalongthevorticityvector.
AdaptedfromHoskins,B.,1997.Apotentialvorticityviewofsynopticdevelopment.Meteorol.Appl.4,325 334.
Tointerpretaprocessintermsofquasi-geostrophictheory,onlytheverticalcomponentofthe vorticityequationisexplicitlyconsidered.Theverticalcomponentofabsolutevorticityis z ¼ f þ x, where f istheCoriolisparameterandtherelativevorticityisgivenby x ¼ vv vx vu vy .
Itisalsosupposedthat,atsynopticscale,Earth’srotationdominates(ie, z y f),inwhichcasethe relativevorticityequationcontainsonlystretchingandshrinkingofthisbasicrotation(Hoskins,1997). Twoexamplesarepresentedin Fig.1.2.Alongthezeroverticalmotionattheground,wecanmakethe followingobservations:
•Troposphericascentimpliesstretchingandcreationofabsolutevorticitygreaterthan f,thatis, cyclonicrelativevorticity,inthelowertroposphere.
•Similarly,troposphericdescentimpliesshrinkingandcreationofrelativeanticyclonic vorticityinthelowertroposphere.
•Iftheinitialrelativevorticityiszero,thetwosituationsin Fig.1.2AandB correspondto cyclonicandanticyclonicsurfacedevelopment.
viewofatmosphericdynamics.SuperimposingvariousPVfieldsontoasatelliteimageisanatural diagnostictool,wellsuitedtomakingdynamicalprocessesdirectlyvisibletothehumaneye.In particular,ajointinterpretationofupper-levelPVfieldsandwatervaporimageryprovidesvaluable informationbecausePVstructuresandwatervaporfeaturesarewellcorrelated.
1.2.2 THEINVERTIBILITYPRINCIPLE
TheconservednatureofthePVparameterandtheinvertibilityofPVenableustobuilduptheflowand temperaturestructureassociatedwithagivenPVanomaly.Theapproachdescribedin Section1.2.1 suggestsamethodtoassessnumericalmodelbehaviorbymakingmeaningfulcomparisonsbetweenan atmospheresimulatedbyamodelandreality,thatis,betweennumericalweatherprediction(NWP) outputandsatelliteimagery.Incasesofsignificantdisagreement,theinvertibilityofPVistheprinciple thatallowsustouselocalPVmodificationstoadjustinitialconditionsofoperationalnumerical models.ThusmodifyingPVinalocalareainthedirectiongivenbytheobservations,mainlybythe satelliteimagery,canleadtoimprovementinthemodelinitialstate,withallothervariables(temperature,winds,etc.)beingretrievedviaPVinversion.Errorsintheforecasttrackanddepthofa cyclonemaybereducedbycalculatinganewforecastfromthisnewinitialstate(seeSection5.5).
1.2.3 CLIMATOLOGICALDISTRIBUTIONOFPOTENTIALVORTICITY
TheclimatologicalPVdistributionintheatmosphereisremarkable.Itshowsthatonaverageinthelow levelsoftheatmospherePVisuniform(see Fig.1.4):
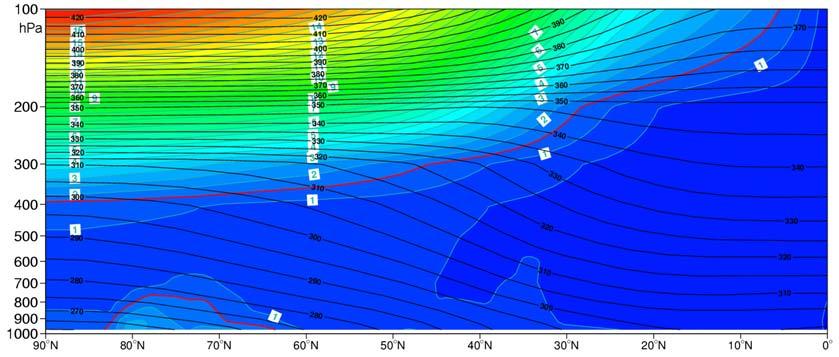
1. InhighandmidlatitudesthePVrangesonaverageapproximatelyfrom0.4to0.7PVUinthe troposphereandreaches1PVUaround400hPa.Thenitincreasesrapidlywithheightand takesonvaluesmuchhigherthan2PVUinthestratosphere,becomingrapidlygreaterthan 3PVUinthelowstratosphere,owingtothestrongincreaseofstaticstability.
2. Intropicareas(between10 Lat.and w30 Lat.),PVrangesfrom0.3to0.5PVUandreaches 0.5PVUnear300hPa.
ThisdiscontinuityofthePVnearthemiddleoftheatmospheretogetherwithitsconservation propertyallowsustodefinethe1.5-PVUsurfaceformidlatitudesandthe0.7PVUsurfacefortropics (excludingtheequatorialarea,within10 latitude)asatropopauseintheviewofthePVconcept.This newtropopauseiscalleddynamicaltropopause,separatingthetroposphere,withweakandquasiuniformPV,fromthestratosphere,withitsstrongPV.DefiningthetropopauseintermsofthePV conceptismoreefficientinpracticalmeteorologythantheclassicaldefinition(basedonthelapserate change),becausetakingintoaccountnotonlythetemperaturefieldbutalsothemotionfieldthrough thevorticityiswhatiscrucialindynamicmeteorology.Thisdynamicaltropopauseisjustifiedby Fig.1.5 thathighlightsitsfollowingfeatures:
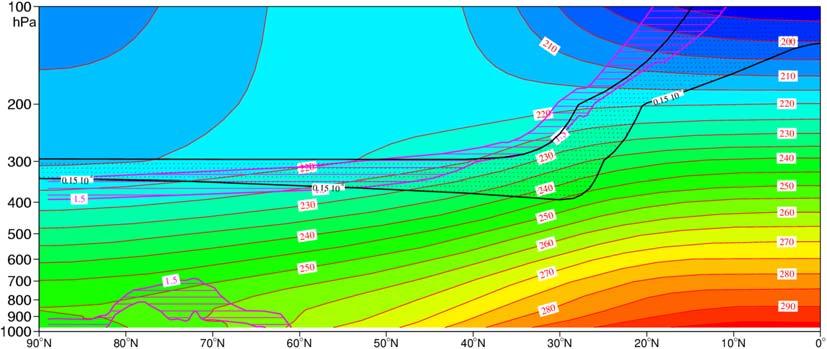
1. InmidlatitudesthecorrelationbetweentheareawherethePVisonaveragecomprised between1.5and2.0PVUandtheareawherethemeanmixingratioofozoneisbetween150 and200ppm(valueofozonegivingagooddiagnosticofthemeantropopause).
2. Intropicstheregionofozoneconcentrationdescendingbelow150ppmvalue,wellcorrelated withtheareawherethePVisonaveragebetween0.5and1PVU(see Figs.1.4and1.5).
FIGURE1.4
Zonalyearaverage(verticalcross-section)ofthepotentialvorticity(PV; colorareas,every0.5PVU)andofthe potentialtemperature(blacklines inK,interval5K)intheNorthernHemisphere.ThecontourofPV value ¼ 1.5PVU(theso-calleddynamicaltropopause)isgivenin red.Thischartuseddatafrom44yearsof theEuropeanCenterforMediumRangeWeatherForecastingreanalysis,1958 2001.
FromMalardel(2008).
FIGURE1.5
ComparisonintheNorthernHemispherebetweenthethermaldiagnosis,theozonediagnosis,andthe potentialvorticity(PV)diagnosisofthetropopause.Thetemperaturefieldisazonalandaseasonalaverage, December-January-February(in colorandredlines,every10K).ThezoneofPVwithvaluescomprised between1.5and2.0PVU(forthesameperiod)isrepresentedin magentadashedarea;thecontourof PV ¼ 1.5PVUatthebottomofthe dashedarea isthedynamicaltropopauseformidlatitudes.Also representedarevaluesofmeanmixingratioofozonebetween150and200ppm(dottedblackzone, 1ppm ¼ 10 9 kg/kg).Thischartuseddatafrom44yearsoftheEuropeanCenterforMediumRangeWeather Forecastingreanalysis,1958 2001.
FromMalardel(2008).
Wecannotice(asHighwoodandHoskins,1998),thataPVdefinitionofthetropopauseisuseful alsoforthetropicsbutnotclosetotheequator(theequatorialarea,within10 latitude)wherePV surfacesbecomealmostvertical.
1.2.4 POSITIVEPOTENTIALVORTICITYANOMALIES ANDTHEIRREMOTEINFLUENCE
WecannowthinkaboutthePVdistributionitselfratherthanthebehaviorofacylinderbetween isentropicsurfaces.Theresultsmustbethesameasthosedepictedin Fig.1.2 byconsideringa coherentPVstructureatupperlevels,referredtoas“PVanomalies”(Hoskinsetal.,1985).Apositive PVanomalyisdefinedasacoherentregionofhighvaluesofcyclonicPV(positivePVvaluesinthe NorthernHemisphereandnegativePVvaluesintheSouthernHemisphere).
Theconceptofcoherentstructureisusedtoassociatemanyoftheanomaliesofinterestto meteorologytosuchfeatures,whicharelocalizedandkeeptheircoherenceintime(Pluetal.,2008). Thetimescalesofairparticlestravelinginsidesuchacoherentstructureareshorterthanthetypical timescalesoftheevolutionofsuchastructure.Therefore,suchacoherentpositivePVanomaly undergoesatimeevolutionthatmaybeinterpretedbydynamicaldiagnoses.
Fig.1.6 schematicallyshowstheeffectofapositivePVanomaly(ie,aregionwithanisolated maximumofcyclonicPV)surroundedbyanatmosphereoriginallyatrestwithuniformPV.
ThePVanomalymodifiesthetemperaturefieldandinducesacycloniccirculation.
•Atthecenteroftheanomalythestaticstabilityincreases(theiso-q surfacesbecomecloser together);thereforethestabilitydecreasesaboveandbeneaththePVanomaly.
•ToconservePV,theabsolutevorticityincreasesaboveandbeneaththeanomalyto compensateforthisdecreaseinstability.
FIGURE1.6
Aschematiccross-section,showinganidealizedmodelofthemodificationofthetroposphereassociatedwith anupper-levelcyclonicpotentialvorticityanomaly,whichisreferredtoasadynamicaltropopauseanomaly.