No part of this publication may be reproduced or transmitted in any form or by any means, electronic or mechanical, including photocopying, recording, or any information storage and retrieval system, without permission in writing from the publisher. Details on how to seek permission, further information about the Publisher’s permissions policies and our arrangements with organizations such as the Copyright Clearance Center and the Copyright Licensing Agency, can be found at our website: www.elsevier.com/permissions.
This book and the individual contributions contained in it are protected under copyright by the Publisher (other than as may be noted herein).
Notices
Knowledge and best practice in this field are constantly changing. As new research and experience broaden our understanding, changes in research methods, professional practices, or medical treatment may become necessary.
Practitioners and researchers must always rely on their own experience and knowledge in evaluating and using any information, methods, compounds, or experiments described herein. In using such information or methods they should be mindful of their own safety and the safety of others, including parties for whom they have a professional responsibility.
To the fullest extent of the law, neither the Publisher nor the authors, contributors, or editors, assume any liability for any injury and/or damage to persons or property as a matter of products liability, negligence or otherwise, or from any use or operation of any methods, products, instructions, or ideas contained in the material herein.
Library of Congress Cataloging-in-Publication Data
A catalog record for this book is available from the Library of Congress
British Library Cataloguing-in-Publication Data
A catalogue record for this book is available from the British Library
ISBN: 978-0-12-814327-8
For information on all Elsevier publications visit our website at https://www.elsevier.com/books-and-journals
Publisher: Candice Janco
Acquisition Editor: Laura Kelleher
Editorial Project Manager: Hilary Carr
Production Project Manager: Mohana Natarajan
Cover Designer: Matthew Limbert
Upper Left: Extreme ultraviolet imagery reveals the onset of a major solar flare and eruption.
Image credit: Daniel Seaton/University of Colorado
Middle: True color image of Hurricane Michael in the northern Gulf of Mexico.
Image credit: Daniel Lindsey/NOAA
Lower Left: Lightning flash with extreme horizontal extent illuminating a storm complex over Uruguay.
Image Credit: Michael Peterson/University of Maryland
Lower Right: Satellite derived upper level, mid level, and lower level wind fields in the vicinity of Hurricane Michael.
Image credit: Jaime Daniels/NOAA
Typeset by SPi Global, India
Contributors
Americo Allegrino I.M. Systems Group (IMSG), Inc., Rockville, MD, United States
Andrew Bailey I.M. Systems Group (IMSG), Inc., Rockville, MD, United States
S. Dave Bouwer Space Environment Technologies, Thornton, CO, United States
Wayne Bresky I.M. Systems Group (IMSG), Inc., Rockville, MD, United States
Samuel Califf Cooperative Institute for Research in Environmental Sciences (CIRES), University of Colorado-Boulder; NOAA National Centers for Environmental Information (NCEI), Boulder, CO, United States
Corey Calvert Cooperative Institute for Meteorological Satellite Studies (CIMSS), University of Wisconsin-Madison, Madison, WI, United States
John L. Cintineo Cooperative Institute for Meteorological Satellite Studies, University of Wisconsin-Madison, Madison, WI, United States
Pubu Ciren I.M. Systems Group, Inc., Rockville, MD, United States
Stefan Codrescu Cooperative Institute for Research in Environmental Sciences (CIRES), University of Colorado-Boulder; NOAA National Centers for Environmental Information (NCEI), Boulder, CO, United States
Jaime Daniels NOAA/NESDIS Center for Satellite Applications and Research, College Park, MD, United States
Jonathan M. Darnel Cooperative Institute for Research in Environmental Sciences (CIRES), University of Colorado-Boulder; NOAA National Centers for Environmental Information (NCEI), Boulder, CO, United States
Thomas D. Eden, Jr. Laboratory for Atmospheric and Space Physics (LASP), University of Colorado-Boulder, Boulder, CO, United States
Francis G. Eparvier Laboratory for Atmospheric and Space Physics (LASP), University of Colorado-Boulder, Boulder, CO, United States
Steven J. Goodman GOES-R Program Chief Scientist (Retired), Thunderbolt Global Analytics, Huntsville, AL, United States
Mathew M. Gunshor Cooperative Institute for Meteorological Satellite Studies (CIMSS), University of Wisconsin-Madison, Madison, WI, United States
Andrew K. Heidinger NOAA/NESDIS Center for Satellite Applications and Research, Advanced Satellite Products Branch, Madison, WI, United States
Jay Hoffman Cooperative Institute for Meteorological Satellite Studies (CIMSS), University of Wisconsin-Madison, Madison, WI, United States
Vicki Hsu Cooperative Institute for Research in Environmental Sciences (CIRES), University of Colorado-Boulder; NOAA National Centers for Environmental Information (NCEI), Boulder, CO, United States
Amy Huff I.M. Systems Group, Inc., Rockville, MD, United States
J. Marcus Hughes Computer Science Department, University of Colorado-Boulder, Boulder, CO, United States
Jeffrey R. Key NOAA/NESDIS Center for Satellite Applications and Research (STAR), Madison, WI, United States
Hye-Yun Kim I. M. Systems Group, Rockville, MD, United States
Shobha Kondragunta NOAA/NESDIS Center for Satellite Applications and Research, Satellite Meteorology and Climatology Division (STAR SMCD), College Park, MD, United States
Brian T. Kress NOAA National Centers for Environmental Information; Cooperative Institute for Research in Environmental Sciences (CIRES) at CU, Boulder, CO, United States
Robert J. Kuligowski NOAA/NESDIS Center for Satellite Applications and Research Environmental Monitoring Branch, College Park, MD, United States
Istvan Laszlo NOAA/NESDIS Center for Satellite Applications and Research Environmental Monitoring Branch; University of Maryland, Department of Atmospheric and Oceanic Science, College Park, MD, United States
Aaron Letterly Cooperative Institute for Meteorological Satellite Studies (CIMSS), University of Wisconsin-Madison, Madison, WI, United States
Jun Li Cooperative Institute for Meteorological Satellite Studies (CIMSS), University of Wisconsin-Madison, Madison, WI, United States
Zhenglong Li Cooperative Institute for Meteorological Satellite Studies (CIMSS), University of Wisconsin-Madison, Madison, WI, United States
Daniel T. Lindsey NOAA/NESDIS Center for Satellite Applications and Research, Regional and Mesoscale Meteorology Branch, Fort Collins, CO, United States
Yinghui Liu NOAA/NESDIS Center for Satellite Applications and Research (STAR), Madison, WI, United States
Hongqing Liu I. M. Systems Group, Rockville, MD, United States
Paul T.M. Loto’aniu Cooperative Institute for Research in Environmental Sciences (CIRES), University of Colorado-Boulder; NOAA National Centers for Environmental Information (NCEI), Boulder, CO, United States
Janet L. Machol Cooperative Institute for Research in Environmental Sciences (CIRES), University of Colorado-Boulder; NOAA National Centers for Environmental Information (NCEI), Boulder, CO, United States
Graeme Martin Cooperative Institute for Meteorological Satellite Studies, University of Wisconsin-Madison, Space Science and Engineering Center, Madison, WI, United States
William E. McClintock Laboratory for Atmospheric and Space Physics (LASP), University of Colorado-Boulder, Boulder, CO, United States
Donna McNamara NOAA Office of Satellite and Product Operations, Mission Operations Division, Suitland, MD, United States
James McNitt NOAA National Environmental Satellite, Data, and Information Service, Office of Satellite and Product Operations, Satellite Products and Services Division, Suitland, MD, United States
Randle Meisner Laboratory for Atmospheric and Space Physics (LASP), University of Colorado-Boulder, Boulder, CO, United States
W. Paul Menzel Cooperative Institute for Meteorological Satellite Studies (CIMSS), University of Wisconsin-Madison, Madison, WI, United States
Steven D. Miller Cooperative Institute for Research in the Atmosphere, Colorado State University, Fort Collins, CO, United States
Kathryn Mozer NOAA Oceanic and Atmospheric Research, Office of Policy, Planning and Evaluation, Silver Spring, MD, United States
Steven Mueller Laboratory for Atmospheric and Space Physics (LASP), University of Colorado-Boulder, Boulder, CO, United States
Sharon Nebuda Cooperative Institute for Meteorological Satellite Studies (CIMSS), University of Wisconsin-Madison, Madison, WI, United States
Terrance G. Onsager NOAA Space Weather Prediction Center (SWPC), Boulder, CO, United States
Thomas H. Painter Joint Institute for Regional Earth System Science and Engineering, University of California, Los Angeles, CA, United States
Michael J. Pavolonis NOAA/NESDIS Center for Satellite Applications and Research, Advanced Satellite Products Branch, Madison, WI, United States
Rachel T. Pinker University of Maryland, Department of Atmospheric and Oceanic Science, College Park, MD, United States
Robert J. Redmon NOAA National Centers for Environmental Information (NCEI), Boulder, CO, United States
Alysha A. Reinard Cooperative Institute for Research in Environmental Sciences (CIRES), University of Colorado-Boulder; NOAA Space Weather Prediction Center (SWPC), Boulder, CO, United States
Juan V. Rodriguez NOAA National Centers for Environmental Information; Cooperative Institute for Research in Environmental Sciences (CIRES) at CU, Boulder, CO, United States
Scott D. Rudlosky NOAA/NESDIS Center for Satellite Applications and Research Satellite Climate Studies Branch, College Park, MD, United States
Chris Schmidt Cooperative Institute for Meteorological Satellite Studies (CIMSS), University of Wisconsin-Madison, Madison, WI, United States
Timothy J. Schmit NOAA/NESDIS Center for Satellite Applications and Research, Advanced Satellite Products Branch, Madison, WI, United States
Curtis Seaman Cooperative Institute for Research in the Atmosphere, Colorado State University, Fort Collins, CO, United States
Daniel B. Seaton Cooperative Institute for Research in Environmental Sciences (CIRES), University of Colorado-Boulder; NOAA National Centers for Environmental Information (NCEI), Boulder, CO, United States
Justin M. Sieglaff Cooperative Institute for Meteorological Satellite Studies, University of Wisconsin-Madison, Madison, WI, United States
Howard J. Singer Space Weather Prediction Center, National Oceanic and Atmospheric Administration, Boulder, CO, United States
Martin Snow Laboratory for Atmospheric and Space Physics (LASP), University of Colorado-Boulder, Boulder, CO, United States
William Straka, III Cooperative Institute for Meteorological Satellite Studies (CIMSS), University of Wisconsin-Madison, Madison, WI, United States
Pamela C. Sullivan National Oceanic and Atmospheric Administration (NOAA) National Environmental Satellite, Data, and Information Service (NESDIS), NASA Goddard Space Flight Center, Greenbelt, MD, United States
Ed Thiemann Laboratory for Atmospheric and Space Physics (LASP), University of Colorado-Boulder, Boulder, CO, United States
Christopher S. Velden Cooperative Institute for Meteorological Satellite Studies (CIMSS), University of Wisconsin-Madison, Madison, WI, United States
Rodney A. Viereck Cooperative Institute for Research in Environmental Sciences (CIRES), University of Colorado-Boulder; NOAA Space Weather Prediction Center (SWPC), Boulder, CO, United States
Katrina S. Virts NASA/Marshall Space Flight Center, Huntsville, AL, United States
Andi Walther Cooperative Institute for Meteorological Satellite Studies (CIMSS), University of Wisconsin-Madison, Madison, WI, United States
Xuanji Wang Cooperative Institute for Meteorological Satellite Studies (CIMSS), University of Wisconsin-Madison, Madison, WI, United States
Steven Wanzong Cooperative Institute for Meteorological Satellite Studies (CIMSS), University of Wisconsin-Madison, Madison, WI, United States
Donald L. Woodraska Laboratory for Atmospheric and Space Physics (LASP), University of Colorado-Boulder, Boulder, CO, United States
Thomas N. Woods Laboratory for Atmospheric and Space Physics (LASP), University of Colorado-Boulder, Boulder, CO, United States
Yunyue Yu NOAA/NESDIS Center for Satellite Applications and Research, Environmental Monitoring Branch, College Park, MD, United States
Peng Yu Earth System Science Interdisciplinary Center, University of Maryland, College Park, MD, United States
Hai Zhang I.M. Systems Group, Inc., Rockville, MD, United States
Preface
It is not every day when you get to be a part of history, and it is even rarer to see and participate in an endeavor that positively changes the lives of billions now and in the future. The Geostationary Operational Environmental Satellites (GOES)-R Series (GOES-R) provides exactly that—a technical, intellectual, and scientific adventure to observe and understand our planet and to inform and instruct us all on how to see the world and to thrive on it. It was my privilege to be a part of the team that brought GOES-R to completion and delivered the satellites to the world.
The United States deployed the first geostationary satellites to observe weather and other environmental phenomena over 50 years ago. The National Oceanic and Atmospheric Administration (NOAA), working with the National Aeronautics and Space Administration (NASA) and with many academic and industrial partners, has been continuously operating GOES since 1975, and over the years GOES observations have gradually become a part of daily lives. Through the first 15 GOES, NOAA and NASA learned how to build instruments and satellites to deliver nearly continuous observations of high impact environmental phenomena such as severe storms, hurricanes, flash floods, fires, volcanic eruptions, and solar storms, and showed us which measurements were the most informative. But when the last satellite, GOES-15, was launched in 2010, it was flying with technology developed in the 1980s.
Between 1999 and 2006, NOAA led an effort, working with NASA and a broad coalition of experts from throughout the Earth observing, solar imaging, and space weather monitoring community, to envision what was necessary and what was possible for the future GOES. In the 44 years since the first GOES was launched, our understanding of the entire Earth environment has expanded, technology for satellites and Earth observing instruments has grown tremendously, and most significantly, our ability to process and interpret mammoth data rates from multiple sources has changed our perception of what could be done with a new GOES system.
The GOES-R Series is the result of that reimagining of geostationary observations and their place in monitoring the overall Earth, solar, and space environment.
In the chapters that follow, you will learn from those same scientists and engineers, numerical modelers, instrument developers, programmers, and program managers who considered the possibilities and then worked for decades to make GOES-R a reality. These men and women and the teams they led and worked with are the true visionaries of our Earth observation world, and we all benefit from their focus. Their reward is to revel in the wealth of data and information GOES-R is providing and will continue to provide for another 20+ years.
As you read through this wonderful book (or skip directly to your favorite chapter), I ask you to do two things. First, pay attention to how the authors describe what defined the instrument or application in question, what was the requirement that drove them. But also look at how they have continued to explore the ultimate possibilities of what we might learn from the measurements. These research efforts and aspirational applications will determine the ultimate value of GOES-R. Second, as you read, have a computer nearby so you can visit your favorite NOAA website with GOES-R data (https://www.goes-r.gov/) available for inspection, and look at the amazing video loops and movies—these are not simulations—coming from the GOES-R instruments. Above all else, it is the introduction of the real-time movie views from the many sensors that set GOES-R apart from everything that came before it.
Stephen Volz Assistant Administrator, NOAA Satellite and Information Service, Bethesda, MD, United States
Acknowledgments
Many people deserve thanks for their help in bringing this book to fruition. Completing this book could not have been achieved without the contributions from the many chapter authors. A full author list can be found in the Contributors section. Special thanks goes to Michelle McMurdy Smith, ADNET Systems Inc., whose many contributions, including extensive editing, coordination and organization, were invaluable to this effort. Additionally, thanks to Richard Reynolds, M2 Strategies, for coordinating and editing content. Thanks also to Harry Cikanek, NOAA Center for Satellite Applications and Research, for reviewing several chapters.
We wish to acknowledge the support of NOAA, NASA, and the GOES-R Program as well as our academic and industry partners. This work, like the GOES-R mission, is truly a collaborative effort. Also thanks to Elsevier and Hilary Carr for their guidance and support in preparing this book for publication. Lastly, the editors would like to thank Greg Mandt, our long-time GOES-R System Program Director, for his leadership and unfailing support of the GOES-R team through the development and launch of the first satellite in the series.
Abbreviations and Acronyms
A
AATSR Advanced Along-Track Scanning Radiometer
ABBA automated biomass burning algorithm
ABI Advanced Baseline Imager
ACARS Aircraft Communications, Addressing, and Reporting System
ACHA AWG cloud height algorithm
ACM ABI cloud mask
ACRF Attitude Control Reference Frame
ADDE Abstract Data Distribution Environment
ADIS angle detecting inclined sensor
ADM angular distribution model
ADP aerosol detection product
ADS Astrophysics Data System (NASA)
ADT Advanced Dvorak Technique
AERI Atmospheric Emitted Radiance Interferometer
AERONET AErosol RObotic NETwork
AEROSE Aerosols and Ocean Science Expeditions
AFA average flash area
AGRI Advanced Geostationary Radiation Imager
AHI Advanced Himawari Imager
AI artificial intelligence
AMI Advanced Meteorological Imager
AMSR Advanced Microwave Scanning Radiometer
AMV atmospheric motion vector
ANN artificial neural network
AOD aerosol optical depth
AOF atmospheric optical functions
APID application process identifier
AQI air quality index
ARM Atmospheric Radiation Measurement
ASR all-sky radiance
ASTER Advanced Spaceborne Thermal Emission and Reflection Radiometer
ATBD Algorithm Theoretical Basis Document
ATK Orbital Alliant Techsystems
ATS Applications Technology Satellite
AU astronomical unit
AVHRR Advanced Very High-Resolution Radiometer
AWG Algorithm Working Group
AWIPS Advanced Weather Interactive Processing System
B
BCM binary cloud mask
BRDF bidirectional reflectance distribution function
BRF
Body Reference Frame
BT brightness temperature
BTD brightness temperature difference
C
CADU channel access data unit
CALIOP Cloud-Aerosol Lidar with Orthogonal Polarization
CALIPSO Cloud-Aerosol Lidar and Infrared Pathfinder Satellite Observation
CAPE convective available potential energy
CART Cloud and Radiation Testbed
CBU Consolidated Backup
CCD charge-coupled device
CCL cloud cover layers
CCOR Compact Coronagraph
CCSDS Consultative Committee for Space Data Systems
CDO central dense overcast
CDRL contract data requirements list
CEOS Committee on Earth Observation Satellites
CERES Clouds and the Earth’s Radiant Energy System
CG cloud-to-ground (lightning)
CGMS Coordination Group for Meteorological Satellites
CI convective initiation
CIMSS Cooperative Institute for Meteorological Satellite Studies
CIR co-rotating interaction regions
CIRA Cooperative Institute for Research in the Atmosphere
CIRES Cooperative Institute for Research in Environmental Sciences
CLASS Comprehensive Large Array-data Stewardship System
CMA China Meteorological Administration
CME coronal mass ejection
CMI cloud and moisture imagery
CMIP cloud and moisture imagery product
CMORPH CPC Morphing technique
COD cloud optical depth
CONUS contiguous United States
COSPAR Committee on Space and Atmospheric Research
COT cloud optical thickness
CPAF cold pixels around fire
CPC Climate Prediction Center
CPS cloud particle size
CRADA Cooperative Research and Development Agreements (NOAA)
CRTM community radiative transfer model
CSR clear-sky radiance
CV coefficient of variation
CWA county warning area
CWG Calibration Working Group
CWP cloud water path
D
DB direct broadcast
DCOMP daytime cloud optical and microphysical properties
DCS Data Collection System
DISORT discrete-ordinates radiative transfer model
DMW derived motion winds
DNN deep neural network
DoD Department of Defense
DPI derived product image
DPR Dual-frequency Precipitation Radar
DQF data quality flag
DSCOVR Deep Space Climate Observatory
DSR downward shortwave radiation
E
ECI Earth-Centered Inertial
ECM enterprise cloud mask
ECMWF European Centre for Medium-Range Weather Forecasts
ECV essential climate variable
EHIS Energetic Heavy Ion Sensor
EM enterprise management
EMWIN Emergency Managers Weather Information Network
EOF Empirical Orthogonal Function
EOS Earth Observing System (NASA)
EPA Environmental Protection Agency
EPN Earth Polar (Parallel) Normal
EPP Earth Pointing Platform
EPS Enterprise Processing System
ERBE Earth Radiation Budget Experiment
ESA electrostatic analyzer
ESA European Space Agency
ESD electrostatic discharge
ESPC Environmental Satellite Processing Center
EUMETSAT European Organisation for the Exploitation of Meteorological Satellites
EUV extreme ultraviolet
EUVS Extreme Ultraviolet Sensor
EXIS Extreme Ultraviolet and X-ray Irradiance Sensors
F
FARMS Fast All-sky Radiation Model for Solar Applications
FCI Flexible Combined Imager
FD full disk
FDC fire detection and characterization
FDCA fire detection and characterization algorithm
FEC forward error correction
FED flash extent density
FEP front end processor
FGF fixed grid format
FGM fluxgate magnetometer
FHS fire/hot spot
FITS Flexible Image Transport System
FLASHFlux Fast Longwave And SHortwave Radiation Fluxes
For a description of relevant terms, please visit the American Meteorological Society Glossary of Meteorology at http://glossary.ametsoc.org/wiki/ Main_Page
XRS
1GOES-R Series Introduction
Steven J. Goodman
GOES-R Program Chief Scientist (Retired), Thunderbolt Global Analytics, Huntsville, AL, United States
The Geostationary Operational Environmental Satellites (GOES) constellation has been a key component of the Earth and solar observing system for more than 40 years. The satellite system is sometimes referred to as our sentinel in space as it provides life-saving observations of high-impact environmental phenomena such as severe storms, hurricanes, fires, and volcanic eruptions across Earth’s Western Hemisphere throughout the day and night. Simultaneously, observations of the Sun provide warning of attendant space weather effects on orbiting satellites, communications systems, the electric grid, aviation workers and passengers, and even astronauts exposed to solar storm radiation while living and working on the International Space Station. GOES data are used qualitatively in image interpretation and quantitatively as derived geophysical products.
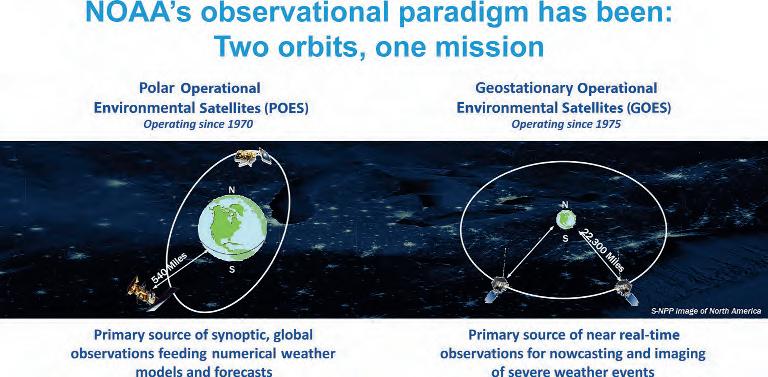
We live in the golden age of Earth observations. The GOES-R Series (GOES R, S, T, U) is the follow-on geostationary replacement block of satellites providing continuity for yet another generation of users and offers the first significant upgrade in instrument capability in decades. Six new and improved instruments were developed for each of the four satellites in the GOES-R Series. The first satellite in the series, GOES-16, was launched in November 2016, and the second satellite, GOES-17, was launched in March 2018. Following launch and orbit-raising, the prelaunch letter designation for each of the geostationary satellites is then changed to a number. Thus, GOES-R, the first satellite in the series, became known as GOES-16 fifteen days after launch when it reached geostationary orbit. Following postlaunch checkout, the satellite was moved from its in-orbit test position at 89.5 W to its operational location. GOES-16 is located at 75.2 W, GOES-17 is located at 137.2 W, and GOES-T (future GOES-18) is planned to become an on-orbit spare at 105 W when it is launched in the coming years. GOES-16 and GOES-17 are now operational following postlaunch testing that included instrument performance and product validation reviews (Fig. 1.1). Together these new satellites join the National Oceanic and Atmospheric Administration (NOAA) constellation of Earth-observing satellites that provide users with unprecedented spatial, temporal, and spectral resolution, enabling improvements in terrestrial and space weather forecasts and warnings (Fig. 1.2).
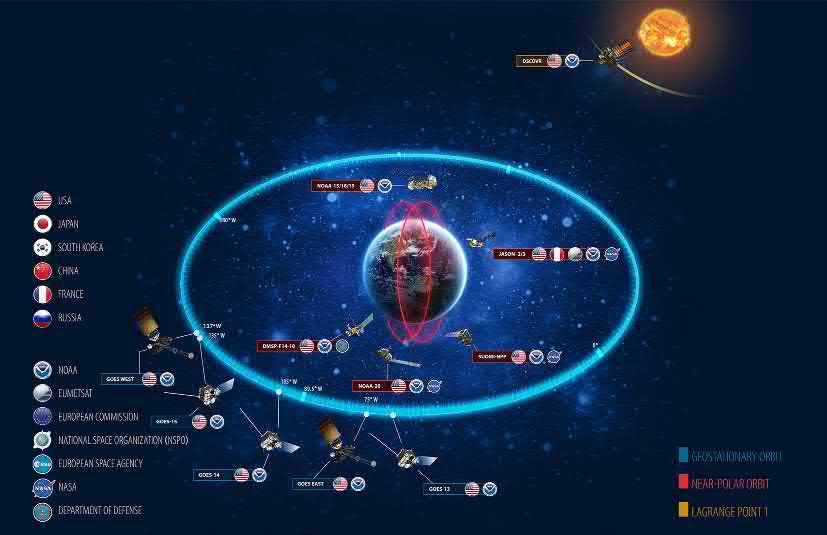
GOES-16 and GOES-17 are the US contribution to the global geostationary satellite constellation. Several other countries, or group of countries, now contribute or plan to contribute to the operational constellation. This includes Europe, Japan, Russia, India, China, and Korea (Fig. 1.3). The reader is directed to the World Meteorological Organization (WMO) observing systems capability webpage at http://www.wmo-sat.info/oscar/ for extensive information on the current and planned capabilities of the global satellite observing system.
The purpose of this book is to offer a college-level reference that provides interested readers an introduction to the physical basis for the collection of imagery and diverse applications of societal benefits that are readily available to faculty, students, researchers, forecasters, and the public.
The scope of the chapters in this book is designed to introduce the data, products, and imagery not always accessible from a single source. We refer the reader to the GOES-R Series Data Book (2019) and the GOES-R Series Product Definition and Users’ Guide (2018) for additional information on the instruments and data products (L1b, L2). Level 1b products represent calibrated measurements expressed in terms of physical units that are generated from Level 0 observation data during ground processing. Level 1b products contain information that locates their constituent data in space and time. Level 2 data represent the derived geophysical variables at the same resolution and location of the Level 1 source data. The physical basis, requirements specification, and planned validation of individual geophysical algorithms are described in the Algorithm Theoretical Basis Documents (ATBDs) for each product and may supplement the material in the individual chapters. The ATBDs, and the products themselves, are evolving.
FIG. 1.1 Since the 1960s—before NOAA even existed—polar and geostationary satellites observations have been openly available to all who can use the data. GOES-16 is GOES East and GOES-17 is GOES West. GOES joins the Joint Polar Satellite System (JPSS) to complete NOAA’s new generation constellation of environmental Earth observation satellites.
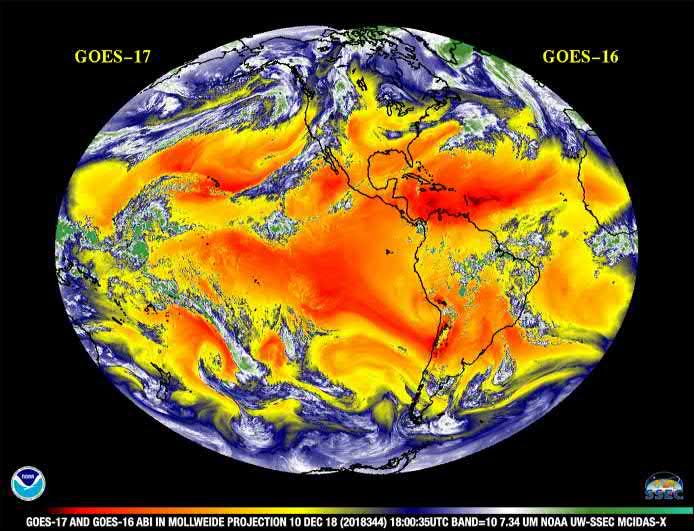
Combined GOES-17/GOES-16 band 10 full-disk low-level water vapor image of the Western Hemisphere. Courtesy of CIMSS.
The information presented in this work represents current status as of the time of publication (2019). Key documents and many other user resources are found at the GOES-R Series website https://www.goes-r.gov/, the NOAA National Centers for Environmental Information (NCEI) website https://www.ncdc.noaa.gov/data-access/satellitedata/goes-r-series-satellites, and the NOAA Center for Satellite Applications and Research website https://www.star. nesdis.noaa.gov/goesr/. The reader should note that Level 2 products for the space weather instruments were not within the scope of the original GOES-R Series operational requirements, only the Level 1b calibrated measurement for each of the four space weather instruments were required. Subsequently, Level 2 space weather products were deemed critical to National Weather Service operational space weather forecasting. As a result, these space weather instrument products came later. Product user guides and additional information are at the NCEI website https:// www.ngdc.noaa.gov/stp/satellite/goes-r.html.
With the improved GOES imaging capabilities comes an extensive set of examples that are best viewed as full high-definition color animations and movies in the electronic version of this book. The book begins with a brief
FIG. 1.2
FIG. 1.3 Global satellite coverage presents a great opportunity and challenge for data synergy and exploitation. The new generation of geostationary environmental satellites will produce a many-fold increase in near real-time data as well as the products and applications derived from them. Making all of the different data interoperable and complementary for the operational and research communities is necessary to turn the observations into usable information.
history of geostationary weather satellites. Chapter 3 provides an overview of the GOES-R Series spacecraft and the instruments from which imagery and products are derived. The majority of chapters addresses the imagery and derived quantitative Earth-viewing products followed by four solar and space weather product chapters. In each of these chapters, we describe the physical basis for the algorithm or product recipe, the methodology, the validation approach and maturity, and future capabilities and applications made possible by new science maturity and understanding since the algorithms were first conceived of more than ten years ago. The terminology for the spectral channels or bands used to create the derived product imagery discussed herein is used interchangeably. Select product examples, as well as references, are included with each chapter. There is also a chapter that discusses the means of data dissemination to users. In the final chapter, we provide a summary and offer a look into the future of NOAA’s next-generation satellite constellation. For the reader interested in a deeper dive into the principles of satellite remote sensing and instrument calibration/validation, the first two volumes in the ninevolume book (e-book) by Liang (2017) may also serve as a complementary reference.
Acknowledgments
I wish to thank my many colleagues without whom the GOES-R Mission and this book would have not been possible. I offer a special thanks to the members of our editorial team in the GOES-R Program: Michelle Smith, Dick Reynolds, Robert Redmon, Timothy Schmit, and Jaime Daniels. I also wish to acknowledge the support of both NOAA and NASA and the support of NASA grant 80NSSC18K1689. Thanks also to Michael Ames for editing figures for this chapter. I’d also like to thank Elsevier who came to me more than three years ago before the launch of GOES-16 with the idea for a book on geostationary weather satellites. The emphasis was to be on the imagery and applications, and we tried to meet this goal primarily focused on the results from GOES-16 as the data and products are operational and available to the public. At this time, GOES-17 is also operational although products are in the early phase of their operational evaluations. The views, opinions, and findings contained in this report are those of the authors and should not be construed as an official National Oceanic and Atmospheric Administration, National Aeronautics and Space Administration, or other US Government position, policy, or decision.
References
GOES-R Series, 2018. Product Definition and Users’ Guide. Volume 3: Level 1b Products, 1 November 2018 DCN 7035538, Revision 2.0, available at https://www.goes-r.gov/users/docs/PUG-L1b-vol3.pdf
GOES-R Series Data Book, 2019. CDRL PM-14 Rev A. May 2019, NOAA-NASA. Available at https://www.goes-r.gov/downloads/resources/ documents/GOES-RSeriesDataBook.pdf
Liang, S. (Ed.), 2017. Comprehensive remote sensing. Elsevier. eBook ISBN: 9780128032213, Book ISBN 9780128032206, 3134 pp.
History of Geostationary Weather Satellites
W. Paul Menzel
Cooperative Institute for Meteorological Satellite Studies (CIMSS), University of Wisconsin-Madison, Madison, WI, United States
2.1 THE EARLY DAYS
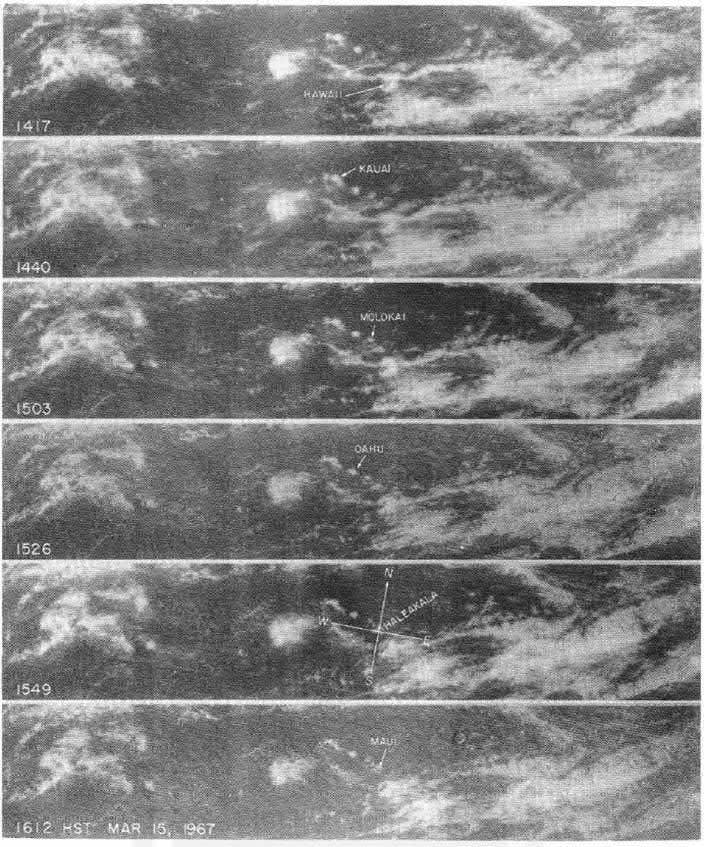
The first satellite with an onboard camera capable of continuous Earth viewing from a geostationary orbit was launched on December 6, 1966. On that day, the Applications Technology Satellite (ATS-1) was placed in an equatorial orbit at 38,000 km with an orbit period of 24 h; part of its payload was the Spin Scan Cloud Camera (SSCC, Suomi and Parent, 1968) that provided full-disk visible images of Earth and its cloud cover in 20 min. The SSCC was a last minute add on to the ATS-1 platform; Verner Suomi convinced Homer Newell at the National Aeronautics and Space Administration (NASA) to add this new capability after the satellite was already well into its fabrication. Inspired by instant replay when watching a Green Bay Packers football game, Suomi was determined to realize a similar replay for watching weather. Robert Parent provided the requisite engineering expertise to develop the camera that provided the first global animations of cloud systems in motion. Noting “the clouds move, not the satellite,” Suomi applauded his weather movies (see Fig. 2.1). Researchers immediately achieved new understanding of large-scale equatorial air mass flows (Fujita et al., 1969) and were soon routinely producing estimates of atmospheric motions by tracking cloud features in sequences of three images with half an hour separation (Hubert and Whitney, 1971). The meteorological community came to rely on the weather movies. By the spring of 1972, the first movie loops were being introduced at the National Severe Storms Forecast Center.
Based on the meteorological success of ATS-1 and ATS-3 (which carried a color version of the SSCC a year later), NASA developed the Synchronous Meteorological Satellite (SMS) as an operational prototype. SMS-1 was launched in May 1974 and SMS-2 followed in February 1975; both carried the Visible Infrared Spin Scan Radiometer (VISSR) with day and night viewing of weather movement. Positioned above the equator at 75 and 135 W, they provided views of North and South America along with the adjacent Pacific and Atlantic Oceans. Today the eastern and western Geostationary Operational Environmental Satellites (GOES) are located in approximately the same positions. SMS-1 and SMS-2, and the subsequent National Oceanic and Atmospheric Administration (NOAA) GOES, provided three important functions that remain (with the GOES-R Series providing vast improvements in spatial, temporal, and spectral resolution) central to today’s geostationary satellite program: (a) providing visible and infrared window images every half hour at 1- and 7-km spatial resolution, respectively, with the VISSR; (b) transmitting low-resolution satellite images and conventional weather maps to users with low cost receiving stations, via Weather Facsimile (WEFAX); and (c) relaying data from remote data collection platforms to a central processing facility, via the Data Collection System (DCS).
2.2 OTHER NATIONS JOIN IN
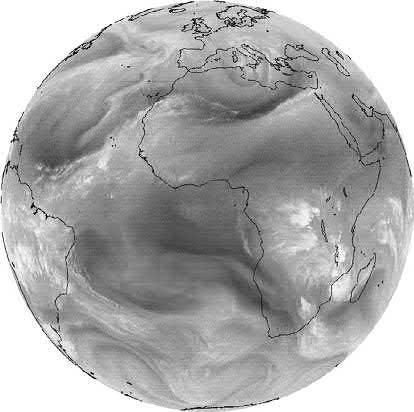
In 1977, the European Space Agency began imaging from geostationary orbit near the Greenwich meridian with the Meteosat Visible and Infrared Imager (MVIRI). It provided visible imagery at 2.5-km spatial resolution, infrared window band imagery at 5-km spatial resolution, and also water vapor band imagery at 5-km spatial resolution. The water vapor images (see Fig. 2.2) gave a very different view of planet Earth. Sensitive primarily to upper tropospheric humidity and high cloud features, they revealed synoptic scale circulations that resembled a marble cake mix (Morel et al., 1978). Interpreting these indications of mid-atmospheric flow became a new research focus. With
METEOSAT 6.7-μm water vapor sensitive infrared image from 1978 with continental outlines overlaid. Darker features indicate warmer temperatures detected in drier regions while lighter features indicate cooler temperatures associated with more moisture and ultimately cloudy regions.
FIG. 2.1
FIG. 2.2
the addition of another VISSR on the Japanese Geostationary Meteorological Satellite (GMS) at 140 E longitude, two GOES, GMS, and Meteosat were coordinated to define atmospheric circulations as part of the Global Atmospheric Research Program (GARP) in 1979. Organized by the Committee on Space and Atmospheric Research (COSPAR), this was the first international experiment with global coverage using satellites.
Images from geostationary satellites helped to advance the understanding of mesoscale phenomena (Purdom, 1976), just as measurements from polar-orbiting satellites had shed new light on synoptic-scale weather events. Moreover, rapid interval imaging became an important new component of the GOES program. SMS and GOES were programmed periodically to acquire a series of images at 3-min intervals for the study of severe storm development. The associated calibrated radiances were demonstrated to be useful in determining thunderstorm intensity (e.g., Adler and Fenn, 1979 among many others). Over the years, results from the research community were adopted into satellite operations, and by the mid-1980s, 5-min interval imagery became routine during severe storm outbreaks.
2.3 EVOLVING GOES
In 1980, with the help of the NASA Operational Satellite Improvement Program (OSIP), GOES demonstrated an atmospheric temperature and moisture sounding capability. Under OSIP, NASA developed and tested new technologies that could add value to NOAA operational programs. With the addition of new spectral bands to the operational VISSR, the experimental VISSR Atmospheric Sounder (VAS) on GOES-4 through -7 featured 12 infrared spectral bands at 7- and 14-km resolution whose radiances were sensitive to atmospheric water vapor or carbon dioxide as well as two transparent windows; VAS also sensed visible radiances at 1-km resolution. While representing a major improvement in satellite capabilities (Smith et al., 1981, 1982), the utilization was limited since the requirement for operational half hourly visible and infrared imaging left little time for routine sounding (both could not be done simultaneously). Furthermore, VAS on a spinning satellite, viewing Earth only 5% of the time, was unable to attain the instrument signal-to-noise needed for either high-quality soundings or high spatial resolution infrared imaging. Recognizing those limitations, NOAA developed its next generation of geostationary satellites to be on three-axis stable platforms with separate imaging and sounding instruments.
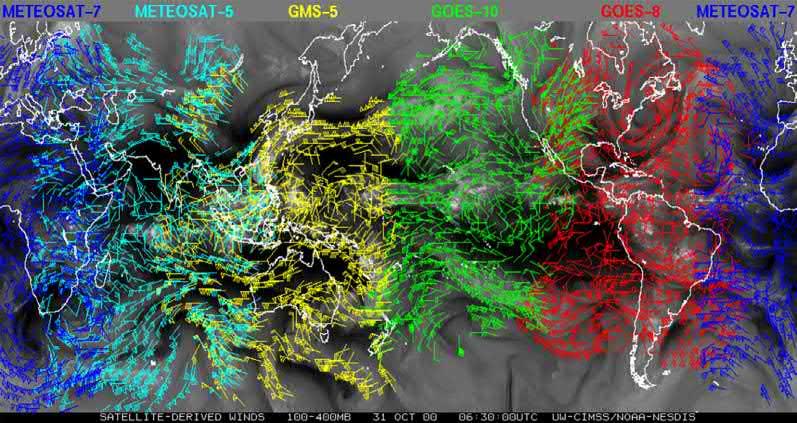
The launch of GOES-8 in 1994 introduced operational imaging and sounding that was continued through GOES-15 (Menzel and Purdom, 1994). The imager sensed five spectral bands in the visible and infrared at approximately 1- and 4-km resolution, respectively, and was capable of full-disk coverage in 30 min. Combining the coverage of two GOES imagers with their companion imagers from Meteosat and GMS, near global atmospheric motion vectors in the tropics and mid-latitudes were routinely being produced from tracking clouds. Fig. 2.3 shows an example from October 31, 2000 derived with data from Meteosat-7, -5, GOES-10, -8, and GMS-5 (listed from Greenwich meridian eastward).
In the United States, the utilization of GOES data was enhanced by the GOES Improved Measurements and Products Assurance Program (GIMPAP) wherein researchers conducted radiance calibration, product validation,
FIG. 2.3 In the 1990s, five geostationary imagers were routinely being used to provide near global coverage in the tropics and mid-latitudes of cloud tracked atmospheric motion vectors (AMVs). This example from October 31, 2000 shows AMVs derived from half hourly sequences of images from Meteosat-7, -5, GOES-10, -8, and GMS-5.
and new application studies. Subsequently, as preparations for the next generation of GOES got underway, the GOES-R Risk Reduction and Proving Ground Program complemented the GIMPAP efforts (Goodman et al., 2012). Both of these programs fostered continued research and development after the launch of GOES.
2.3.1 The GOES Sounder
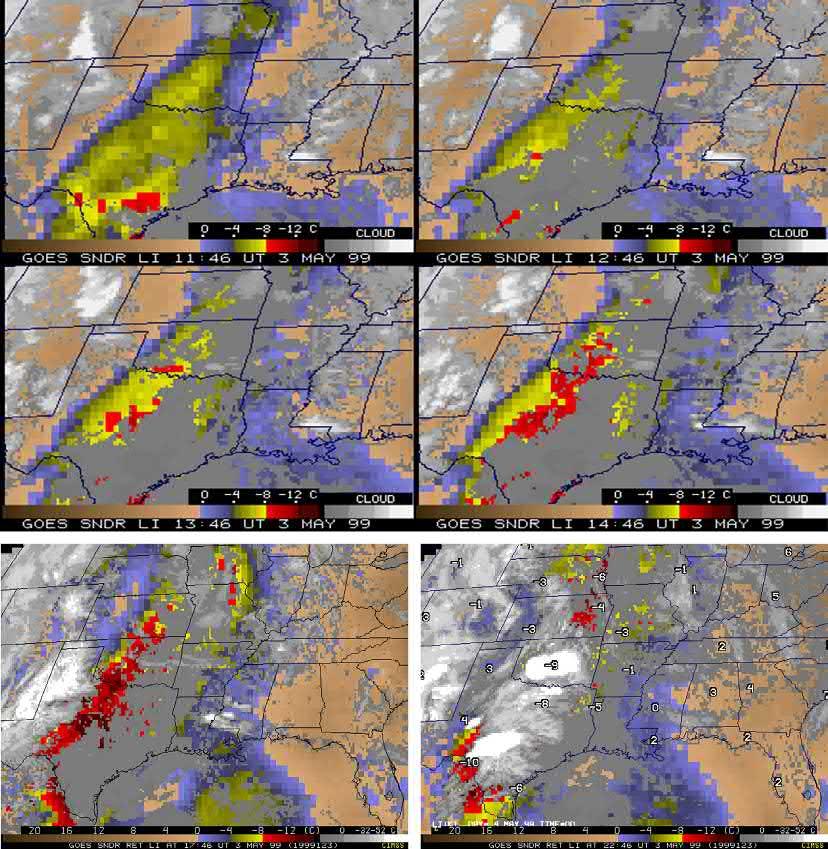
The GOES-8 sounder measured infrared radiation in 18 spectral bands sampled every 10 km, ranging in wavelength from 3.7 to 14.7 μm; these measurements enabled temperature and moisture vertical profile retrieval in cloud free skies. These soundings were demonstrated to be useful in a variety of applications (Menzel et al., 1998). An example from May 3, 1999 (see Fig. 2.4) demonstrates the advantage of continuous monitoring of atmospheric stability. A sequence of the hourly GOES lifted index (LI) derived product images (DPI) over the western plains, showing LI values derived from soundings in clear skies and cloud temperatures elsewhere, shows strong destabilization in
This sequence of the GOES lifted index (LI) derived product images (DPI, showing sounding values in clear skies and cloud temperatures elsewhere) at hourly intervals (upper four panels) from 11:46 UTC to 14:46 UTC May 3, 1999 over the western plains shows strong destabilization in southern Texas feeding into Oklahoma as LI values of 8 to 12°C in red expand their extent. The unstable air in southern Texas at the beginning organizes into a line of instability from western Texas into central Oklahoma. Later in the day, GOES LI DPI for 17:46 UTC (lower panel left) and 22:46 UTC (lower panel right) show the line of instability has extended into Nebraska at 17:46 UTC and the most unstable air is moving northeast and foreshadowing the deep convective clouds apparent at 22:46 UTC. A tornado touched down at 23:00 UTC in Oklahoma City (where the radiosonde LI value at 00:00 UTC indicates 9°C). Radiosonde LI determinations at 00:00 on May 4, 1999 (superimposed on the GOES LI DPI of 22:46 UTC) show very unstable air (LI of 4 to 10°C) across Nebraska, Oklahoma, and Texas.
FIG. 2.4
southern Texas feeding into Oklahoma during the afternoon, giving an indication of severe weather 6 h in advance of an EF5 tornado in Moore, Oklahoma. The GOES combination of images and soundings enabled forecasters to monitor several times an hour where instability was leading to deep convection. With this supporting evidence, severe weather watch boxes from the Storm Prediction Center (SPC) could be reduced in size and be offered with extended lead times. Data from GOES-8 through 15 has become a critical part of National Weather Service operations, with direct reception of the full-digital GOES data stream at national centers while local weather service forecast offices receive a full complement of digital imagery from AWIPS (Advanced Weather Interactive Processing System). Additionally, quantitative products including cloud drift winds, thermodynamic soundings and stability parameters, and precipitation amounts have been routinely produced from GOES data.
2.4 ADVANCED GEO IMAGERS
In 2002, Europe introduced an improved imager capable of measurements in 12 visible and infrared spectral bands at 1- and 3-km resolution, respectively, with full-disk coverage every 15 min (Schmetz et al., 2002). This started the movement toward the next generation of geostationary imagers now being introduced. In 2014 Japan began operations with the Advanced Himawari Imager (AHI) on Himawari-8 that features measurements in 16 spectral bands at 2-km infrared and 0.5-km visible resolution with 5- (10-) min regional (full Earth disk) refresh. The United States followed in 2016 with a nearly identical Advanced Baseline Imager (ABI), manufactured by the same vendor, on GOES-16 and GOES-17 (Schmit et al., 2005); Fig. 2.5 shows an example of reflected visible radiation sensed by GOES-16, displayed as a red-green-blue enhanced color image. China introduced the first Advanced Geostationary Radiation Imager (AGRI) on FengYun (FY)—4A with 1–4-km resolution in 14 spectral bands in 2017, with more capable versions soon to follow (Yang et al., 2017). South Korea also has an ABI-like capability, with the Advanced Meteorological Imager (AMI), launched on Geo-KOMPSAT-2A in 2018. Europe will evolve to the Flexible Combined Imager (FCI) in 2021 on Meteosat Third Generation (MTG I1), featuring comparable geostationary imaging capabilities. With many space agencies embarking on imagers with similar capabilities, the near future will see global coverage (of all but the poles) at 10–15-min intervals from a family of geostationary imagers; Table 2.1 provides some of the details.
The current geostationary satellite images provide weather information at least every 1 km with visible data (every 2 km with infrared data) and hence show features that are infrequently detected by fixed observing sites. Cloud patterns in a satellite image provide a visualization of an instant in a mesoscale meteorological process. When the images are viewed in animation, the development of important small-scale features is often detected. This adds a
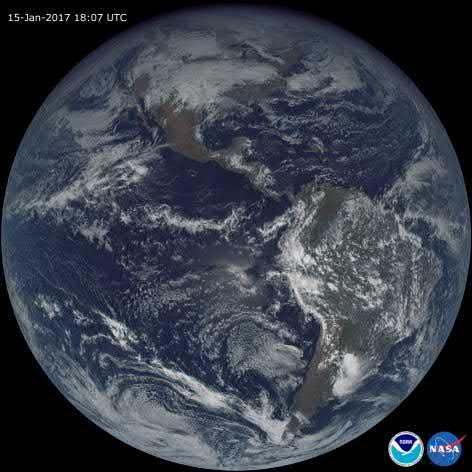
FIG. 2.5 Enhanced color image of reflected visible radiation sensed by GOES-16 on January 15, 2017, in which the light areas are associated with clouds or snow/ice and dark areas with warmer surface or near surface features. The continental outlines of North and South America can be discerned.
TABLE 2.1 Geostationary imagers for the coming decades
a In April 2019, the operational scan mode for GOES-16 and GOES-17 changed from flex mode, which provided a full-disk scan every 15 min, to 10-min flex mode which provides the full-disk scan every 10 min.
new dimension to mesoscale reasoning since the satellite observations are made at temporal and spatial resolutions compatible with the scale of the mechanisms responsible for intense convective storms.
2.5 HIGH SPECTRAL RESOLUTION GEO SOUNDERS
Geostationary sounding continues to evolve as high spectral resolution infrared measurements with a geostationary perspective are being demonstrated. China is demonstrating the capabilities of a Geostationary Interferometric Infrared Radiation Sounder (GIIRS) since 2017 (Yang et al., 2017); operational versions will be added in the next decade. These will feature contiguous coverage of 6000 × 5000 km accomplished in less than 60 min using an interferometer, focal plane detector arrays, and onboard data processing to cover segments of the 3.7–15.4-μm spectrum in 2000 adjacent narrow spectral bands with better than 10-km resolution. Europe will follow with their Infrared Radiation Sounder (IRS) on MTG-S1 in the early 2020s; MTG-S1 will have 4-km spatial resolution and cover two spectral bands at 0.625-cm 1 resolution (14.3–8.26 μm and 6.25–4.6 μm).
2.6 THE FUTURE
Time continuous measurements from GOES sensors have promoted great advances in weather monitoring and forecasting for the United States and prompted geostationary contributions from our international partners with near global coverage. The trend is for measurements in more spectral bands at higher spatial resolution with faster coverage. Microwave sounding from geostationary orbit is also under consideration. The future is very exciting.
Acknowledgments
The author is thankful for the NOAA and NASA support that has allowed him to pursue GOES related studies over the past 40 years (most recently the NOAA GOES-R Program Contract NA15NES4320001 has supported his work).
References
Adler, R.F., Fenn, D.D., 1979. Thunderstorm intensity as determined from satellite data. J. Appl. Meteorol. 18, 502–517. Fujita, T., Watanabe, K., Izawa, T., 1969. Formation and structure of equatorial anticyclones caused by large-scale cross-equatorial flows determined by ATS-1 photographs. J. Appl. Meteorol. 8, 649–667.
Goodman, S.J., Gurka, J., DeMaria, M., Schmit, T., Mostek, A., Jedlovec, G., Siewert, C., Feltz, W., Gerth, J., Brummer, R., Miller, S., Reed, B., Reynolds, R., 2012. The GOES-R proving ground: Accelerating user readiness for the next generation geostationary environmental satellite system. Bull. Am. Meteor. Soc. 2012, 1029–1040. https://doi.org/10.1175/BAMS-D-11-00175.1
Menzel, W.P., Purdom, J.F.W., 1994. Introducing GOES-I: The first of a new generation of Geostationary Operational Environmental Satellites. Bull. Amer. Meteor. Soc. 75, 757 781.
Menzel, W.P., Holt, F.C., Schmit, T.J., Aune, R.M., Schreiner, A.J., Wade, G.S., Ellrod, G.P., Gray, D.G., 1998. Application of the GOES-8/9 soundings to weather forecasting and nowcasting. Bull. Amer. Meteor. Soc. 79, 2059–2077.
Morel, P., Desbois, M., Szejwach, G., 1978. New insight into the troposphere with the water-vapor channel of Meteosat. Bull. Amer. Meteor. Soc. 59, 711–714.
Purdom, J.F.W., 1976. Some uses of high resolution GOES imagery in the mesoscale forecasting of convection and its behavior. Mon. Wea. Rev. 104, 1474–1483.
Schmetz, J., Pili, P., Tjemkes, S., Just, D., Kerkmann, J., Rota, S., Ratier, A., 2002. An introduction to Meteosat second generation (MSG). Bull. Amer. Meteor. Soc. 83 (7), 977–992.
Smith, W.L., Suomi, V.E., Zhou, F.X., Menzel, W.P., 1982. Nowcasting applications of geostationary satellite atmospheric sounding data. Published in In: Browning, K.A. (Ed.), Nowcasting. Academic Press, Inc., (London) Ltd, pp. 123–135.
Suomi, V.E., Parent, R., 1968. A color view of planet earth. Bull. Amer. Meteor. Soc. 49, 74–75.
Yang, J., Zhang, Z., Wei, C., Lu, F., Guo, Q., 2017. Introducing the new generation of Chinese geostationary weather satellites, Fengyun-4. Bull. Amer. Meteor. Soc. 98 (8), 1637–1658.
Further Reading
Menzel, W.P., 2001. Cloud tracking with satellite imagery: From the pioneering work of ted Fujita to the present. Bull. Amer. Meteor. Soc. 82, 33–47.
GOES-R Series Spacecraft and Instruments
Pamela C. Sullivan
National Oceanic and Atmospheric Administration (NOAA) National Environmental Satellite, Data, and Information Service (NESDIS), NASA Goddard Space Flight Center, Greenbelt, MD, United States
3.1 GOES-R MISSION HISTORY AND OVERVIEW
The Geostationary Operational Environmental Satellites (GOES)-R Series is the National Oceanic and Atmospheric Administration’s (NOAA’s) newest generation of geostationary weather satellites. Developed under a partnership between NOAA and the National Aeronautics and Space Administration (NASA), the first of the series of four satellites (R, S, T, U) was launched on November 19, 2016. The GOES-R Series replaces satellites from the previous generation GOES-N Series (GOES-13,-14,-15), which entered service in 2010, providing dramatic upgrades in sensor technology, improving on both the GOES-N Series and the GOES-IM Series, which entered service in 1994. Six new remote sensing instruments were designed for each of the four spacecraft in the GOES-R Series and they provide significant improvements in spectral, temporal, and spatial coverage and introduce new observational capabilities including the first operational lightning mapper. The instrument complement and the data products derived from them are listed in Table 3.1. Additional information on the instruments and the data products can be found in the GOES-R Series Data Book (2019) and the GOES-R Series Product Definition and Users’ Guide (2018).
Planning for GOES-R began in the late 1990s ( Hillard et al., 1997 ). Starting in 2001, study concepts were competitively issued to industry with the objective of assessing technical feasibility for each instrument. These studies helped define the Level I requirements for the system, which were baselined in 2006. The GOES-R concept originally included an infrared sounder, the Hyperspectral Environmental Suite (HES), but it was removed after studies showed the complexity and cost of including this instrument. In 2019, the decision was made to include the Naval Research Laboratory’s Compact Coronagraph (CCOR) instrument on GOES-U. CCOR will serve NOAA’s need for space weather observations by detecting and characterizing coronal mass ejections.
The key system requirements for GOES-R are summarized in Table 3.2. These requirements drove the system implementation for the mission, which included the new instruments, a customized spacecraft, and an all new ground system, necessary to manage the increased data rate and new forecast products. Implementation for the mission started with the issuance of the first instrument development contract for the Advanced Baseline Imager (ABI) in 2004; the other instrument contracts were initiated over 2006–2007. The spacecraft contract was awarded in 2008 and the core ground system in 2009.
As was the case for previous generations, the GOES-R constellation is planned as two continuously operating satellites: GOES East, observing at ~75 W longitude and GOES West, observing at ~137 W. This allows the system to provide the required Earth coverage from 150 E to 2 W longitude. The requirement for spacecraft replacement in <3 weeks drives the need for an on-orbit spare, which will be launched but then remains in on-orbit storage at 105 W until called into service. For the space weather instruments, two satellites provide back-ups for each other when a satellite’s view of the Sun is eclipsed by Earth.
TABLE 3.1 GOES-R Series Instruments and data products
Instrument
Advanced Baseline Imager (ABI)
Geostationary Lightning Mapper (GLM)
Extreme Ultraviolet and X-ray Irradiance Sensors (EXIS)
Solar Ultraviolet Imager (SUVI)
Space Environment In Situ Suite (SEISS)
Data products
Aerosol detection (including smoke and dust)
Aerosol optical depth (AOD)
Clear-sky masks
Cloud and moisture imagery
Cloud-optical depth
Cloud-particle size distribution
Cloud-top height
Cloud-top phase
Cloud-top pressure
Cloud-top temperature
Derived motion winds
Derived stability indices
Downward shortwave radiation: surface
Fire/hot spot characterization
Hurricane intensity estimation
Land surface temperature (skin)
Legacy vertical moisture profile
Legacy vertical temperature profile
Radiances
Rainfall rate/QPE
Reflected shortwave radiation: TOA
Sea surface temperature (skin)
Snow cover
Total precipitable water
Volcanic ash: detection and height
Lightning detection: events, groups and flashes
Solar flux: EUV
Solar flux: X-ray irradiance
Solar EUV imagery
Energetic heavy ions
Magnetospheric electrons and protons: low energy
Magnetospheric electrons and protons: medium and high energy
Solar and galactic protons
Magnetometer (MAG)
Geomagnetic field
The GOES-R baseline science product portfolio will continue to evolve. Some baseline products are already slated for decommissioning as new and improved science has come online.