Temporal and spatial variations of air pollution across China from 2015 to 2018
Xiaoteng Zhou 1,2,∗ , Vladimir Strezov 1,2 , Yijiao Jiang 1,3 , Tao Kan 2 , Tim Evans 1,2
1 ARC Research Hub for Computational Particle Technology, Macquarie University, Sydney, New South Wales 2109, Australia
2 Department of Earth and Environmental Sciences, Faculty of Science and Engineering, Macquarie University, Sydney, New South Wales 2109, Australia
3 School of Engineering, Faculty of Science and Engineering, Macquarie University, Sydney, New South Wales 2109, Australia
a r t i c l e i n f o
Article history:
Received 27 June 2020
Revised 21 April 2021
Accepted 23 April 2021
Keywords:
a b s t r a c t
This study investigated concentrations of PM2.5 , PM10 , SO2 , NO2 , CO and O3 , and air quality index (AQI) values across 368 cities in mainland China during 2015–2018. The study further examined relationships of air pollution status with local industrial capacities and vehicle possessions. Strong correlations were found between industrial capacities (coal, pig iron, crude steel and rolled steel) and air pollution levels. Although statistical and significant reductions of PM2.5 , PM10 , SO2 , NO2 , CO and AQI values were observed in response to various laws and regulations in industrial sectors, both particle and gaseous pollutants still had annual average concentrations above recommended limits. In order to further reduce air pollution, more efforts can be done to control traffic emissions caused by minicars and heavy trucks, which was revealed after investigating 16 vehicle types. This was also consistent with the apparent air quality improvement during the COVID-19 lockdown period in China in 2020, despite industrial operations being still active at full capacities.
©2021 The Research Center for Eco-Environmental Sciences, Chinese Academy of Sciences. Published by Elsevier B.V.
Introduction
China, as the largest developing country, has been amongst the world’s fastest growing economies, with a gross national income per capita increasing from US$940 in 2000 to US$8690 in 2017 (Morrison, 2019). However, its rapid economic growth has come at the expense of its environmental sustainability (Kan, 2009). Dealing with the current environmental pollution poses one of the most pressing challenges for China, espe-
∗ Corresponding author.
E-mail: xiaoteng.zhou@mq.edu.au (X. Zhou).
cially with regards to the problem of air pollution. In 2014, it was estimated that 142 million people from 155 Chinese cities were exposed to air pollutants exceeding the acceptable amount outlined by the World Health Organization (WHO) standards (Han et al., 2018).
In order to better monitor air pollution across China, the Chinese National Ministry of Environmental Protection (MEP) established a monitoring network to provide real-time air pollution data since 2000. In 2000, there were initially only 47 cities covered in the monitoring system, which expanded to include 120 cities in 2011. However, PM2.5 pollution was not included in the monitoring system until 2012. The MEP started to report and release hourly and daily air quality data, includ-
https://doi.org/10.1016/j.jes.2021.04.025 1001-0742/©2021TheResearch Center for Eco-Environmental Sciences, Chinese Academy of Sciences. Published by Elsevier B.V.
ing PM2.5 , PM10 , SO2 , NO2 , CO, O3 and air quality index (AQI) across 120 cities in 2012 and has since expanded this network to 368 cities from 2015 until now (Hu et al., 2014).
In addition to increasing and expanding its monitoring network, a range of laws and regulations have been issued by the Chinese government (Zhang et al., 2019). Previous studies demonstrated that industrial and vehicle emissions were the major human activities contributing to air pollution in China (Tian et al., 2019; Zhou et al., 2019, 2020), as substantial evidence showed that multiple air pollutant levels were higher at industrial areas or near highway and busy roads compared to background locations. Strengthened emission standards were enacted to control industrial and vehicle emissions across China. For example, the vehicle emission standards were improved from China 1, 2 and 3, to China 4 and 5 standards (fuel quality levels), and emission-intensive industrial sectors, such as iron and steel, were required to install cleaning systems (Zhang et al., 2019).
Furthermore, a long-term objective for environmental protection was specified in China’s 13th Five-Year Plan (2015–2020), highlighting the key air pollutants, SO2 and NOx, would be reduced by 15% by 2020, while the particulate matter would be reduced by at least 25%. A recent study (Shen et al., 2020) showed the decline of particle and gaseous pollutants between 2015 and 2018, however this study was only focused on five key regions in China. Hence, a large-scale study covering the major cities in China is required to show the changes of air pollution and assess if the current measures acted are effective to help achieve the environmental aims specified in China’s 13th Five-Year Plan.
Therefore, this study investigated the spatial and temporal variations of six air pollutant concentrations and AQI values to demonstrate their hourly, daily and yearly distributions across 368 cities in mainland China during 2015–2018. This study further examined correlations between air pollution and industrial capacities/vehicle possession across locations to explore other potential measures to control air pollution in China.
1. Materials and methods
In this study, six common air pollutants and AQI were investigated to evaluate the spatial and temporal changes of air quality across mainland China during 2015 to 2018. The six air pollutants included hourly concentrations of PM2.5 (μg/m3 ), PM10 (μg/m3 ), SO2 (μg/m3 ), NO2 (μg/m3 ), CO (mg/m3 ), and 8 hr average concentrations of O3 (μg/m3 ). The ambient air quality data was obtained from online database (http://beijingair. sinaapp.com/), which was derived from the China National Environmental Monitoring Centre, covering 368 cities across 22 provinces, five autonomous regions and four municipalities in mainland China (Fig. S1).
National productions of coke, cement, pig iron, crude steel and rolled steel during 2015 to 2018 were obtained from the National Bureau of Statistics of China. This study also included local vehicle numbers in passenger vehicles (large, medium, small and minicar) and trucks (heavy, medium, light and mini). Due to the increasing number of private vehicles, this study further investigated the private portion of vehicles, including private passenger vehicles (large, medium, small
and minicar) and private trucks (heavy, medium, light and mini).
The air quality data was analyzed and calculated using Python 3.7.5. The correlations of industrial activities or vehicle possession with air quality during 2015–2018 were analyzed by IBS SPSS Statistics 25. The software of ArcGIS 10.6 was used for mapping and the OriginLab 2018 was employed for diagram representation in this study.
2. Results
This study summarised the spatial and temporal changes of the six criteria air pollutants (PM2.5 , PM10 , SO2 , NO2 , O3 and CO) and AQI across 368 cities in mainland China during 2015 to 2018 (Fig. S1). The temporal data are compiled and displayed in Figs. 1 and 2, and the spatial variations are described in Figs. S2 and S3 In addition, this study investigated two major contributors of industrial activities and vehicle population to air pollution across mainland China. Their associations with concentrations of PM2.5 during 2015–2018 were plotted in Figs. 3 and 4, and the associations with other air pollutants are detailed in Tables S1 and S2
2.1. Temporal variations
2.1.1.
Yearly changes
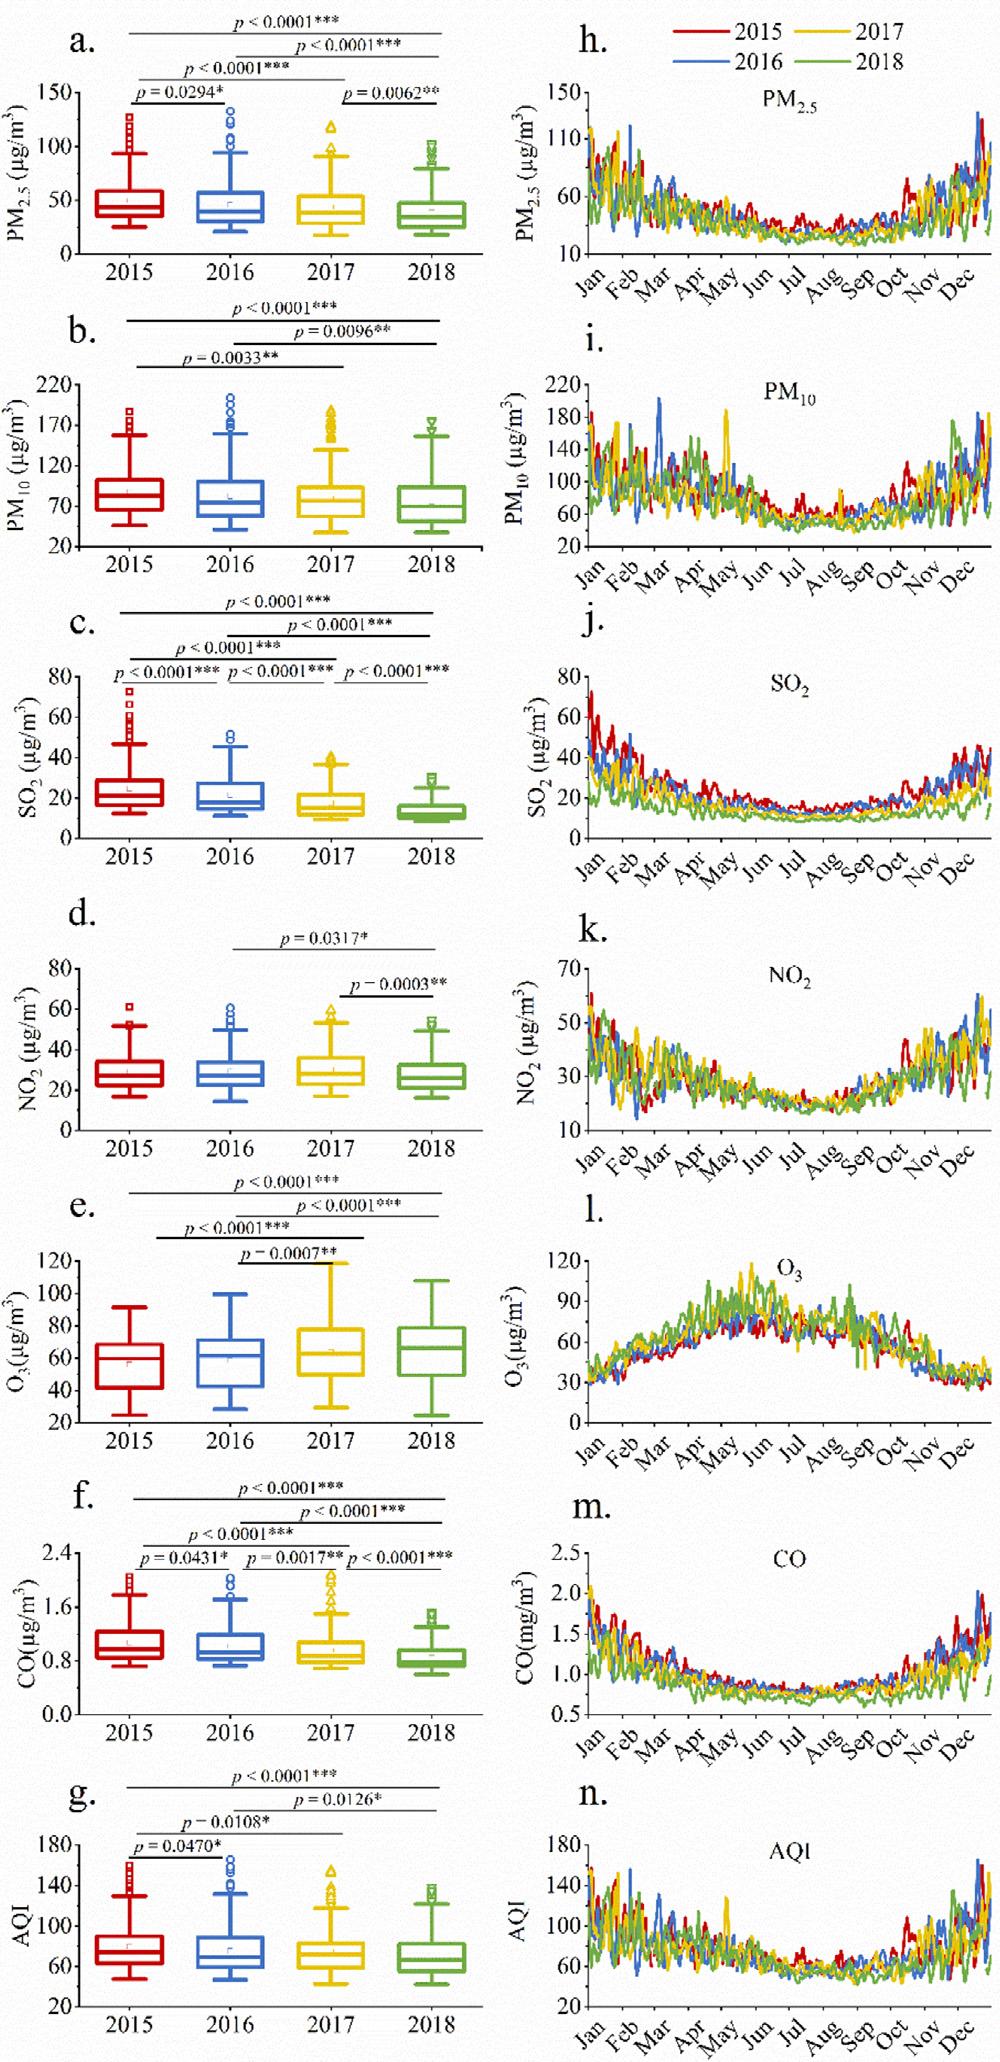
The average concentrations of PM2.5 , PM10 , SO2 , CO and AQI in mainland China showed a dramatic decline from 2015 to 2018 (Fig. 1a–g). For example, compared to the annual concentrations of PM2.5 (49.7 μg/m3 ) and PM10 (87.0 μg/m3 ) in 2015, their concentrations declined to 38.9 μg/m3 and 75.5 μg/m3 , respectively, in 2018 at a significance level of p = 0.0001 (Fig. 1a, b). The annual average SO2 concentration in 2018 was only half of its concentration in 2015 (13.4 μg/m3 vs 24.8 μg/m3 ) (Fig. 1c). The annual values of CO and AQI also decreased significantly (p < 0.0001) during the four years (Fig. 1f, g).
However, the annual concentration of O3 showed an opposite temporal trend, which increased from 56.1 μg/m3 in 2015, 58.6 μg/m3 in 2016, 63.3 μg/m3 in 2017 to 64.8 μg/m3 in 2018 (Fig. 1e). Furthermore, the annual NO2 concentration slightly increased in the first three years (from 29.0 μg/m3 to 30.1 μg/m3 ), but declined to 27.5 μg/m3 in 2018 with a p value of 0.001 (Fig. 1d).
2.1.2.
Daily changes
The daily variations in average concentrations of PM2.5 , PM10 , SO2 , NO2 and CO showed U-shape patterns (Fig. 1h–k, m). This was consistent with previous studies (Fang et al., 2016), which indicated that the concentrations of air pollutants were higher in wintertime than other months. However, the monthly distribution of O3 concentrations showed a different pattern with the maximum values during summertime due to the strong association of O3 concentrations with the intensity of solar radiation (Wang et al., 2014). The increase in sunlight and temperature have been evidenced to favour O3 formation in summer months (Wang et al., 2017).
The daily changes of AQI concentrations during 2015–2018 also showed a U-shape pattern (Fig. 1n). The statistical analysis demonstrated that the AQI concentrations were positively
Fig. 1 –Yearly and daily variations of PM2.5 , PM10 , SO2 , NO2 , O3 , CO and AQI during 2015–2018. Significant differences were determined using a One-way ANOVA with Tukey’s multiple comparison at ∗∗∗ p = 0.001, ∗∗ p = 0.01, and ∗ p = 0.05 levels.
and significantly (p < 0.01) associated with concentrations of PM2.5 , PM10 , SO2 , NO2 and CO, but negatively associated with O3 concentrations with r values ranging from -0.497 to -0.190 at p < 0.01 level (Table S3).
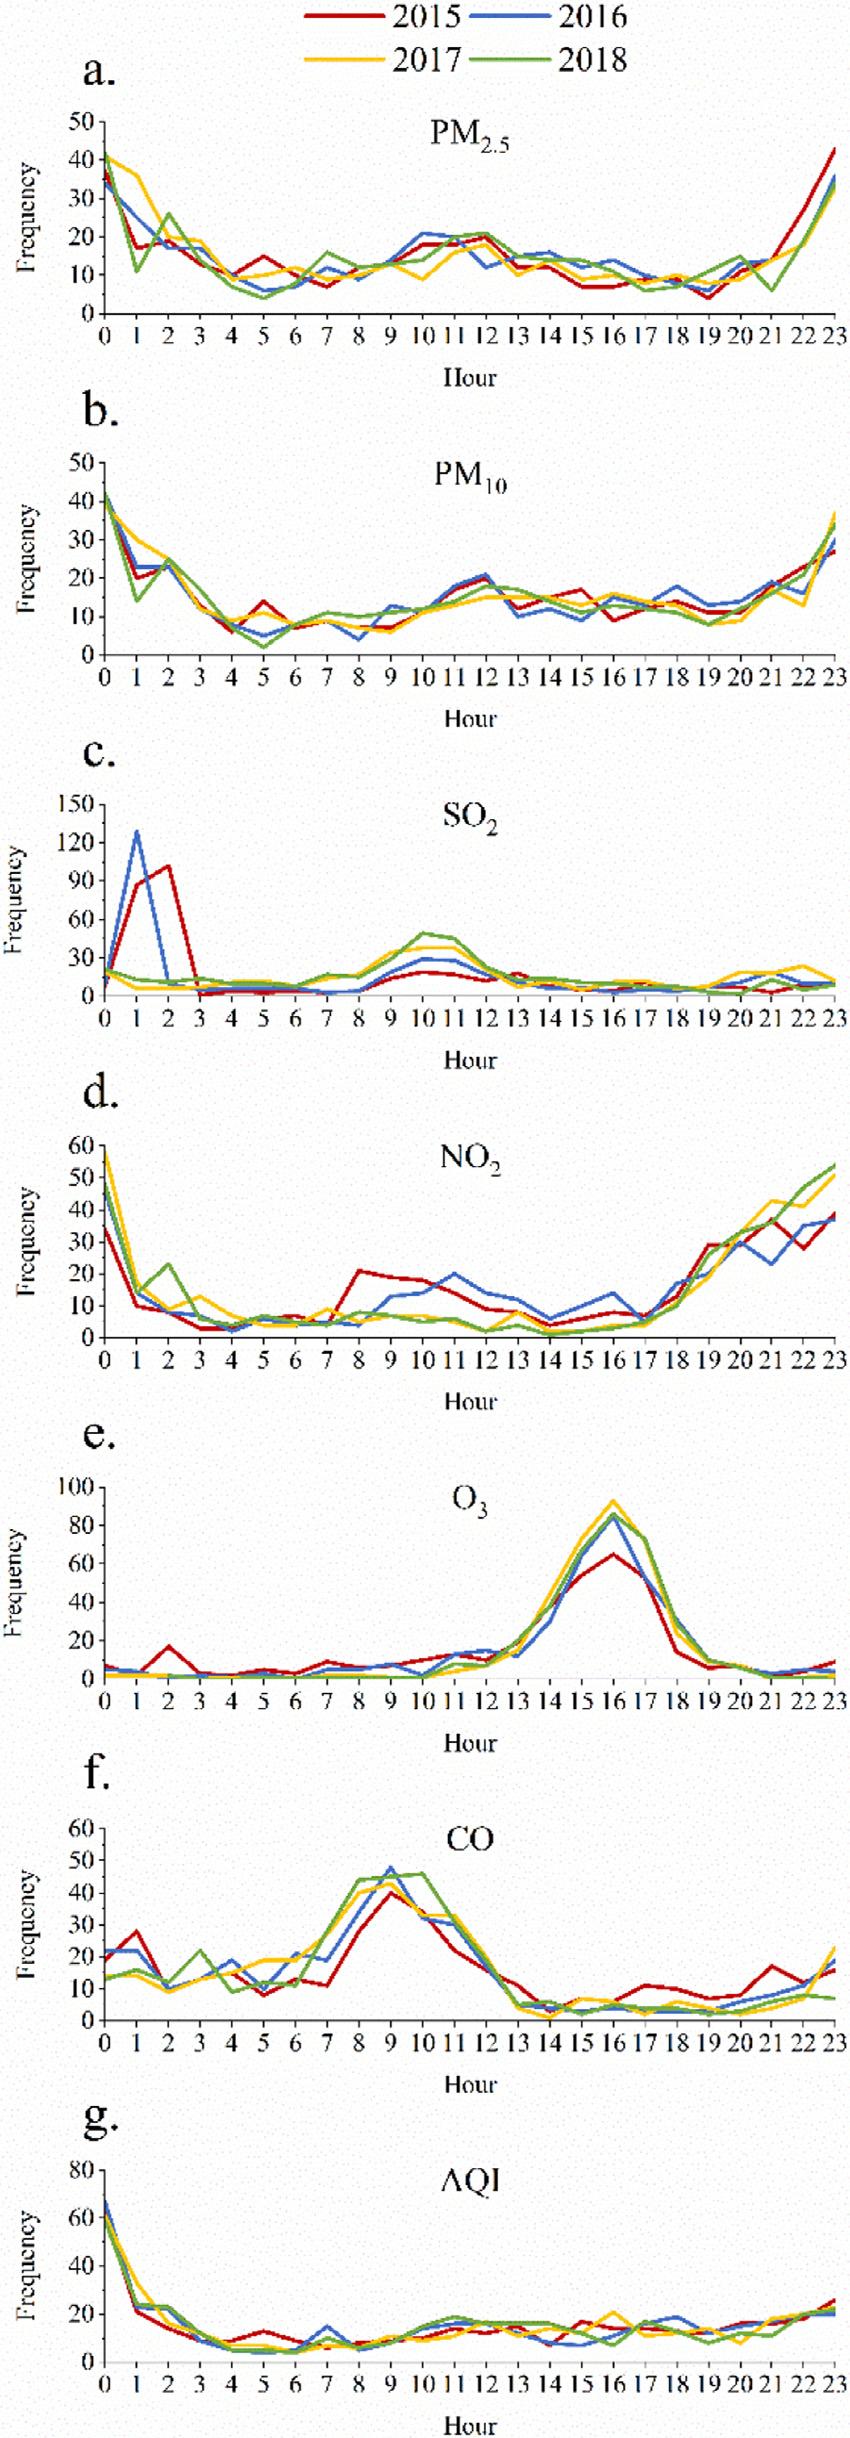
Fig. 2 –Frequencies of maximum hourly data for PM2.5 , PM10 , SO2 , NO2 , O3 , CO and AQI during 2015–2018.
2.1.3.
Hourly changes
Fig. 2 summarizes the frequencies of daily highest pollutant concentrations which occurred at a given hour in each year from 2015 to 2018. For example, in 2015, there were 37 days with the maximum PM2.5 concentrations at 00:00 am (Fig. 2a). The hourly frequencies for the maximum concentrations of PM2.5 , PM10 and NO2 showed W-shape patterns, which indicated the peaks of their frequencies occurred at 00:00–02:00, 10:00–12:00 and 20:00–23:00, respectively (Fig. 2a, b, d). The highest frequency of maximum SO2 concentrations was found at 01:00–02:00 in 2015 and 2016, but it shifted to 10:00–11:00 in 2017 and 2018 (Fig. 2c). It was clear that most frequencies of the highest concentrations of O3 , CO and AQI were at 16:00, 08:00–10:00 and 00:00, respectively (Fig. 2e, f, g).
2.2.
Spatial variations
The yearly average concentrations for the criteria air pollutants and the air quality indices were plotted according to the locations (bar charts in Fig. S2). The WHO standard and China’s air quality standards at Grade 1 and Grade 2 were displayed with solid lines in bar charts in Fig. S2 In order to match the pollution levels and their geographic locations, Fig. S2 also included visual maps with colours to show locations with air quality below or above different standards.
Results of the spatial PM2.5 concentrations showed that 22 (shaded with light red in Fig. S2a) out of 31 locations had fouryear’s average PM2.5 concentrations above the Grade 2 standard of 35 μg/m3 Only nine of the 31 locations had average PM2.5 concentrations over the four years which met the Grade 2 criteria but remained above Grade 1 levels at 15 μg/m3 . Furthermore, there was no location with an annual average PM2.5 concentration within the WHO guideline of 10 μg/m3 (Fig. S2a). This paralleled the PM10 data which was all above the WHO standard of 20 μg/m3 for an annual average, although the annual average data at Hainan with the location code of 20 were below the Grade 1 standard (Fig. S2b).
There is no WHO standard for the annual SO2 concentration, however China has annual limitation at two levels at 60 μg/m3 and 20 μg/m3 for Grade 2 and Grade 1, respectively. According to the spatial variations of SO2 concentrations, there was only one annual value above the Grade 2, which was located at Shanxi province with code 11 in 2016. By contract, there were 20 locations (shaded with light blue) with the annual average concentrations of SO2 meeting the Grade 1 standard (Fig. S2c). Although there is no recommended WHO standard for annual CO concentrations, China established the maximum 24 h average concentration recommendations at 4 mg/m3 for Grade 1 and 2 air quality standards. Results of the CO data showed that the annual concentrations at 31 locations ranged from 0.6 mg/m3 to 1.8 mg/m3 , which were below the recommended limit (Fig. S2f). This was also found for O3 which ranged from 35.5 μg/m3 to 78 μg/m3 below the Grade 1 and WHO standards of 100 μg/m3 (Fig. S2e).
The maximum annual level for NO2 , according to both WHO and China’s air quality standards, is 40 μg/m3 Results of this study showed that only Beijing (code 4), Tianjin (code 7), Hebei (code 17) and Henan (code 18) had average concentrations of the four years’ data exceeding this limitation (Fig. S2d). The overall air quality index AQI showed these four loca-
tions (code 4, 7, 17 and 18) as well as Xinjiang province (code 14) had annual AQI values higher than 100, which were classified as unhealthy air quality for sensitive groups. The AQI values range from 51 to 100 are considered as moderate air quality in respect of public health concern, and AQI < 50 indicates the air quality is good and satisfactory. Results from this study showed that only three locations (code 24, 2, 20), shaded in light green in Fig. S2g, had annual AQI values below 50, indicating that air quality at these three provinces posed little or no health risk.
In addition to the average data (Fig. S2), this study also employed frequency histograms of daily maximum concentrations for seven air quality indices to capture the overview of air quality in mainland China (Fig. S3). For example, in 2015, there were 150 maximum daily PM2.5 values found in Xinjiang province (code 14), and this number increased to 156 in 2016, 171 in 2017 and 192 in 2018 (Fig. S3a). Although Hebei (code 17) had not experienced the largest number of maximum daily PM2.5 cases in an individual year, the summary over the four years was more than 100 cases. Hence, this location (Hebei) and Xinjiang were both classified into the high frequency group which indicated locations with the most frequent maximum PM2.5 concentrations from 2015 to 2018 (Fig. S3a). Both locations of Hebei (code 17) and Xinjiang (code 14) also experienced high frequencies of the maximum daily concentrations for NO2 (Fig. S3d), CO (Fig. S3f) and AQI (Fig. S3g).
2.3. Industrial and vehicle emissions
Industrial emissions are considered as a major contributor to air pollution in China and internationally (Li et al., 2017a; Leoni et al., 2018; Zhou et al., 2018). Hence, this study investigated five essential industrial products, including coke, cement, pig iron, crude steel and rolled steel across 31 locations in mainland China. Statistical analysis was used to identify if there were correlations between capacities of industrial production in each location and the local air pollution.
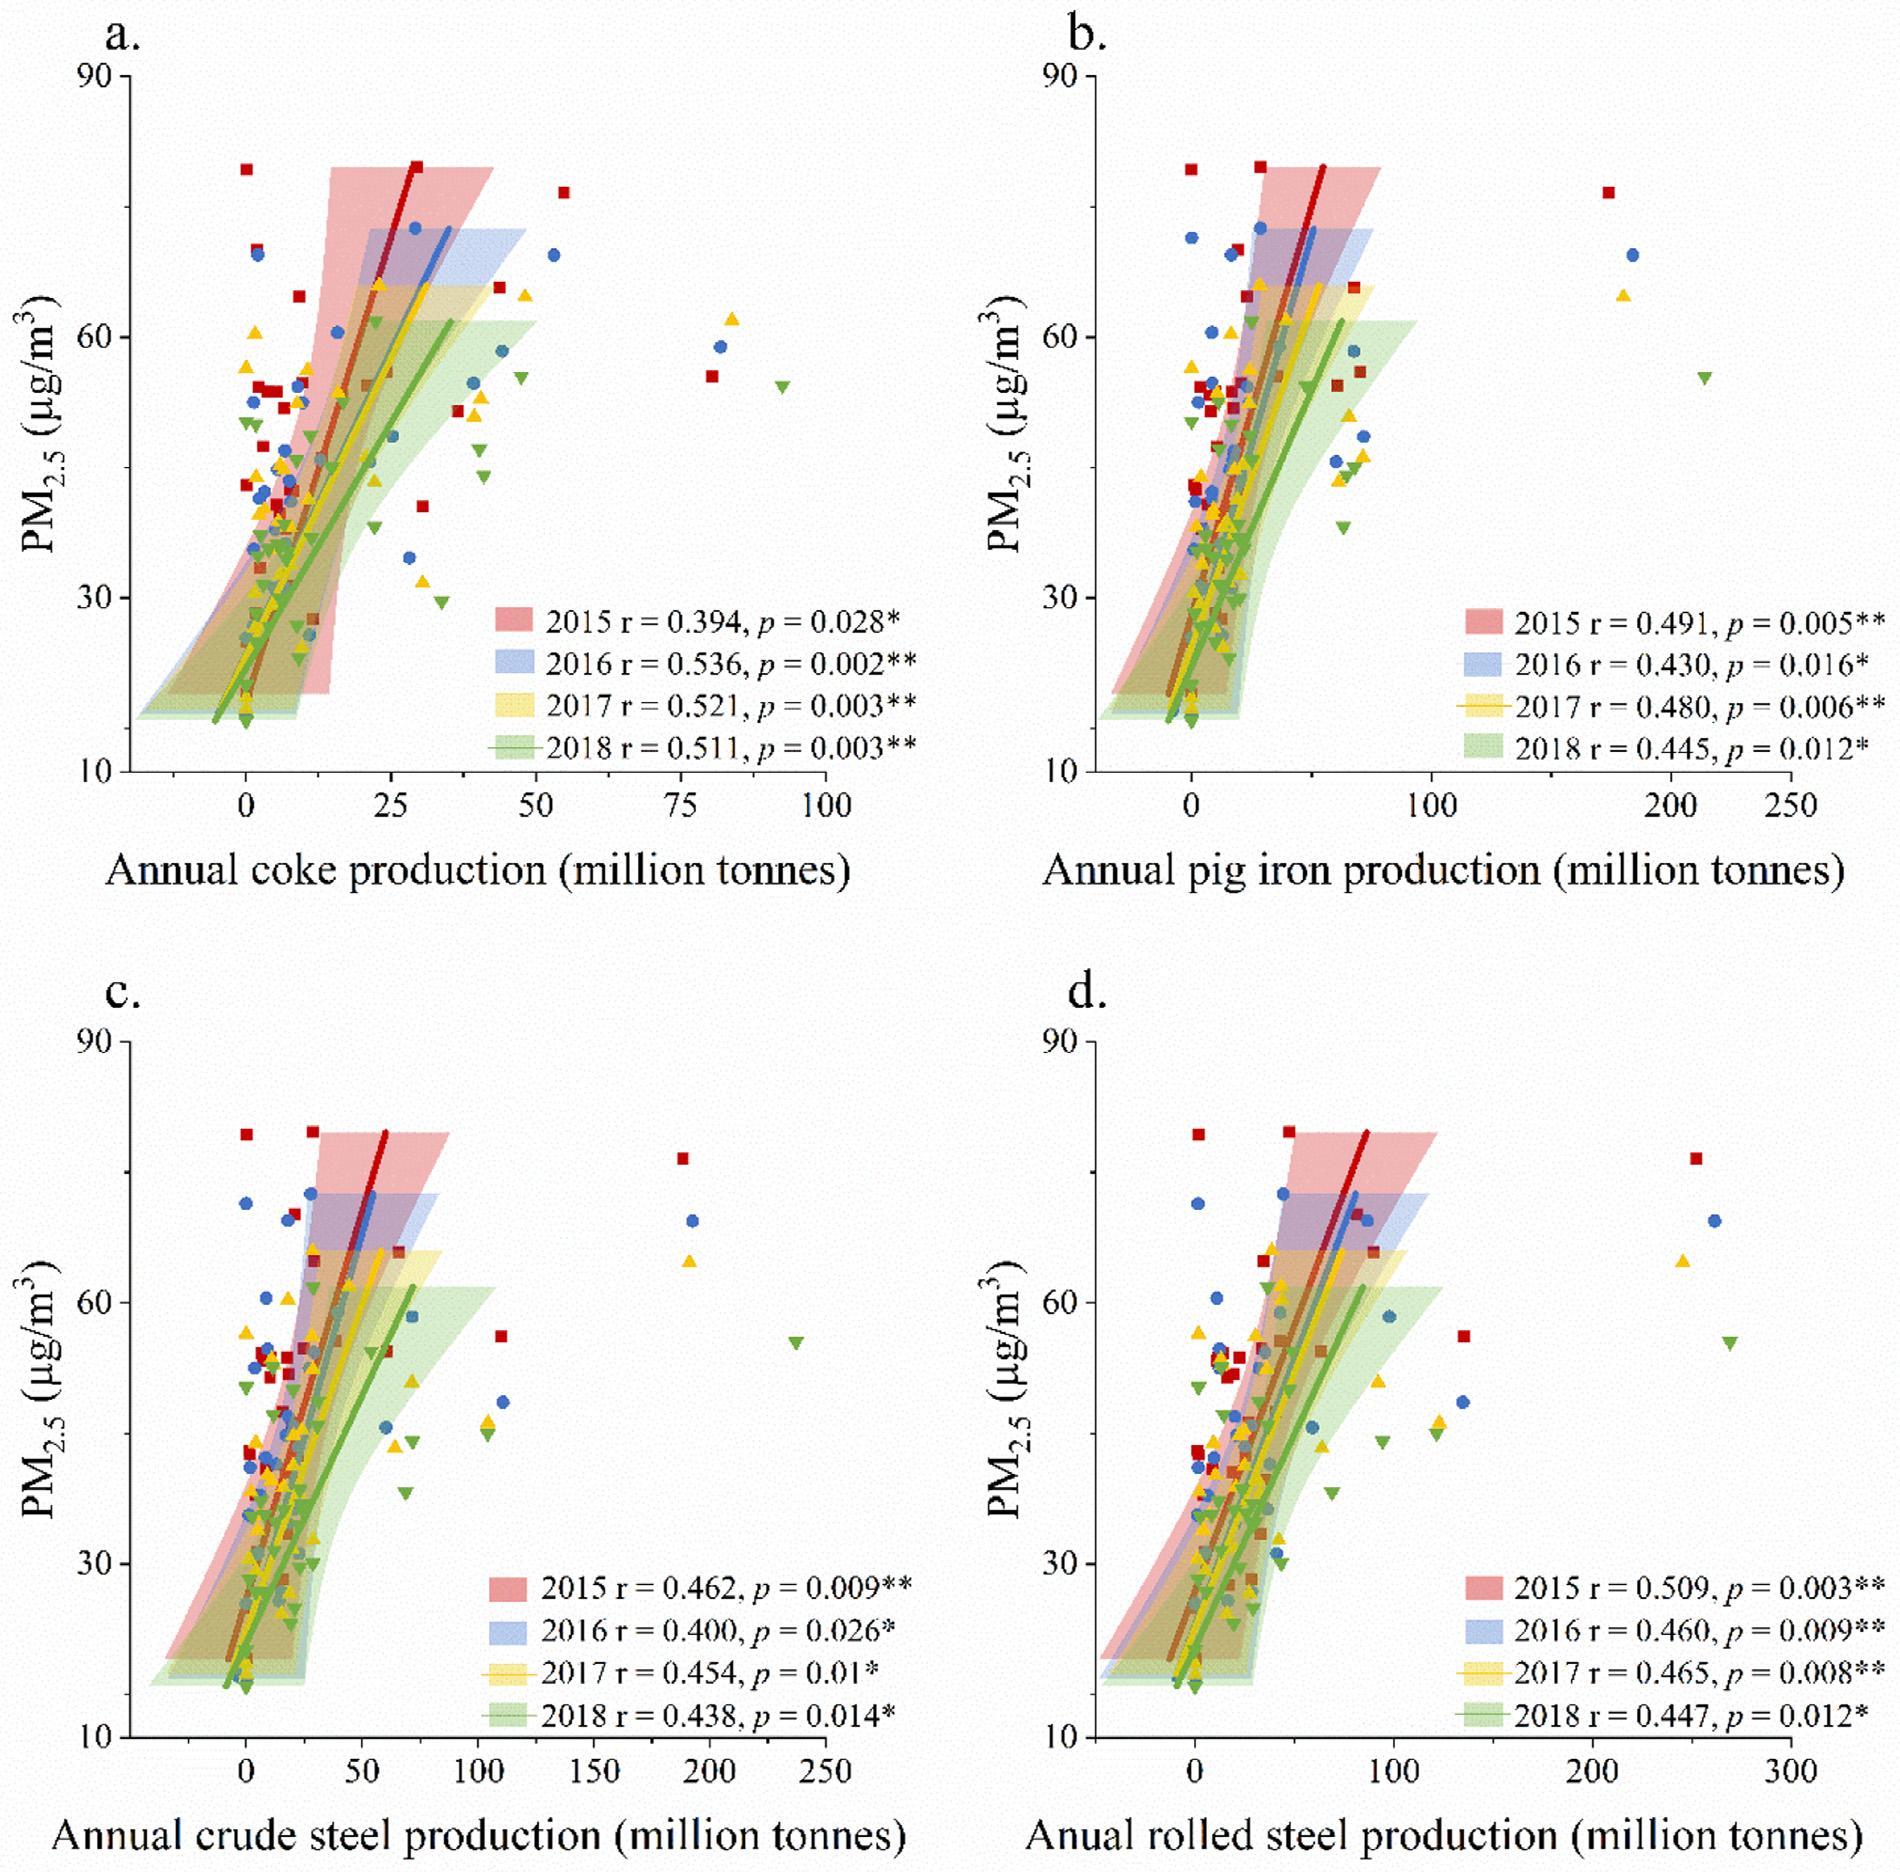
Results showed that strong and positive correlations were found between industrial production of coke, pig iron, crude steel and rolled steel and multiple air pollutants (Table S1). For example, the annual amount of coke produced in 31 locations was significantly associated with the annual PM2.5 concentrations with p values ranging from 0.002 to 0.028 during 2015–2018 (Fig. 3a). The industrial production of pig iron, crude steel and rolled steel were also positively correlated with PM2.5 concentrations at levels of 0.01 and 0.05 (Fig. 3b–d).
In addition to PM2.5 , annual data of PM10 and gaseous air pollutants were also found to be related to different industrial productions among locations (Table S1). However, there was no significant correlation found between the production of cement and air pollution across 31 locations in mainland China (Table S1).
Vehicle emissions are considered another large contributor to air pollution (Tian et al., 2019; Zhou et al., 2020). This study investigated 16 types of vehicle categories in total and private sections. Each section included four types of passenger vehicles (large, medium, small and minicar) and four types of trucks (heavy, medium, light and mini) to determine the correlations between vehicle possession and air pollution. This study found that only two types of vehicles, minicars and
Fig. 3 –Linear correlations between PM2.5 concentrations and industrial productions according to 31 locations in China during 2015–2018. Significant differences were displayed at ∗∗ p = 0.01 and ∗ p = 0.05 levels.
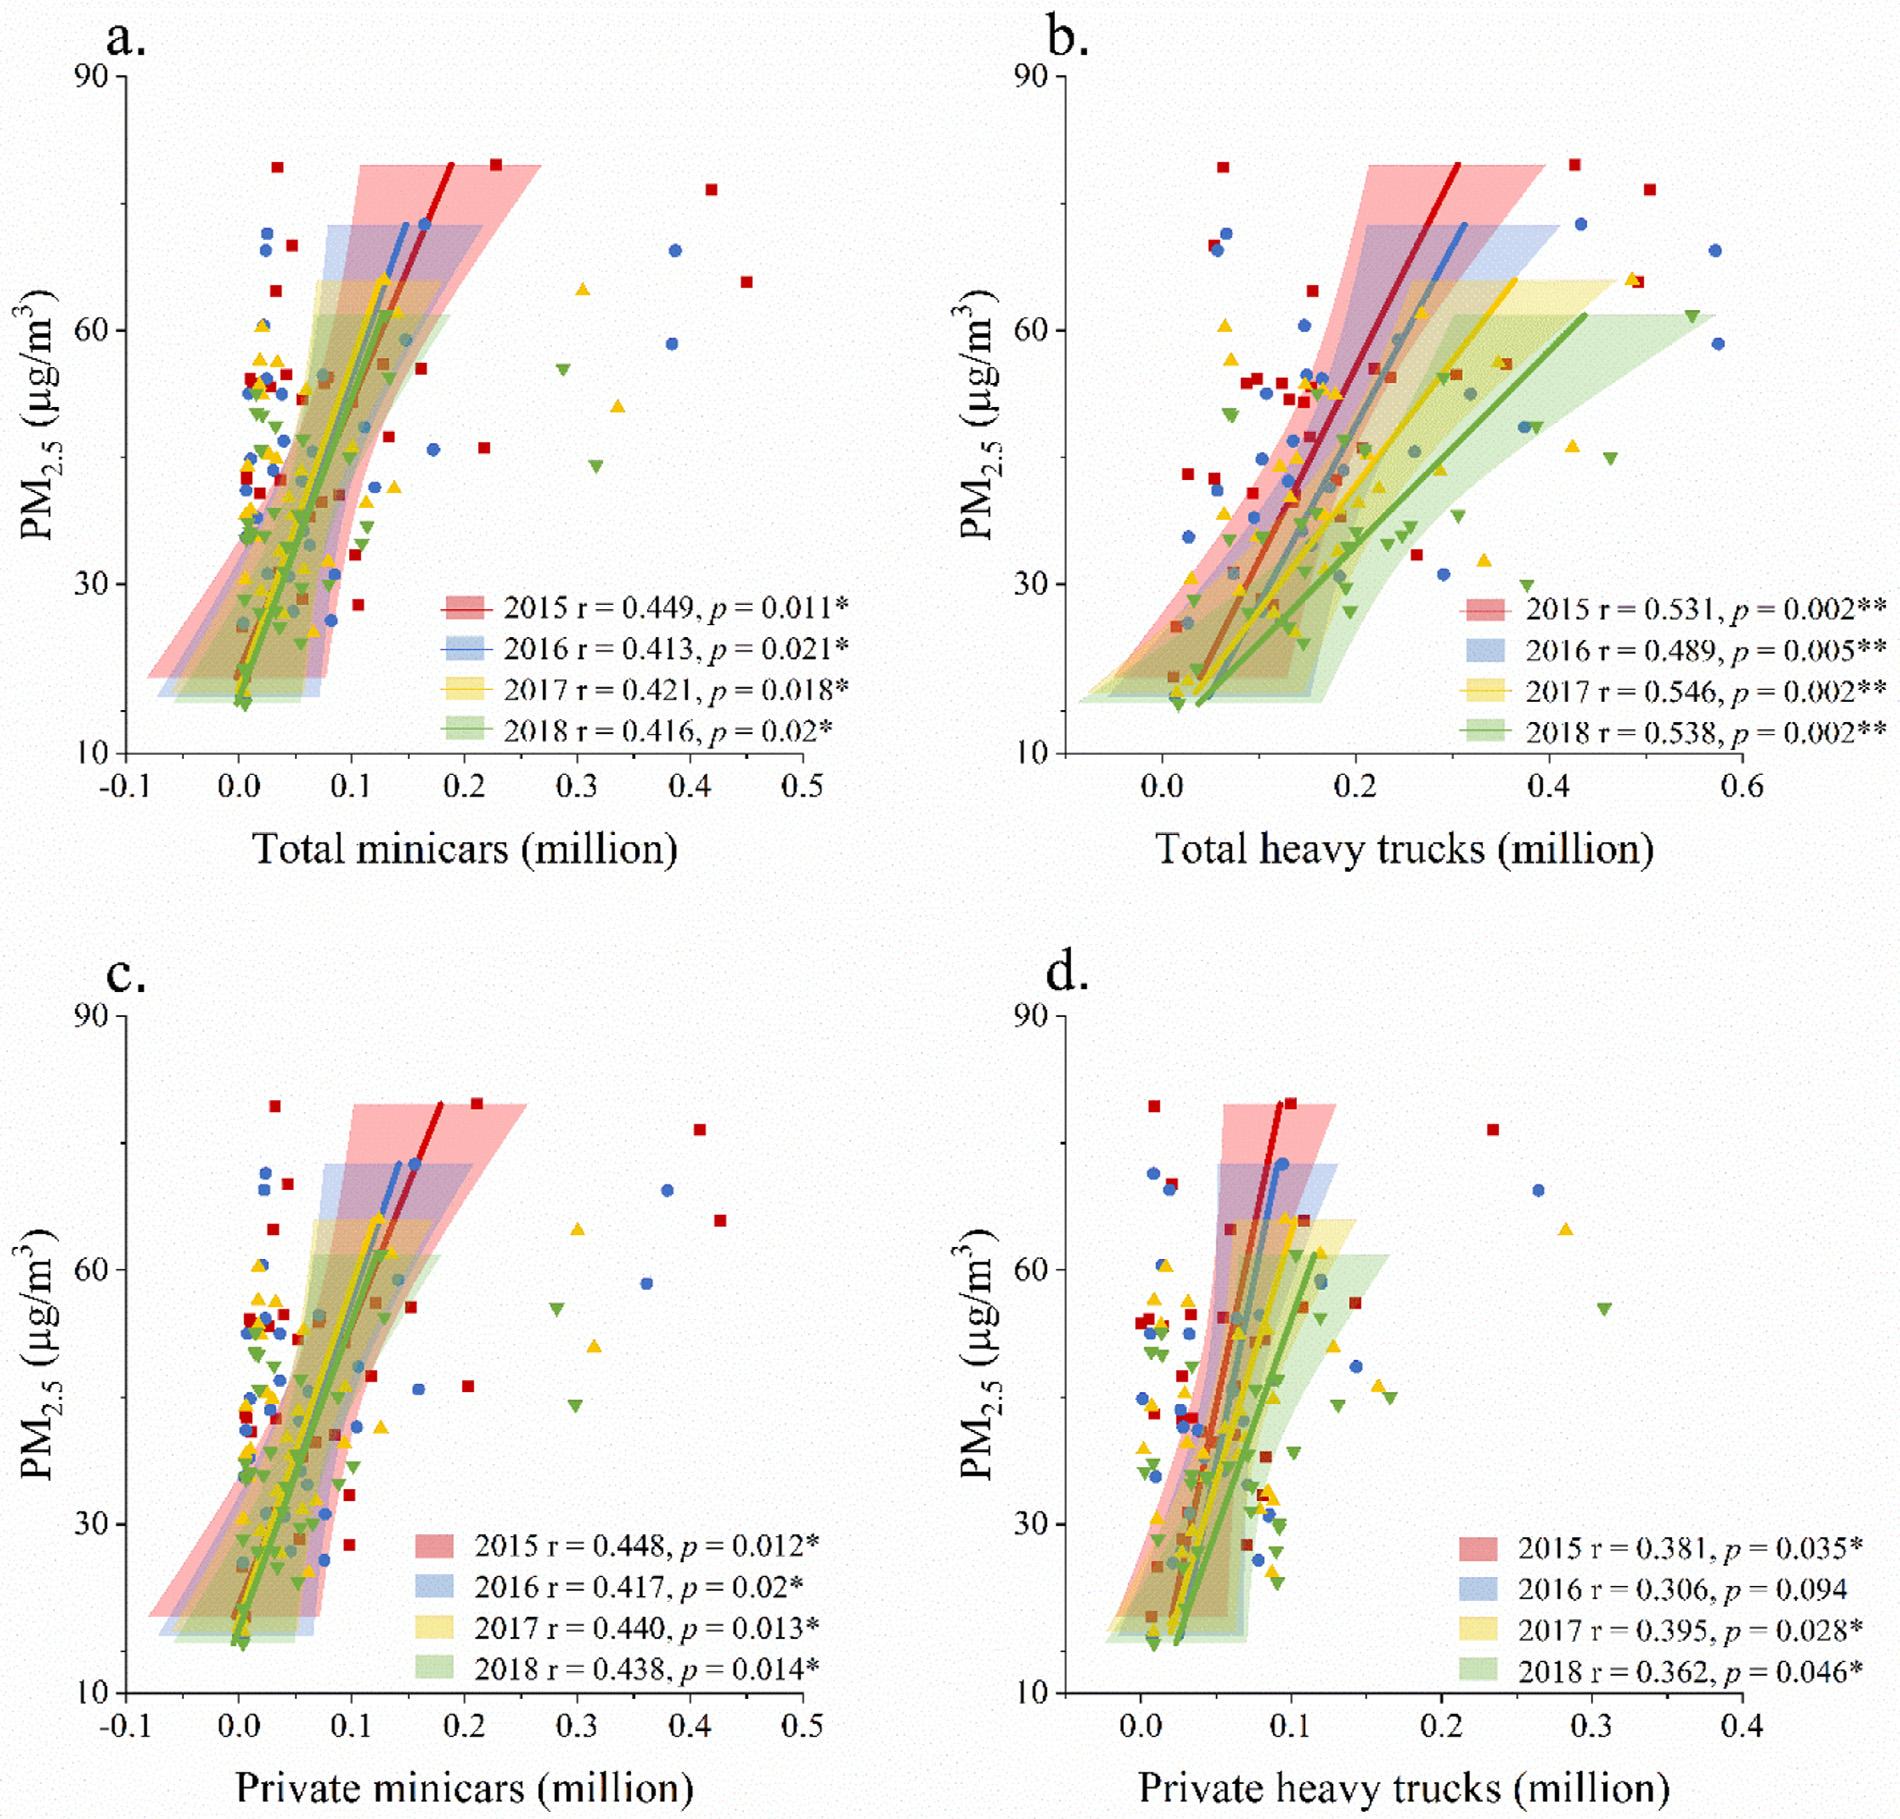
heavy trucks in both total and private sections, were significantly associated with air pollution among different locations (Table S2). For example, the total minicar population and heavy trucks were correlated to PM2.5 concentrations with p values ranging from 0.002 to 0.021 during 2015–2018 (Fig. 4a, b). Also, the number of private minicars were associated with PM2.5 concentrations with r values from 0.417 to 0.448 at a significance level of p = 0.05 (Fig. 4c). In contrast, the other 14 vehicle categories were not strongly associated with particle and gaseous air pollution with r values ranging from -0.29 to 0.353 and p values from 0.008 to 0.998 (Table S2).
3. Discussion
Industrial activities have been considered as one of the main contributors to air pollution in China (Li et al., 2017a; Zhou et al., 2020). Results presented in this study revealed the positive and significant correlations between air pollution concentrations and multiple industrial capacities across different locations in China (Fig. 3, Table S1). In order to mitigate air pollution in industrial areas, China has issued a range of environmental regulations and standards, including reinforcing industrial emission standards, upgrading cur-
rent facilities and phasing out heavily polluting industries (Zhang et al., 2019). For example, 80% of iron and steel facilities were equipped with pollution control systems and 200 million tonnes of outdated iron and steel products were eliminated during 2013–2017 (Zhang et al., 2019). The data of this study suggests that these measures have been successful in reduction of air pollution, especially for PM2.5 and PM10 , which have been shown a dramatic decline during 2015–2018 (Fig. 1a, b).
In addition to particulate matter, gaseous pollution of SO2 also decreased significantly (p < 0.0001) from 2015 to 2018 (Fig. 1c). Previous studies showed that coal-fired power plants were the largest contributors to SO2 emission in China (Zheng et al., 2009; Chai et al., 2014; Zhang et al., 2017). For example, power plants were estimated to be responsible for 50.7% and 85% of SO2 emission in Pearl River Delta area (nine cities located in Guangzhou province with code 12 in Figs. S2 and S3) and Beijing-Tianjin-Hebei areas (location codes of 4, 7 and 17 in Figs. S2 and S3) (Zheng et al., 2009; Liu et al., 2019). In order to reduce SO2 emissions, a stricter regulation was enacted across China in 2015 restricting the use of coal with ash > 16% and sulphur > 1%. In respect to the industrial sectors, 95% of coal-fired power plants installed flue gas desulfurization (FGD) systems and more than 200,000 industrial coal boilers were closed by 2017 (Zhang et al., 2019). At the residential level, clean fuel was introduced since 2013, and this measure was estimated to be contributing to 6% of the total abatement of SO2 emissions across China (Zhang et al., 2019).
Another gaseous pollutant, CO, was also observed to decline during 2015–2018 at a significant rate (Fig. 1f). CO pollution in China has been evidenced to be highly related to biomass burning (Zhang et al., 2011; Chai et al., 2014). It was estimated that approximately 4 teragrams of CO were produced every year due to biomass burning (Huang et al., 2012). In order to control CO emissions caused by biomass burning, the Chinese government issued a range of regulations in 1999 to ban crop and straw burning during harvest seasons (Zhou et al., 2017). At the same time, recycling of biomass was encouraged, such as returning it to field as fertilizers or feeding livestock (Zhou et al., 2017). The changes in energy consumption structure achieved a satisfactory result to reduce CO emissions locally (e.g. Inner Mongolia) (Köbbing et al., 2014) and nationally (Fig. S2f).
Although China has made great effort to improve air quality, its annual average pollution levels at certain locations remained substantially higher than the national and WHO standards (Fig. S2). In particular, the annual PM2.5 and PM10 data across mainland China remained far above their corresponding WHO standards (Fig. S2a, b). The particular meteorological conditions were considered to play a significant role in such pollution situation in China. For example, compared to Europe and US, China has more frequent air stagnation events, especially during winter and autumn, which restricts the dispersion of air pollutants (Wang et al., 2018). In China, particle (Fig. 1h, i) and gaseous pollution (Fig. 1j, k, m) were also found to be at the highest levels in winter, because the weather in winter is typically dominated by lower temperature, less rainfall and more calm wind conditions (Wang et al., 2014; Li et al., 2017b; Ye et al., 2018). The low temperature would suppress the development of planetary boundary layer and lower
its height, increasing the surface air pollution concentrations (Wang et al., 2018), which leads to relatively high daily pollutant concentrations during nights (Fig. 2).
Conversely, the O3 pollution was positively related to the temperature (Figs. 1l and 2e) because high temperature and intensity of solar radiation supported the formation of O3 (Borge et al., 2019). O3 can be produced from the photolysis of NO2 , which is oxidated from NO by hyroperoxy (HO2 ) and organic peroxy radicals (RO2 ) (Tan et al., 2020). Both compounds were considered as important precursors when producing O3 (Li et al., 2019). Recent studies also showed that O3 pollution posed a significantly negative risk to human health and caused significant economic loss in China (Xie et al., 2019; Zhong et al., 2019).
The detailed control measures and regulations in remote areas may be required to improve air quality in China. Current regulations and research studies mainly focused on industrial areas, such as Beijing–Tianjin–Hebei (Ji et al., 2019; Liu et al., 2019; Zhao et al., 2020). However, this study showed that the extremely high pollution cases, in particular, PM2.5 and PM10 , frequently occurred in remote areas, such as Xinjiang (location code 14) and Gansu (location code 23) (Fig. S3). The particle pollution in both areas was considered to be largely caused by dust storms (Querol et al., 2019; Zhao et al., 2019; Zou et al., 2019). Although China has implemented multiple afforestation programs to reduce frequencies of dust storms to mitigate air pollution (Zhang et al., 2016), the industrial sector in remote areas has been increasingly developed due to the economic growth (Yin et al., 2019). Hence, more specific and custom control measures across remote areas should be taken into consideration in the near future to balance economic benefits and environmental sustainability.
Further efforts to reduce vehicle emissions can also be made to improve air quality in China. A clear evidence can be seen during the recent COVID-19 lockdwon period, when the intensive and heavy-polluting industries in China still remained at high levels of operation (e.g. the total crude steel produced in January and February was 159 million tonnes in 2020 vs 146 million tonnes in 2019) (Worldsteel Association, 2019b, 2019a, 2020b, 2020a). However, the volume of transportation was significantly decreased in response to the fully restricted movement in China. For example, the numbers of passenger vehicles and trucks were substantially dropped by 39% and 77%, respectively, in Beijing, Tianjing and their surrounded areas (Ministry of Ecology and Environment of the People’s Republic of China, 2020). As a result, a clear significant decrease of NO2 pollution in the atmoshphere in China was observed in satellite images provided by the National Aeronautics and Space Administration (NASA Earth Observatory, 2020). The reduction of NO2 pollution during this period was estimated to equal to removing 192,000 cars off the road (Monks, 2020).
NOx emissions from vehicles are considered as a precursor for the secondary PM2.5 formation (Hodan and Barnard, 2004). Results from this study (Table S3) and the previous work (Chu et al., 2021) confirmed the correlations between NO2 and PM2.5 , which suggests the control of NOx can further reduce PM2.5 pollution in China (Chu et al., 2021). In addition to NO2 , other gaseous emissions, such as SO2 and VOCs, also play a significant role in PM2.5 formation as important precursor
Fig. 4 –Linear correlations between PM2.5 concentrations and vehicle numbers according to 31 locations in China during 2015–2018. Significant differences were displayed at ∗∗ p = 0.01 and ∗ p = 0.05 levels.
compounds (Hodan and Barnard, 2004). As a result, during the lockdown period in China, both particulate (PM2.5 ) and gaseous pollutants (NO2 , SO2 and VOCs) were observed to decline by 20–30% in Beijing, Tianjin and their surrounded 26 cities in Hebei, Shanxi, Shandong and Henan (location codes 4, 7, 10, 11, 17 and 18 in this study) (Ministry of Ecology and Environment of the People’s Republic of China, 2020). The significant reduction of air pollution between pre and post COVID-19 era suggested that traffic emissions caused by the high transportation operation in China played the most significant role in deteriorating the air quality.
China had overtaken the United States to become the largest fleet of motor vehicles in the world since 2009 (Liu, 2009). The new car registrations in China were up to 21 million units in 2019, followed by US with 17 million units and Europe with 15 million units (Wagner, 2020). In order to re-
duce traffic emissions caused by the vehicle population, China has strengthened the vehicle emission standards in the transportation sector and 20 million outdated vehicles have since been eliminated (Zhang et al., 2019). However, according to this study which investigated 16 vehicle types across total and private sectors, only minicars and heavy trucks were evidenced to be positively associated with different air pollution (Fig. 4). Hence, efforts of reducing vehicle emissions can be shifted to the two specific vehicle types to further reduce air pollution in China.
CRediT authorship contribution statement
Xiaoteng Zhou: Conceptualization, Data curation, Formal analysis, Writing- original draft. Vladimir Strezov: Conceptualization, Data curation, Funding acquisition, Supervision.
Yijiao Jiang: Funding acquisition, Writing- review & editing. Tao Kan: Writing- review & editing. Tim Evans: Conceptualization, Funding acquisition, Supervision.
Acknowledgments
This project is funded by the Australian Research Council Industrial Transformation Research Hub for Computational Particle Technology (IH140100035), Australia.
Supplementary materials
Supplementary material associated with this article can be found, in the online version, at doi:10.1016/j.jes.2021.04.025.
references
Borge, R., Requia, W.J., Yague, C., Jhun, I., Koutrakis, P., 2019. Impact of weather changes on air quality and related mortality in Spain over a 25year period [1993-2017]. Environ. Int. 133. doi:10.1016/j.envint.2019.105272
Chai, F.,Gao, J.,Chen, Z.,Wang, S.,Zhang, Y.,Zhang, J.,etal., 2014. Spatial and temporal variation of particulate matter and gaseous pollutants in 26 cities in China. J. Environ. Sci. 26 (1), 75–82
Chu, B.,Zhang, S.,Liu, J.,Ma, Q.,He, H., 2021. Significant concurrent decrease in PM2.5 and NO2 concentrations in China during COVID-19 epidemic. J. Environ. Sci. 99, 346–353
Fang, C.,Wang, Z.,Xu, G., 2016. Spatial-temporal characteristics of PM2.5 in China: a city-level perspective analysis. J. Geogr. Sci. 26 (11), 1519–1532.
Han, L.,Zhou, W.,Pickett, S.T.,Li, W.,Qian, Y., 2018. Multicontaminant air pollution in Chinese cities. Bull. World Health Organ. 96 (4), 225–296
Hodan, W.M. and Barnard, W.R. (2004). Evaluating the contribution of PM2.5 precursor gases and re-entrained road emissions to mobile source PM2.5 particulate matter emissions. US EPA. Durham: p 58.
Hu, J.,Wang, Y.,Ying, Q.,Zhang, H., 2014. Spatial and temporal variability of PM2.5 and PM10 over the North China plain and the Yangtze River Delta, China. Atmos. Environ. 95, 598–609 Huang, X.,Li, M.,Li, J.,Song, Y., 2012. A high-resolution emission inventory of crop burning in fields in China based on MODIS Thermal Anomalies/Fire products. Atmos. Environ. 50, 9–15
Ji, D.,Gao, M.,Maenhaut, W.,He, J.,Wu, C.,Cheng, L.,etal., 2019. The carbonaceous aerosol levels still remain a challenge in the Beijing-Tianjin-Hebei region of China: Insights from continuous high temporal resolution measurements in multiple cities. Environ. Int. 126, 171–183 Kan, H., 2009. Environment and health in china: challenges and opportunities. Environ. Health Perspect. 117 (12), 530.
Köbbing, J.F.,Patuzzi, F.,Baratieri, M.,Beckmann, V.,Thevs, N., Zerbe, S., 2014. Economic evaluation of common reed potential for energy production: a case study in Wuliangsuhai Lake (Inner Mongolia, China). Biomass Bioenergy 70, 315–329
Leoni, C.,Pokorna, P.,Hovorka, J.,Masiol, M.,Topinka, J.,Zhao, Y., et al., 2018. Source apportionment of aerosol particles at a European air pollution hot spot using particle number size distributions and chemical composition. Environ. Pollut. 234, 145–154
Li, K., Jacob, D.J., Liao, H., Zhu, J., Shah, V., Shen, L., et al., 2019. A two-pollutant strategy for improving ozone and particulate air quality in China. Nat. Geosci. doi:10.1038/s41561- 019- 0464- x
Li, M.,Liu, H.,Geng, G.,Hong, C.,Liu, F.,Song, Y.,etal., 2017a. Anthropogenic emission inventories in China: a review. Natl. Sci. Rev. 4 (6), 834–866.
Li, R.,Cui, L.,Li, J.,Zhao, A.,Fu, H.,Wu, Y.,etal., 2017b. Spatialand temporal variation of particulate matter and gaseous pollutants in China during 2014–2016. Atmos. Environ. 161, 235–246
Liu, J. (2009). Official data confirm China as world’s biggest auto producer, consumer, challenges remain. Retrieved May 31, 2020, from http://www.china-embassy.org/eng/xw/t650869.htm
Liu, J.,Kiesewetter, G.,Klimont, Z.,Cofala, J.,Heyes, C.,Schopp, W., et al., 2019. Mitigation pathways of air pollution from residential emissions in the Beijing-Tianjin-Hebei region in China. Environ. Int. 125, 236–244
Ministry of Ecology and Environment of the People’s Republic of China, 2020. Beijing, Tianjin, Hebei and Surrounding Areas Reproduce Heavy Pollution - Five Experts Focused on Answering the Causes of Pollution. Ministry of Ecology and Environment of the People’s Republic of China Retrieved May 31, 2020, from http://www.gov.cn/xinwen/2020-02/12/ content 5477615.htm
Monks, P. (2020). Coronavirus: lockdown’s effect on air pollution provides rare glimpse of low-carbon future. Retrieved May 31, 2020, from https://theconversation.com/ coronavirus- lockdowns- effect- on- air- pollution- providesrare- glimpse- of- low- carbon- future- 134685
Morrison, W.M., 2019. China’s Economic Rise: History, Trends, Challenges, and Implications for the United States. Congressional Research Service, p. 38
NASA Earth Observatory (2020). Airborne nitrogen dioxide plummets over China. Retrieved May 31, 2020, from https://earthobservatory.nasa.gov/images/146362/ airborne- nitrogen- dioxide- plummets- over- china.
Querol, X.,Tobias, A.,Perez, N.,Karanasiou, A.,Amato, F., Stafoggia, M.,etal., 2019. Monitoringtheimpactofdesertdust outbreaks for air quality for health studies. Environ. Int. 130, 104867
Shen, F.,Zhang, L.,Jiang, L.,Tang, M.,Gai, X.,Chen, M.,etal., 2020. Temporal variations of six ambient criteria air pollutants from 2015 to 2018, their spatial distributions, health risks and relationships with socioeconomic factors during 2018 in China. Environ. Int. 137, 105556
Tan, Z.,Hofzumahaus, A.,Lu, K.,Brown, S.S.,Holland, F., Huey, L.G.,etal., 2020. Noevidenceforasignificantimpactof heterogeneous chemistry on radical concentrations in the North China Plain in summer 2014. Environ. Sci. Technol. 54 (10), 5973–5979
Tian, S.,Liang, T.,Li, K., 2019. Fine road dust contamination in a mining area presents a likely air pollution hotspot and threat to human health. Environ. Int. 128, 201–209
Wagner, I. (2020). Largest automobile markets - new car registrations December 2019 YTD. Retrieved May 31, 2020, from https://www.statista.com/statistics/269872/ largest- automobile- markets- worldwide- based- on- new- carregistrations/.
Wang, W.N.,Cheng, T.H.,Gu, X.F.,Chen, H.,Guo, H.,Wang, Y.,et al., 2017. Assessing spatial and temporal patterns of observed ground-level ozone in China. Sci. Rep. 7 (1), 3651
Wang, X.,Dickinson, R.E.,Su, L.,Zhou, C.,Wang, K., 2018. PM2.5 pollution in China and how it has been exacerbated by terrain and meteorological conditions. Bull. Am. Meteorol. 99 (1), 105–119
Wang, Y.,Ying, Q.,Hu, J.,Zhang, H., 2014. Spatial and temporal variations of six criteria air pollutants in 31 provincial capital cities in China during 2013–2014. Environ. Int. 73, 413–422 Worldsteel Association (2019a). February 2019 crude steel production. Retrieved May 31, 2020, from
https://www.worldsteel.org/media-centre/press-releases/ 2019/february- 2019- crude- steel- production.html
Worldsteel Association (2019b). January 2019 crude steel production. Retrieved May 31, 2020, from https://www.worldsteel.org/media-centre/press-releases/ 2019/january- 2019- crude- steel- production.html
Worldsteel Association (2020a). February 2020 crude steel production. Retrieved May 31, 2020, from https://www.worldsteel.org/media-centre/press-releases/ 2020/February- 2020- crude- steel- production.html
Worldsteel Association (2020b). January 2020 crude steel production. Retrieved May 31, 2020, from https://www.worldsteel.org/media-centre/press-releases/ 2020/January- 2020- crude- steel- production.html.
Xie, Y.,Dai, H.,Zhang, Y.,Wu, Y.,Hanaoka, T.,Masui, T., 2019. Comparison of health and economic impacts of PM2.5 and ozone pollution in China. Environ. Int. 130, 104881
Ye, W.F.,Ma, Z.Y.,Ha, X.Z., 2018. Spatial-temporal patterns of PM2.5 concentrations for 338 Chinese cities. Sci. Total Environ. 631-632, 524–533
Yin, X.,deFoy, B.,Wu, K.,Feng, C.,Kang, S.,Zhang, Q., 2019. Gaseous and particulate pollutants in Lhasa, Tibet during 2013-2017: spatial variability, temporal variations and implications. Environ. Pollut. 253, 68–77
Zhang, L.,Lee, C.S.,Zhang, R.,Chen, L., 2017. Spatial and temporal evaluation of long term trend (2005–2014) of OMI retrieved NO2 and SO2 concentrations in Henan Province, China. Atmos. Environ. 154, 151–166
Zhang, Q.,Zheng, Y.,Tong, D.,Shao, M.,Wang, S.,Zhang, Y.,etal., 2019. Drivers of improved PM2.5 air quality in China from 2013 to 2017. PNAS 116 (49), 24463–24469
Zhang, X.Y.,Wang, Y.Q.,Niu, T.,Zhang, X.C.,Gong, S.L., Zhang, Y.M.,etal., 2011. Atmosphericaerosolcompositionsin China: spatial/temporal variability, chemical signature, regional haze distribution and comparisons with global aerosols. Atmos. Chem. Phys. 11 (9), 26571–26615.
Zhang, Y.,Peng, C.,Li, W.,Tian, L.,Zhu, Q.,Chen, H.,etal., 2016. Multiple afforestation programs accelerate the greenness in the ‘Three North’ region of China from 1982 to 2013. Ecol. Indic. 61, 404–412
Zhao, C.,Wang, Q.,Ban, J.,Liu, Z.,Zhang, Y.,Ma, R.,etal., 2020. Estimating the daily PM2.5 concentration in the Beijing-Tianjin-Hebei region using a random forest model with a 0.01 degrees x0.01 degrees spatial resolution. Environ. Int. 134, 105297.
Zhao, X.,Zhou, W.,Han, L.,Locke, D, 2019. Spatiotemporal variation in PM2.5 concentrations and their relationship with socioeconomic factors in China’s major cities. Environ. Int. 133 (Pt A), 105145
Zheng, J.,Zhang, L.,Che, W.,Zheng, Z.,Yin, S., 2009. A highly resolved temporal and spatial air pollutant emission inventory for the Pearl River Delta region, China and its uncertainty assessment. Atmos. Environ. 43 (32), 5112–5122
Zhong, M.,Chen, F.,Saikawa, E., 2019. Sensitivity of projected PM2.5 - and O3 -related health impacts to model inputs: a case study in mainland China. Environ. Int. 123, 256–264
Zhou, X., Strezov, V., Jiang, Y., Yang, X., He, J., Evans, T., 2019. Life cycle impact assessment of airborne metal pollution near selected iron and steelmaking industrial areas in China. Aerosol Air Qual. Res. doi:10.4209/aaqr.2019.10.0552
Zhou, X., Strezov, V., Jiang, Y., Yang, X., Kan, T., Evans, T., 2020. Contamination identification, source apportionment and health risk assessment of trace elements at different fractions of atmospheric particles at iron and steelmaking areas in China. PloS One doi:10.1371/journal.pone.0230983.
Zhou, X.,Taylor, M.P.,Davies, P.J.,Prasad, S., 2018. Identifying sources of environmental contamination in European honey bees (Apis mellifera) using trace elements and lead isotopic compositions. Environ. Sci. Technol. 52 (3), 991–1001
Zhou, Y.,Xing, X.,Lang, J.,Chen, D.,Cheng, S.,Wei, L.,et al., 2017. A comprehensive biomass burning emission inventory with high spatial and temporal resolution in China. Atmos. Chem. Phys. 17 (4), 2839–2864
Zou, B.,You, J.,Lin, Y.,Duan, X.,Zhao, X.,Fang, X.,etal., 2019. Air pollution intervention and life-saving effect in China. Environ. Int. 125, 529–541.


