Activate the eBook version of this title at no additional charge.
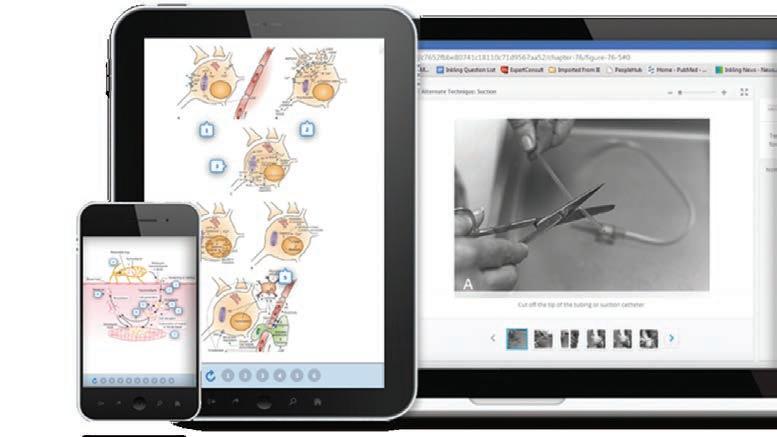
Elsevier eBooks for Practicing Clinicians gives you the power to browse and search content, view enhanced images, highlight and take notes— both online and offline.
Unlock your eBook today.
1. Visit expertconsult.inkling.com/redeem
2. Scratch box below to reveal your code
3. Type code into “Enter Code” box
4. Click “Redeem”
5. Log in or Sign up
6. Go to “My Library” It’s that easy!
For technical assistance: email expertconsult.help@elsevier.com call 1-800-401-9962 (inside the US) call +1-314-447-8300 (outside the US)
No part of this publication may be reproduced or transmitted in any form or by any means, electronic or mechanical, including photocopying, recording, or any information storage and retrieval system, without permission in writing from the publisher. Details on how to seek permission, further information about the Publisher’s permissions policies and our arrangements with organizations such as the Copyright Clearance Center and the Copyright Licensing Agency, can be found at our website: www.elsevier.com/permissions
This book and the individual contributions contained in it are protected under copyright by the Publisher (other than as may be noted herein).
Notice
Practitioners and researchers must always rely on their own experience and knowledge in evaluating and using any information, methods, compounds or experiments described herein. Because of rapid advances in the medical sciences, in particular, independent verification of diagnoses and drug dosages should be made. To the fullest extent of the law, no responsibility is assumed by Elsevier, authors, editors or contributors for any injury and/or damage to persons or property as a matter of products liability, negligence or otherwise, or from any use or operation of any methods, products, instructions, or ideas contained in the material herein.
ISBN 978-0-7020-8373-0
eISBN 978-0-7020-8374-7
For Elsevier
Content Strategist: Kayla Wolfe
Content Development Specialist: Deborah Poulson
Project Manager: Julie Taylor
Designer: Amy Buxton
Printed in India
Last digit is the print number: 9 8 7 6 5 4 3 2 1
PREFACE
This fourth edition of Kanski’s Synopsis of Clinical Ophthalmology is intended to be used principally as a companion to the ninth edition of Kanski’s Clinical Ophthalmology. It provides a summary of the larger book and is filled with beautiful illustrations. Synopsis can be used as a portable, rapidly searchable reference source that is suitable for use in a busy clinic. Alternatively, the contents and images are available in an online electronic format. The book is ideal as a basis for revision and is presented as a series of easily absorbed topic summaries. General practitioners, medical students, optometrists and specialist nurses requiring a shorter, but comprehensive review of ophthalmology, may find Synopsis a more appropriate text than the lengthier consideration of Kanski’s Clinical Ophthalmology.
Jack Kanski’s unique approach of presenting core knowledge in a systematic and succinct form has been maintained. Brad Bowling had a significant influence on the previous edition and his accuracy and meticulous attention to detail has been extremely helpful. I have started this edition with a new chapter on examination techniques and a short overview of the most important ophthalmic special investigations. Each chapter has been updated and the latest evidence-based diagnostic and therapeutic advances have been included.
All the illustrations have been reformatted and many new images have been added. I am grateful to colleagues past and present, whose images are included in this edition. I have once again had the good fortune of working with Jon Brett, a world-class photographer and artist, whose expertise has been invaluable.
I am indebted to Elsevier for entrusting me with this work and, in particular, I wish to thank Julie Taylor, Kayla Wolfe and Deborah Poulson for their editorial contribution. I hope you, the reader, obtain as much enjoyment from the book as I have obtained from preparing it!
J.F. Salmon Oxford 2021
Ambresin A. 1.12A-B, 14.5C-D, 14.7C-D, 14.8A-B, Barry C. 2.23A, 4.7D, 6.3, 7.21D, 8.3D, 12.14, 12.30A, C-D, 13.8B, 13.10A, 13.14B-D, 15.3B, 15.6B, 16.1C, 16.12B, 17.1A, 20.12A, 20.20B, 20.22A, 22.4A, Bates R. 5.2C, 7.19B, 8.3A, 9.4A, 12.28B, 13.7A-B, 20.9A, 22.6B, Carmichael T. 7.1B, 7.5A, 7.17B, 7.21B, 7.24B, 7.28B, 20.7B, Chen S. 4.7A, 4.16B, 7.32A, 12.26A, 13.8A, 13.9A, 13.10C, 13.14A, 13.19A-B, 14.2A-B, 14.3A, 14.16D, 15.8C, 16.3D, 16.5B, 16.8B, 22.9D, Damato B. 16.11A, 20.8D, 20.13A, 20.17B, Dart J. 6.13B, 7.33B, Farley S, Cole T, Rimmer L. 19.4B, Gili P. 19.1C, 19.9A, Harry J. 11.17A, Herbort C. 12.15A, 12.23B, Hildebrand D. 3.5B, 4.10A-B, 18.14A-B, 18.15A-B, 19.9C, Issa P. 12.29A-B, 12.30B, 13.20B, 15.5D, 15.7C-D, Kerr-Muir M. 7.18A, Krachmer J, Mannis M, Holland E. Cornea, Mosby 2005. 8.3C, Leyland M. 8.5D, Lisch W. 7.21A, 7.25C, 7.26C, Malhotra R. 2.27A, Meyer D. 2.27B, Milewski S. 20.13B, Moorfields Eye Hospital 12.23A, Murray ADN. 12.22A, 18.3A-B, 18.4A-B, 18.10A-B, 18.11A-B, 19.11B. 19.19A-B, Nischal K.K. 3.2A, 3.6A, 4.13A, 11.19B, Norris J. 2.23C, 4.8D, Papadopoulos M. 11.19A, Parulekar M. 2.27C, 18.9A-B, Patel CK. 13.18C-D, Pavesio C. 12.2C, 12.3D, 12.18B, Pearson A. 2.3C, 3.6B, 4.11A-B, 4.12A, 4.15A, Pennesi M. 15.13D, Ratnarajan G. 11.28A, Ridgway A. 7.25D, Saine P. 6.1A, 15.1A, Scanlon P. 14.14D, 14.16B, Singh AD, Damato BE, Pe’er J, Murphree AL, Perry JD. Clinical Ophthalmic Oncology, Saunders 2007, 2.8B, Smit D. 2.44B, Snead M. 15.11A-B, Terry P. 16.10B, Tuft S. 2.14D, 3.9B, 5.2B and D, 6.7D, 6.8B-D, 6.11C, 6.14B, 7.1D, 7.2A, 7.9D, 7.11B, 7.16A, 7.19A, 7. 33A, 8.2C-D, 8.5C, Yangüela J. 19.30B-C, Yusuf I. 21.3A-B, Zitelli B, Davis H. Atlas of Pediatric Physical Diagnosis. Mosby 2002, 4.17A.
Before examining the eye, a thorough ophthalmic history should be taken. The history can be divided into the following basic categories of questioning:
◾ Main complaint: (a) rapidity of onset, (b) circumstances surrounding the onset, (c) severity, (d) duration of symptoms, (e) frequency of symptoms.
◾ Past ocular history: e.g. previous surgery, inflammation, trauma.
◾ Past medical history: e.g. diabetes and hypertension.
◾ Systemic medication: e.g. corticosteroids, tamsulosin.
◾ Allergies: e.g. antibiotics, topical glaucoma medications.
◾ Family history: e.g. glaucoma, macular degeneration, inherited retinal disease.
◾ Occupation and hobbies
Common ocular symptoms
◾ Abnormality in vision: (a) visual loss and blurring (central or peripheral), (b) change in colour vision, (c) visual aberration (scotoma, distortion, flashing lights, floaters), (d) diplopia (monocular, binocular, neurological symptoms).
◾ Change in appearance: (a) redness, (b) swelling of the eyelids, (c) displacement of the eyeball, (d) changes to the lids and periocular tissues, (e) discharge and watering.
Visual acuity
Visual acuity is directly related to the minimum angle of separation between two objects that allows them to be seen distinctly. Visual acuity should always be determined first, regardless of whether the patient complains of visual disturbance or not. Each eye is tested separately, with and without spectacles. A pinhole disc is a simple method of focusing light and temporarily removes the effect of refractive error.
SNELLEN VISUAL ACUITY
A Snellen chart is used, with the subject reading the chart from a standard distance (Fig. 1.1A). Normal visual acuity equates to 6/6 (20/20 in non-metric notation). If the patient is unable to see the chart using either spectacles or a pinhole disc the vision can be determined by counting fingers (CF), seeing hand movements (HM), or by assessing the ability to see light (PL).
LOGMAR VISUAL ACUITY
LogMAR is an acronym for the base-10 logarithm of the minimum angle of resolution. A Bailey–Lovie chart is used, which has an equal number of letters on each line and the lines are balanced for consistency of readability (Fig. 1.1B). LogMAR 0.00 is equivalent to 6/6 and logMAR 1.00 is equivalent to 6/60. Because logMAR acuity addresses many of the deficiencies of the Snellen chart it is commonly used when research is undertaken.
Contrast sensitivity
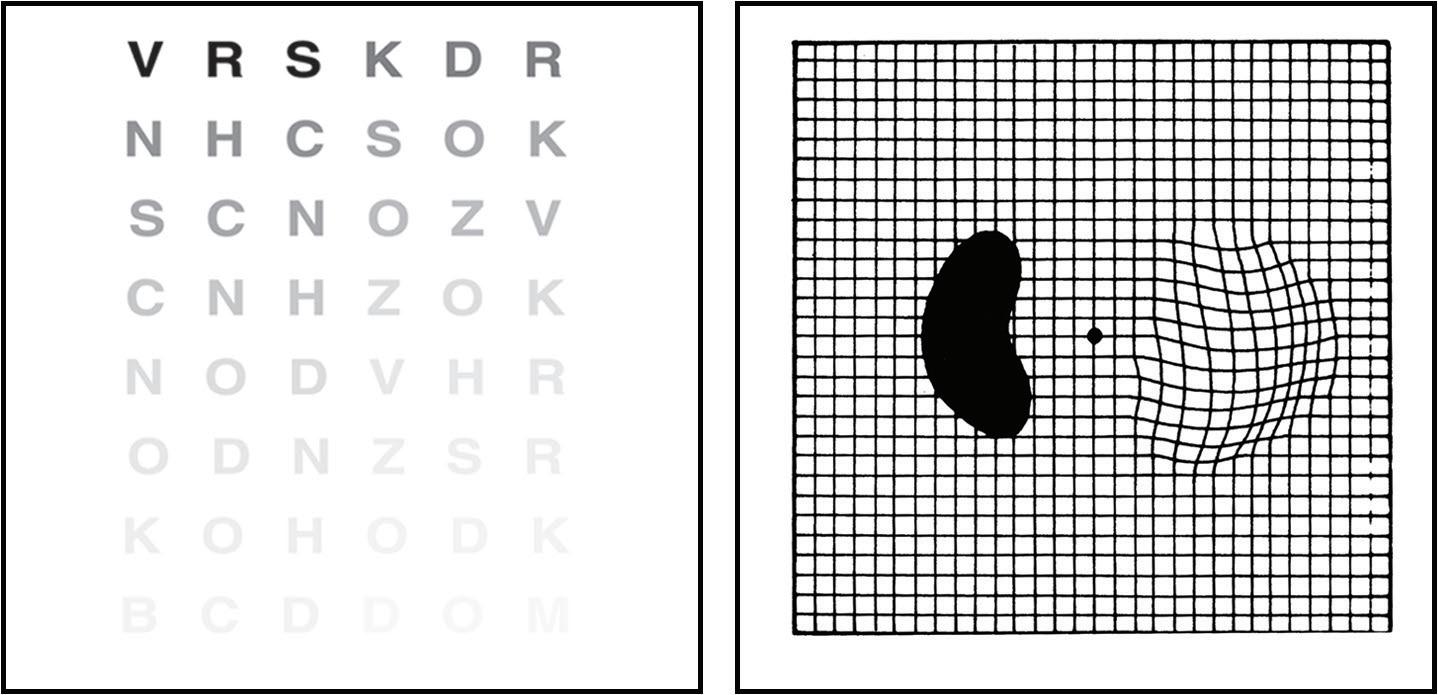
Contrast sensitivity is a measure of the ability of the visual system to distinguish an object against its background. The Pelli–Robson contrast sensitivity letter chart is viewed at 1 m and consists of rows of letters of equal size, but with decreasing contrast of 0.15 log units for groups of three letters (Fig. 1.2A).
Fig. 1.2 (A) Pelli–Robson contrast sensitivity letter chart, (B) Amsler grid showing wavy lines indicating metamorphopsia and a dense scotoma. (From Salmon JF, Kanski’s Clinical Ophthalmology: A Systematic Approach, 9th edition. Oxford, UK: Elsevier; 2020.)
Amsler grid
The Amsler grid evaluates the central 20° of the visual field centred on fixation (Fig. 1.2B). It is an easy method of monitoring central visual field and is commonly abnormal in patients with macular disease.
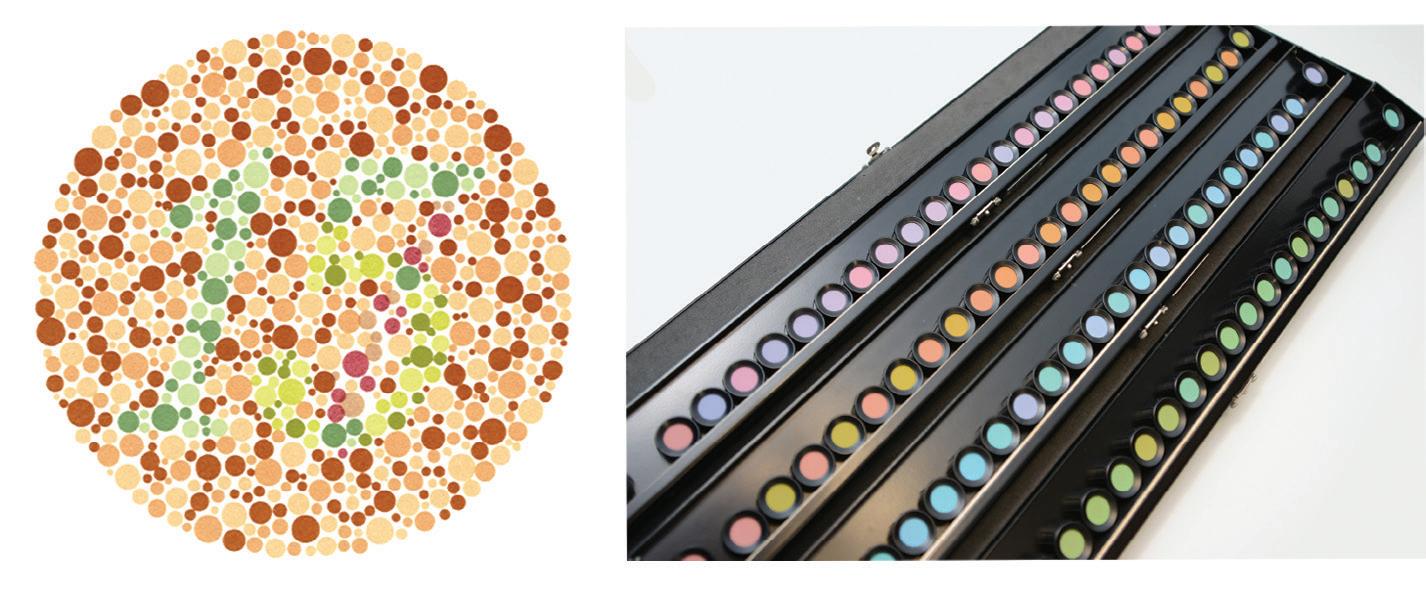
Colour vision
ISHIHARA
This test is simple to undertake, is widely available, and is frequently used to screen for red-green colour anomalies. Inherited colour vision deficiency affects 8% of men and 0.5% of women. The test can also be used to assess optic nerve disease (Fig. 1.3A).
FARNSWORTH–MUNSELL 100-HUE TEST
This test is sensitive but takes longer than the Ishihara to perform. It is used for congenital and acquired colour defects (Fig. 1.3B).
Visual field
Visual field results should always be used in conjunction with the clinical findings. The test is particularly important in glaucoma and neurological disease.
◾ The visual field: can be represented as a three-dimensional structure akin to a hill of increasing sensitivity. The outer aspect extends approximately 50° superiorly, 60° nasally, 70° inferiorly and 90° temporally.
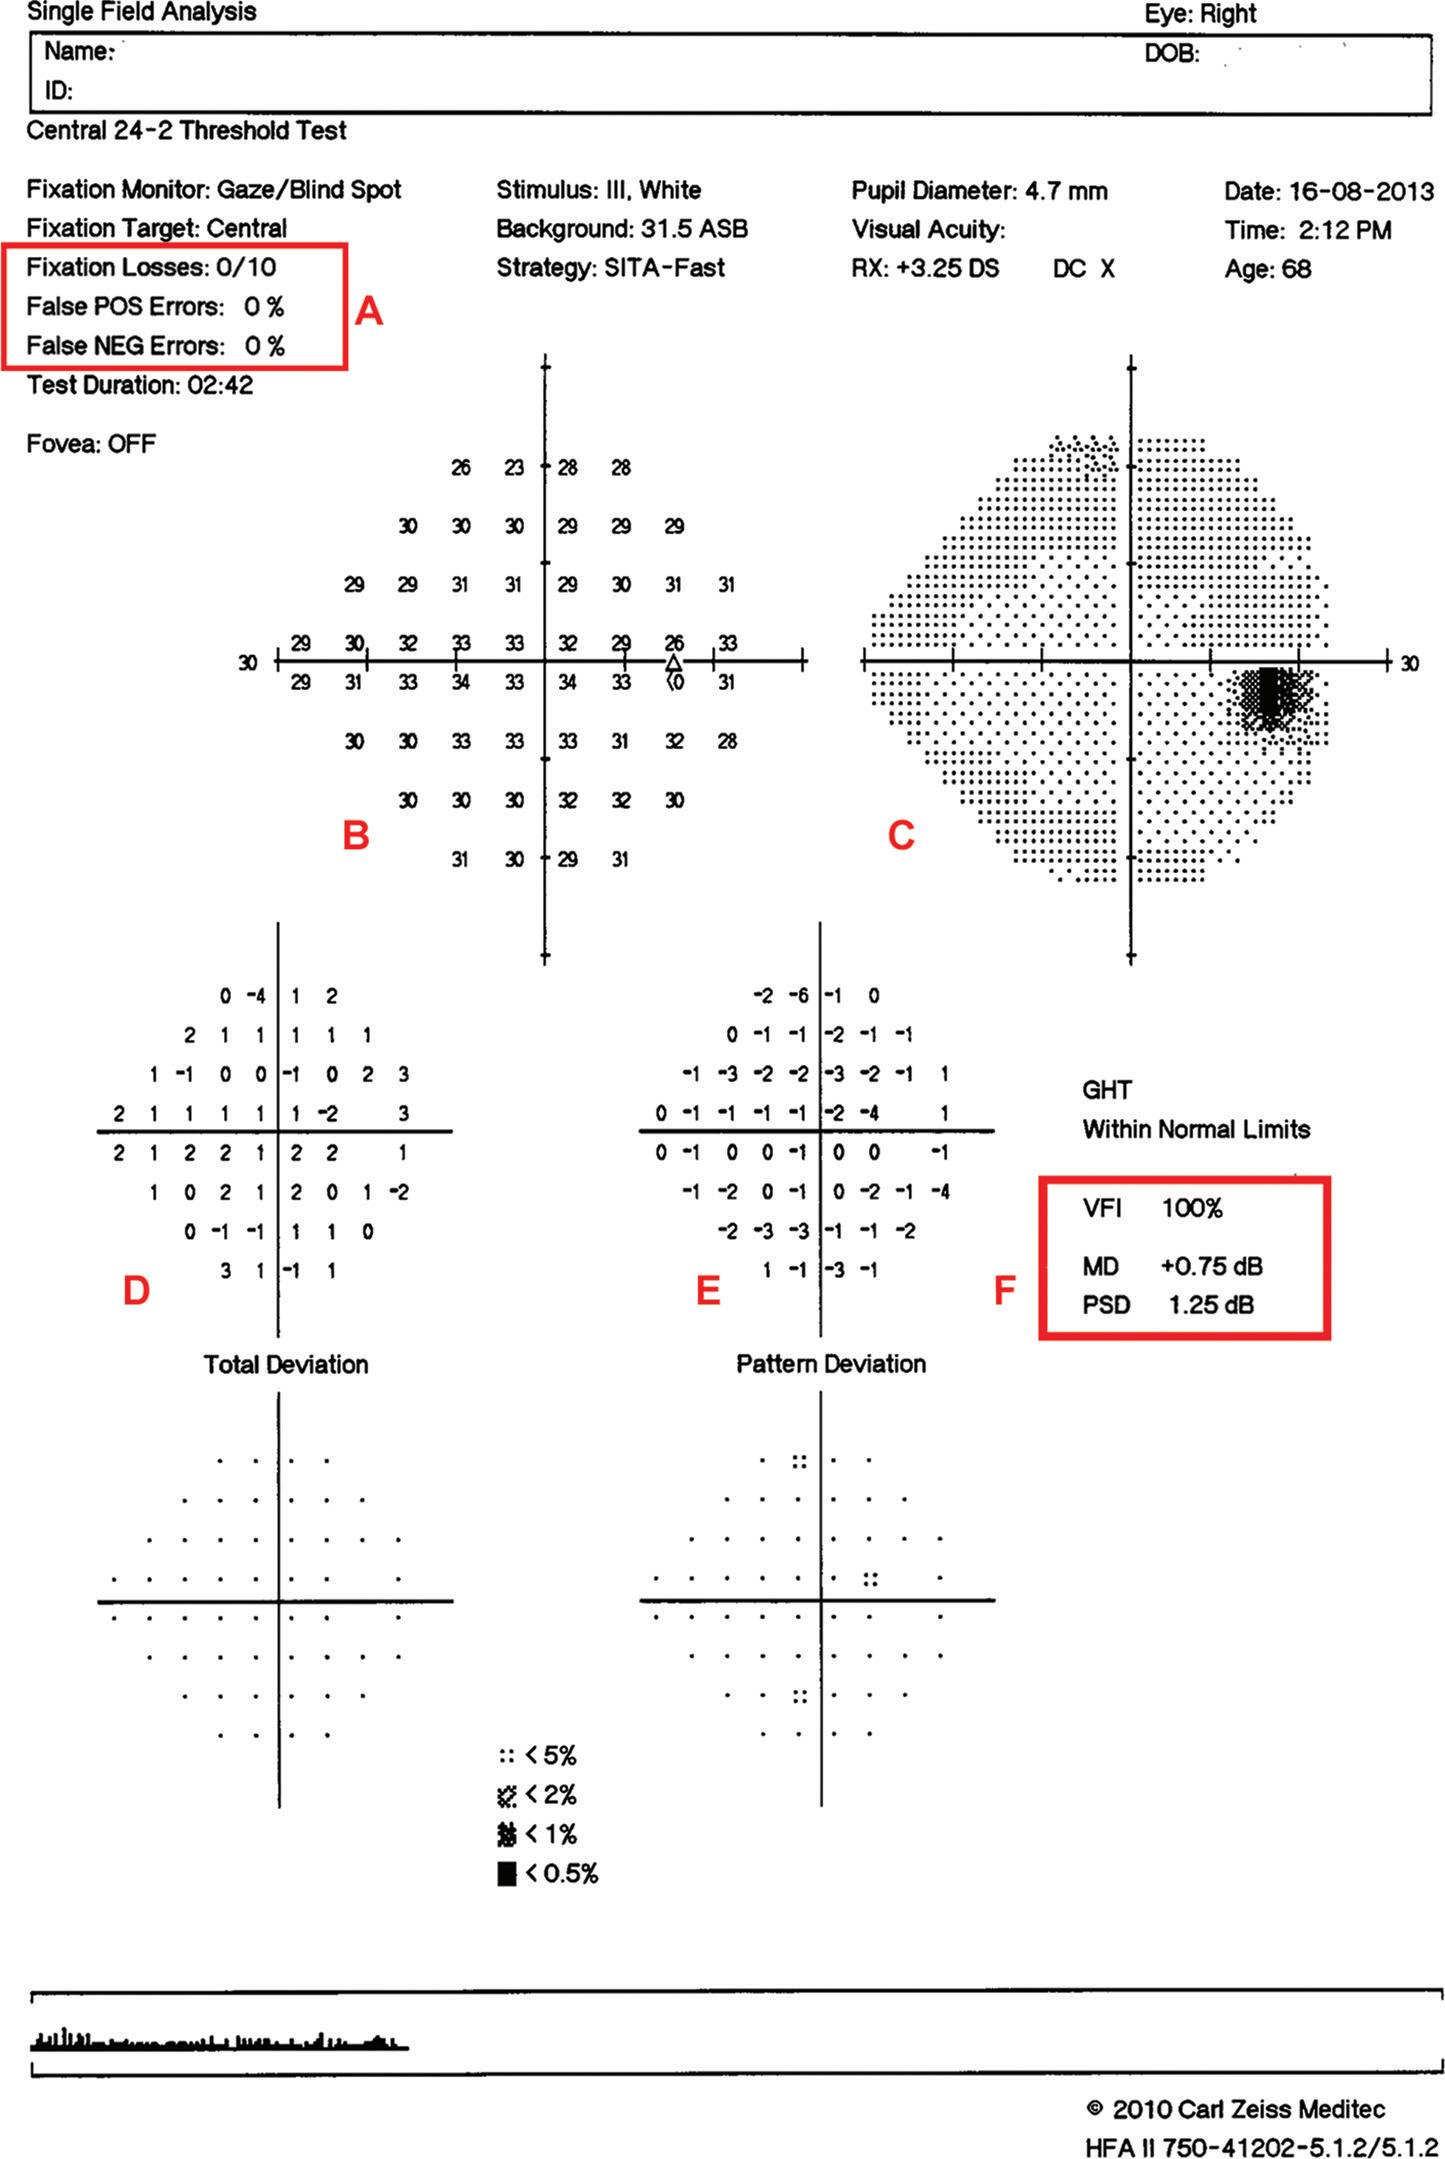
◾ Static perimetry: is a method of assessing fields in which the stimulus remains fixed, with intensity increasing until it is seen by the subject or decreasing until it is no longer detected. Standard automated perimetry (SAP) uses this method (Fig. 1.4).
◾ Kinetic perimetry: is undertaken by moving a stimulus of constant intensity from a non-seeing area to a seeing area at a constant speed until it is perceived.
ANALYSIS OF VISUAL FIELDS
◾ Reliability indices (Fig. 1.4A): with SITA strategies false positive or false negative responses over 15% should be considered significant. If the test is found to be unreliable, further evaluation of the printout is pointless.
◾ A numerical display (Fig. 1.4B): gives the threshold in dB at each point tested in the field. A grey scale (Fig. 1.4C) represents the numerical display in graphical form; decreasing sensitivity is represented in darker tones.
◾ Total deviation (Fig. 1.4D): shows the difference between a test-derived threshold at a given point and the normal sensitivity at that point for the general population.
◾ Pattern deviation (Fig. 1.4E): is the total deviation adjusted for a generalized decrease in sensitivity in the whole field (for example, the presence of cataract).
◾ Summary values (Fig. 1.4F): represent distilled statistical information: (a) visual field index (VFI) is a measure of overall visual field function expressed as a percentage, (b) mean deviation (MD) provides an indication of the overall sensitivity of the field, (c) pattern standard deviation (PSD) is a measure of focal loss (an increased PSD is an indicator of glaucoma), (d) the glaucoma hemifield test (GHT) compares corresponding areas in the superior and inferior hemifields.
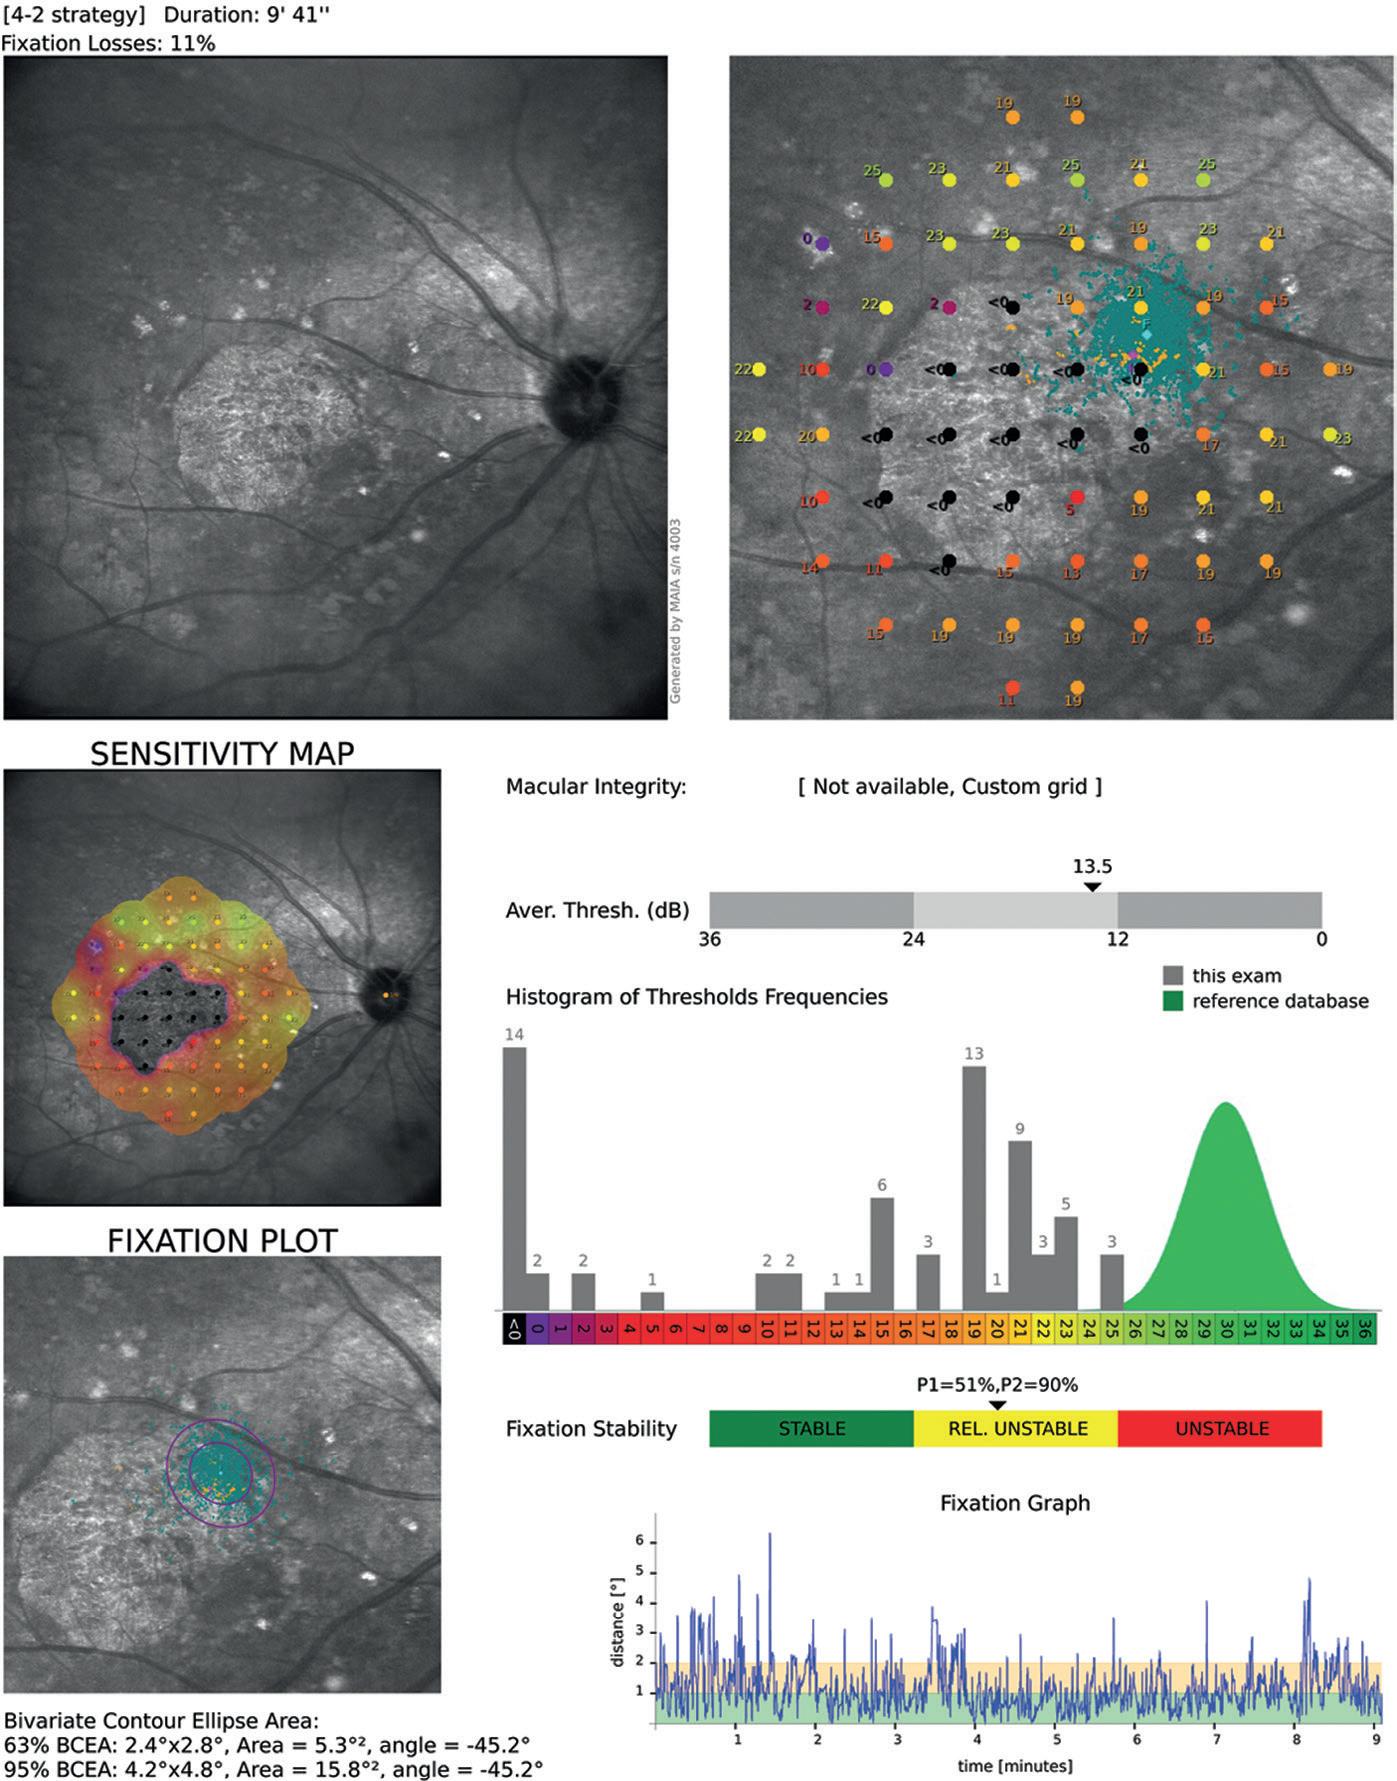
Microperimetry
Microperimetry is a subjective visual field test that measures retinal sensitivity and fixation behaviour in patients with macular disease and glaucoma involving the central 9° of visual field (Fig. 1.5).
EXTERNAL EXAMINATION
External examination of the eye, periorbital tissues and orbit should be undertaken before magnification is used. Fluorescein dye allows pathology on the surface of the cornea to be visualized (see Fig. 22.8B) and is used when Goldmann applanation tonometry is undertaken.
Fig. 1.5 Microperimetry in a patient with geographic atrophy of the macula. (From Salmon JF, Kanski’s Clinical Ophthalmology: A Systematic Approach, 9th edition. Oxford, UK: Elsevier; 2020.)
Slit lamp biomicroscopy of the anterior segment
The purpose of slit lamp examination is to determine the position, depth and size of any abnormality of the cornea and anterior segment. It provides good lighting and a stereoscopic view: (a) direct illumination with a diffuse light is used to detect gross abnormalities, (b) scleral scatter involves decentring the slit beam laterally so that the light is incident on the limbus with the microscope focused centrally; light is transmitted within the cornea by total internal reflectivity which allows subtle
stromal haze to be detected, (c) retroillumination uses reflected light from the iris to illuminate the cornea, permitting the detection of fine epithelial and endothelial changes, (d) specular reflection shows abnormalities of the endothelium such as reduced cell density and guttata.
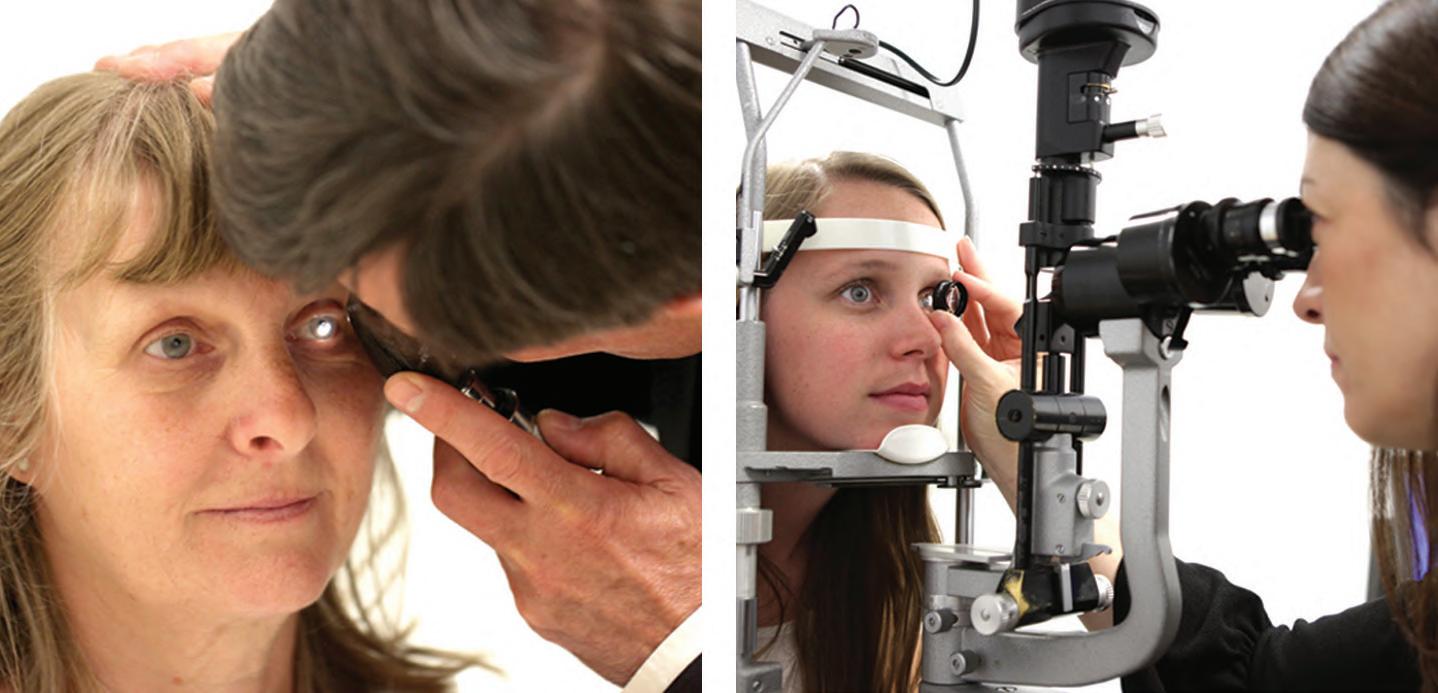
DIRECT OPHTHALMOSCOPY
◾ Ophthalmoscope (Fig. 1.6A). Direct examination of the structures of the fundus using an ophthalmoscope can reveal disease of the eye itself or may reveal an abnormality indicative of disease elsewhere in the body (for example: diabetes, systemic hypertension, raised intracranial pressure). The image obtained is magnified (×15), but the disadvantages are that there is no stereopsis and that the field of view is small.
INDIRECT OPHTHALMOSCOPY
This can be undertaken using a slit lamp or a head-mounted ophthalmoscope. A condensing lens is held at the focal point of the eye and provides an inverted and laterally reversed image.
◾ Slit lamp biomicroscopy (Fig. 1.6B): (a) non-contact lenses: 60D (high magnification); when estimating optic disc size use a correction factor of ×1.0; for the 90D (wide-field) lens use a correction factor of 1.3 and for the 78D lens use ×1.1, (b) contact lenses: the Goldman three mirror lens has a central lens and three mirrors set at different angles. A viscous coupling solution is required.
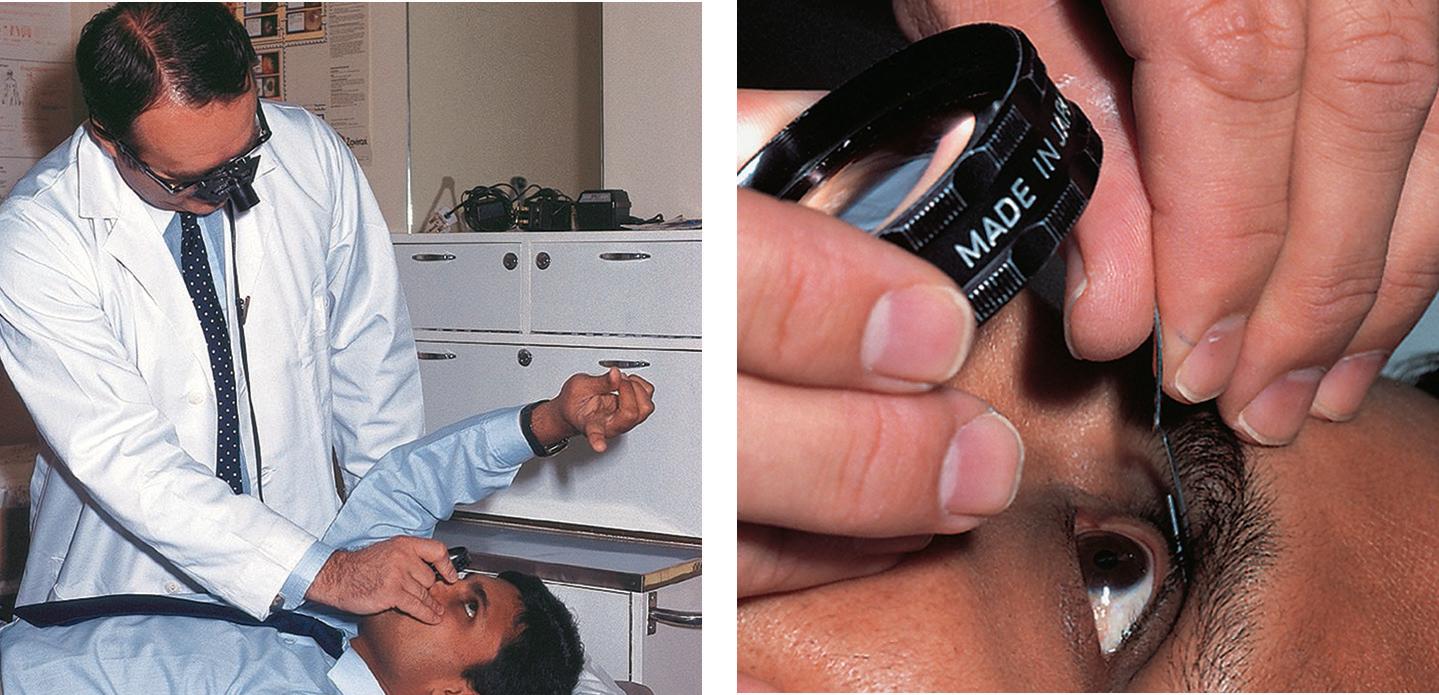
◾ Head-mounted binocular indirect ophthalmoscopy (Fig. 1.7A and B): allows retinal visualization through a greater degree of media opacification than slit lamp ophthalmoscopy. A 20D lens magnifies ×3 and a 28D lens (shorter working distance; used in a smaller pupil) magnifies ×2.27.
Tonometry
Tonometry is the method of measuring the intraocular pressure (IOP) using calibrated instruments. The normal range for individuals over 40 years of age is 11–21 mm Hg, but 4–7% of normal individuals have an IOP of more than 21 mm Hg (see Chapter 11).
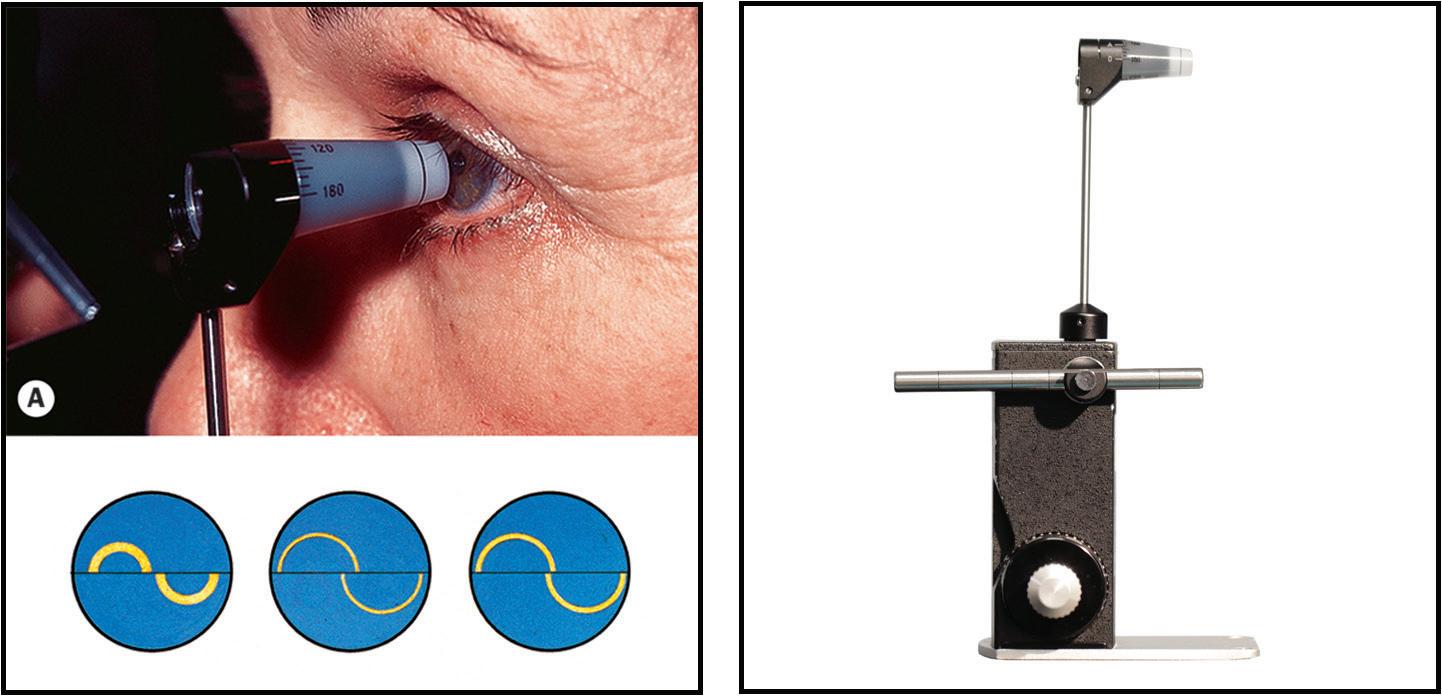
Fig. 1.8 Goldmann applanation tonometry: (A) contact between the tonometer prism and the cornea, (B) correct end-point using mires of appropriate thickness, (C) tonometer calibration bar in position. (From Salmon JF, Kanski’s Clinical Ophthalmology: A Systematic Approach, 9th edition. Oxford, UK: Elsevier; 2020.)
◾ Goldmann tonometry: This is an accurate variable-force tonometer consisting of a double prism which applanates the central cornea (Fig. 1.8A). Fluorescein stain is used to create semi-circular mires (Fig. 1.8B). Accuracy is lost with constant use and the tonometer should be checked on a regular basis for calibration error (Fig. 1.8C). Calculations are based on a central corneal thickness of 520 microns (if the cornea is thinner, an underestimation of IOP is likely to result and if thicker, an overestimation). Corneal oedema may result in an artificial reduction in the IOP value. Other sources of error include inappropriate fluorescein pattern and pressure on the globe.
◾ Perkins applanation tonometry: as above, but hand-held with portable light source.
◾ Other methods: (a) pneumotonometry (‘air-puff’) is based on the principle of applanation using a jet of air rather than a prism, (b) electronic applanation tonometry (tonopen); the probe tip contains a transducer that measures applied force, (c) dynamic contour tonometry; a solid-state sensor and a corneal contour-matching surface is used. It has the advantage of measuring the IOP independent of corneal mechanical factors.
◾ Ocular response analyser and corneal hysteresis
This instrument uses air-puff technology to record two applanation measurements: one while the cornea is moving inward and one when the cornea returns to its normal position. The average of these two measurements provides a Goldmann-related IOP measurement. The difference between the IOP measurements is called corneal hysteresis. The value obtained is accurate in individuals who have undergone laser refractive surgery. Patients with a low hysteresis value are at greater risk of glaucoma progression and it may serve as a biomarker to aid glaucoma case detection.
Central corneal thickness
This can be measured using pachymetry or by imaging with an Orbscan. The average value is 540 microns (range: 510–570 microns). It is an important measurement when determining the risk of conversion to glaucoma in individuals with raised intraocular pressure.
Gonioscopy
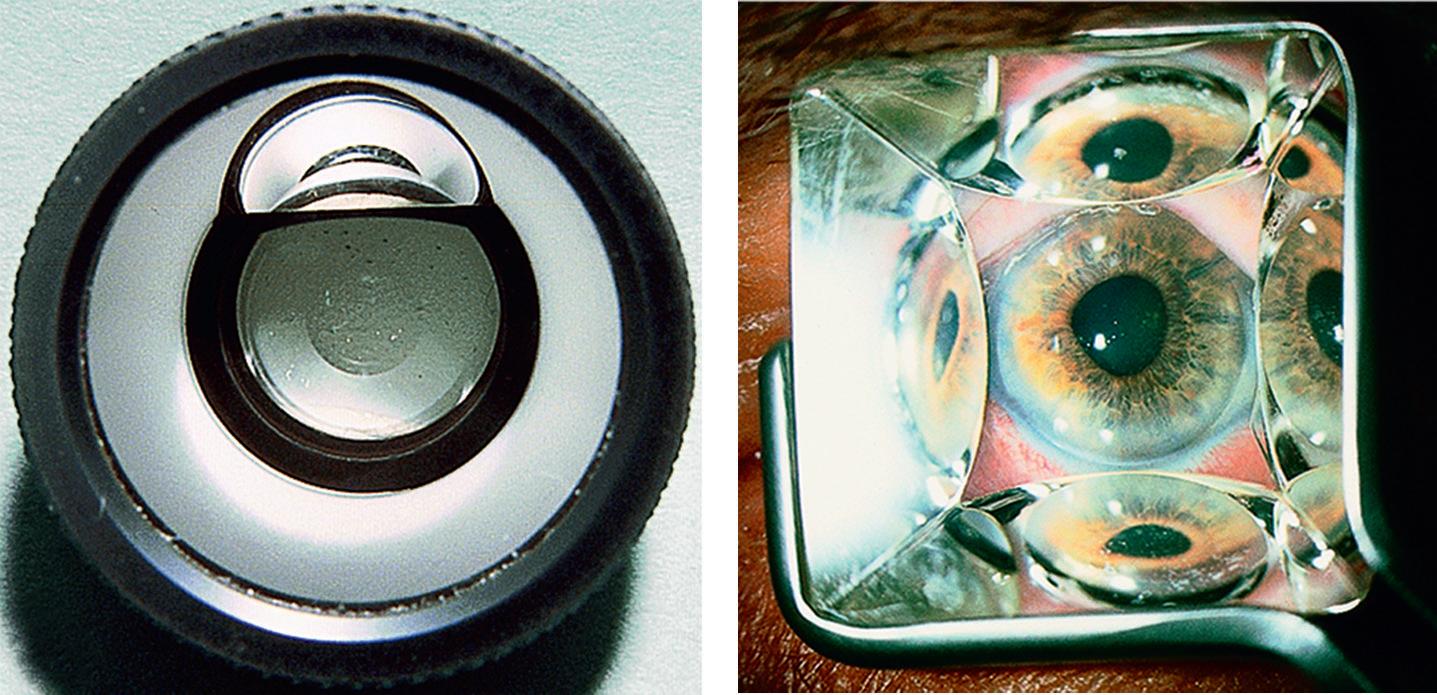
Gonioscopy is a method of evaluating the anterior chamber angle. A contact lens is used, e.g. Goldmann one-mirror lens (Fig. 1.9A), Zeiss four-mirror lens (Fig. 1.9B). The examination should take place in a darkened room. Abnormalities that can be detected using gonioscopy include: (a) angle closure, (b) neovascularization, (c) hyper-pigmentation, (d) angle recession (see Chapter 11).
◾ Indirect gonioscopy provides an inverted view of the portion of the angle opposite the mirror. Non-indentation requires a coupling fluid. Indentation gonioscopy does not require a coupling fluid and allows a view of the angle when there is apposition between the peripheral iris and cornea. It allows the degree of synechiae to be determined.
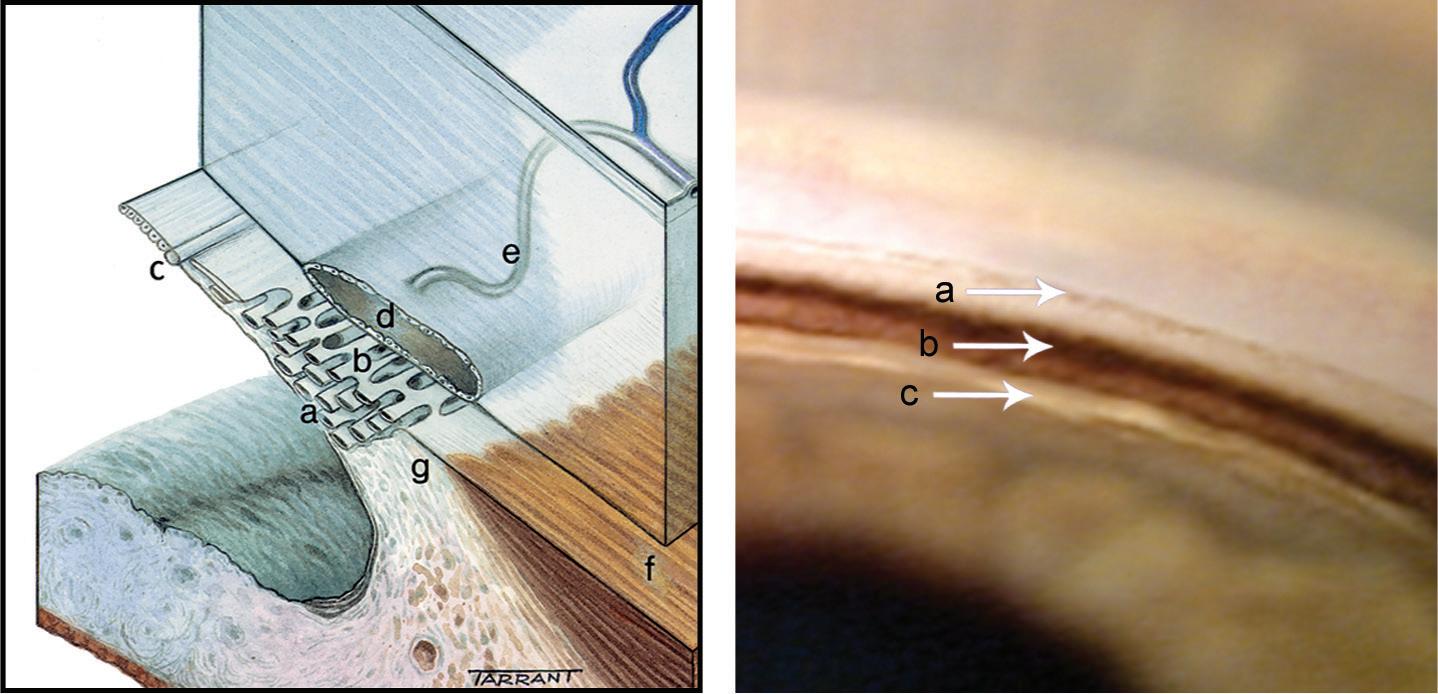
Fig. 1.10 (A) Anatomy of outflow channels: (a) uveal meshwork, (b) corneoscleral meshwork, (c) Schwalbe line, (d) Schlemm canal, (e) collector channels, (f) longitudinal muscle of the ciliary body, (g) scleral spur. (B) Normal structures on gonioscopy: (a) Schwalbe line, (b) pigmented meshwork, (c) ciliary body band. (From Salmon JF, Kanski’s Clinical Ophthalmology: A Systematic Approach, 9th edition. Oxford, UK: Elsevier; 2020.)
◾ Direct gonioscopy: light rays from the angle are viewed directly. The examination is undertaken with the patient in a supine position, usually under general anaesthesia in the evaluation and surgical treatment of congenital glaucoma or under local anaesthesia when undertaking MIGS.
◾ Identification of angle structures: (a) Schwalbe line is the most anterior structure and demarcates the peripheral termination of Descemet membrane and the anterior limit of the trabeculum, (b) the corneal wedge is useful in identifying an inconspicuous Schwalbe line (see Fig. 11.5), (c) the trabeculum extends from the Schwalbe line to the scleral spur; the non-functioning part has a whitish colour, while the functioning part is pigmented in adults, (d) the Schlemm canal is a slightly darker line deep to the posterior trabeculum, (e) the ciliary body stands out just behind the scleral spur as a pink, dull brown or slate-grey band (Fig. 1.10A and B).
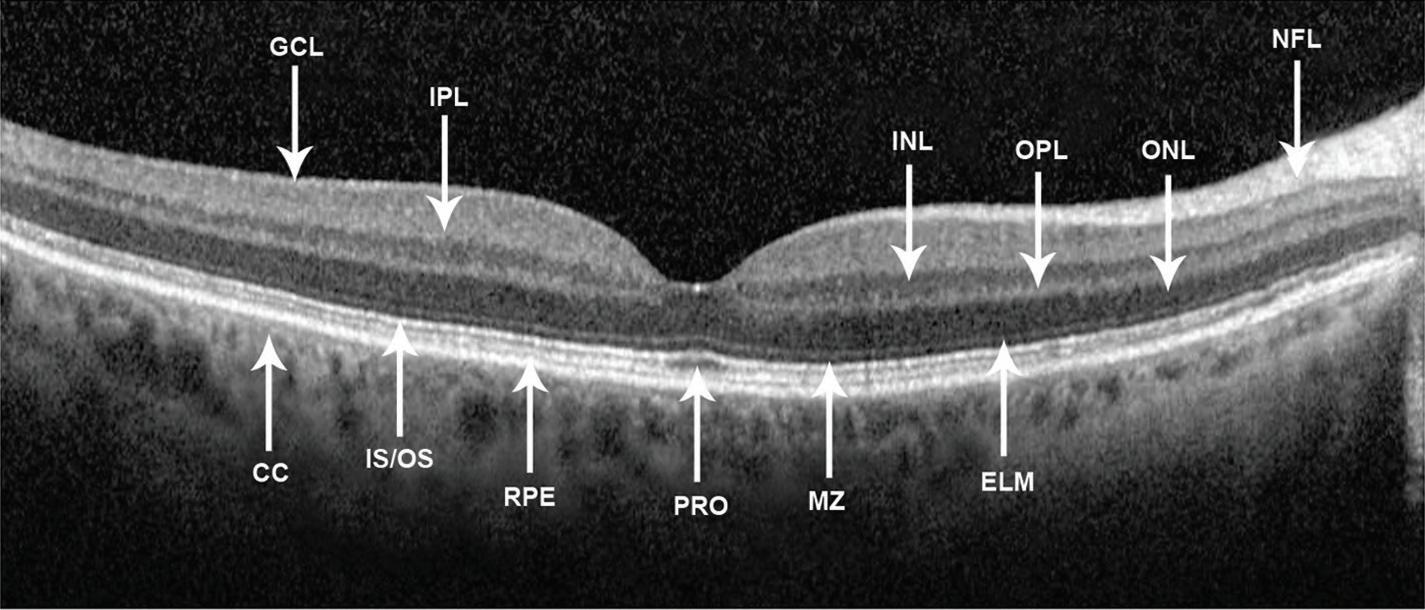
Optical coherence tomography (OCT)
OCT is a non-invasive, non-contact imaging system that provides high resolution images of the anterior and posterior segments (Fig. 1.11). The diagnosis and monitoring of macular pathology has been revolutionized by this technology (see Chapters 13–15). OCT is commonly used in the imaging of the retinal nerve fibre layer in individuals with ocular hypertension and glaucoma (see Chapter 11).
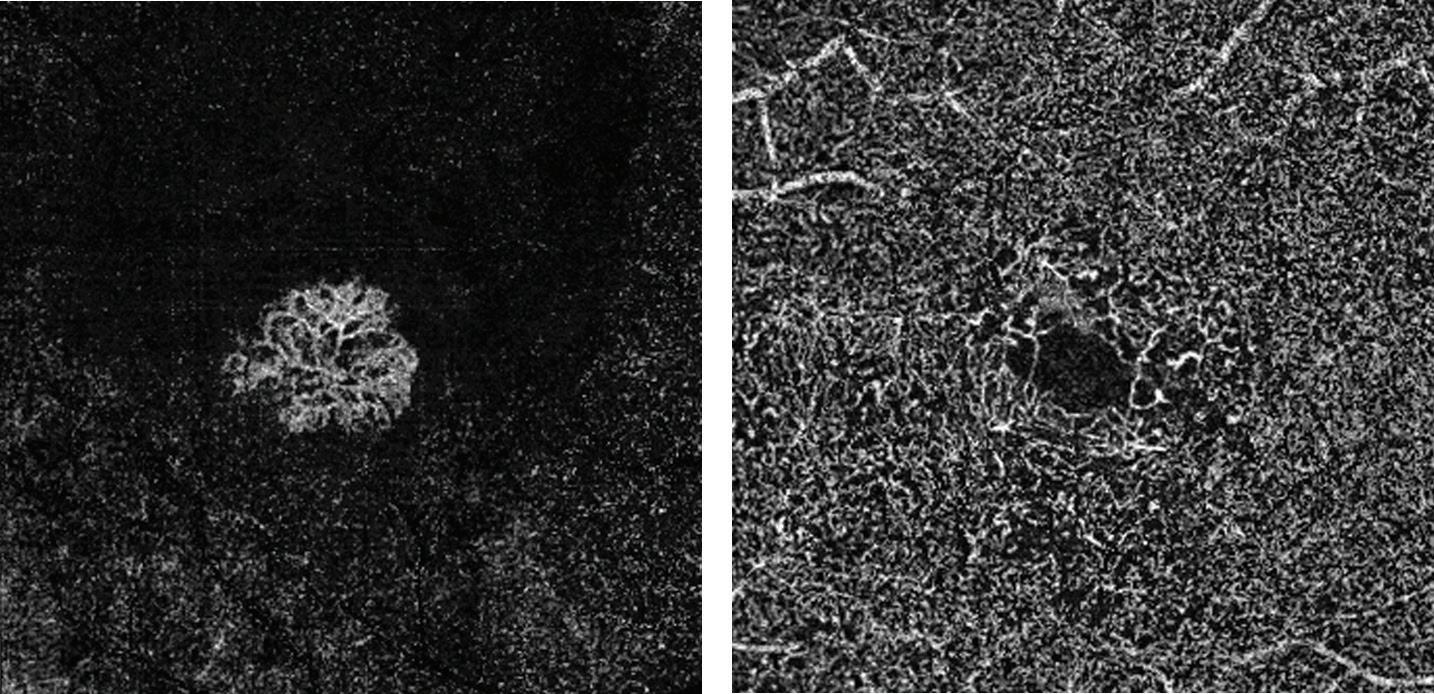
OCT angiography
This is a new, non-invasive diagnostic technique that allows the blood flow in the retina and choroid to be visualized without the need for an injection of contrast medium. The disadvantage of the technique is that the classic abnormalities of traditional angiography (leakage, staining, pooling) are not shown.
◾ Indications: (a) diagnosis and monitoring of choroidal neovascular membranes (Fig. 1.12A), (b) diabetic retinopathy (Fig. 1.12B), (c) visualization of abnormal choroidal vessels and polyps, (d) chronic central serous retinopathy, (e) some intraocular tumours.
This involves photographic surveillance of the passage of fluorescein through the retinal and choroidal circulations following intravenous injection.
◾ Fluorescein binding: 70–85% of fluorescein molecules are bound to serum proteins and the rest is unbound (free).
◾ The outer blood–retinal barrier: while the major choroidal vessels are impermeable to fluorescein, free molecules can pass through the choriocapillaris into the extravascular space. The fluorescein passes across Bruch membrane, but cannot cross the tight junctions of the retinal pigment epithelium (RPE).
Fig. 1.12 OCT angiography: (A) choroidal neovascular membrane, (B) loss of perifoveal network in diabetic maculopathy. (Courtesy of A Ambresin.)
◾ The inner blood–retinal barrier: tight junctions between the retinal capillary endothelial cells confine fluorescein to the lumen of the capillaries. Disruption of this barrier permits leakage into the extravascular space.
◾ Adverse effects: (a) discolouration of skin and urine, (b) nausea and vomiting, (c) itching and sneezing, (d) rarely: syncope, laryngeal oedema, bronchospasm and anaphylactic shock.
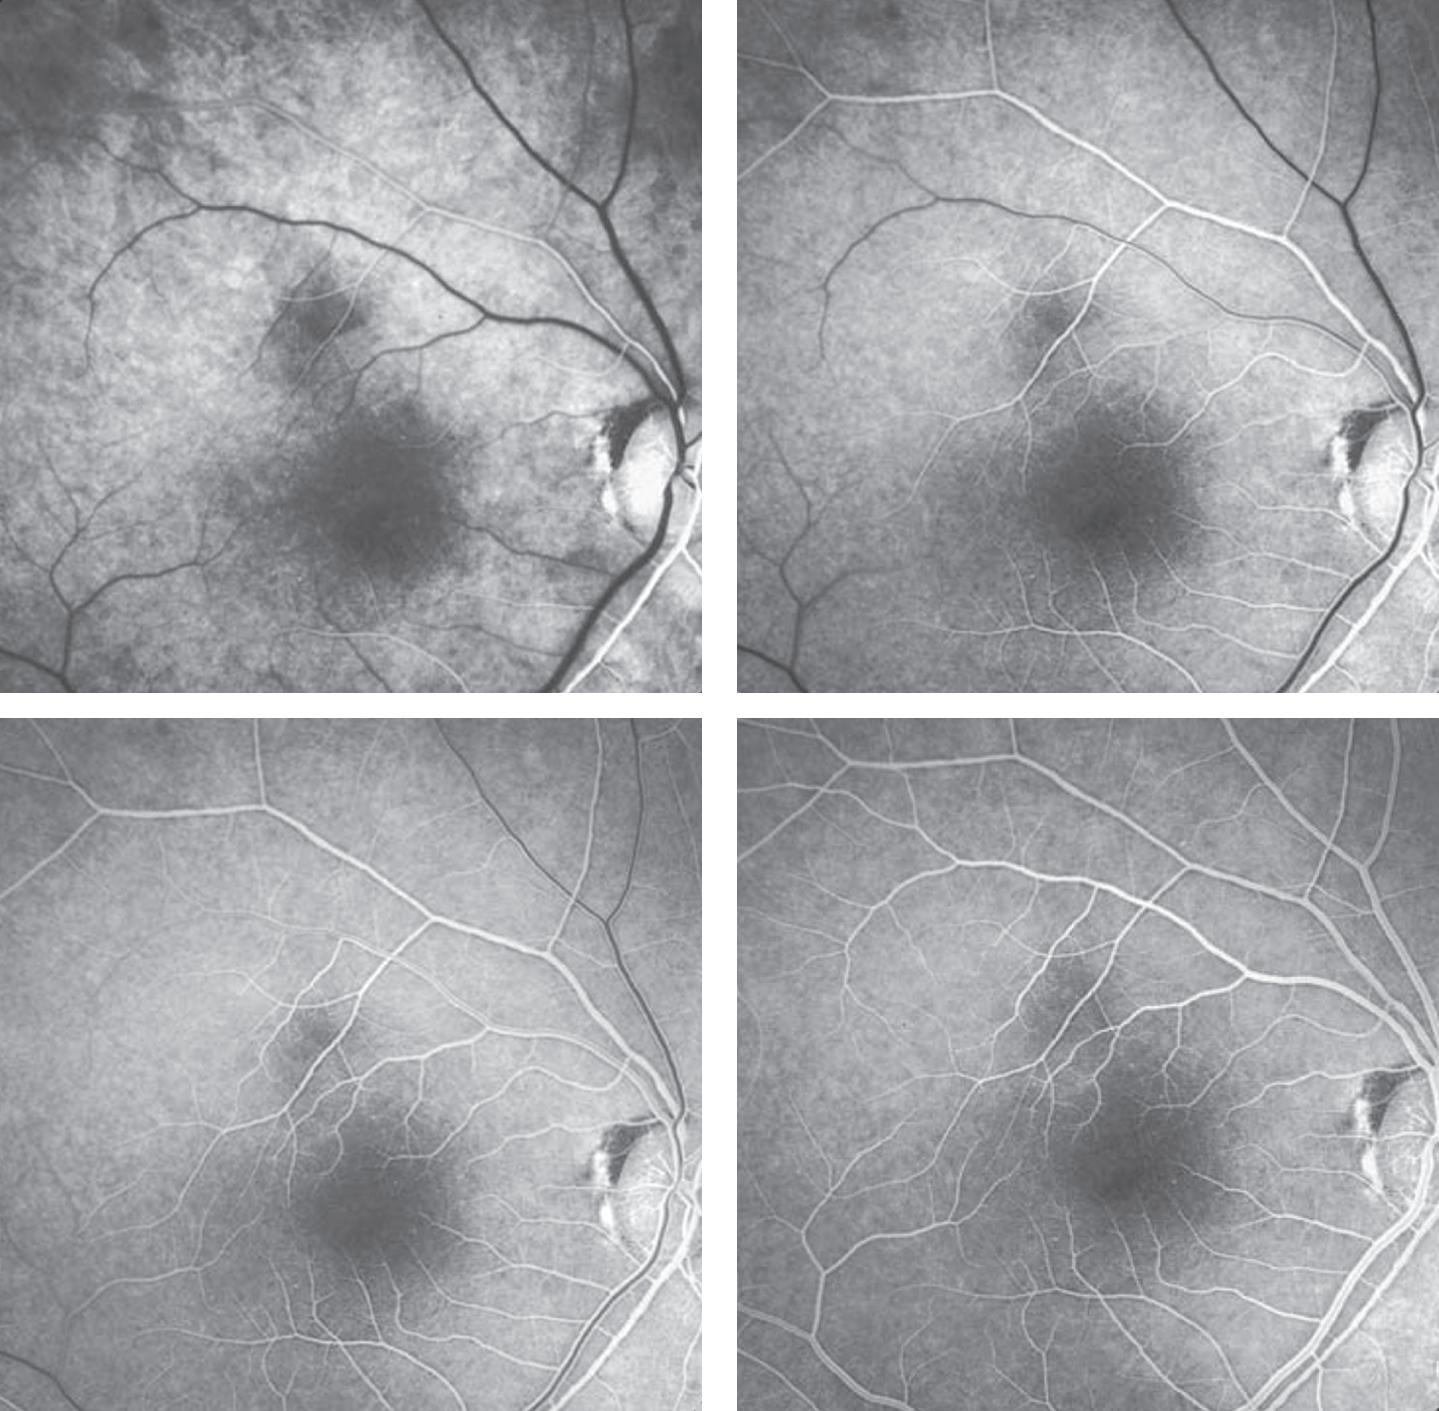
◾ Phases of the angiogram: (a) choroidal, (b) arterial, (c) arteriovenous, (d) venous, (e) late (elimination) (Fig. 1.13A-D).
◾ Hyperfluorescence: (a) transmission (window) defect caused by atrophy or absence of the RPE, e.g. atrophic AMD, (b) pooling of dye because of break-down of the outer blood–retinal barrier, e.g. central serous retinopathy, pigment epithelial detachment, (c) leakage of dye from abnormal vessels, e.g. choroidal neovascular membrane (CNV), breakdown of the inner blood–retinal barrier, e.g. cystoid macular oedema or retinal neovascularization, e.g. proliferative diabetic retinopathy, (d) staining of tissue, e.g. drusen.
Fig. 1.13 Fluorescein angiography: (A) arterial phase showing filling of the choroid and retinal arteries, (B) arteriovenous phase showing complete arterial filling and early laminar venous flow, (C) early venous phase showing marked laminar venous flow, (D) mid-venous phase showing almost complete venous filling. (From Salmon JF, Kanski’s Clinical Ophthalmology: A Systematic Approach, 9th edition. Oxford, UK: Elsevier; 2020.)
A
B
C
D
◾ Hypofluorescence: (a) blockage of retinal fluorescence, e.g. retinal haemorrhage, (b) blockage of background choroidal fluorescence, e.g. subretinal or sub-RPE blood, increased RPE density, choroidal lesions, (c) filling defects, e.g. vascular occlusion, loss of capillary bed.
INDOCYANINE GREEN ANGIOGRAPHY (ICG)
This is of value when studying the choroidal circulation and is a useful adjunct to FA.
Particular indications include: (a) occult CNV, (b) CNV associated with pigment epithelial detachment, (c) recurrent CNV adjacent to a laser scar, (d) identification of feeder vessels, (e) polypoidal choroidal vasculopathy, (f) chronic central serous retinopathy, (g) breaks in Bruch membrane.
◾ ICG binding: about 98% of ICG molecules bind to serum proteins on entering the circulation. This phenomenon reduces the passage of ICG through the fenestrations of the choriocapillaris.
◾ Adverse effects: (a) should not be used in patients who are allergic to iodine or who are pregnant, (b) staining of stools, (c) nausea and vomiting, (d) sneezing, (e) pruritis, (f) rarely: skin eruptions, pyrexia, backache, skin necrosis at the injection site.
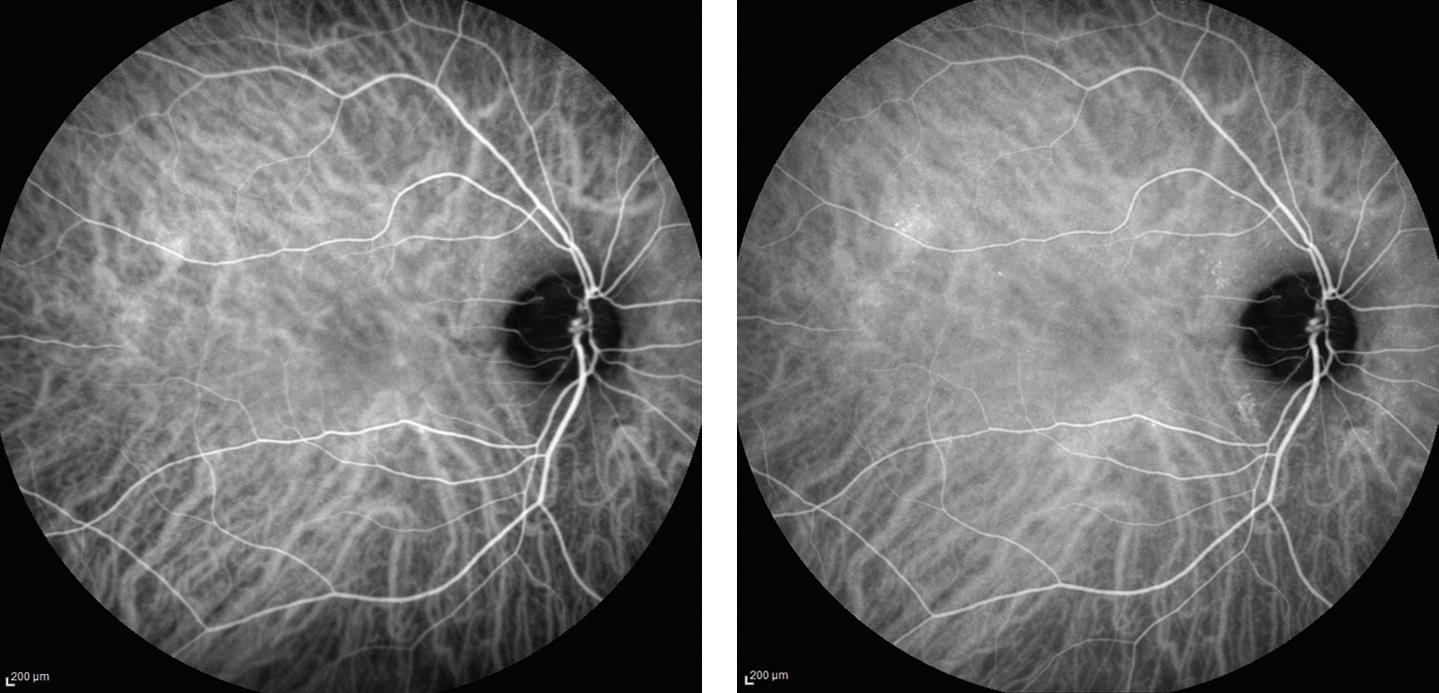
◾ Phases of the angiogram: (a) early phase, (b) early mid-phase, (c) late mid-phase, (d) late phase (Fig. 1.14A and B).
◾ Hyperfluorescence: (a) RPE window defect, (b) leakage from the retinal or choroidal circulations or optic nerve head, (c) abnormal blood vessels and polyps.
◾ Hypofluorescence: (a) blockage by blood, pigment or exudate, (b) obstruction of the circulation, (c) loss of vascular tissue, (d) pigment epithelial detachment.
Fig. 1.14 Indocyanine green angiography: (A) early mid-phase (1–3 minutes) showing prominence of choroidal and retinal vessels, (B) late mid-phase (3–15 minutes) showing fading of choroidal vessels and diffuse tissue staining. (From Salmon JF, Kanski’s Clinical Ophthalmology: A Systematic Approach, 9th edition. Oxford, UK: Elsevier; 2020.)
Eyelids
CHAPTER OUTLINE
Benign Nodules and Cysts 16
Chalazion (meibomian cyst) 16
Miscellaneous 17
Benign Tumours 18
Squamous cell papilloma 18
Basal cell papilloma (seborrhoeic keratosis) 19
Actinic (solar, senile) keratosis 19
Congenital melanocytic naevus 19
Acquired melanocytic naevus 19
Capillary haemangioma (strawberry naevus) 19
Port-wine stain (naevus flammeus) 20
Xanthelasma 21
Neurofibroma 22
Malignant Tumours 22
Rare predisposing conditions 22
Basal cell carcinoma (BCC) 22
Squamous cell carcinoma (SCC) 23
Keratoacanthoma 25
Sebaceous gland carcinoma 25
Malignant melanoma 26
Principles of surgical treatment 26
Disorders of Eyelashes 27
Trichiasis 27
Congenital distichiasis 28
Acquired distichiasis (metaplastic lashes) 28
Eyelash ptosis 28
Trichomegaly 28
Madarosis 29
Poliosis 30
Allergic Disorders 30
Acute allergic oedema 30
Contact dermatitis 30
Atopic dermatitis (eczema) 30
Viral Infections 32
Molluscum contagiosum 32
Herpes zoster ophthalmicus 32
Herpes simplex 33
Chronic Blepharitis 34
Chronic marginal blepharitis 34
Phthiriasis palpebrarum 36
Ptosis 36
Simple congenital ptosis 37
Involutional ptosis 39
Ectropion 40
Involutional ectropion 40
Cicatricial ectropion 40
Paralytic ectropion 40
Entropion 40
Involutional entropion 40
Cicatricial entropion 42
Miscellaneous Acquired Disorders 43
Blepharochalasis 43
Floppy eyelid syndrome 43
Cosmetic Eyelid and Periocular Surgery 44
Nonsurgical cosmetic techniques 44
Surgical cosmetic techniques 44
Congenital Malformations 44
Epicanthus 44
Telecanthus 44
Epiblepharon 45
Blepharophimosis, ptosis and epicanthus inversus syndrome 46
Coloboma 46
Cryptophthalmos 46
Ankyloblepharon filiforme adnatum 46
Benign Nodules and Cysts
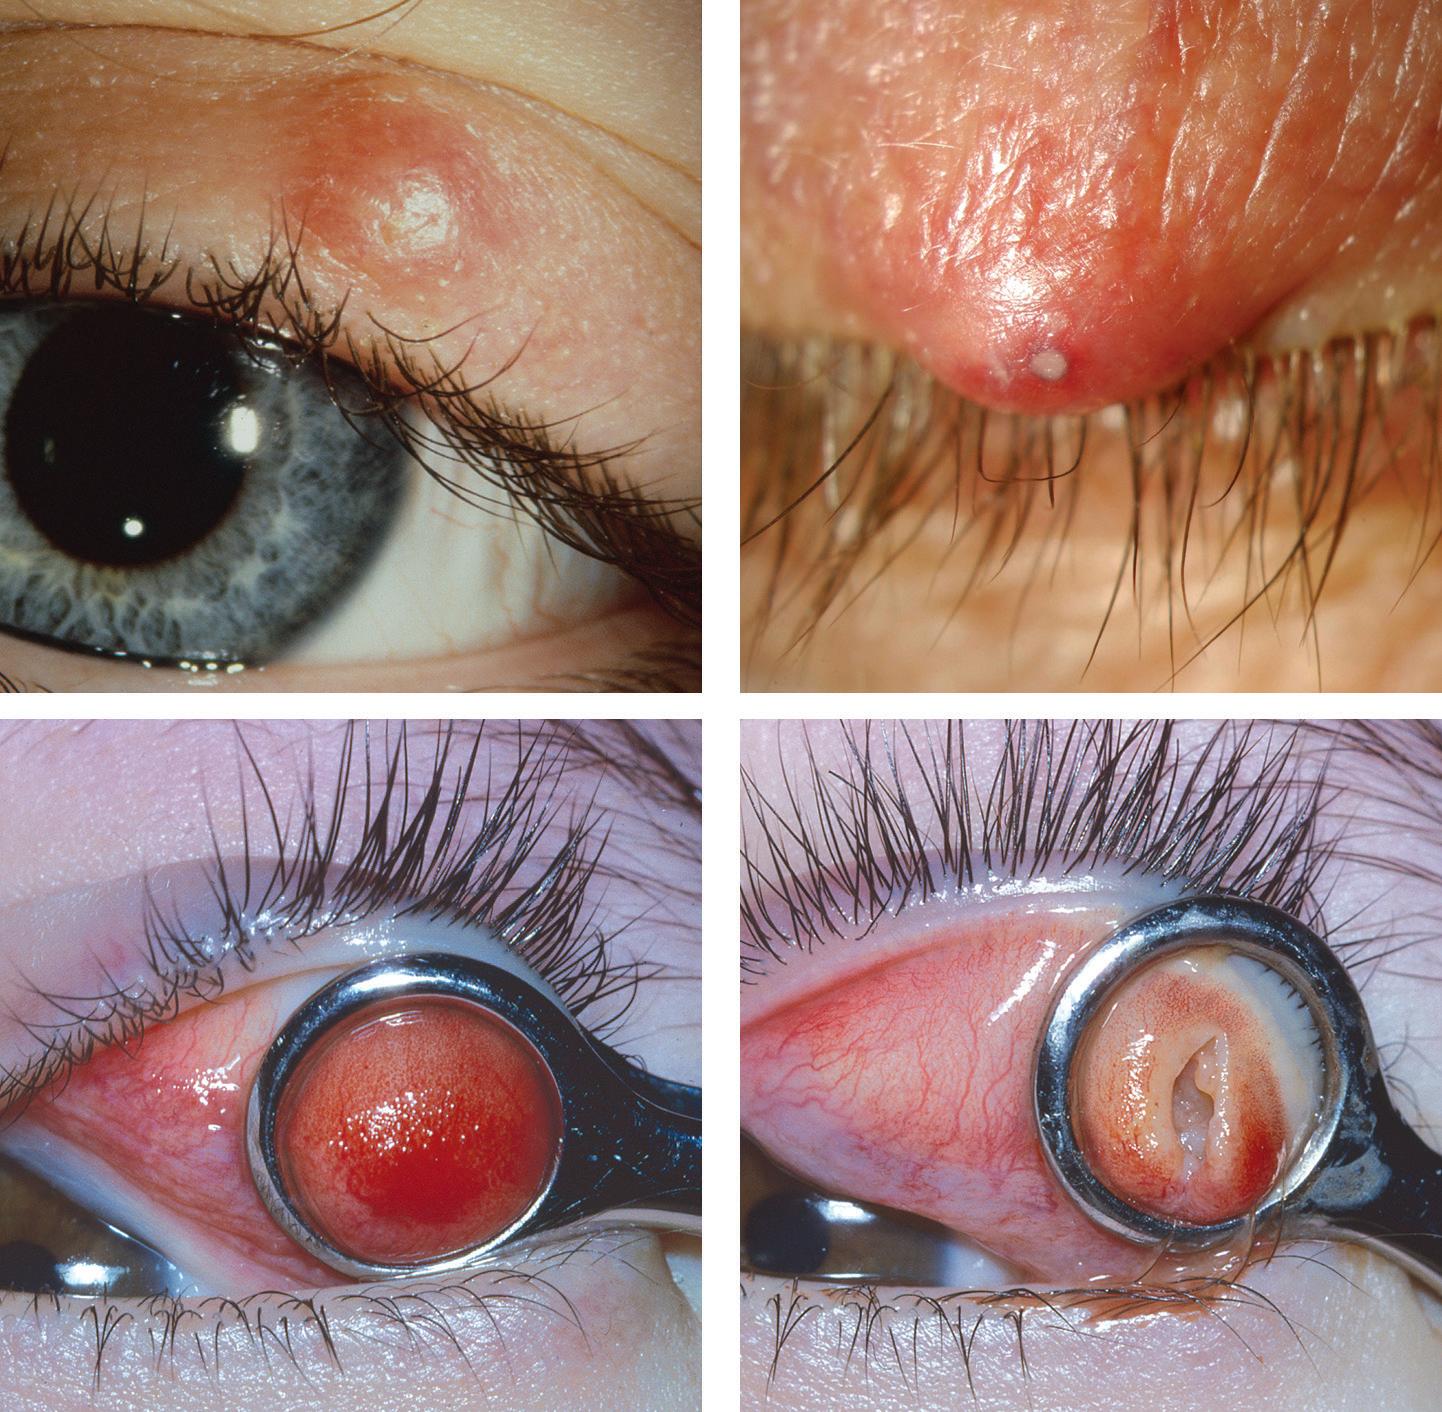
CHALAZION (MEIBOMIAN CYST)
Definition:
very common chronic sterile inflammation of a meibomian gland that may resolve spontaneously.
◾ Associations: (a) meibomian gland dysfunction, (b) rosacea, (c) seborrhoeic dermatitis, (d) use of bortezomib, used in the treatment of myeloma.
Fig. 2.1 Meibomian cyst: (A) tarsal nodule, (B) superimposed bacterial infection, (C) conjunctival view of cyst with clamp in position, (D) after curettage. (From Salmon JF, Kanski’s Clinical Ophthalmology: A Systematic Approach, 9th edition. Oxford, UK: Elsevier; 2020.)
A B
C D
Treatment:
(a) incision and curettage (Fig. 2.1C and D), (b) local steroid injection (0.2–1 ml of 5 mg/ml triamcinolone diacetate), (c) prophylactic systemic tetracycline in severe recurrent disease.
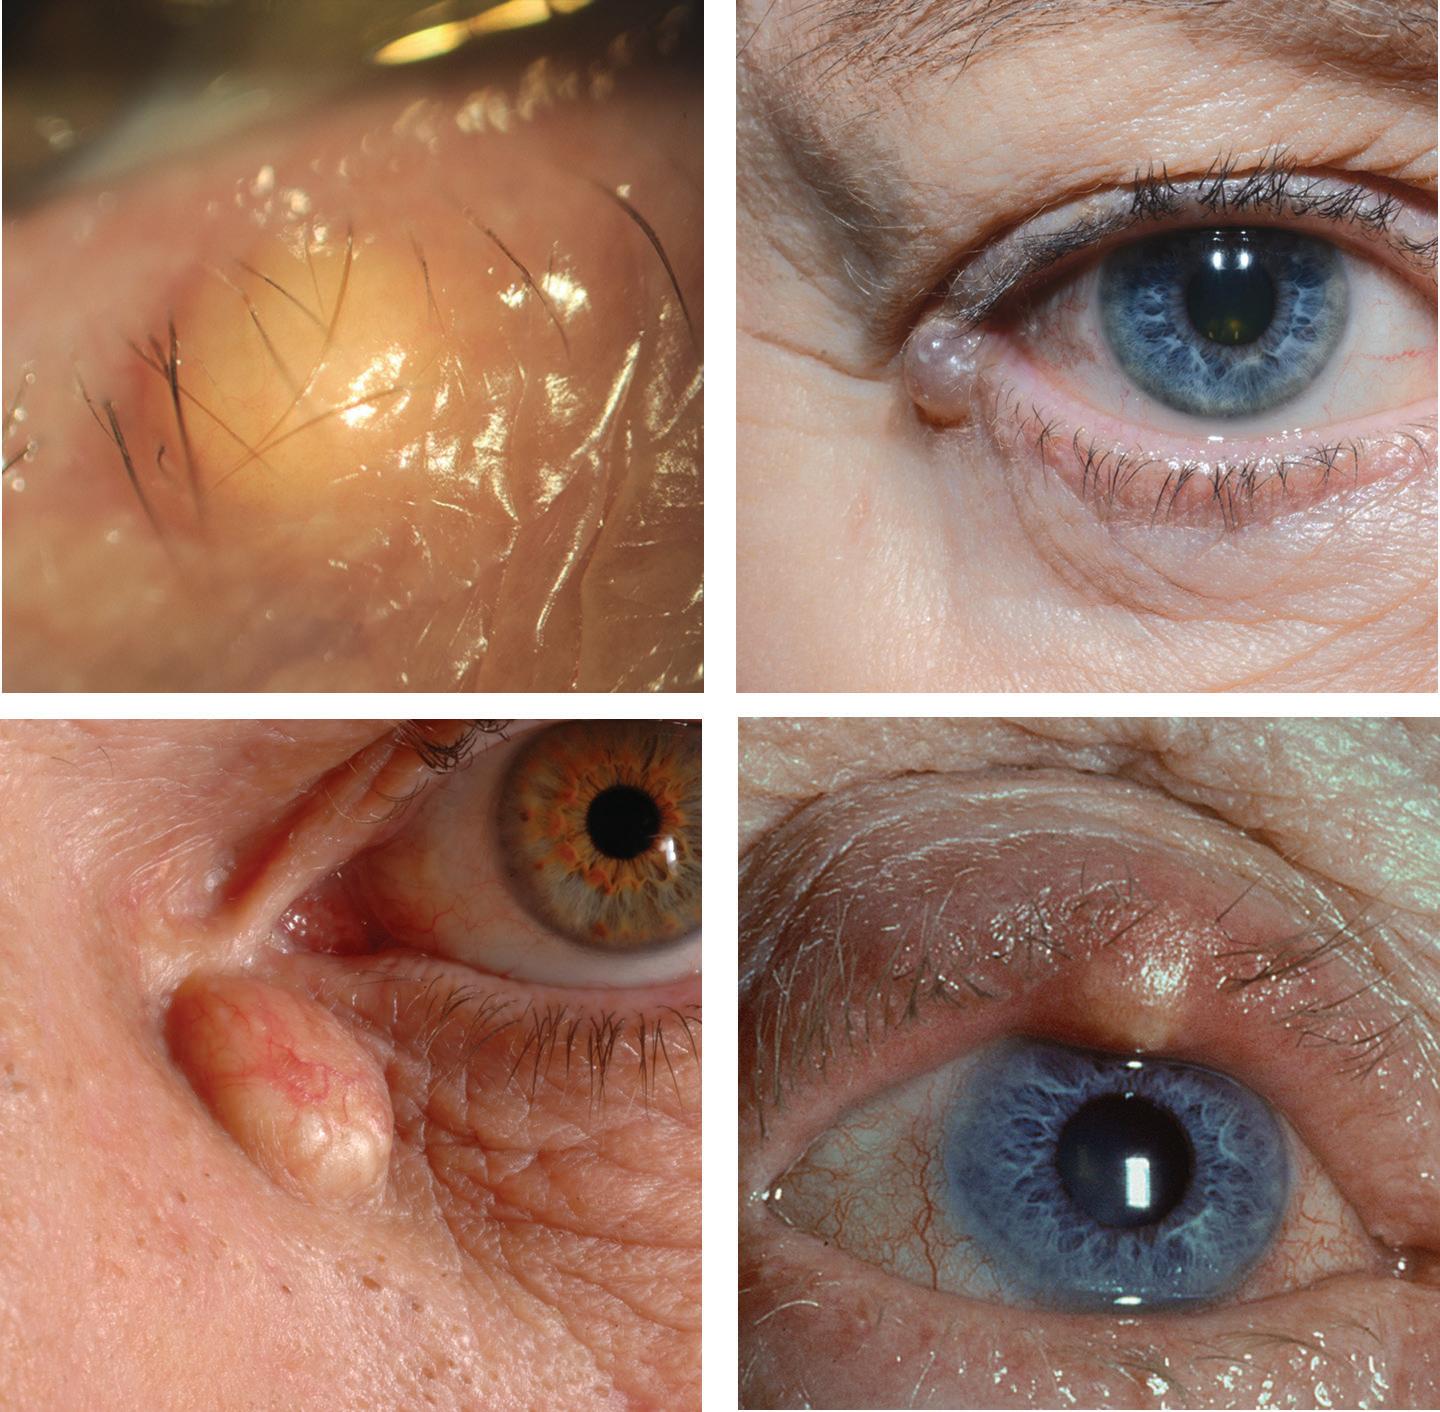
MISCELLANEOUS
◾ Cyst of Zeis: nontranslucent cyst on the anterior lid margin arising from an obstructed sebaceous gland associated with a lash follicle (Fig. 2.2A).
◾ Cyst of Moll: translucent, fluid-filled retention cyst on the anterior lid margin (Fig. 2.2B) arising from an apocrine gland.
◾ Epidermal inclusion cyst: slow-growing, firm, round lesion containing keratin; located away from the lid margin. Caused by implantation of epidermis into dermis following trauma or surgery.
◾ Sebaceous (pilar) cyst: may occasionally occur at the medial canthus (Fig. 2.2C).